Article

Spatial Distribution of Global Cultivated Land and Its Variation between 2000 and 2010, from Both Agro-Ecological and Geopolitical Perspectives

1
School of Geography, Nanjing Normal University, Nanjing 210023, China
2
State Key Laboratory Cultivation Base of Geographical Environment Evolution, Nanjing Normal University, Nanjing 210023, China
3
Jiangsu Center for Collaborative Innovation in Geographical Information Resource Development and Application, Nanjing Normal University, Nanjing 210023, China
*
Author to whom correspondence should be addressed.
Sustainability 2019, 11(5), 1242; https://doi.org/10.3390/su11051242
Submission received: 30 December 2018 / Revised: 21 February 2019 / Accepted: 22 February 2019 / Published: 26 February 2019

Abstract

:
Food security requires a thorough understanding of the spatial characteristics of cultivated land changes on a global scale. In particular, the spatial heterogeneity of global cultivated land changes needs to be evaluated with high spatial resolution data. This study aims to analyse the spatial distribution of global cultivated land and the characteristics of its variation, by using GlobeLand30 data for 2000 and 2010 with a 30-m spatial resolution. The cultivated land percentage and rate of cultivated land use change are calculated based on 18 agro-ecological zones (AEZs), 32 geopolitical and socioeconomic regions, and 283 world regions. The results show that (1) more cultivated land is located in regions under a temperate climate and moderate moisture conditions; (2) the percentage of cultivated land is related to the gross domestic product (GDP) and population, while increases and decreases in cultivated land are related to the rural population, policy encouragement, urbanization, and economic development; and (3) the percentage of cultivated land and rate of land use change within an AEZ vary greatly due to the different socioeconomic conditions, and the values within a geopolitical area also vary, due to different natural conditions.

1. Introduction

As the global population rises and the demand for foods grows, food security remains a widespread and serious problem, and this problem could increase in uncertain and changing climates [1]. Agricultural activities are challenged by measures implemented to increase food demands in a sustainable manner [2,3]. Similar to urbanization, agricultural activities also cause a series of ecological consequences related to land use [4]. For example, agriculture is appropriately recognized as a considerable source of greenhouse gas emissions [5,6]. Although agricultural production must be increased to meet the growing demands for food, it may increase greenhouse gas emissions [7,8,9]. When humans use land resources to meet survival needs via agricultural activities, land surfaces, such as forests, grasslands, and savannas, are used as cultivated land. Thus far, nearly 40% of the global ice-free land is used for agriculture [10,11,12]. Cultivated land change is critical in the context of land use changes for sustainable development [13,14,15,16,17,18]. Analysis on the spatial distribution of cultivated land and its spatial variation throughout the world is helpful for understanding and solving the food security problem [19,20,21].
Many studies have been conducted on cultivated land changes at the regional and global scale, with different spatial and temporal resolutions [22,23]. At the regional and national scales, the spatial resolutions of land use maps have been improved to analyse cultivated land changes. Land use maps with 1-km spatial resolution were applied to evaluate the spatial patterns of agricultural lands in Brazil [24], China [25], and Europe [26]. Land use maps with 30-m resolution were developed to analyse cropland expansion in the Usangu Catchment [27], east-central Iowa [28], northern Ghana [29], the Kabul River Basin [30], and Nigeria [31]. These studies show that there are significant differences in land use within a region or a country, and that high-resolution land use maps are helpful when analysing the spatial heterogeneity of cultivated land changes.
At the global scale, Ramankutty et al. created global 10-km resolution cropland datasets in the early 1990s [32,33] and circa 2000 [22,34] by combining a remote sensing dataset with agricultural inventory data. Moreover, the distribution of agricultural land has been discussed based on 14 geopolitical regions of the world, by using a 10-km spatial resolution dataset [34]. The agroclimatic patterns of global croplands in 2000 were represented by stratifying the cropland areas in three regions (temperate, subtropical, and tropical) into lower-income and upper-income geopolitical groups [35]. The global distribution of 18 major crops was analysed using 10-km spatial resolution datasets [36]. The spatial patterns of global cultivated land changes from 1982 to 2011 were analysed at 0.05° × 0.05° (more or less 5 km x 5 km at the equator) resolution [37]. In addition, several studies have revealed the both biophysical and human-related driving forces underlying changes in global agricultural land use [38,39].
Although many studies have evaluated the spatial distribution of global cultivated land using a 10-km spatial resolution dataset, few studies have focused on the spatial heterogeneity of global cropland changes with high spatial resolution datasets. In fact, there are significant spatial differences in agricultural performance at the global scale, and agricultural yields are affected by natural factors like climate, insect pests, and moisture [35]. Meanwhile, political, social, and economic factors also play important roles in the selection of agricultural production by farmers and other decision-makers [35]. A complete view of global cultivated land changes from both agro-ecological and geopolitical perspectives is crucial for analysing the spatial heterogeneity of cultivated land changes.
The goal of this paper is to analyse the spatial distribution of global cultivated land in 2010 and its spatial variation characteristics between 2000 and 2010 from both agro-ecological and geopolitical perspectives, by using land use maps with 30-m spatial resolution. Three spatial aggregations of global terrestrial land are conducted in this study: (1) from an agro-ecological perspective, the spatial patterns are discussed based on 18 global agro-ecological zones (AEZs) that consider the climate zone and moisture regime; (2) from a geopolitical perspective, the spatial patterns are discussed based on the spatial aggregation of 32 geopolitical and socioeconomic regions; and (3) by intersecting the 18 AEZs with the 32 geopolitical and socioeconomic regions, the spatial patterns are discussed based on 283 world regions. The three levels of spatial aggregation analyses are conducted to describe the spatial heterogeneity of global cultivated land changes.
The remainder of this paper is organized into the following sections. Section 2 describes the data sources, and then describes the cultivated land percentage and rate of land use change, which are indexes used to assess the spatial distribution of global cultivated land and its spatial variation characteristics. Section 3 presents the basic spatial and the spatial aggregation analysis based on 18 AEZs, 32 geopolitical and socioeconomic regions, and 283 world regions. Finally, Section 4 draws conclusions and considers future areas of research.

2. Materials and Methods

2.1. Land Cover Dataset

Currently, the resolution of the global land cover data products that have been released and made available for public use has been greatly improved [40,41,42]. In this paper, GlobeLand30 data from 2000 and 2010 are used as the data source for analysing the spatial distribution of global cultivated land and its spatial variation characteristics. GlobeLand30 is the first 30-m resolution global land cover dataset developed by the national geomatics centre of China. GlobeLand30 covers the global land areas for latitudes from 80° N to 80° S, and it is freely and publicly available for download (http://globallandcover.com/home). GlobeLand30 data are in the UTM-WGS84 coordinate system. In this study, to generate accurate statistical area, GlobeLand30 is redefined as the World Goode Homolosine Land map projection, which is a discontinuous, pseudo-cylindrical, equal-area projection that is usually used for world maps. Multispectral images are utilized for GlobeLand30 classifications, such as images from Landsat Thematic Mapper (TM) of Landsat 5 and Enhanced Thematic Mapper (ETM+) of Landsat 7, as well as the Huan Jing (HJ-1) satellite [40].
The GlobeLand30 product contains ten major classes (in Figure 1): forest, cultivated land, grassland, water bodies, shrubland, artificial surfaces, wetland, permanent snow and ice, tundra, and bare land. The total classification accuracy is 83.5%, and the accuracy of cultivated land classification reaches 83.06% [40]. Among the different classes, cultivated land represents the surface covering for the production of food and fibre through sowing and farming. Specifically, the cultivated land in the study includes the following: (1) new cultivated wasteland, fallow land, rotation fallow land, and rotation land between grassland and cropland; (2) land mainly planted with crops and containing a few fruit trees and other trees; and (3) bottomland and mudflats that were cultivated for more than three years [40,41].

2.2. Cultivated Land Percentage

The cultivated land percentage indicates the proportion of cultivated land in the total land area of the designated region [42]. The higher the cultivated land percentage is in a region, the larger the area of cultivated land. The distribution can occur over a large cultivated area and be concentrated in big patches, or over a small cultivated area and concentrated in many small patches and other situations. The formula for calculating the cultivated land percentage is shown as follows:
P = A c A a × 100
where P denotes the cultivated land percentage, A c is the area of cultivated land in a region, and A a is the total area of the same region.

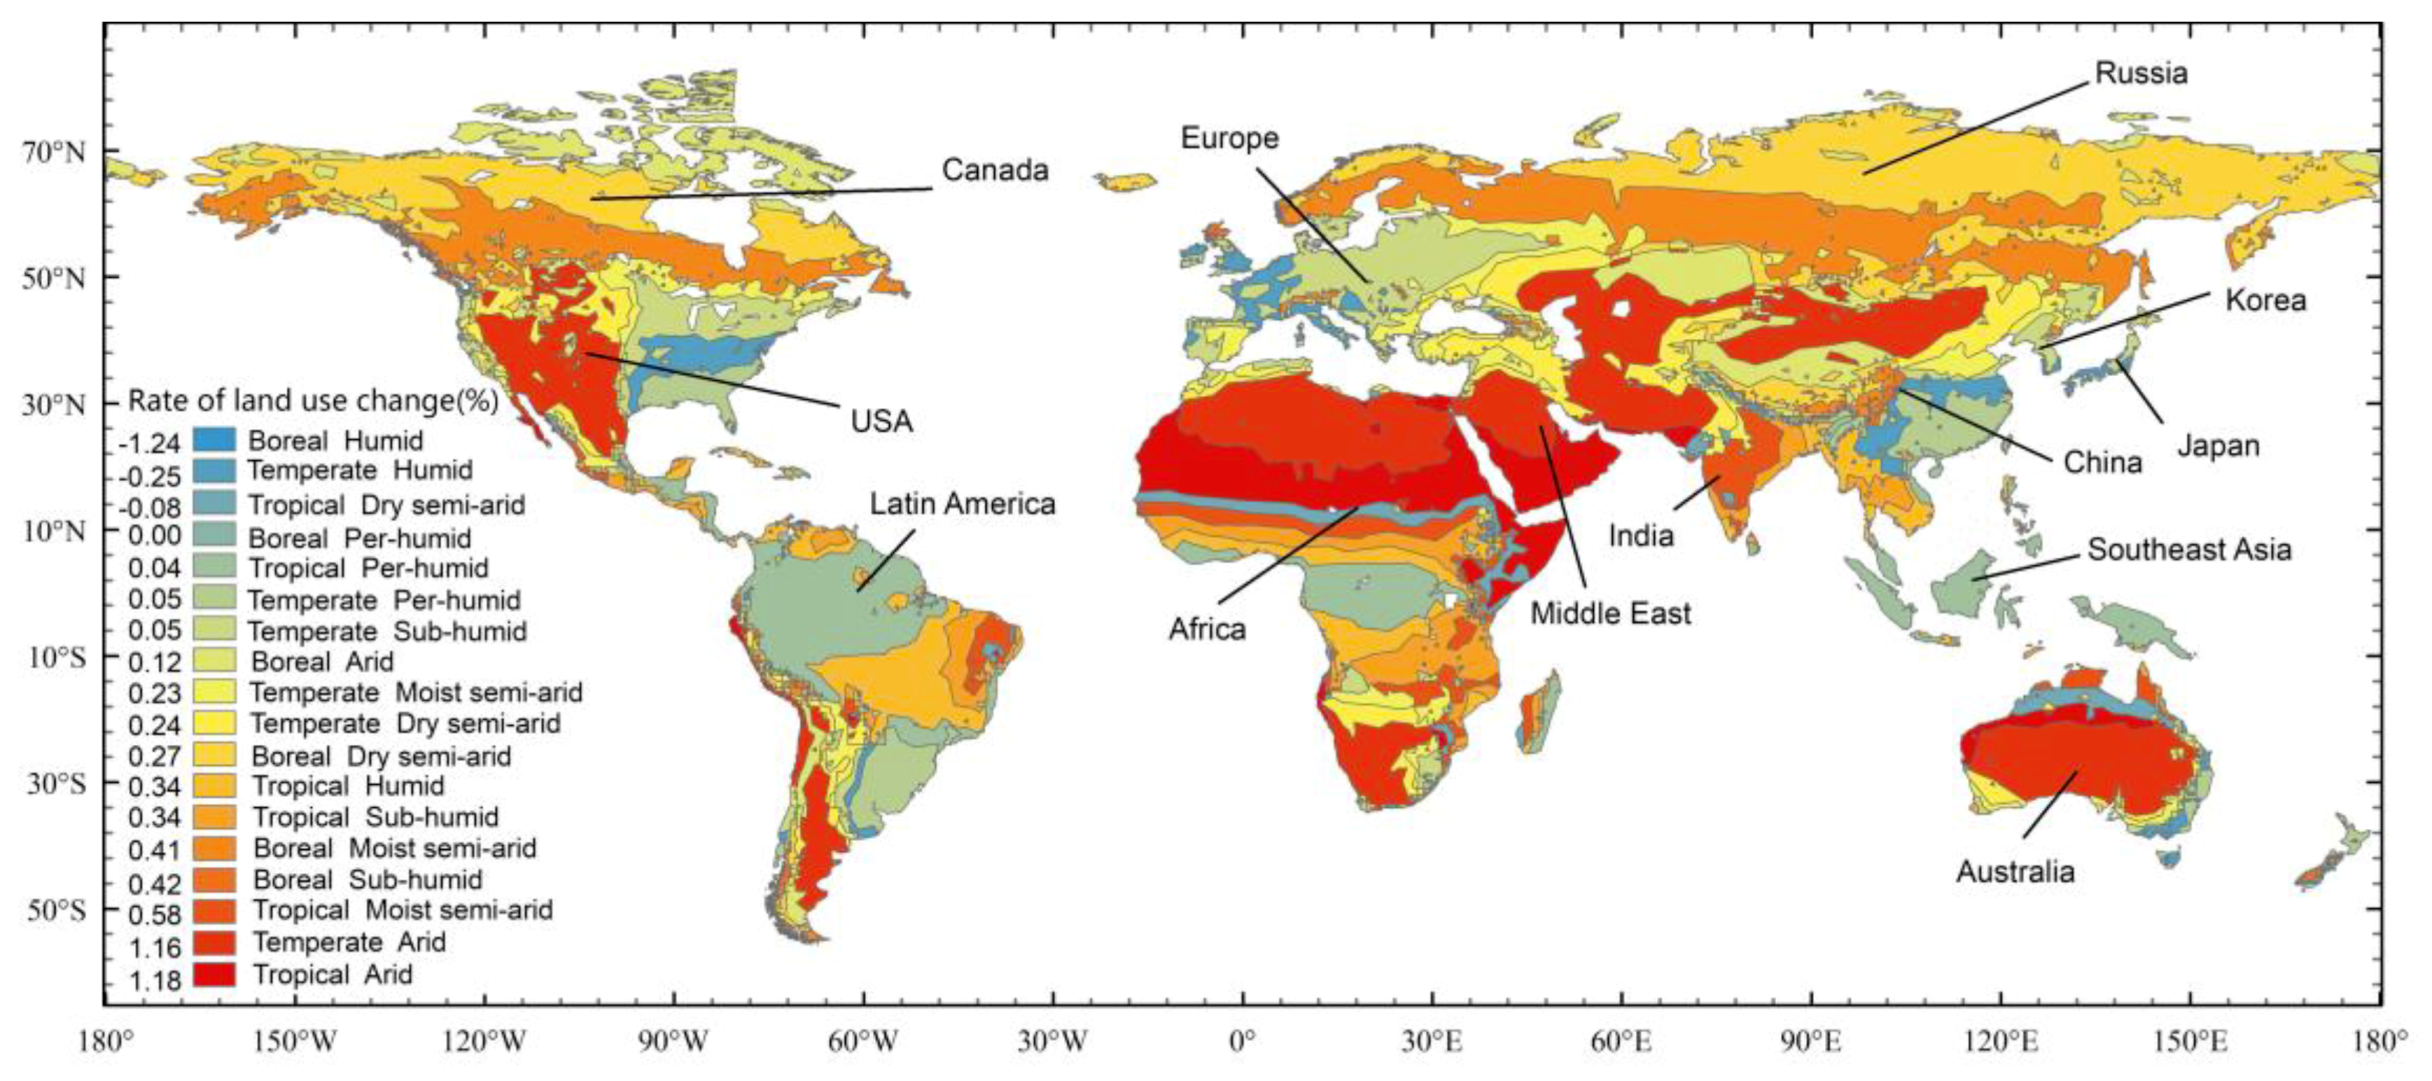
2.3. Rate of Land Use Change

The rate of land use change is usually used to describe the overall trend of land use change during a study period [43]. Assuming that the average rate of land use change is used to reflect the overall trend of cultivated land change during the ten years, then the rate of land use change is calculated by the following formula:
D = A t 1 A t 0 A t 0 × 1 T × 100
where D denotes the rate of land use change for cultivated land during the study period; A t 0 and A t 1 are the areas of cultivated land in the initial and final years, respectively; and T is the time between the initial and final year.

3. Spatial Analysis and Results

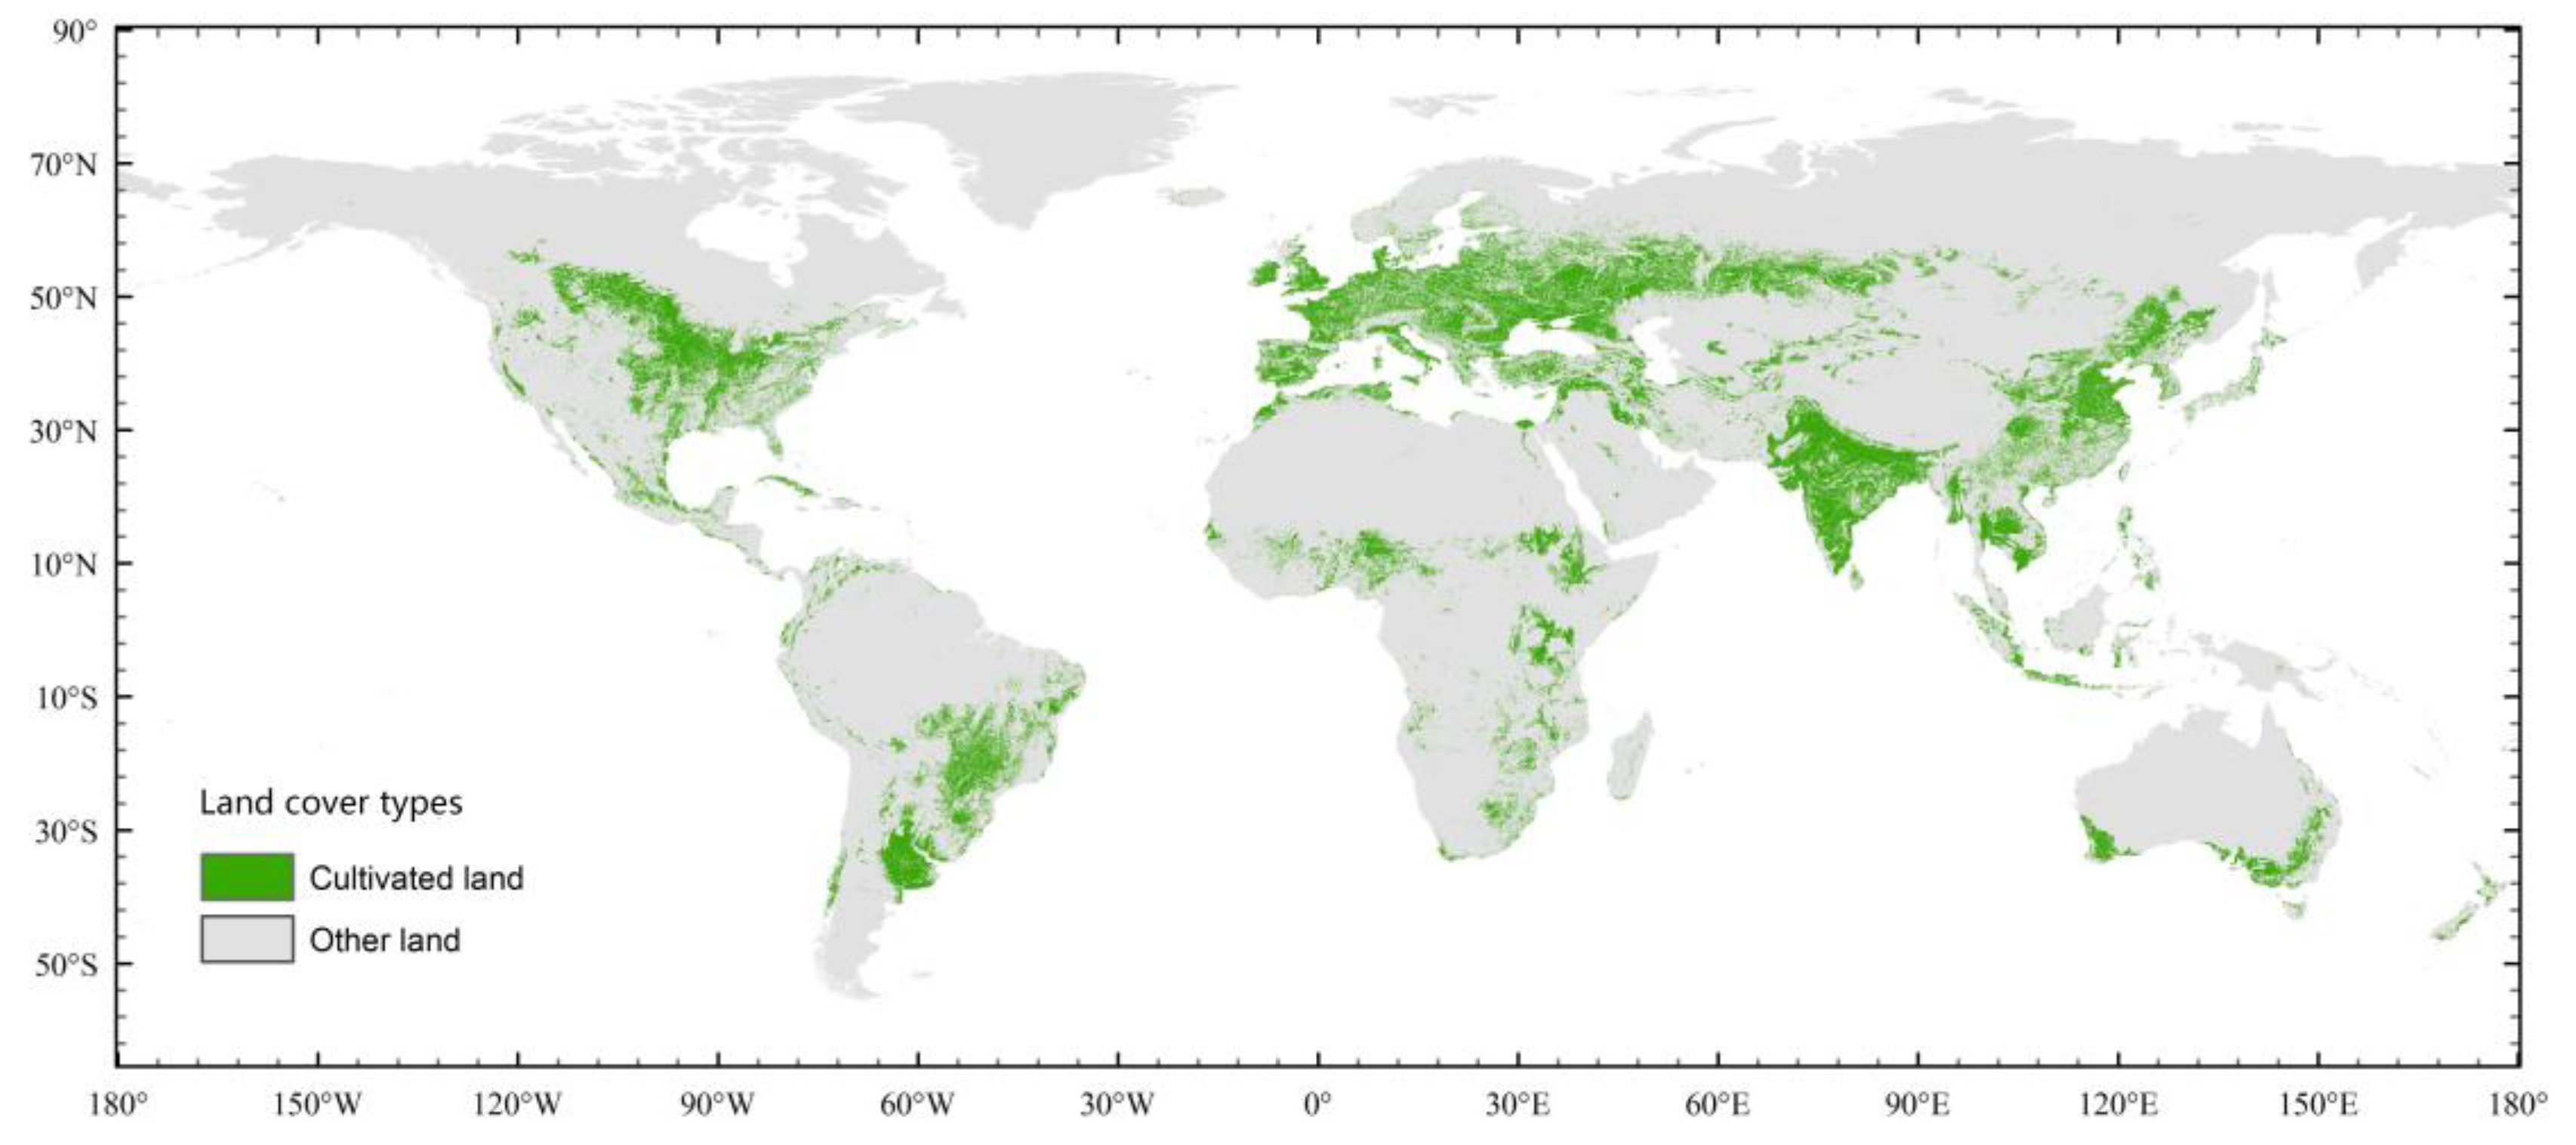
3.1. Basic Spatial Analysis

Approximately 18.91 and 19.31 million km2 of cultivated land was observed in 2000 and 2010, which represent approximately 13.98% and 14.29% of the global land area, respectively (in Table 1). Overall, the cultivated land area increased by 0.40 million km2, or 0.31% of the world land area, from 2000 to 2010. The geographic distribution of global cultivated land in 2010 was characterized by high concentrations in certain areas, such as Asia, Europe, and America, as shown in green in Figure 2. The distribution of cultivated land by continents in 2010 is shown in Table 2.

3.2. Spatial Aggregation Analysis

The cultivated land percentage and its change rate are calculated based on three spatial aggregations in the global integrated assessment model (GCAM), which is beneficial for identifying the interactions between land use and land cover, social economy, and climate change [44,45]. The three spatial aggregations of global terrestrial land (without some small islands) in GCAM (http://www.globalchange.umd.edu/gcam) include 18 AEZs, 32 geopolitical and socioeconomic regions, and 283 world regions. Under the assumption that climatic and socioeconomic changes are drivers of land cover changes, we attempt to explore some climatic and socioeconomic variables to explain the changes in cultivated land. We wrote python code using arcpy in ArcGIS to statistically analyse the cultivated land percentage and its change rate for each geographic zone, according to Equations (1) and (2).

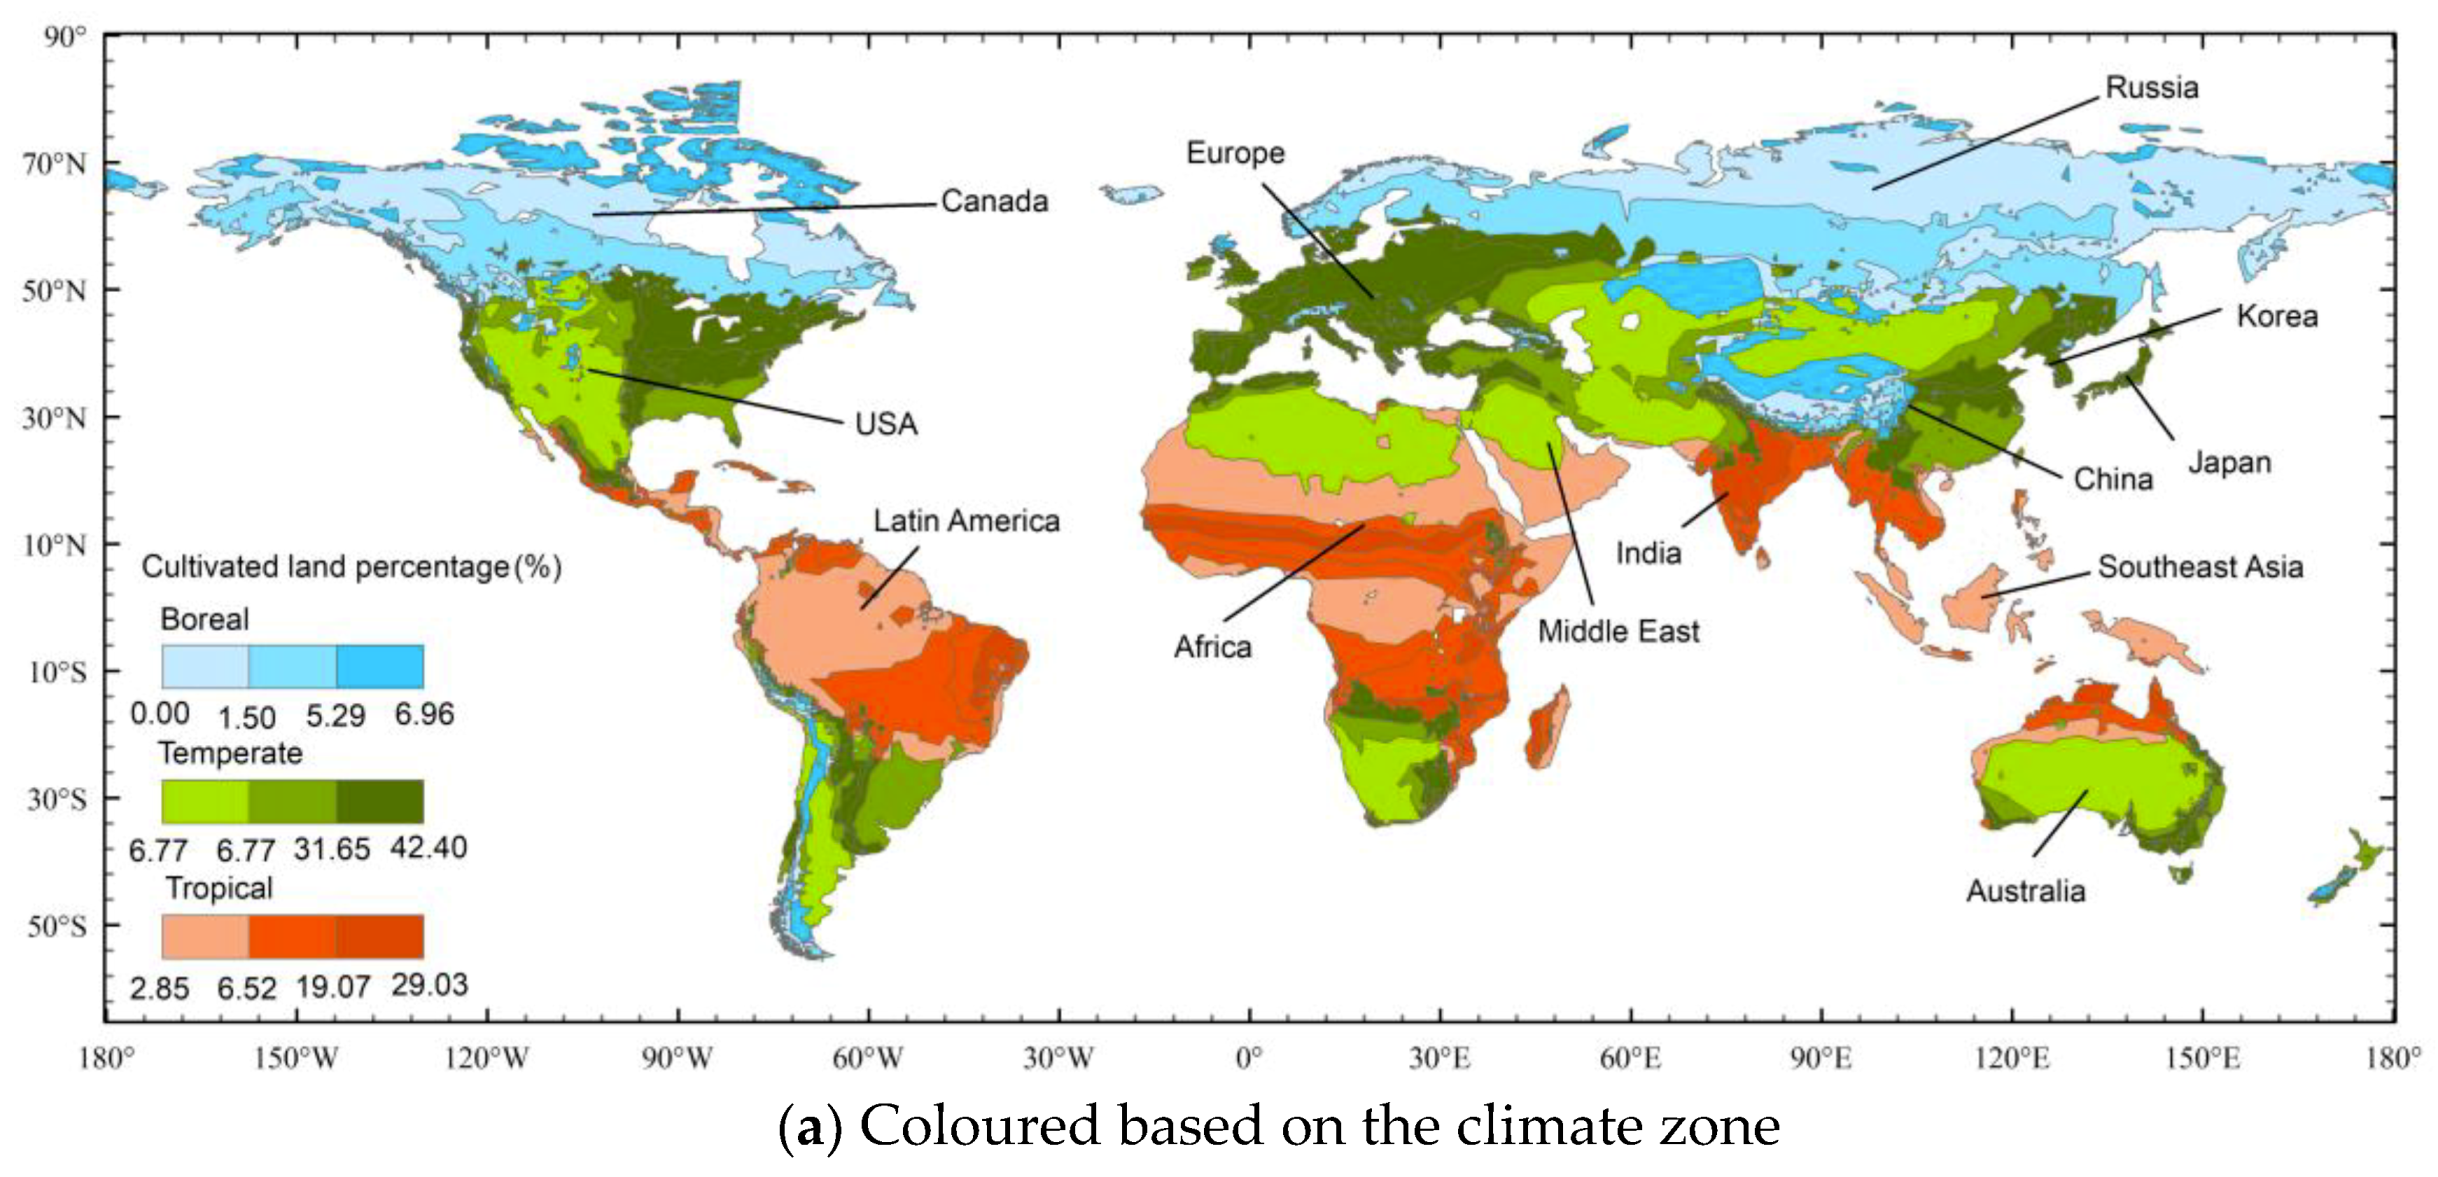
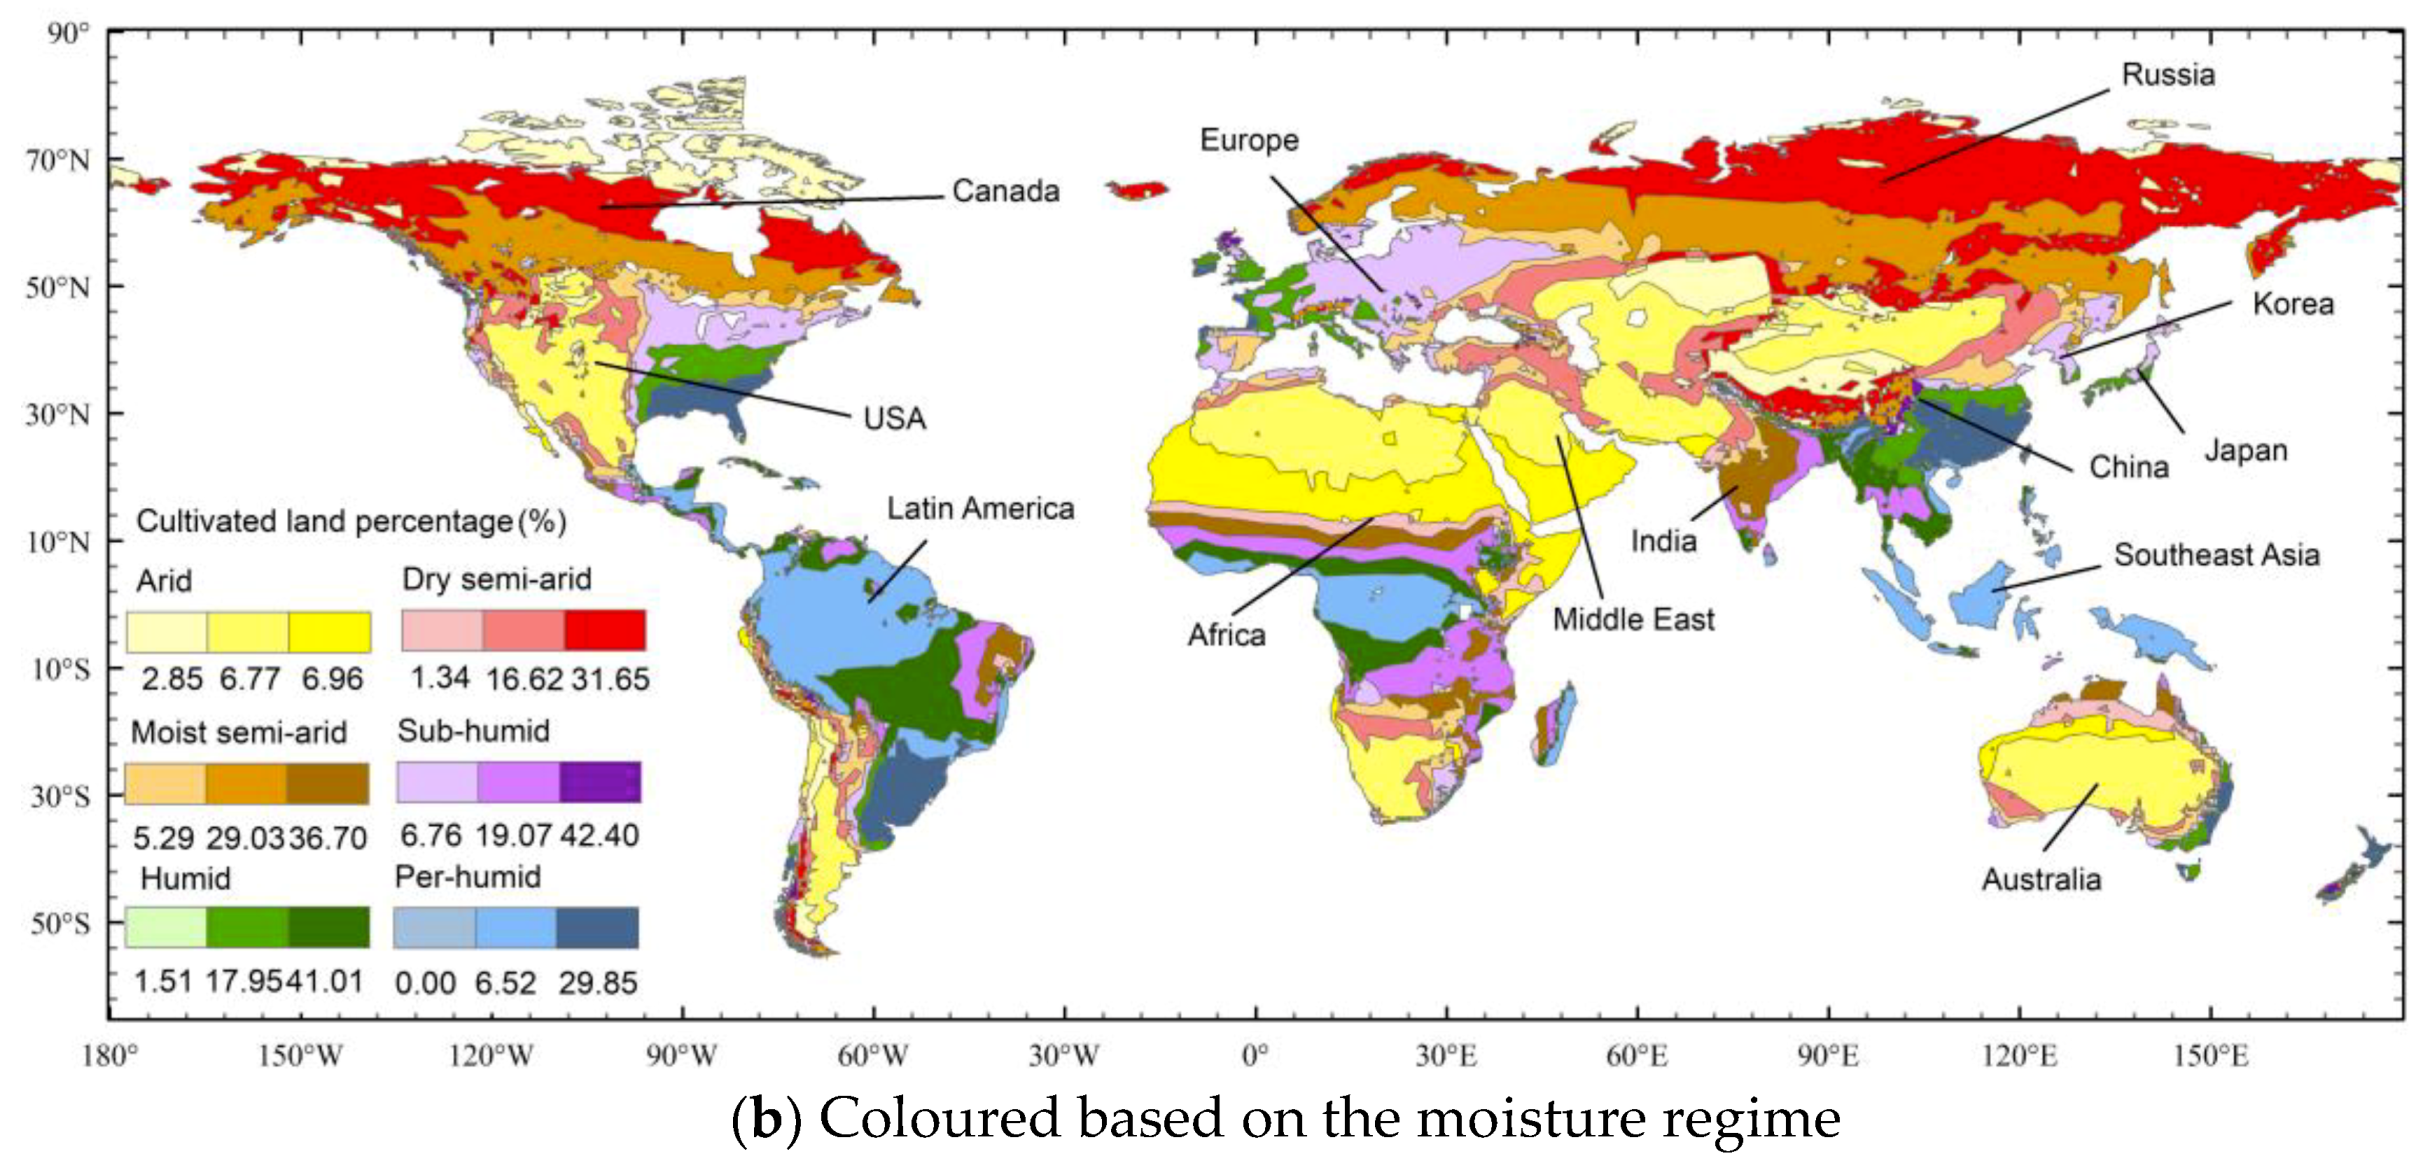
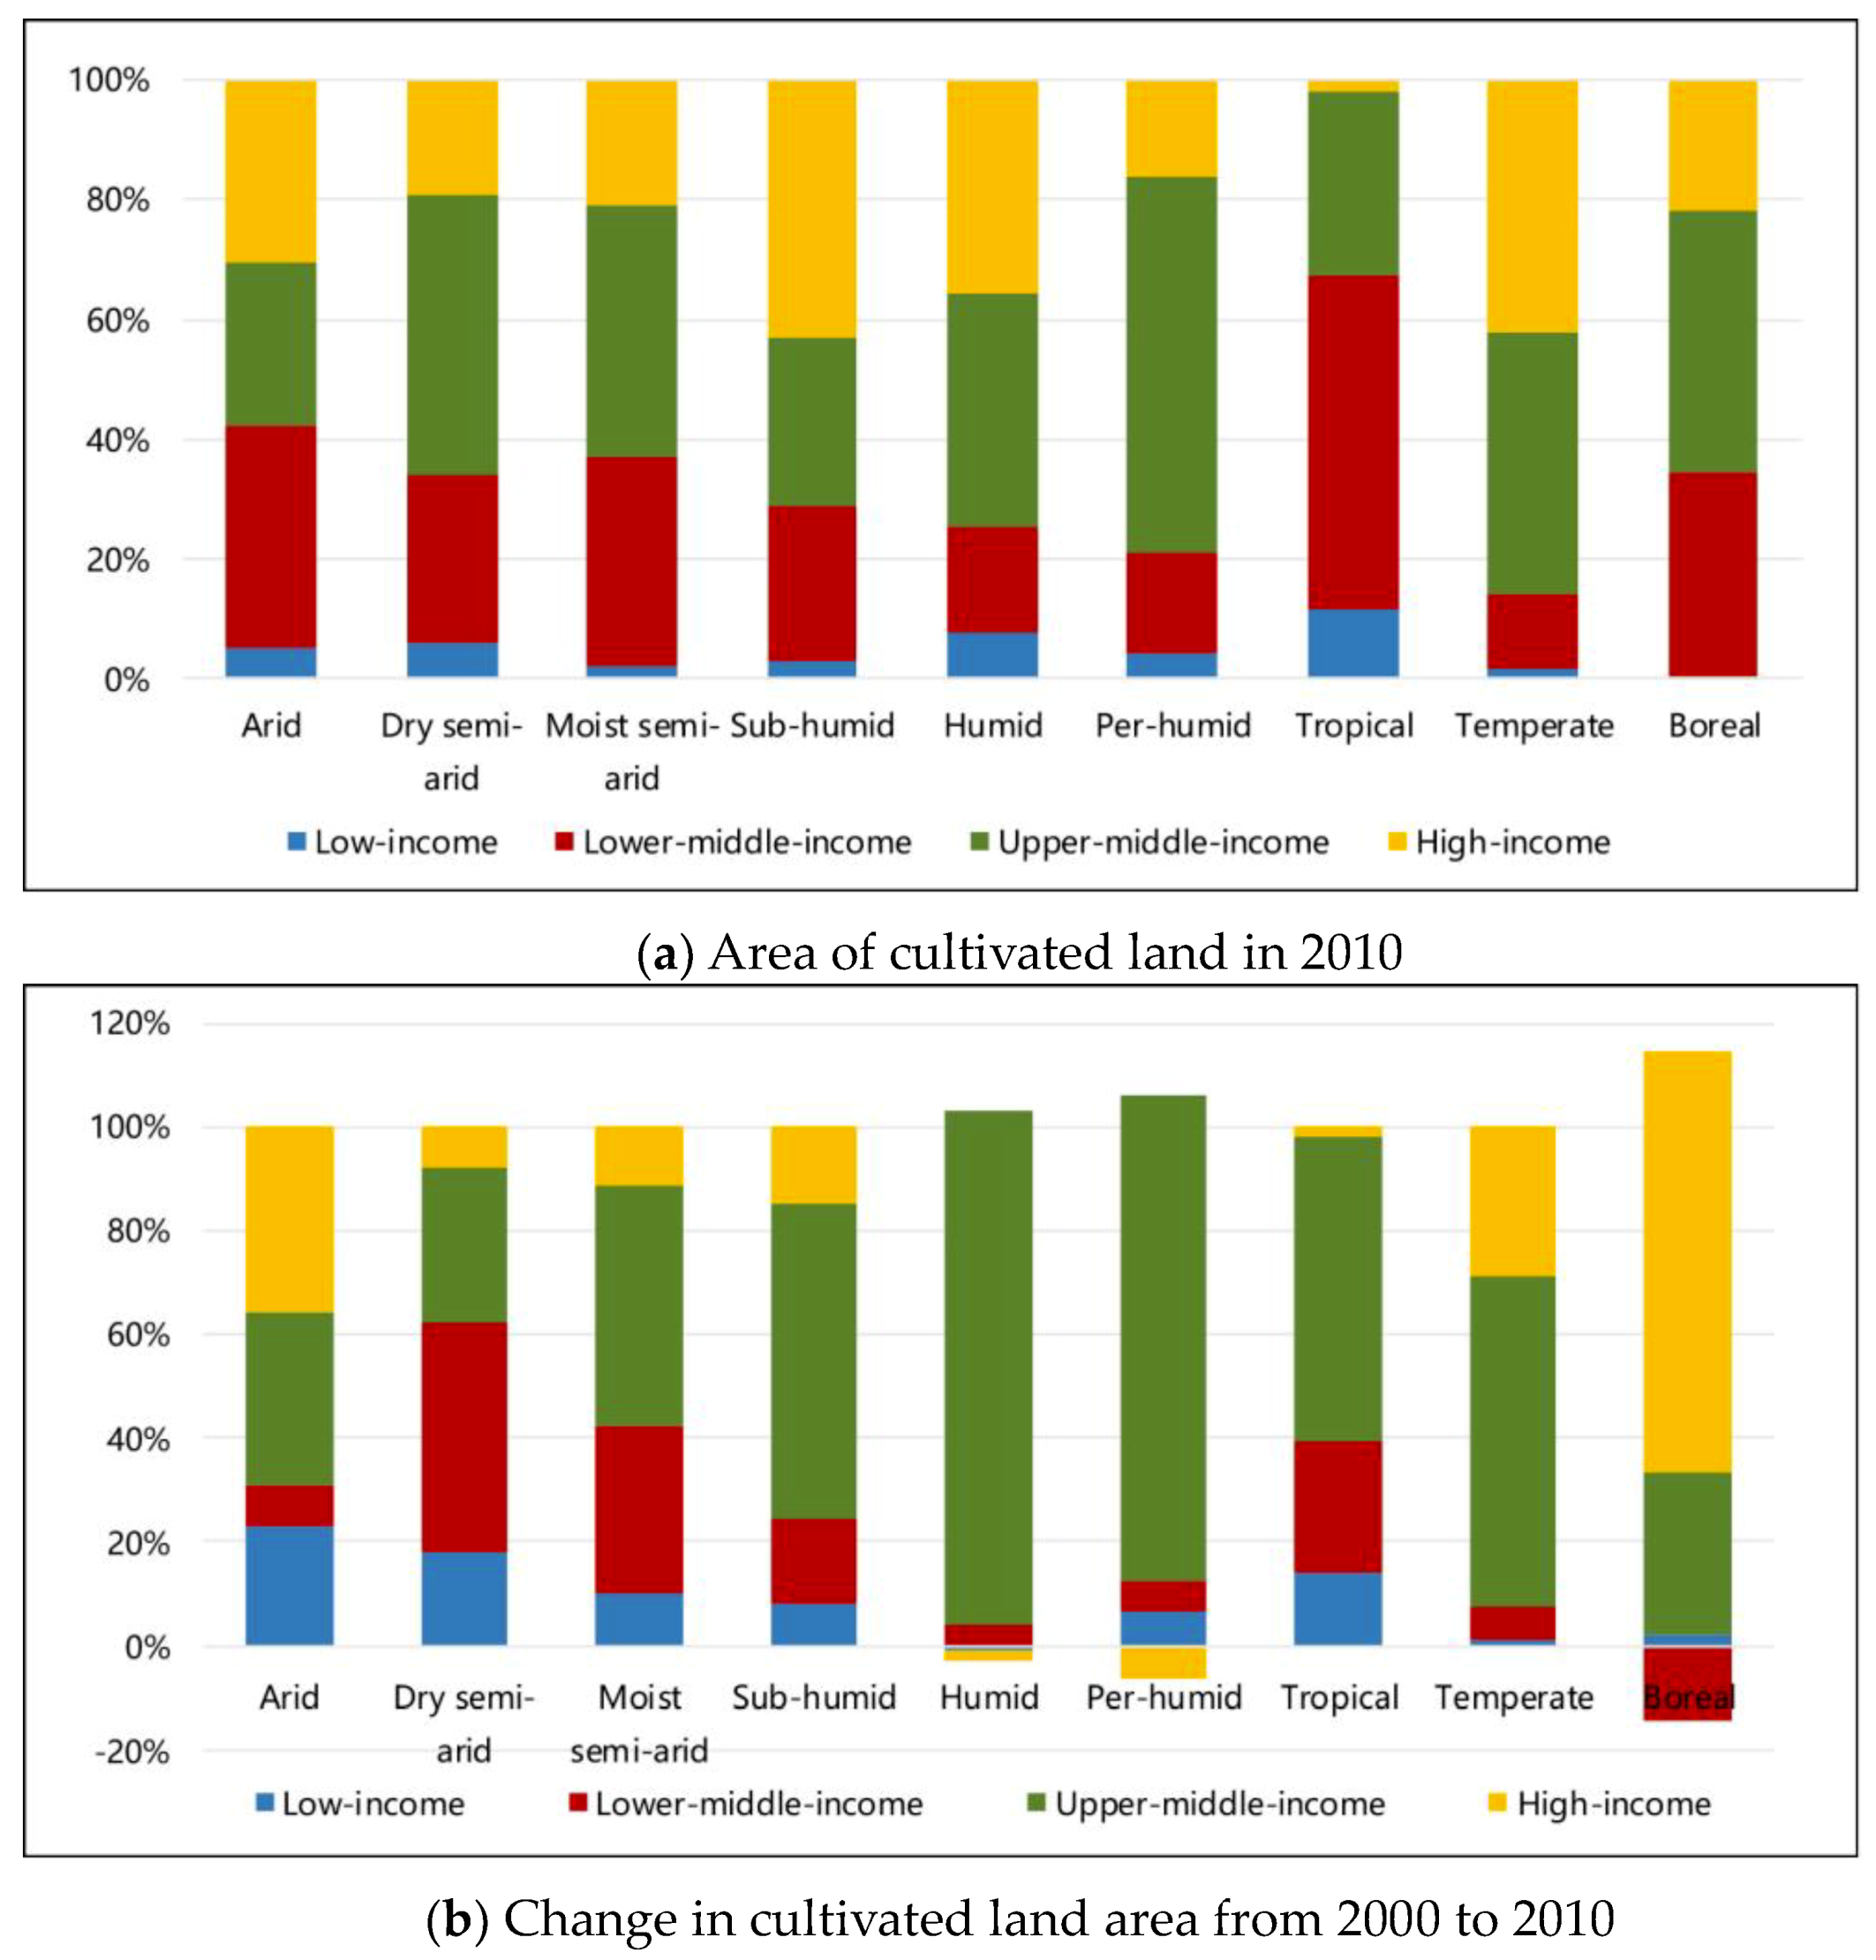
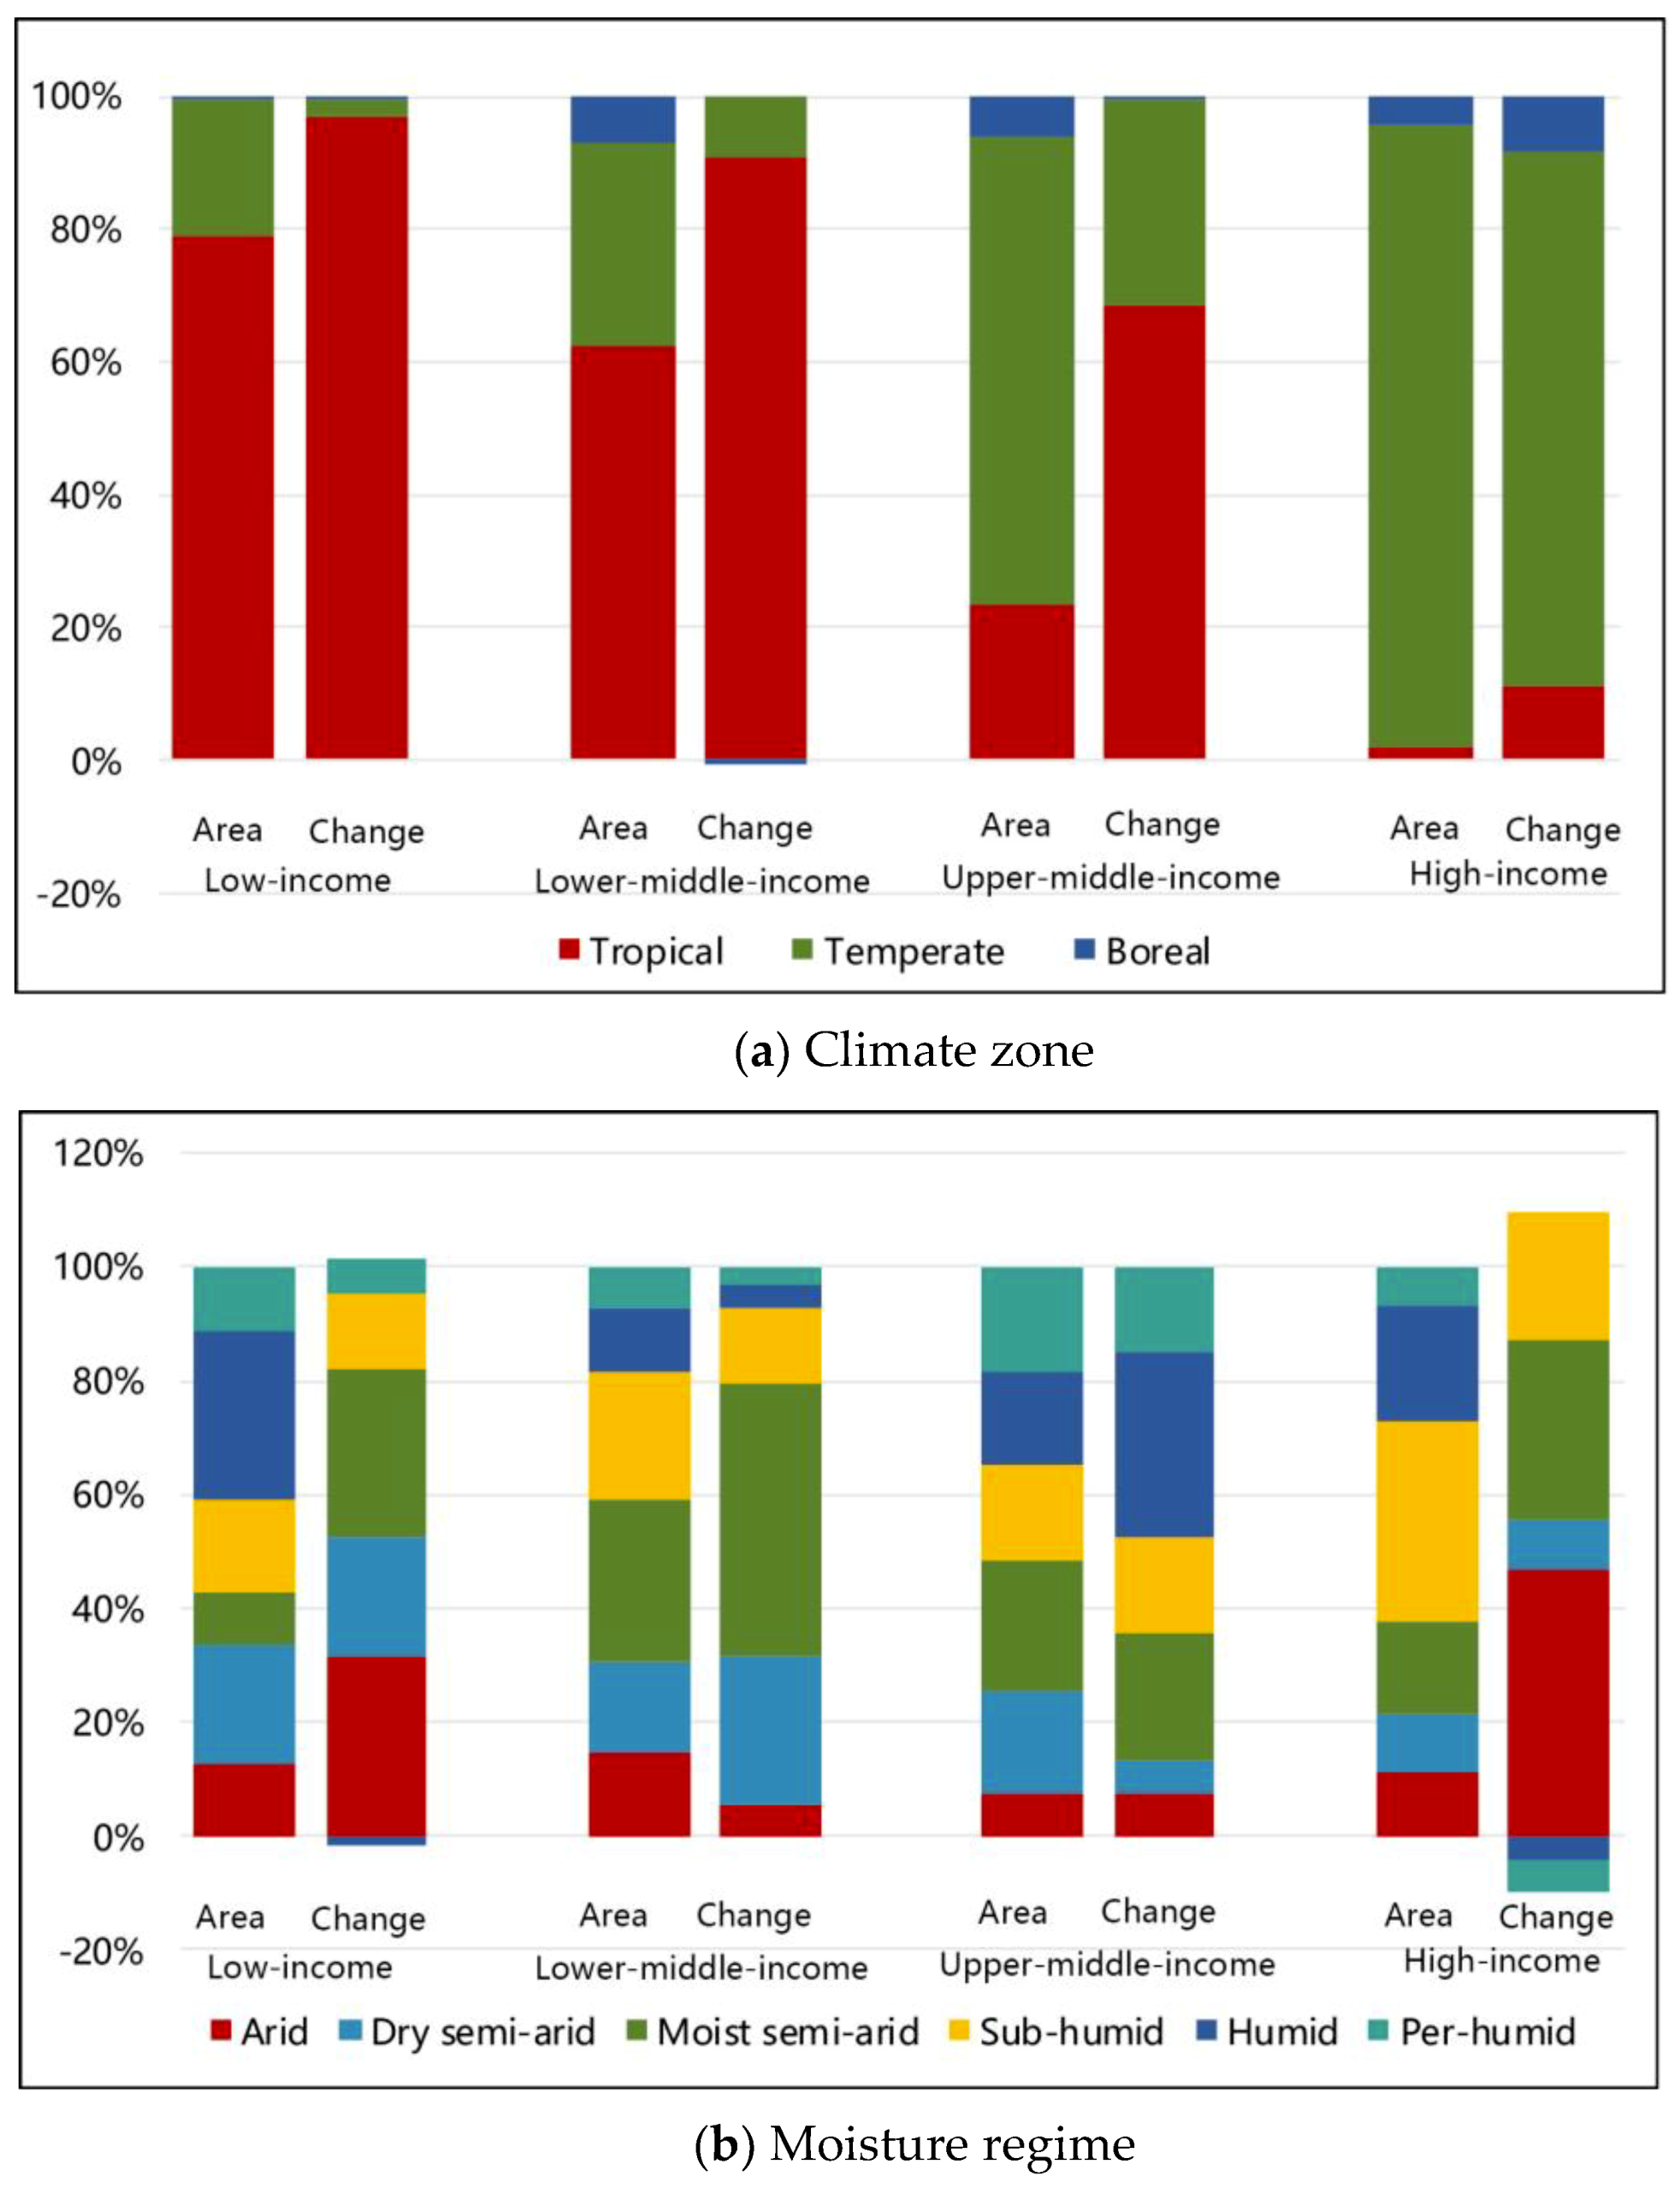
3.2.1. Spatial Aggregation Analysis Based on 18 Agro-Ecological Zones

From an agro-ecological perspective, the cultivated land percentage and its change rate are calculated based on the spatial aggregation of 18 AEZs, which were developed by the Food and Agricultural Organization (FAO) and the International Institute for Applied Systems Analysis (IIASA) to assess agricultural resources and the potential uses of agricultural areas [45,46,47]. Global land is split into 18 AEZs by overlaying the six length of growing period (LGP) categories with the three climatic zones, as shown in Table 3. An LGP is defined as the total number of days that the moisture regime is suitable for planting crops when temperatures are higher than 5 °C [45]. There are six categories of LGPs: 0–59, 60–119,120–179, 180–239, 240–299, and 300–365 days, which correspond to the moisture conditions of arid, dry semi-arid, moist semi-arid, sub-humid, humid, and per-humid, respectively. The climate zones include tropical, temperate, and boreal.
The analysis in this section assumes that the change in cultivated land is related to climate and humidity regions. The cultivated land percentage is calculated by computing the proportion of cultivated land in the total land use area based on 18 AEZs in 2010, as shown in Figure 3. The cultivated land percentages in the temperate zone range from 6.77–42.40%, which is greater than the 2.85–29.03% and 0–6.96% in the tropical and boreal zones, respectively, as shown in Figure 3a. This result shows that more agricultural land is located in the temperate zone than the tropical and boreal zones. The ranges of cultivated land percentages in the dry semi-arid, moist semi-arid, sub-humid, and humid zones are higher than the ranges in the arid or per-humid zones, as shown in Figure 3b. This result shows that the moisture regimes in dry semi-arid, moist semi-arid, sub-humid, and humid zones have relatively larger areas of cultivated land than the extreme moisture regimes, such as arid or per-humid.
Figure 4 shows the rate of land use change for cultivated land based on the 18 AEZs, which is calculated by Equation (2) to reflect the general trend of land use change from 2000 to 2010. The rate of land use change for global cultivated land varies depending on the different moisture regimes and climate conditions. The highest value is located in the region with tropical and arid conditions; the lowest value is located in the region with boreal and humid conditions. The cultivated land mainly increased in the arid regions and decreased in the humid regions. Within the arid, moist semi-arid, sub-humid, and humid moisture regimes, the cultivated land area increased by varying degrees under the boreal, temperate, and tropical climate conditions.

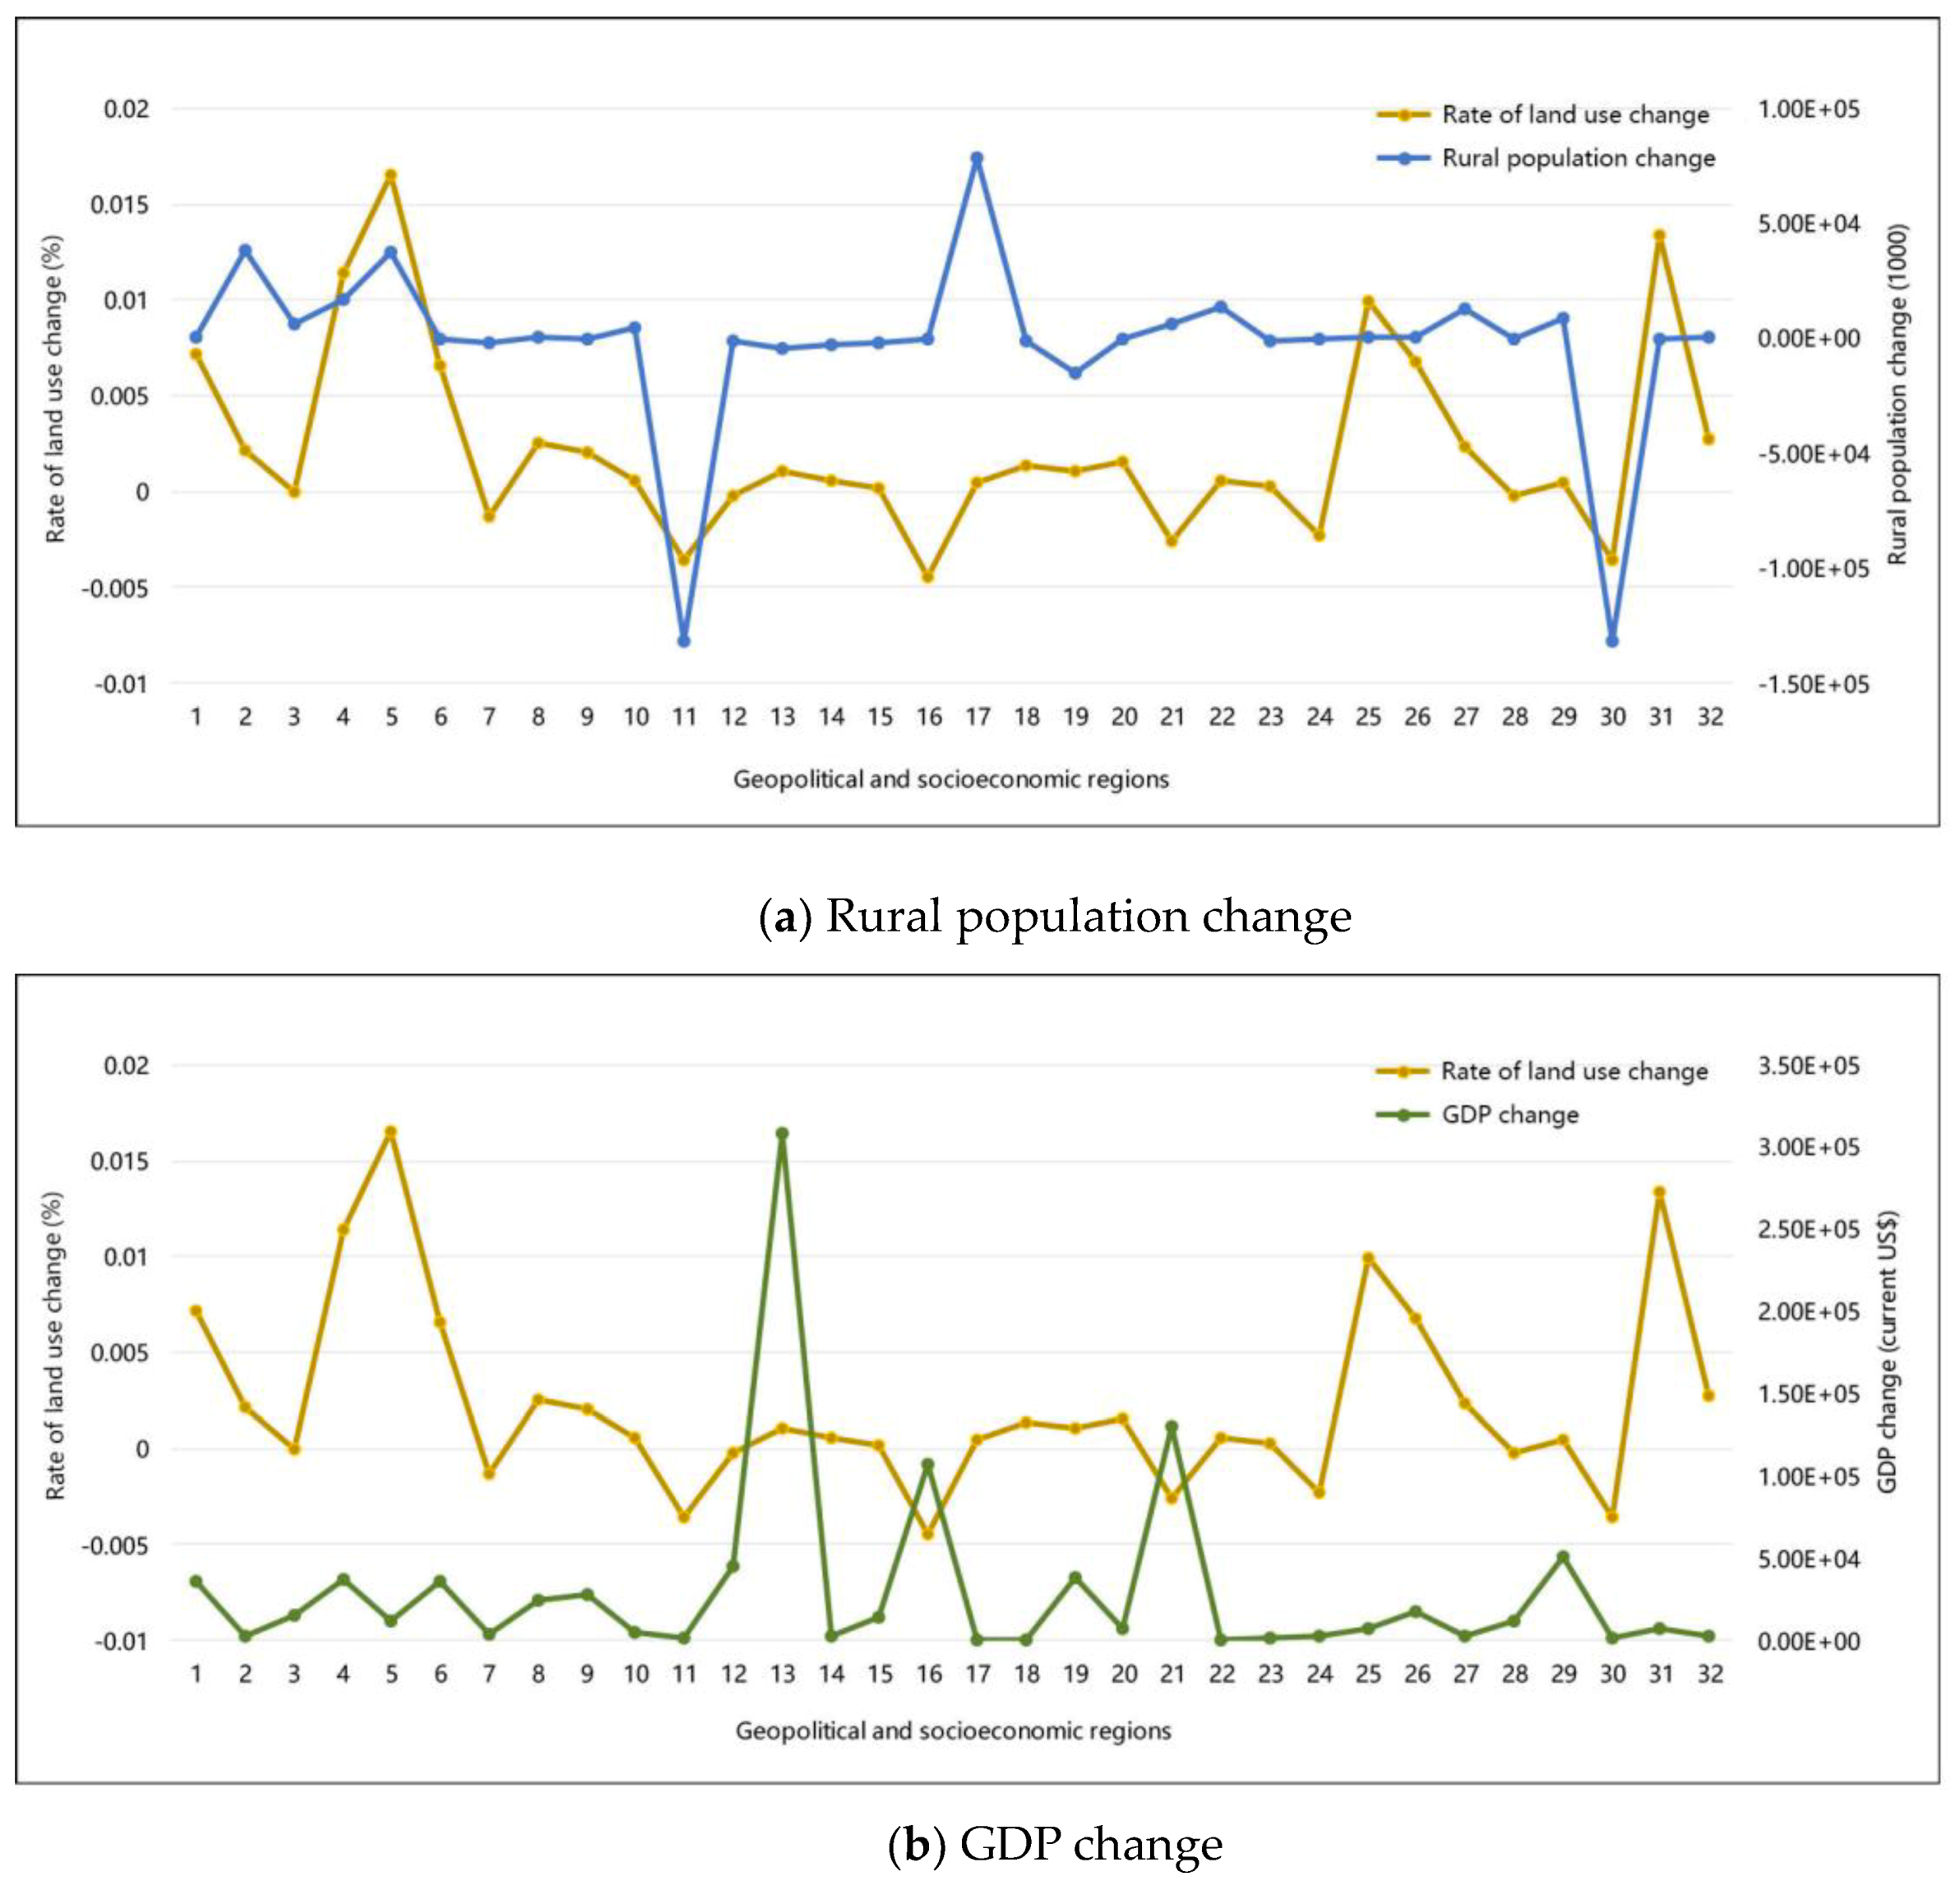
3.2.2. Spatial Aggregation Analysis Based on 32 Geopolitical and Socioeconomic Zones

From a geopolitical perspective, the spatial analysis is discussed based on the spatial aggregation of 32 geopolitical and socioeconomic regions, most of which are representative of economic sectors, such as trade, energy use, and industrial production [50]. Figure 5 shows the cultivated land percentages and rate of land use change for the cultivated land of these 32 geopolitical and socioeconomic zones.
As shown in Figure 5a, the percentage of cultivated land in the 32 geopolitical and socioeconomic zones ranges from 4.36% to 64.32%. Among all geopolitical regions, the relatively high cultivated land percentages are located in India (number 17) and Europe (numbers 12–15), which are shown in red in Figure 5a. It is likely that a large amount of cultivated land is required to alleviate the food demand burdens caused by the large population in India, as shown in Figure 6a. The climate and terrain conditions are conducive for agricultural development in Europe, and to some extent, the development mode is promoted to be more efficient and intensive due to the region’s high gross domestic product (GDP), as shown in Figure 6b. Meanwhile, low cultivated land percentages are found in South America Northern (number 25), Colombia (number 32), and Canada (number 8), at 4.36%, 5.20%, and 5.22%, respectively, due to the small populations in these areas, as shown in Figure 6a. The population and GDP data for 2010 were obtained from the World Bank (https://data.worldbank.org.cn/).
Figure 5b shows that the rate of land use change for cultivated land in the 32 geopolitical and socioeconomic zones ranges from –0.44% to 1.34%. The rate of land use change for cultivated land is relatively higher in some regions than in others, such as Africa_Western (number 5), Argentina (number 31), and Africa_Southern (number 4), as shown in red in Figure 5b. Changes in the rural population and GDP between 2010 and 2000 are used to explore the possible reasons for the cultivated land change. Rural population and GDP data for 2000 and 2010 came from the World Bank (https://data.worldbank.org.cn/). The growth of cultivated land has been mainly accompanied by the rapid growth of the rural population, as shown in Figure 7a. Meanwhile, certain regions have a rate of cultivated land use change that is relatively lower than that of other regions, such as, China (number 11), the European Free Trade Association (number 16), and the Middle East (number 21), as shown in blue in Figure 5b. The rate of cultivated land use change in these regions is less than 0, indicating that cultivated land has decreased over the decade. The decrease in cultivated land in China (number 11) is mainly due to rapid urbanization consuming a large amount of cultivated land. This trend follows the large migration of people from the countryside to the city, as well as the considerable reduction in the rural population over the 10 studied years, as shown in Figure 7a. The decrease in cultivated land in the European Free Trade Association (number 16) and the Middle East (number 21) is mainly accompanied by the rapid economic development of the countries in the two regions, which have higher GDP added values, as shown in Figure 7b.

3.2.3. Spatial Aggregation Analysis Based on 283 World Regions

From both agro-ecological and geopolitical perspectives, the cultivated land percentage is calculated for 283 regions, which are divided by intersecting the 18 AEZs with the 32 geopolitical and socioeconomic regions. As shown in Figure 8a, the cultivated land percentage ranges from 0% to 91.27% in the different regions, which reflects the spatial heterogeneity of the cultivated land distribution. The highest cultivated land percentage is located in the northern Africa region, where the climate conditions are moist semi-arid and tropical. The second- to fourth-highest cultivated land percentages are located in India, where the moisture regimes are dry semi-arid or moist semi-arid, and the climate conditions are tropical or temperate. Meanwhile, some regions have no cultivated land, such as southern South America, Southeast Asia, and Argentina, which are in the boreal climate zone and have moisture regimes that are sub-humid or per-humid.
Figure 8b shows that the rate of land use change for cultivated land ranges from −8.11% to 10.63%, and these values are greater than those in the 18 AEZs and 32 geopolitical and socioeconomic zones. Among the 283 regions, the highest rate of cultivated land use change is located in the western Africa region, with temperate and arid moisture conditions, where the cultivated land exhibits the greatest growth. Meanwhile, the most severe cultivated land reduction is located in Brazil, where the climatic conditions are temperate and the moisture conditions are humid. The 283 regions throughout the world have been divided into detailed areas, which can better reflect the changes in cultivated land in a specific region.
Throughout the 283 regions, one AEZ with the same natural conditions can be divided by different national or subnational borders, which are conducive to drawing the political, social, and economic boundaries that affect the agricultural production decisions by farmers and other decision-makers. Within one AEZ, the spatial distribution of cultivated land varies, due to the different economic conditions of the country and different agricultural development policies. For example, the cultivated land percentages within AEZ 3 range from 0.05% to 91.27% for different geopolitical and socioeconomic conditions. At the same time, multiple AEZs are present in a geopolitical and socioeconomic region. For example, the region of China contains 14 AEZs. Therefore, the cultivated land percentage within China varies widely, from 0.85% to 54.41%, due to the different natural conditions.
There are four economic systems, including low-income, lower-middle-income, upper-middle-income, and high-income systems, according to the definition of the World Bank [51]. To further analyse the cultivated land distribution characters, the 283 world regions were divided into four economic systems, according to the average GDP in 2010. The cultivated land area and its change with four types of economic incomes are analysed under the same agro-ecological condition (in Figure 9). The four economic systems have different proportions of cultivated land area and changes in cultivated land area within the same moisture and climate conditions. Generally, a greater amount of cultivated land and areas with increasing percentages of cultivated land are located in upper-middle-income countries and low-income countries. Much of the increase in cultivated land in low-income and lower-middle-income countries occurred under dry arid, semi-arid, moist semi-arid, and tropical conditions, as shown in blue and red in Figure 9b. Much of the increase in cultivated land in high-income countries is under arid and boreal conditions, as shown in yellow in Figure 9b.
Cultivated land area and its change under different agro-ecological conditions were analysed for the same income levels (Figure 10). The cultivated land percentage and its change rate for three climate and six moisture conditions were different at the same income level. Within low-income and lower-middle-income countries, more cultivated land and changes in cultivated land occurred in the tropical zone, as shown in red in Figure 10a. Within high-income countries, more cultivated land and changes in cultivated land occurred in the temperate zone, as shown in green in Figure 10a. Within upper-middle-income countries, more cultivated land is located in the temperate zone, and an increase in cultivated land area mainly occurred in the tropical zone. As shown in Figure 10b, limited differences were observed in the proportion of cultivated land area and changes in cultivated land in the six moisture regimes within the same economic systems. The cultivated land area increased slightly more under moist semi-arid conditions within lower-middle-income countries, and under arid conditions within the high-income countries.

4. Conclusions

This study used 30-m resolution land use cover data to analyse the global distribution and change in cultivated land, which is helpful for understanding and solving the problem of food security. In 2010, the global cultivated land cover was 19.31 million km2, which accounted for 14.29% of the global land area. The distribution and changes in cultivated land were analysed through three types of spatial aggregations, including 18 AEZs, 32 geopolitical and socioeconomic regions, and 283 world regions. From an agro-ecological perspective, the results demonstrate that cultivated land exhibits the greatest distribution in temperate zones and moderate moisture regimes. From 2000 to 2010, the cultivated land exhibited a substantial increase in relatively arid areas. From a geopolitical perspective, some regions, such as India, must have more cultivated land to meet the food needs of a large population, whereas areas such as Europe have more efficient and intensive development modes of cultivated land due to their relatively high GDP. The growth in cultivated land may have coincided with a large increase in the rural population, such as in Africa, and may have been due to state support for agricultural development, such as in Argentina. A reduction in cultivated land may be related to rapid urbanization and rural depopulation, such as in China; it may also be related to rapid economic development, such as in the European Free Trade Association and the Middle East. From both agro-ecological and geopolitical perspectives, the value ranges of cultivated land percentage and rate of land use change for 283 world regions are much larger than the values for the 18 AEZs and 32 geopolitical regions, which can help clarify the spatial differences. The cultivated land percentage and rate of land use change within an AEZ vary greatly due to differences in the socioeconomic conditions, and the values within a geopolitical area vary due to different natural conditions. Cultivated land and changes in cultivated land for low-income and lower-middle-income countries mainly occurred in the tropical zone. In high-income countries, cultivated land and areas with changes in cultivated land were mainly located in the temperate zone. In upper-middle-income countries, most of the cultivated land was located in the temperate zone, although the increase in cultivated land mainly occurred in the tropical zone.
This study analyses the regions where the cultivated land percentages and land use change rate were higher and lower, and where the changes in cultivated land were concentrated. Scattered or small areas of cultivated land changes need to be further described in detail in a future study. During the analysis process, the land use datasets use the World Goode Homolosine Land map projection. Although this projection can minimize the deformation of the Earth, area errors still exist, especially at high latitudes. In the future, the spatial patterns of global cultivated land and its variation can be statistically analysed on a sphere to reduce the errors at high latitudes.

Author Contributions

In this article, M.C. (Min Cao) conceptualized the study, acquired and analysed, and coordinated the paper writing; Y.Z. processed the data and analysed the results; G.L., M.C. (Min Chen), and W.Q. analysed the results and revised the paper.

Funding

This research was funded by the Major State Basic Research Development Program of China (Grant Nos. 2015CB954101 and 2015CB954103), the National Science Foundation of China (Grant Nos. 41671385, 41622108 and 41871178), the surveying mapping and geoinformation research project of Jiangsu Province (Grant No. JSCHKY201814), the QingLan Project of Nanjing Normal University, and a project funded by the Priority Academic Program Development of Jiangsu Higher Education Institutions (Grant No. 164320H116).

Acknowledgments

The authors would like to thank three anonymous reviewers for their in-depth reviews and suggestions.

Conflicts of Interest

The authors declare no conflict of interest.

References

  1. FAO (Rome). How Does International Price Volatility Affect Domestic Economies and Food Security? Food and Agriculture Organization of the United Nations: Rome, Italy, 2011. [Google Scholar]
  2. Tilman, D. Global environmental impacts of agricultural expansion: The need for sustainable and efficient practices. Proc. Natl. Acad. Sci. USA 1999, 96, 5995–6000. [Google Scholar] [CrossRef] [PubMed]
  3. Godfray, H.C.J.; Beddington, J.R.; Crute, I.R.; Haddad, L.; Lawrence, D.; Muir, J.F.; Pretty, J.; Robinson, S.; Thomas, S.M.; Toulmin, C. Food security: The challenge of feeding 9 billion people. Science 2010, 327, 812–818. [Google Scholar] [CrossRef] [PubMed]
  4. Green, R.E.; Cornell, S.J.; Scharlemann, J.P.; Balmford, A. Farming and the fate of wild nature. Science 2005, 307, 550–555. [Google Scholar] [CrossRef] [PubMed]
  5. Burney, J.A.; Davis, S.J.; Lobell, D.B. Greenhouse gas mitigation by agricultural intensification. Proc. Natl. Acad. Sci. USA 2010, 107, 12052–12057. [Google Scholar] [CrossRef] [PubMed]
  6. Popp, A.; Lotze-Campen, H.; Bodirsky, B. Food consumption, diet shifts and associated non-CO2 greenhouse gases from agricultural production. Glob. Environ. Chang. 2010, 20, 451–462. [Google Scholar] [CrossRef]
  7. Zabel, F.; Putzenlechner, B.; Mauser, W. Global agricultural land resources–a high resolution suitability evaluation and its perspectives until 2100 under climate change conditions. PLoS ONE 2014, 9, e107522. [Google Scholar] [CrossRef] [PubMed]
  8. Bennetzen, E.H.; Smith, P.; Porter, J.R. Decoupling of greenhouse gas emissions from global agricultural production: 1970–2050. Glob. Chang. Biol. 2016, 22, 763–781. [Google Scholar] [CrossRef] [PubMed]
  9. Xie, H.; Zhang, Y.; Choi, Y. Measuring the Cultivated Land Use Efficiency of the Main Grain-Producing Areas in China under the Constraints of Carbon Emissions and Agricultural Nonpoint Source Pollution. Sustainability 2018, 10, 1932. [Google Scholar] [CrossRef]
  10. Ramankutty, N.; Achard, F.; Alves, D.; Turner, B., II; DeFries, R.; Goldewijk, K.; Graumlich, L.; Reid, R. Global changes in land cover. IHDP Update News. Int. Hum. Dimens. Program. Glob. Environ. Chang. 2005, 3, 4–5. [Google Scholar]
  11. Foley, J.A.; DeFries, R.; Asner, G.P.; Barford, C.; Bonan, G.; Carpenter, S.R.; Chapin, F.S.; Coe, M.T.; Daily, G.C.; Gibbs, H.K.; et al. Global consequences of land use. Science 2005, 309, 570–574. [Google Scholar] [CrossRef] [PubMed]
  12. Goldewijk, K.K.; Beusen, A.; Drecht, G.V.; Vos, M. The HYDE 3.1 spatially explicit database of human-induced global land-use change over the past 12,000 years. Glob. Ecol. Biogeogr. 2011, 20, 73–86. [Google Scholar] [CrossRef]
  13. Meneses, B.M.; Reis, E.; Pereira, S.; Vale, M.J.; Reis, R. Understanding driving forces and implications associated with the land use and land cover changes in Portugal. Sustainability 2017, 9, 351. [Google Scholar] [CrossRef]
  14. Jiménez, A.; Vilchez, F.; González, O.; Flores, S. Analysis of the Land Use and Cover Changes in the Metropolitan Area of Tepic-Xalisco (1973–2015) through Landsat Images. Sustainability 2018, 10, 1860. [Google Scholar] [CrossRef]
  15. Veldkamp, A.; Verburg, P.H. Modelling land use change and environmental impact. J. Environ. Manag. 2004, 72, 1–3. [Google Scholar] [CrossRef] [PubMed]
  16. Verburg, P.H.; Schot, P.P.; Dijst, M.J.; Veldkamp, A. Land use change modelling: Current practice and research priorities. GeoJournal 2004, 61, 309–324. [Google Scholar] [CrossRef]
  17. Salata, S. Land use change analysis in the urban region of Milan. Manag. Environ. Qual. Int. J. 2017, 28, 879–901. [Google Scholar] [CrossRef]
  18. Benini, L.; Bandini, V.; Marazza, D.; Contin, A. Assessment of land use changes through an indicator-based approach: A case study from the lamone river basin in Northern Italy. Ecol. Indic. 2010, 10, 4–14. [Google Scholar] [CrossRef]
  19. Bekunda, M.; Sanginga, N.; Woomer, P.L. Restoring soil fertility in sub-Sahara Africa. In Advances in Agronomy. Adv. Agron. 2010, 108, 183–236. [Google Scholar]
  20. Foley, J.A.; Ramankutty, N.; Brauman, K.A.; Cassidy, E.S.; Gerber, J.S.; Johnston, M.; Mueller, N.D.; Connell, C.O.; Ray, D.K.; West, P.C.; et al. Solutions for a cultivated planet. Nature 2011, 478, 337. [Google Scholar] [CrossRef] [PubMed]
  21. Samasse, K.; Hanan, N.P.; Tappan, G.; Diallo, Y. Assessing Cropland Area in West Africa for Agricultural Yield Analysis. Remote Sens. 2018, 10, 1785. [Google Scholar] [CrossRef]
  22. Ramankutty, N.; Foley, J.A.; Norman, J.; McSweeney, K. The global distribution of cultivable lands: Current patterns and sensitivity to possible climate change. Glob. Ecol. Biogeogr. 2002, 11, 377–392. [Google Scholar] [CrossRef]
  23. Hazell, P.; Wood, S. Drivers of change in global agriculture. Philos. Trans. R. Soc. B-Biol. Sci. 2008, 363, 495–515. [Google Scholar] [CrossRef] [PubMed]
  24. Dias, L.C.; Pimenta, F.M.; Santos, A.B.; Costa, M.H.; Ladle, R.J. Patterns of land use, extensification, and intensification of Brazilian agriculture. Glob. Chang. Biol. 2016, 22, 2887–2903. [Google Scholar] [CrossRef] [PubMed]
  25. Liu, J.; Zhang, Z.; Xu, X.; Kuang, W.; Zhou, W.; Zhang, S.; Jiang, N. Spatial patterns and driving forces of land use change in China during the early 21st century. J. Geogr. Sci. 2010, 20, 483–494. [Google Scholar] [CrossRef]
  26. Temme, A.J.A.M.; Verburg, P.H. Mapping and modelling of changes in agricultural intensity in Europe. Agric. Ecosyst. Environ. 2011, 140, 46–56. [Google Scholar] [CrossRef]
  27. Hyandye, C.; Mandara, C.G.; Safari, J. GIS and logit regression model applications in land use/land cover change and distribution in Usangu catchment. Int. J. Remote Sens. 2015, 3, 6–16. [Google Scholar] [CrossRef]
  28. Ren, J.; Campbell, J.B.; Shao, Y. Spatial and temporal dimensions of agricultural land use changes, 2001–2012, East-Central Iowa. Agric. Syst. 2016, 148, 149–158. [Google Scholar] [CrossRef]
  29. Shoyama, K.; Braimoh, A.K.; Avtar, R.; Saito, O. Land Transition and Intensity Analysis of Cropland Expansion in Northern Ghana. Environ. Manag. 2018, 62, 892–905. [Google Scholar] [CrossRef] [PubMed]
  30. Najmuddin, O.; Deng, X.; Bhattacharya, R. The Dynamics of Land Use/Cover and the Statistical Assessment of Cropland Change Drivers in the Kabul River Basin, Afghanistan. Sustainability 2018, 10, 423. [Google Scholar] [CrossRef]
  31. Arowolo, A.O.; Deng, X. Land use/land cover change and statistical modelling of cultivated land change drivers in Nigeria. Reg. Environ. Chang. 2018, 18, 247–259. [Google Scholar] [CrossRef]
  32. Ramankutty, N.; Foley, J.A. Characterizing patterns of global land use: An analysis of global croplands data. Glob. Biogeochem. Cycles 1998, 12, 667–685. [Google Scholar] [CrossRef]
  33. Ramankutty, N.; Foley, J.A. Estimating historical changes in global land cover: Croplands from 1700 to 1992. Glob. Biogeochem. Cycles 1999, 13, 997–1027. [Google Scholar] [CrossRef]
  34. Ramankutty, N.; Evan, A.T.; Monfreda, C.; Foley, J.A. Farming the planet: 1. Geographic distribution of global agricultural lands in the year 2000. Glob. Biogeochem. Cycles 2008, 22. [Google Scholar] [CrossRef]
  35. Beddow, J.M.; Pardey, P.G.; Koo, J.; Wood, S. The changing landscape of global agriculture. In The Shifting Patterns of Agricultural Production and Productivity Worldwide; Iowa State University, The Midwest Agribusiness Trade Research and Information Center (MATRIC): Ames, IA, USA, 2010; pp. 7–38. [Google Scholar]
  36. Leff, B.; Ramankutty, N.; Foley, J.A. Geographic distribution of major crops across the world. Glob. Biogeochem. Cycles 2004, 18, GB1009. [Google Scholar] [CrossRef]
  37. Yao, Z.; Zhang, L.; Tang, S.; Li, X.; Hao, T. The basic characteristics and spatial patterns of global cultivated land change since the 1980s. J. Geogr. Sci. 2017, 27, 771–785. [Google Scholar] [CrossRef]
  38. Alexander, P.; Rounsevell, M.D.; Dislich, C.; Dodson, J.R.; Engström, K.; Moran, M. Drivers for global agricultural land use change: The nexus of diet, population, yield and bioenergy. Glob. Environ. Chang. 2015, 35, 138–147. [Google Scholar] [CrossRef]
  39. Dang, A.N.; Kawasaki, A. Integrating biophysical and socio-economic factors for land-use and land-cover change projection in agricultural economic regions. Ecol. Model. 2010, 344, 29–37. [Google Scholar] [CrossRef]
  40. Chen, J.; Chen, J.; Liao, A.; Cao, X.; Chen, L.; Chen, X.; Zhang, W. Global land cover mapping at 30 m resolution: A POK-based operational approach. ISPRS-J. Photogramm. Remote Sens. 2015, 103, 7–27. [Google Scholar] [CrossRef]
  41. Cao, X.; Chen, X.; Zhang, W.; Liao, A.; Chen, L.; Chen, Z.; Chen, J. Global cultivated land mapping at 30 m spatial resolution. Sci. China-Earth Sci. 2016, 59, 2275–2284. [Google Scholar] [CrossRef]
  42. Chen, L.; Wang, J.; Fu, B.; Qiu, Y. Land-use change in a small catchment of northern Loess Plateau, China. Agric. Ecosyst. Environ. 2001, 86, 163–172. [Google Scholar] [CrossRef]
  43. Du, X.; Jin, X.; Yang, X.; Yang, X.; Zhou, Y. Spatial pattern of land use change and its driving force in Jiangsu Province. Int. J. Environ. Res. Public Health 2014, 11, 3215–3232. [Google Scholar] [CrossRef] [PubMed]
  44. Kim, S.H.; Edmonds, J.; Lurz, J.; Smith, S.J.; Wise, M. The ObjECTS Framework for Integrated Assessment: Hybrid Modeling of Transportation. Energy J. 2006, 2, 51–80. [Google Scholar] [CrossRef]
  45. Dooley, J.J.; Zhou, Y. Explicitly Accounting for Protected Lands within the GCAM 3.0 (No. PNNL-21253); Pacific Northwest National Laboratory (PNNL): Richland, WA, USA, 2012.
  46. FAO. Land Cover Classification System: Classification Concepts and User Manual (with CD-Rom); Food and Agriculture Organization (FAO) of the United Nations: Rome, Italy, 2000. [Google Scholar]
  47. FAO; IIASA. Global Agro-Ecological Zones—2000; Food and Agriculture Organization (FAO) of the United Nations: Rome, Italy; International Institute for Applied Systems Analysis (IIASA): Laxenburg, Austria, 2000. [Google Scholar]
  48. Lee, H.L. Incorporating agro-ecologically zoned land use data and landbased greenhouse gases emissions into the GTAP framework. In Proceedings of the 8th Annual Conference on Global Economic Analysis, Lübeck, Germany, 9–11 June 2005. [Google Scholar]
  49. Fischer, G.; Nachtergaele, F.O.; Prieler, S.; Teixeira, E.; Tóth, G.; Van Velthui.zen, H.; Verelst, L.; Wiberg, D. Global Agro-ecological Zones (GAEZ v3. 0)-Model Documentation; IIASA: Laxenburg, Austria; FAO: Rome, Italy, 2012. [Google Scholar]
  50. Page, Y.L.; West, T.O.; Link, R.; Patel, P. Downscaling land use and land cover from the Global Change Assessment Model for coupling with Earth system models. Geosci. Model Dev. 2016, 9, 3055–3069. [Google Scholar] [CrossRef]
  51. World Bank Group. World Development Indicators 2012; World Bank Publications: Washington, DC, USA, 2014. [Google Scholar]
Figure 1. Global land use in 2000 and 2010.
Sustainability 11 01242 g001
Figure 2. Global cultivated land in 2010.
Sustainability 11 01242 g002
Figure 3. Cultivated land percentage based on the 18 agro-ecological zones in 2010.
Sustainability 11 01242 g003aSustainability 11 01242 g003b
Figure 4. Rate of land use change for cultivated land from 2000 to 2010 based on the 18 agro-ecological zones.
Sustainability 11 01242 g004
Figure 5. Spatial analysis based on the 32 geopolitical and socioeconomic regions. (a) Cultivated land percentage in 2010; (b) rate of land use change for cultivated land from 2000 to 2010.
Sustainability 11 01242 g005
Figure 6. Impact factor analysis of cultivated land percentage.
Sustainability 11 01242 g006
Figure 7. Analysis on the rate of cultivated land use change.
Sustainability 11 01242 g007
Figure 8. Spatial analysis based on 283 world regions.
Sustainability 11 01242 g008
Figure 9. Proportions of cultivated land area and its change in four economic systems within the same agro-ecological conditions.
Sustainability 11 01242 g009
Figure 10. Proportions of cultivated land area and its change in different agro-ecological conditions within the same economic systems.
Sustainability 11 01242 g010
Table 1. Changes in the area of global cultivated land from 2000 to 2010.
200020102010–2000
Area (106 km2)18.9119.310.40
Percentage (%)13.9814.290.31
Table 2. Distribution of cultivated land by continents in 2010.
AsiaEuropeNorth AmericaSouth AmericaAfricaOceaniaGlobal
Percentage (%)36.3122.2114.6312.1211.703.03100
Table 3. Definition of the 18 agro-ecological zones [48,49].
LGP in daysMoisture regimeClimate zonesAEZsLGP in daysMoisture regimeClimate zonesAEZs
0–59AridTropicalAEZ1180–239Sub-humidTropicalAEZ4
TemperateAEZ7TemperateAEZ10
BorealAEZ13BorealAEZ16
60–119Dry semi-aridTropicalAEZ2240–299HumidTropicalAEZ5
TemperateAEZ8TemperateAEZ11
BorealAEZ14BorealAEZ17
120–179Moist semi-aridTropicalAEZ3>300Per-humidTropicalAEZ6
TemperateAEZ9TemperateAEZ12
BorealAEZ15BorealAEZ18
Note: Per-humid means humid with a year-round growing season.

