Article

Taiwan’s Marketing Strategies for Green Conferences and Exhibitions

Department of Business Management, Nunhua University, Chiayi County 62249, Taiwan
*
Author to whom correspondence should be addressed.
Sustainability 2019, 11(5), 1220; https://doi.org/10.3390/su11051220
Submission received: 27 December 2018 / Revised: 20 February 2019 / Accepted: 21 February 2019 / Published: 26 February 2019
(This article belongs to the Section Economic and Business Aspects of Sustainability)

Abstract

:
This study investigates the status of conference and exhibition industry in Taiwan and its future development by examining the “green conferences and exhibitions” marketing strategy. The findings show that factor and demand conditions are the most important determinants of exhibition location. Moreover, a SWOT analysis of the industry’s features and a holistic marketing strategy will ensure that countries with limited resources, such as regional Asian economies, derive integrated economic benefits from such exhibitions. The results and recommendations should provide organizations with a useful reference for promoting green conferences and exhibitions.

1. Introduction

1.1. Research Motivation

The Global Competitiveness Report 2018 represents Taiwan’s overall score ranked 13th. The evaluation areas include “enabling environment”, “human capital”, “markets”, and “innovation ecosystem”. It also represents Taiwan’s competitiveness needs continuous efforts [1].
The Green Conference and Exhibition marketing strategy can also be extended to promote the energy saving effect of urban construction and natural resources [2,3]. The exhibition industry, which is concerned with meetings, incentive travel, conventions, and exhibitions, is a broad industry that includes elements such as transportation, dining, and business design. The tourism industry currently has the highest economic output of all industries, within which the meetings and exhibitions industry is a rapid growth sector. Statistics show that conference travelers’ average consumption is two to three times that of ordinary tourists [4]. Clearly, the conference and exhibition industry is a powerful driver for tourism industry development. It is an “engine”-type industry: in addition to driving many related industries—such as financial trade, transportation and travel, and hospitality—the conference and exhibition industry also brings significant economic benefits to regional exhibition hosts. Consequently, the developmental conditions of the international conference and convention industry are important indicators of regional globalization [5].
Green marketing is beyond the role of linking to green customers and marketing mix, and should expand to include other aspects of corporate demand management, such as predicting demand for environmentally-friendly products, positioning and demand stimulation for recycled and remanufactured products, generating demand for build-to-order products, and building competitive advantages from a focus on environmental priorities [6].
Sustainable city development is an increasingly important focus of government policy, where the alignment of climate change and low-carbon strategy implementation are the key challenges [7]. In view of the rise of global environmental awareness, the issue of green economy has received special attention. To promote economic development and enhance national competitiveness, promoting the green energy conference and exhibition industry will be the biggest boost.

1.2. Research Objectives

International conferences and conventions in Taiwan are dynamic. The industry has already facilitated many changes towards various development objectives. The vitalized development of the food and beverage (F&B) and tourism industries was guided by developmental trends in energy and talent operations and planning, environmental protection concepts, and carbon neutrality, along with several strategic drivers [8].
In view of this phenomenon, the primary focus of this study is Taiwan’s green conference and exhibition marketing strategy. Its key objectives are to understand the environmental implications of the conference and exhibition industry and explore strategies to promote marketing management in Taiwan’s green conferences and exhibitions.
Through a literature analysis, this study aims to address the academic community’s expectations concerning the development of green conferences and exhibitions. By reviewing the relevant literature and using a macroscopic perspective of Taiwan and the world, it investigates strategic factors in the implementation methods of the marketing strategies of future green conferences. It explores the current methods and conditions of Taiwan’s green conferences and exhibitions, and presents research results and recommendations as reference for governments and industries in promoting green conferences and exhibitions.
Briefly, the purpose of this study is as follows. (1) Grasping the globalization trend of green conference and exhibition industry. (2) Analyze and promote the advantages of Taiwan’s conference and exhibition industry. (3) Formulating the marketing strategies of Taiwan’s green conference and exhibition industry from academic and empirical application.

2. Literature Review

The literature review outlines the various aspects related to the development of a strategy for green operations management. It outlines the basic aspects related to international conferences and conventions discussed in the literature, followed by green conventions and exhibitions, holistic marketing, and green operations strategy management. Finally, it integrates the literature pertaining to the latter to define the benefits of green operations strategy management for firms.

2.1. International Conferences and Conventions

2.1.1. International Conferences and Conventions

The standards stipulated by the MOEA Department of Commerce (DOC), which is responsible for the Taiwanese conference and exhibition industry, posit that an event can be considered an international conference if it has at least five countries in attendance (including the host country), at least 100 attendees, and at least 80 foreign attendees (or foreign attendees must constitute 40% of the total). The Taiwan Convention and Exhibition Association [9] defines a convention as an event in which a group of people meet in a specified place at a specified time to conduct business research or engage in a specific activity; there must be at least 50 attendees, of whom 20% must be foreign. The International Congress and Convention Association stipulate that an international convention must have at least three countries attending, have at least 50 attendees, and be held at a specific time.

2.1.2. Factors of International Conferences and Conventions

Zhu [10] notes that five factors are implicit in a convention. First is the convention body, composed of the subjects of the service for which the convention is organized, and refers to the producers who participate in the convention. The second is the economic department or organ of the convention; that is, the specialized industry organization or convention company that organizes the convention. The third is the convention customer, which is the convention exhibition area—generally a convention hall or exhibition center. The fourth is the convention market, which is the information channel formed by participating producers or firms responsible for information and broadcasting. The fifth is the convention audience, consisting of the purchasers, consumers, and information gathering attendees. Huang [11] believes that conventions comprise two types of elements: (1) basic convention elements, such as convention time, location, and product or service and (2) the host of the convention activities, which includes the organizing body, participating producers, participating presenters, service industries adjacent to the convention, and opinion leaders. Wen and Duan [12] distinguish between international, domestic, regional, and municipal conventions according to the regional characteristics of the exhibitors and attendees.
Qiu [13] argue that the key success factors for promoting Taiwan’s international exhibitions are the (1) marketing strategy, (2) host organizations’ human resources, (3) industrial technology, (4) social environment, (5) national policies, and (6) resource management. This study will further explore the Taiwan’s green conference and exhibition industry marketing strategy.

2.2. Green Conventions and Exhibitions

In response to the MOEA BOFT’s action for “promoting industry energy savings and carbon reduction,” the Taiwan External Trade Development Council (TAITRA) introduced environmentally friendly concepts into conventions and conference centers. In addition to the Nangang Exhibition Center’s completion of a carbon footprint assessment [14], the Taipei International Convention Center became a green venue in 2016 by conducting a “greenhouse gas emissions assessment”, thereby improving the international competitiveness of Taiwan’s convention industry. Specific measures include promoting green venues for Taiwan’s exhibitions, conventions, and conferences. The Nangang Exhibition Center, for example, demonstrates its social responsibility by reducing consumption of natural resources such as water, electricity, air conditioning, paper, and food and beverages, and adopting waste recycling methods with government support. In addition, LED signs are replacing traditional posters at convention venues [15]. Furthermore, environmental protection issues have become important deciding factors in the choice of international convention hosts; these issues include transportation systems, energy-saving lighting, water supply, decorations, and the use of recyclable materials. Participating organizations may have specific environmental facilities that allow for recycling and reusing booth decorations; the venue may increase facilities for recycling textual materials and participant IDs, while avoiding the use of bottled water and also providing free bus transportation, thus strictly enforcing vehicle emissions inspection requirements [16].

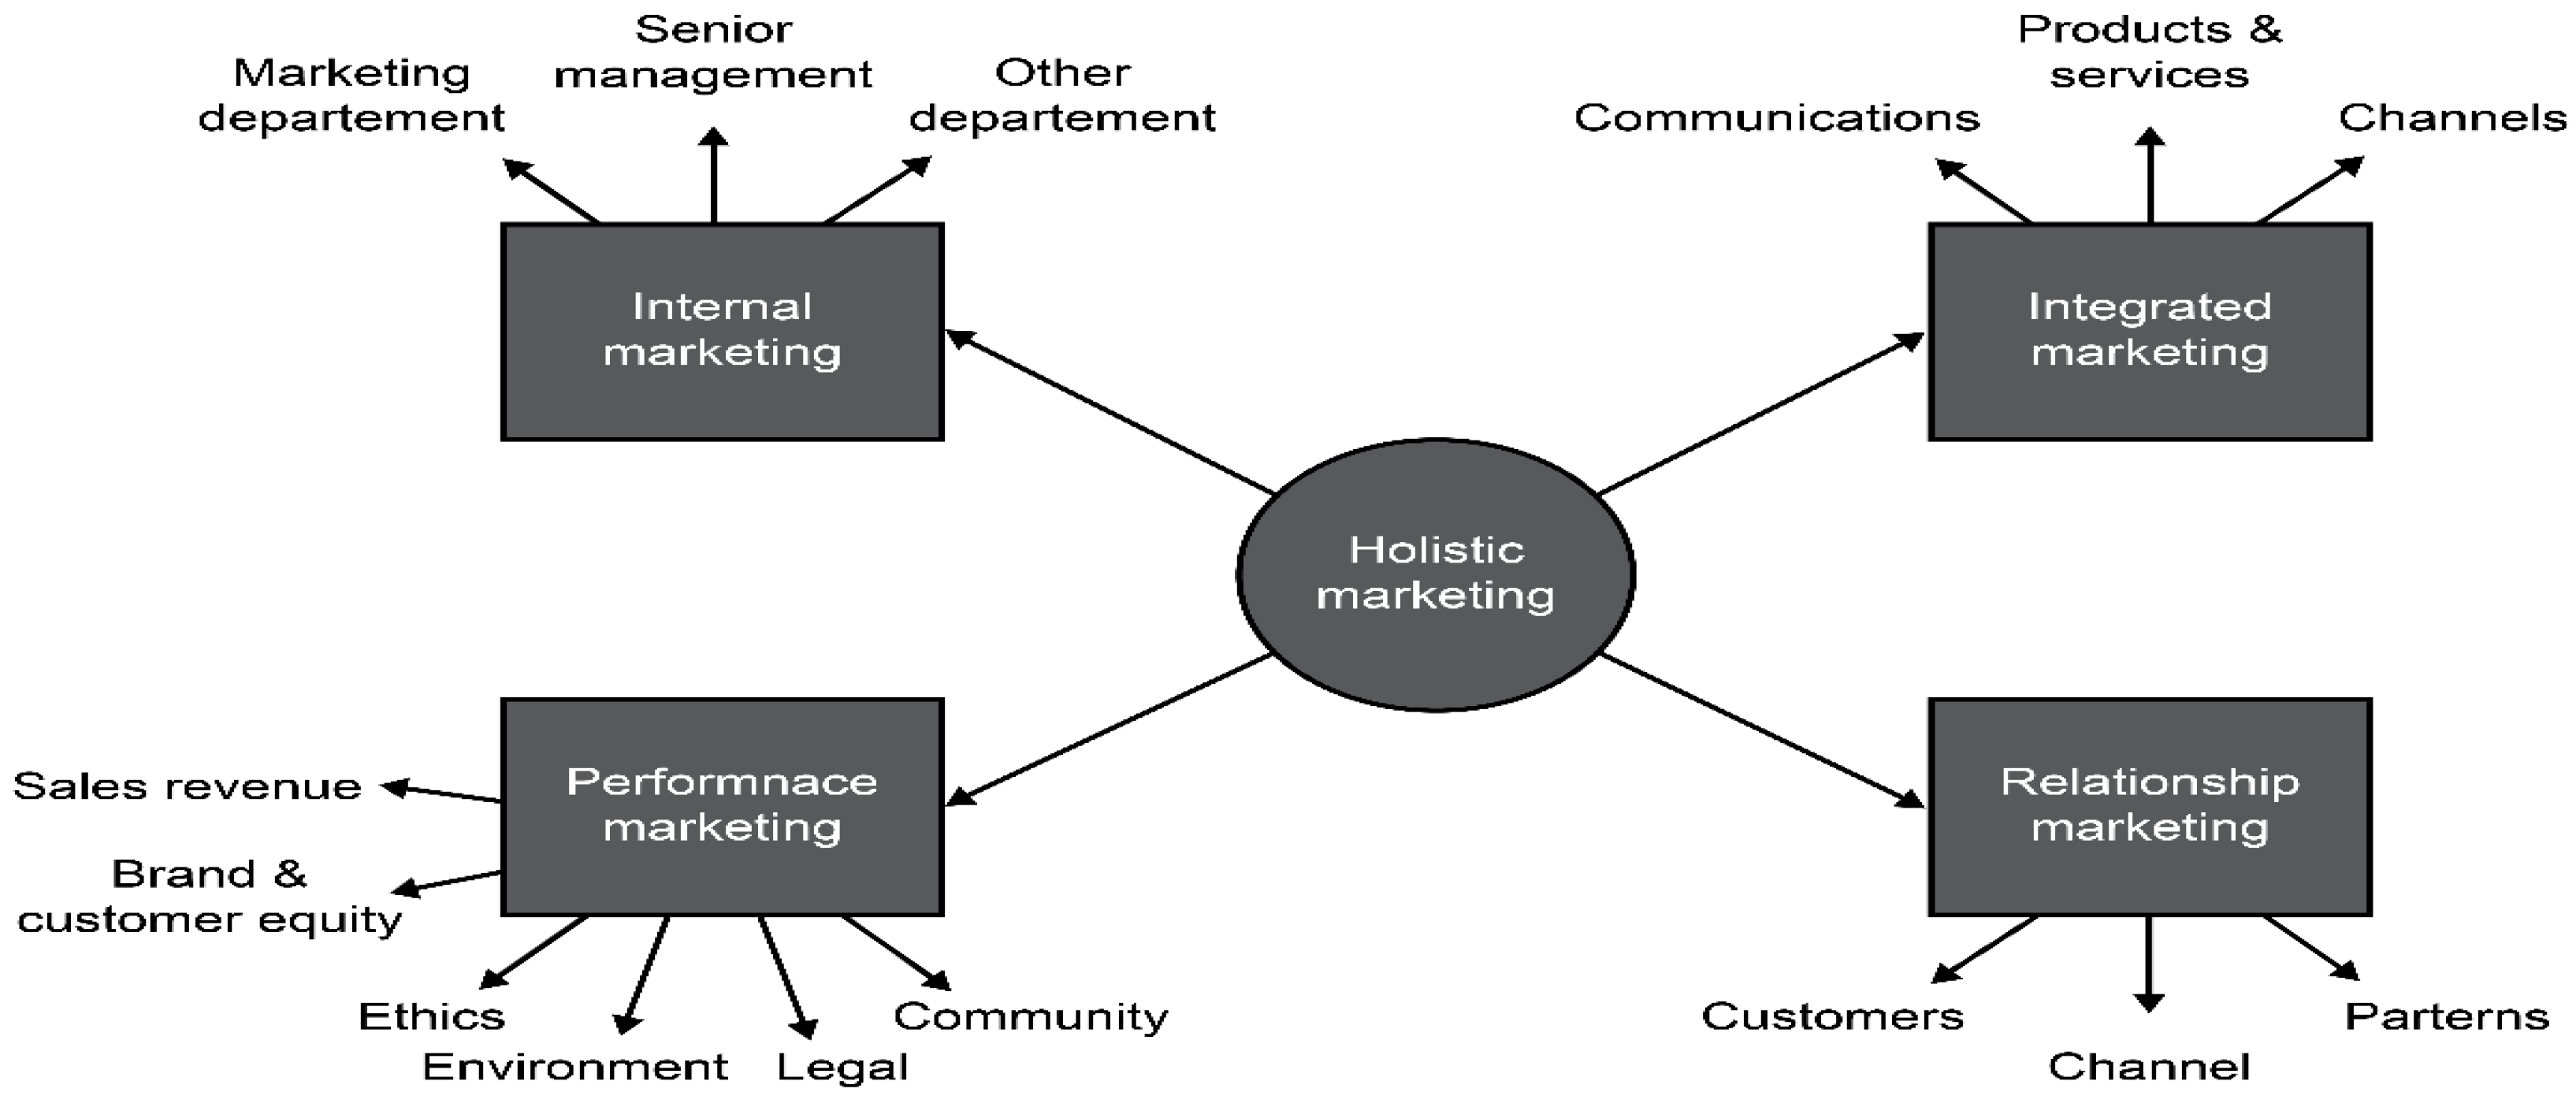
2.3. Holistic Marketing

Drucker [17] argues that marketing aims to understand customers fully, such that products and services can be completely “adjusted” to fit the customer, enabling the products to sell themselves. Kotler [18] states that marketing is the consideration of the values that should be provided to satisfy market demands, the creation of those values, and the transmission thereof to consumers, thereby creating profits. The simplest definition of “marketing” is “satisfying demand, raising profits” [19]. Kotler [20] defined the five basic steps of marketing as research as segmentation, positioning, and targeting, marketing mix, implementation, and control (i.e., R/STP/MM/I/C). In the current paradox of globalization—in an era of a participatory and creative society—marketing development has shifted from a “marketing 1.0” production orientation to a “marketing 2.0” customer orientation, and then to a “marketing 3.0” value orientation [21].
The concepts of “environmental protection” and “advancing with the times” have become trends of globalization. Various industries exist adjacent to green exhibitions; environmentalism is a key concept of globalized economic development in which each nation actively promotes environmental protectionism as a means of achieving economic growth. Therefore, marketing strategies should use holistic methods to achieve success. Holistic marketing is the process of “first fully understanding the relationships between marketing programs, procedures, and activities, then developing marketing programs, procedures, and activities, and finally implementing them” [19]. It comprises four types of factors: (1) relationship marketing, (2) integrated marketing, (3) internal marketing, and (4) socially responsible marketing [21].

2.3.1. Relationship Marketing

Relationship marketing aims to establish mutually advantageous and satisfactory long-term relationships with key partners, including customers, suppliers, marketing channels, and other marketing partners, in order to work towards and achieve organizational missions. Thus, marketing requires not only the promotion of customer relationship management but also the implementation of partner relationship management. Furthermore, the result of relationship management is the establishment of unique organizational assets such as a marketing network composed of the social relationships between the organization itself and all stakeholders that support the organization’s operations. Relationship marketing can be divided into three levels: (1) customer relationships, (2) marketing channel relationships, and (3) partner relationships.

2.3.2. Integrated Marketing

Integrated marketing is the integration of marketing activities that combine to form a marketing plan that allows consumers to create, communicate, and transmit their values. This marketing plan includes a variety of options for strengthening the value of marketing activities, traditionally referred to as a “marketing mix,” which include the well-known 4Ps: product, price, place, and promotion. A good marketing plan must have policies for the 4Ps that are not only mutually highly consistent, but also mutually reinforce and effectively and efficiently fulfill customer demands. Overall, integrated marketing covers topics on two levels: (1) activities within the marketing mix must be coordinated and (2) the organization must integrate all internal and external units, departments, and other components to generate the greatest combined effect. Thus, integrated marketing includes three components: (1) demand management, (2) resource management, and (3) network management.

2.3.3. Internal Marketing

Organizations conduct internal marketing tasks to guarantee that all members of an organization can comply with appropriate marketing policies. Organizations must hire, train, and encourage workforce resources that wish to serve their customers. For nonprofit organizations (NPOs) with high levels of marketing, high-level management teams and service staff are aware of the similarities and differences between internal and external marketing; this is an equally, or even more, important field of management, because unprepared NPO employees will be unable to achieve organizational objectives or provide high-quality service. The key points of internal marketing are as follows.
(1) All marketing functions of an organization must be conducted from the customer’ perspective to achieve coordination, balance, and cooperation. Such functions include public relations, advertising, fundraising, marketing research, and services, which the organization must conduct with a consideration of the target market and the principles of integrated marketing activities.
(2) Organizations must observe a company-wide marketing culture because marketing is not a task for a department or a group of specialized workers, but rather the responsibility of all employees. Thus, marketing must consider the entire organization. This is similar to cases in which top tier firms such as Xerox have job descriptions that describe the establishment of customer relationships for each item within each job; this serves as a worthy example for every NPO.

2.3.4. Socially Responsible Marketing

Due to profit-seeking motivations, many for-profit organizations will see their positive social atmosphere and values gradually erode while pursuing profits. The ability to challenge and mitigate the social shock of these continuous negative marketing activities and products depends on the more holistic, long-term perspectives of NPOs. As NPOs seek to achieve their objectives, they must help and compel firms to take account of “socially responsible marketing”. Many firms are increasing their efforts and spending on this task, for example, by conducting socially responsible marketing activities such as cause marketing, corporate charity activities, and corporate community participation. Amid these activities, NPOs must view firms as important potential customers and not simply passively accept their resources, and NPOs should actively study their target market’s demands and propose solutions for corporate image issues. NPOs can also use activities and marketing proposals carried out for the public interest to create benefits for their organizations, firms, and aid recipients.

2.4. Green Operations Strategy Management

2.4.1. Background

Green marketing refers to marketing practices, policies, and procedures that explicitly account for concerns about the natural environment in pursuing the goal of creating revenue and providing outcomes that satisfy organizational and individual objectives for a product [22].
Chen [23] argues that green operations strategy often allows firms to gain access to new markets, increase profits, and enjoy greater competitive advantages. Firms that recognize green operations as a future global trend and actively develop green strategies can achieve decisive market opportunities, sustained development, and maximum profits [24]. Maxwell Rothenberg, Briscoe, and Marcus [25] note that a firm that actively and systematically implements green strategies can generate many advantages, allowing it to improve its overall performance. Sarkis [26] finds that green operations management can improve environmental performance, while also guaranteeing the firm’s conformance to environmental regulations and improving the efficiency of resource utilization, thereby reducing operating costs. Vachon and Klassen [27] find that promoting environmental cooperation has significant and positive effects on performance in the manufacturing industry. Thus, effectively managing products and services through green activities can help improve companies’ operating performance [28].
In distribution programs, environmental efforts include working with environmentally responsible channel partners to identify reduction and reuse/repurposing opportunities, and encouraging end customers to return recyclable materials [22].
A green operations strategy involves the introduction of environmental concepts into overall supply chains and marketing systems. Environmental protection is considered in each step, from obtaining raw materials to production, consumption, and recycling. Throughout the product lifecycle, each step should conform to the 3Rs (Reduce, Reuse, Recycle) and 3Es (Economic, Ecological, Equitable) in order to meet societal demands [29]. Chen [30] proposed a 5Rs standard (refuse, reduce, reuse, recycle, regenerate) to determine the degree of implementation of green principles.
Bansal and Roth [31] discover that organizational competitiveness and legitimacy drive organizational eco-economic development, and that firms implement environmentally oriented green business operations management measures as a result of competition. Piasecki [32] believes that firms’ environmental protection strategies should consider three factors (economic profits, legal practices, and the scope of responsibility), and these three factors should determine the most appropriate strategy. Chen and Gao [33] develop a comprehensive green production and consumption system assessment framework for business operations, and propose six major framework elements: (1)green products; (2) green production and packaging; (3) green R&D and design; (4) green advertising and marketing; (5) green corporations; and (6) green consumption. These elements serve as core standards to assess a company’s green operations.
Liu [34] believes that the development of the conference and exhibition industry in Taiwan benefits from the following advantages. (1) Taiwan is located in the geographic center of the Asia Pacific region. (2) Taiwan has complete transportation infrastructure. (3) Taiwan has advanced infrastructure and information technology. (4) Taiwan has beautiful natural landscapes and scenery, and a diverse culture. However, there are obstacles to the development of Taiwan’s conference and exhibition industry as well: (1) Taiwan has few exhibition halls and insufficient physical infrastructure. (2) Taiwan suffers from regional traffic congestion, which is difficult to solve. (3) Taiwan suffers from a shortage of specialized conference personnel, and service quality needs improvement. (4) The available accommodation and the F&B industry services surrounding exhibition sites do not meet the demand. (5) Taiwan is insufficiently globalized.

2.4.2. Classification of benefits

Considering the above viewpoints, we classify firms’ perceived benefits from green operations strategies as follows:
1. Functional benefits: This refers to the functions that result from firms’ implementation of green operation strategies. For example, they may provide solutions for current issues, improve product quality and value, produce quality advantages for products or services, or achieve greater reliability and dependability, in addition to creating minimal environmental impact, thereby improving market competitiveness.
2. Symbolic benefits: This refers to the improved corporate image resulting from the implementation of green operations strategies, in addition to the resulting social approval and respect, positive reputation, and advertising effects, thus demonstrating the firm’s social status. Publicizing the implementation of green operation strategies can enhance the public evaluation of the firm.
3. Experiential benefits: This refers to the improvements to production and operation process efficiency resulting from the implementation of green operations strategies. These improvements are expressed within the overall product lifecycle, and comply with the 5Rs of consumption and the 3Es. Green operations strategies thus improve production and operational efficiency and efficacy.
4. Financial benefits: This refers to the profits, revenue, and real economic benefits the firm generates by implementing green operations strategies. This implementation also helps to improve marketing opportunities and sales performance, including improvements to turnover, business growth, market share, and profitability.

3. Research Methodology: Analyzing International Competitiveness

3.1. Green Operations Strategy Management by Porter’s Diamond Model

Michael Porter’s diamond model is a useful technique to identify the factors that the enterprise must consider in the business operation and the interactions between these factors with a consideration of the organizational structure, external competition and strategic decisions. The diamond model comprises four major factors and two accessorial factors (as Table 1).
Michael Porter proposed the diamond model for the competitive advantage of nations [35]. It is primarily used to explore the factors affecting the competitive advantages of national industrial development, and this study adopts it to analyze Taiwan’s competitiveness. A SWOT analysis is a method to develop the industry context by integrating and summarizing the content of various aspects of the internal and external conditions of the enterprise, and then to analyze the organization’s advantages, disadvantages, opportunities, and threats.
The diamond model represents a dynamic system in which interactions between factors strengthen one another. The elements of this system are “factor conditions”, “demand conditions”, “related and supporting industries”, and “firm strategy, structure, and rivalry”, while “government” and “chance” are important factors affecting these elements, as Figure 1 shows.
(1) Factor conditions: Factor conditions typically provide initial competitive advantages and include items such as labor force, capital, natural resources, and basic infrastructure.
(2) Demand conditions: Demand conditions refer to domestic market demand for industrial products and services. Domestic market demand causes firms to explore the needs of new customers, while customers with specific demand pressure firms to conduct innovation, causing them to innovate vigorously to produce greater competitive advantages than their foreign competitors. This means that market demand influences the pace and orientation of product development.
(3) Related and supporting industries: The existence of related and supporting national industries is an important factor in creating and maintaining national competitive advantages. Related and supporting industries form a kind of value chain: their advantage lies in their close mutual cooperative relationships. Because mature suppliers and producers can help industries acquire downstream advantages, industries can often operate more efficiently and rapidly, and utilize prioritized methods to reduce capital investments.
(4) Firm strategy, structure, and rivalry: National environmental backgrounds can affect the establishment, organization, and management tendencies of firms, as well as the degree of domestic competition. Intense domestic competition can promote industrial upgrading, thereby generating long-lasting competitive advantages. Geographic clustering can also strengthen the degree of domestic competition.
(5) Government: Governments encourage and help firms move to higher levels of competition, primarily by influencing the four factors described above to develop competitive advantages; these four factors can also affect governments. This means that governments play an important, though indirect, role. Thus, government influences industrial development through its policy orientation and efficiency towards industry, competition, education, technology, and finance [36].
(6) Chance: This refers to factors external to an industry that are impossible to control and that generate a force that reshapes the structure of an industry and changes its competitive position.
The diamond model fully summaries the factors that affect the competitiveness of an industry. The model highlights the firm’s strategies and the government behaviors so that how an industry can improve its competitiveness according to the identified factors.

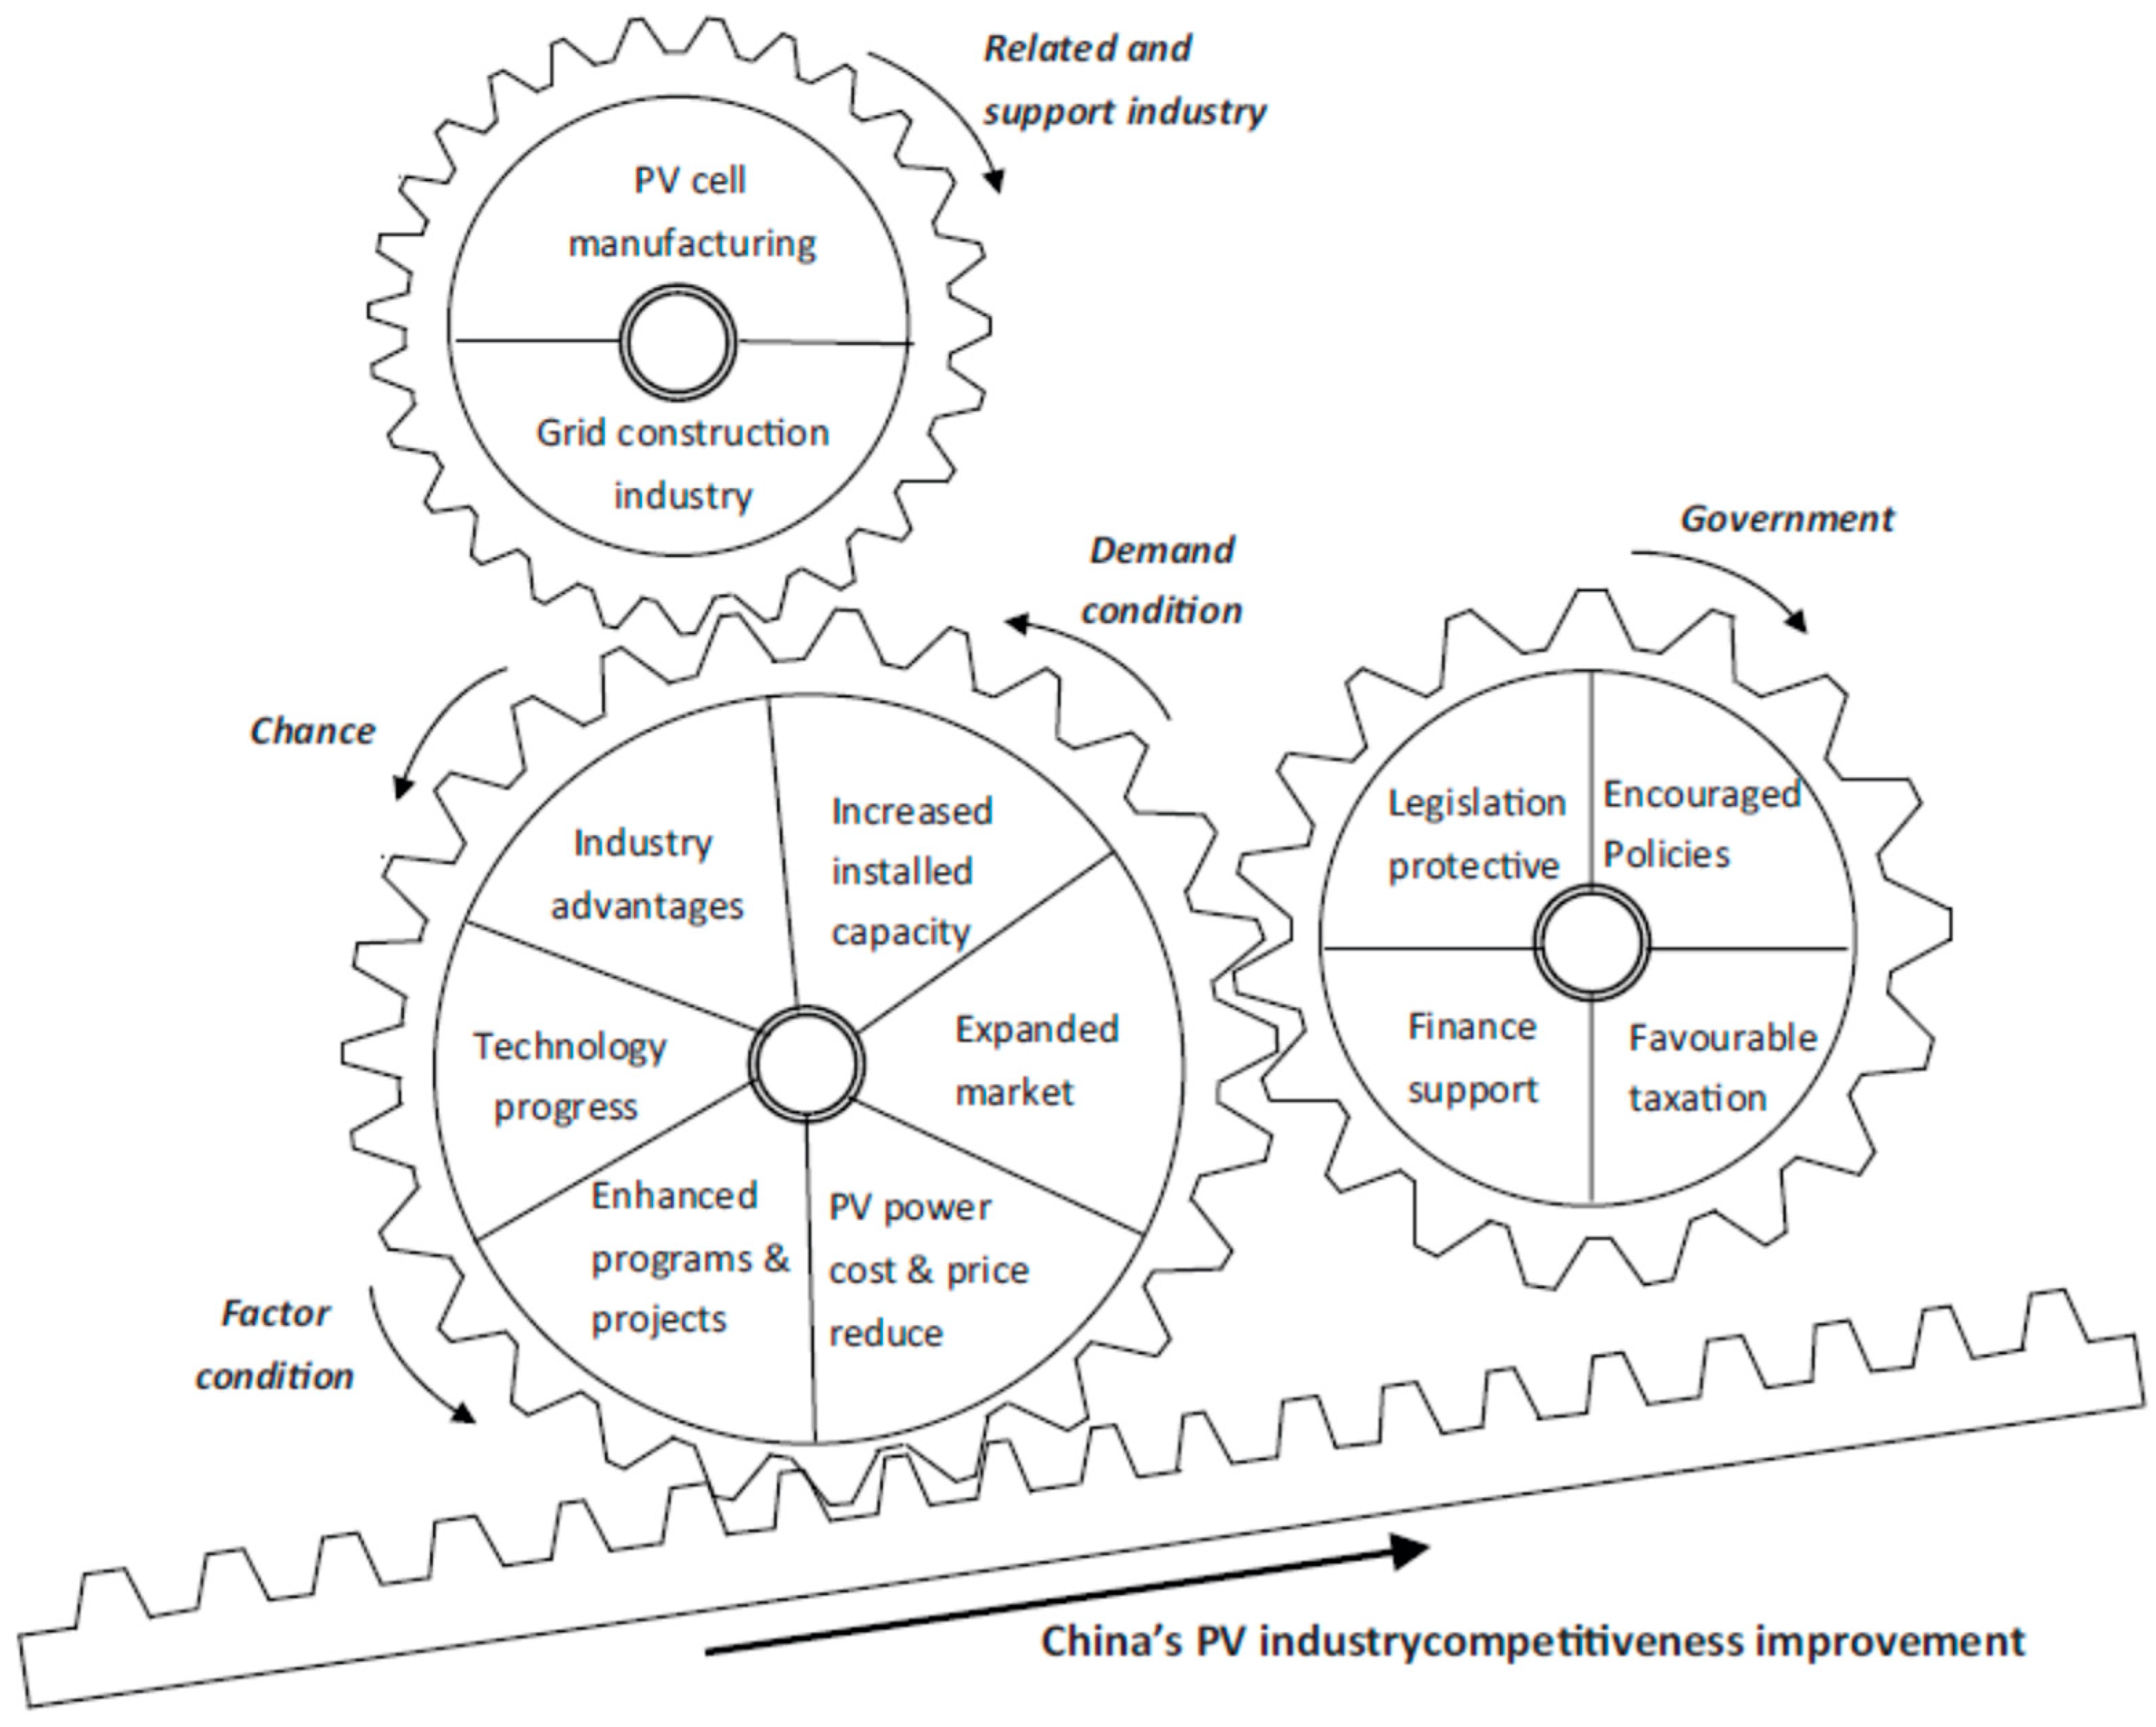
3.2. Gear Model for Improving the Competitiveness Developing of Porter’s Diamond Model

Zhen-yu Zhao [37] adopted the diamond model approach to analyze the factors affecting the competitiveness of the PV power industry in China and developed a gear model to highlight this process (as Figure 2). These factors are: solar resource potential, generation costs and on-grid power price, programs and projects, technology, overall market, installed capacity, on-grid PV systems, industry rules and industry competitions, PV cell manufacturing, grid construction industry, legislation, policies, financial incentives, taxation, industry advantages, and industry challenges. All of these factors affect the competitiveness of China’s PV industry from different angles. Similarly, the interactions between these factors form a joint force to improve the industry competitiveness.
The nature of international competitiveness of country depends on the quality of interrelations between the four determinants of microeconomic level and the two dimensions of macroeconomic level because they can promote a healthy business environment or on the contrary a ill business environment [28,38]. Also, Mitschke [39] presents an opinion on the international competitiveness of a nation has two dimensions (See Figure 3).

3.3. SWOT: Alternative Strategy Formulation and Application

In addition to planning budgets for site construction, MOEA [40] also planned the annual Taiwan Convention and Exhibition Pilot Plan from 2013 to 2016, which analyzes the strengths and weaknesses of Taiwan’s conference and exhibition industry and investigates external environmental opportunities and threats from the perspective of international competition using SWOT methods, as Table 2 shows [41]. The aim of a SWOT analysis is to identify the strengths and weaknesses of an organization from the internal perspective and the opportunities and threats in the external environment [42,43]. SWOT provides a good basis for formulating strategies for both public and private sectors.
Consequently, alternative strategies can be developed for Taiwan’s green conference and exhibition industry to improve their competitiveness by means of linking and integrating factors listed in the SWOT matrix. This is consistent with the Porter’s diamond model [44]. Four exemplar strategies were described as below.

3.4. Green Guidelines by Taiwan’s Conference and Exhibition Industry

This study aims to reduce carbon emissions to implement the purpose of the green conference and exhibition industry and enumerates the weights of various indicators. According to the MOEA [46] Guidelines, the Green Trade Project Office, established by the Ministry of Economic Affairs, and the Industrial Technology Research Institute indicate that “personal transportation” is the primary source of carbon emissions at exhibitions (accounting for more than 90% of the footprint). When that factor is not included, it was found that the chief source of carbon emissions is from “electricity” at 36.59% among which are booths that account for 18.93% and “air conditioning” comprising 11.42%. This category is followed by “nonrecyclable decorating materials” at 20.66% which includes “plywood” which accounts for 16.83% of the total. For conference events, personal transportation is also a prime source of carbon emissions and in that area comprises 90% of the footprint. But outside of the personal transport category, carbon emissions are chiefly from electricity (31.56%) with air conditioning comprising 18.23% of the footprint followed by dining (8.19%). In view of the above, each choice of venue opens several variables linked to carbon emissions in terms of personal transport and electrical use during the event. The carbon footprint in the “exhibitions” category can be substantially reduced not only with energy-saving electrically efficient lighting solutions in the booths, but also by encouraging exhibitors to use systematic, reusable decoration materials. The top priorities for “conference events”, on the other hand, are increasing the energy efficiency of AC systems and gradually reducing meat and increasing the portion of vegetables in meals served.
As a result of the above findings, the Guidelines list transportation, food, accommodation, decoration materials, and the “other” as five key areas to monitor when practicing Green conference and exhibition industry initiatives. Green conference and exhibition industry should focus on cutting travel distances, tactically reduce the amount of food consumed, promote paperless technology, reduce wood decorations, and use recycled resources, reducing energy consumption; all of which underscores the green spirit. The exhibition event organization process is also divided into “pre-exhibition event measures”, “exhibition day’s event measures”, and “post-exhibition event measures” to help participants to better match tactics to their related phases.

4. Promotion of Green Conferences and Exhibitions by the Taiwanese Conference and Exhibition Industry

This section analyzes the conference and exhibition industry by means of a SWOT analysis as well as Porter’s Diamond model of international competitive advantage, and outlines the current status of promoting green conferences and exhibitions.

4.1. Conference and Exhibition Industry Analysis and assumptions

The main orientations of the 2017 Guide for Green Conferences in promoting Taiwan’s green conferences and exhibitions are (1) establishing green standards, (2) promoting green concepts, (3) acquiring international recognition, and (4) incentivizing and counseling. Huang, Qiu, and Weng [47] argue that the key success factors for promoting green conferences and exhibitions are (1) low-carbon transportation planning, (2) providing low-carbon accommodation, (3) using low-carbon decorations, (4) using low-carbon promotional materials, and (5) carbon footprint assessment [48].
As the scholars suggest that there is an important correlation between green conference and exhibition industry and carbon footprint [48], the research hypotheses proposed in this study are as follows.
Hypothesis 1.
The carbon footprint is positively related to the current competitiveness model promoted by Taiwan’s Green Conference and Exhibition Industry.
Hypothesis 2.
The carbon footprint is positively related to the current SWOT analysis of Taiwan Green Conference and Exhibition Industry.

4.2. Porter’s Diamond Model: Conceptual Verification Pattern

Porter [49,50] uses the concept of clusters of identical product groups in which there is considerable competitive pressure. Businesses within clusters usually stimulate each other to increase productivity, foster innovation, and improve business results. Companies operating in such clusters work according to Porter Diamond Model. Porter assumes that the competitiveness of businesses is related to the performance of other businesses. Furthermore, other factors are tied together in the value-added chain in a long-distance relation or a local or regional context [51].
In addition, they have the advantage that they can move very well on the international market and that they can maintain their presence and handle international competition. Examples of large clusters are the Swiss watch industry and the Hollywood film industry [52].
Based on this model as a conceptual theory framework, the author can’t find the literature to verify this model by quantitative research. Only scholars can prove this model with extended development type (as Section 3.2), but some scholars [53] proposed “Measurements on Taiwan’s national customer satisfaction: empirical re-examination on four representative products”, the author believes that it can be used as a measure of indirect verification, and can also be used as a reference for future research.

4.3. Porter’s Diamond Model: Theoretical Analysis and Empirical Application

This study uses the Porter Diamond Model (see Section 3.1) from the perspective of international competitiveness to analyze the environment of the conference and exhibition industry, including factor conditions, demand conditions, related and supporting industries, firm strategy, structure, and rivalry, as well as the two important factors of “government” and “chance.”
Li and Zhan [54] and the American Society of Association Executives (ASAE) [55] define and weight the factors to consider for the selection of exhibition sites. Based on the interrelationship between the various factors of the diamond model, we mapped these factors to the elements of Porter’s model and combine with carbon footprint comprising (using “*”), as well as the two important factors of the industry: conferences and exhibitions. We discuss the various factors below in terms of their importance and relevance (see Table 3, Table 4 and Table 5).
(1) Exhibition hall and conference center infrastructure (85%): This is the most important factor and is composed of the interaction between “factor conditions” and “demand conditions”. Factor conditions include six items, including “comprehensive economic level” and “human and technological resources”.
(2) Conference and exhibition specialized service quality and efficiency (64%): This is the second most important factor and is composed of the interaction between “firm strategy, structure, and rivalry” and “demand conditions”. The former includes two items: “support measures for exhibition venue” and “planning and strategy of conference and exhibition industry”.
(3) Number of hotel rooms (54%): This is the third most important factor and is composed of the interaction between “related and supporting industries” and “factor conditions”. The former includes five items, such as the “tourism industry” and the “transportation and shipping industry”.
(4) Level of government support (53%): This is the fourth most important factor and is composed of the interaction between “demand conditions” and “factor conditions”.
(5) Attractiveness of host location (42%): This is the fifth most important factor and is composed of the interaction between “demand conditions” and “firm strategy, structure, and rivalry”. Demand conditions include “domestic demand” and “foreign demand”.
(6) The influencing factor “government” includes the “conference and exhibition system” and “conference and exhibition policy”.
(7) The influencing factor “chance” includes “administrative innovation and service”, “technological integration of environmental protection, energy savings, and communication”, and “industrial upgrading with international competitiveness.”
According to the MOEA Guidelines [46], the “personal transportation” accounts for more than 90% of the carbon footprint, in the Porter’s Diamond Model 16 factors have only seven relative points. It shows the Diamond Model defective by carbon footprint [48]; Hypothesis 1 has negative correlation.

4.4. SWOT Analysis: Empirical Application with Carbon Footprint

According to the SWOT Matrix of Taiwan’s Conference and Exhibition Industry (see Section 3.3), the carbon footprint only mapping by S1, S2, S3, and W2 (as Table 2). It shows that the strategy of the Conference and Exhibition Industry still needs to be further improved; Hypothesis 2 has negative correlation.
The key orientations of the 2017 Guide for Green Conferences promotion of green conferences and exhibitions within Taiwan’s conference industry include (1) establishing green standards, (2) promoting green concepts, (3) gaining international recognition, and (4) incentivizing and counseling. We outline the industry’s current marketing strategy below, followed by the development of a green conference and exhibition marketing strategy, based on a SWOT analysis [56].

4.4.1. Taiwan Conference and Exhibition Industry Marketing Strategy

In 2009, the MOEA BOFT began promoting the Plan for Improving Taiwanese Conferences and Exhibitions. The marketing strategy portion of this plan is developed according to the four sub-strategies of international marketing strategies, public relations, advertising implementation, and the construction of a comprehensive conference and exhibition web portal in order to market Taiwan’s conference and exhibition industry. The content of this plan is as follows.
1. International Marketing and Promoting the Image of Taiwan’s Conference and Exhibition Industry:
(1) Overall marketing strategy and portfolio allocation strategy planning: This refers to the appropriate and mixed use of advertising and promotional activities employing the most restricted resources to achieve the most complementary relationship, the best communicative effects, and the most balanced promotion.
(2) Domestic and foreign advertising strategy planning and implementation.
(3) Establishing a recognizable image and logo for the conference and exhibition industry and promoting the repositioning of the brand’s international reputation.
(4) Establishing a national image publicity department in order to publicize the image of high-quality Taiwanese products in international convention and exhibition associations.
(5) Strategic implementation of domestic and foreign public relations activities and media promotion, utilization of balanced communications distribution, and publication of communications themes.
2. Constructing, Managing, and Maintaining a Comprehensive Web Portal for Taiwanese Conferences and Exhibitions:
(1) Website maintenance and management: Reconstructing the conference and exhibition web portal includes revising versions of pages in four languages, completing conference and exhibition database content, establishing industrial databases for conference- and exhibition-related industries, and managing conference and exhibition information and communication platforms.
(2) Website marketing and promotion: Planning and conducting online activities to strengthen domestic and foreign online promotion. Advertising tools such as search engine registration and keywords are used to promote the Taiwanese conference and exhibition web portal; virtual marketing cooperation negotiated with foreign conferences and exhibitions. Other subplans will help to promote the Plan for Improving Taiwanese Conferences and Exhibitions.

4.4.2. Marketing Strategy for Taiwan’s Green Conferences and Exhibitions

Green Conferences and Exhibitions represent the integration of the global trends of environmentally friendly and energy-saving concepts into the conference and exhibition industry. In addition to the cooperation of host organizations and related industrial chains that promote green conferences and exhibitions in Taiwan, the questions of how to strengthen their value, improve consumer acceptance, and increase the scale of the target market depend on the overall holistic marketing strategic planning and implementation efficacy. The concept of holistic marketing argues that the marketing plan, process, activity development, design, and implementation elements of marketing must be interlinked, interrelated, and interdependent. Consequently, marketing activities and studies should present comprehensive and holistic arguments. Holistic marketing aims to reconcile the marketing philosophy, methodologies, and framework of complex marketing activities. This includes the four main topics in Figure 4 [57], which we discuss in the sections that follow.

4.4.3. Integration of SWOT Analysis to Formulate Marketing Strategies

This study uses SWOT analysis methods in conjunction with holistic marketing strategies such as marketing networks, cross-domain integration, company-wide actions, and public image policies to expand the scale of Taiwan’s green conference and exhibition market. We describe this method in detail below by outlining the activities that comprise each strategy. We indicate the strategic focus for each strategy (for example, S-O refers to a strategy that responds in terms of the industry’s strengths and opportunities):
1. S-O (Growth) Marketing Strategy:
(1) Promoting tourism industry product combinations with high cost–performance (CP) ratios, and integrating green conference centers in order to create market differentiation within an expanded market. This occurs, for example, through an appropriate combination of planning for transportation and tourism in the geographic locations of conference and exhibition centers, in addition to offering discounted prices and convenient services.
(2) Implementing discount offers and convenience measures for international exhibitors, in addition to using green transportation and accommodation services to attract international attention, such as by offering preferred customs clearance or reduced tax on certain items during the exhibition period.
(3) The use of local innovative technology products in green conference and exhibition centers, and using the characteristics and advantages of these products in promotional activities, such as utilizing solar power technology products or interactive energy-saving equipment in conference centers for promotional purposes.
2. S-T (Diverse) Marketing Strategy:
(1) Introducing green energy technologies into exhibition brands that already possess international recognition and using public and private capabilities to improve international recognition, such as by integrating booths for solar power equipment producers in annual international exhibitions.
(2) Creating regional strategic green energy alliances with countries in the Asia-Pacific region, or introducing international green certifications, combined with the use of advantageous marketing strategies to display regional characteristics. This could be accomplished through, for example, a Southeast Asian green energy alliance or green ISO certifications.
(3) Using international training mechanisms and public capabilities can help private organizations manage important responsibilities and gain accession to international conference and exhibition organizations. This would aid in promoting Taiwan’s green conference and exhibition industry. For example, the government may promote counseling for certification training and testing courses and arrange for the observation of international exhibitions.
(4) The conference and exhibition tourism industry helps advance urban development and promote a national image.
3. W-O (Reverse) Marketing Strategies:
(1) Promote Taiwan’s green exhibitions and conferences in combination with global green energy trends and timely topics, and use relevant organizations to establish standards for reward and sanctions based on the goal of achieving energy efficiency in conferences and exhibitions, thereby improving Taiwan’s image. This can happen, for example, by penalizing host organizations or manufacturers with green energy utilization rates of less than 50% with fines or exclusion from exhibition participation.
(2) The government may gradually increase budgets each year and improve soft and hard flight facilities to expand the breadth of flight destinations, thereby further integrating advantageous marketing strategies to improve international reputation. This could include constructing airports and planning flights according to the layout of mass transportation facilities, thereby using energy savings and green routes to expand the conference and exhibition market.
(3) The public and academic sector could establish institutions to train international conference and exhibition personnel. Global exchanges can improve the strength of personnel and increase the trend setting power of international green conferences and exhibitions. This can be accomplished by increasing the training of conference and exhibition industry personnel in the tourism and hospitality departments of academic institutions or by introducing personnel training for industries adjacent to the conference and exhibition industry.
4. W-T (Defensive) Marketing Strategy:
(1) Governments can provide preferential funding assistance to green conferences and exhibitions, which would then transfer to derivative advertising benefits, or could shift to cover costs. This method involves sacrificing short-term interests for long-term benefit, and can improve Asia’s market competitiveness.
(2) Green exhibition centers should be linked with transportation systems and airports. These exhibition centers should have environmentally friendly functionalities such as green architecture, green transportation, and green hotels. This could strengthen market differentiation. For example, Taoyuan Aerotropolis’s business model could be used to expand the international conference and exhibition market [58].
(3) Increasing the ratios of green conference and exhibition monetary incentives, and using Taiwan Conference and Exhibition Identity Cards and the Smart Exhibition Hall Consumer Services Program jointly with adjacent industries, would provide promotion and technologically convenient services. This would improve the market competitiveness of Taiwan’s green conference and exhibition industry by using diverse incentive mechanisms.

5. Conclusions and Recommendations

5.1. Conclusions

Hosting conference and exhibition events could create objective and economic benefits, while also indirectly improving the environment of conference and exhibition locations, since hosting such events involves a breadth of linkages and influences, including venues, transportation networks, urban environs, and basic infrastructure. Hosting conferences and exhibitions also attracts international visitors who wish to explore the country, thus providing the opportunity to improve the nation’s international reputation and image. In this way, these events function as marketing mechanisms for countries and cities. National and municipal governments are investing resources to promote the development of the conference and exhibition industry; therefore, the competition to serve as a host city is intensifying [59]. After using Porter’s Diamond Model and considering the perspective of international competitiveness to analyze each factor of the conference and exhibition industry, this study finds that the combined impact of factor conditions and demand conditions are of greatest importance, meaning that this relationship should serve as the basis for developing green conference and exhibition marketing strategies.
Green marketing considers not only the profits of individual firms but also the needs of consumers and the relationships among competitors. In addition, green marketing encompasses the social responsibilities of corporations and responsibilities toward the earth. Therefore, the concept of “responsible consumption” applies to consumers [60].
The concept of “holistic marketing” argues that the marketing plan, process, activity development, design, and implementation must be interlinked, interrelated, and interdependent. This study applies a SWOT analysis of each feature of Taiwan’s conference and exhibition industry, along with holistic marketing concepts, to summarize the marketing strategies of Taiwan’s conferences and exhibitions for increasing economies of scale and promoting the development of related industries. Many international conference and exhibition events consider host organizations’ implementation of environmentally friendly concepts and their spirit of sustainability as important factors for host location selection. Thus, this study’s proposition to use holistic marketing strategies to promote Taiwanese green conferences and exhibitions also carries the expectation that governments with limited resources will integrate the combined economic effects of competitive industries involved in such exhibitions. Furthermore, the question of how to determine the placement of exhibition venues and improve the basic infrastructure of exhibition halls is urgent and complex. It is also necessary to actively consider the trends of regional markets and increase market competitiveness in line with global market demand and modern trends.
This study demonstrates that the “carbon footprint” ratio needs to be further improved in energy conservation strategies. At the same time, it can encourage the industry to propose innovative ideas for energy-saving technology research and development. On 27 November 2018, the Taiwan Cement Ltd. held a press conference on “Turning the mud carbon cycle and turning the green economy” and published two carbon cycle “shrimp” products, which opened up new opportunities for the circular economy. From the core technology of the CO2 Capture and Storage (CCS) system to the biocarbon sequestration of Haematococcus pluvialis, a high-value shrimp red algae was cultivated, and the platform mud was jointly developed by the Institute of Industrial Science and Technology. The world’s first bowl of carbon-reducing environmental protection surface, astaxanthin red algae soba noodles, one kilogram of astaxanthin red algae, can absorb 1.83 kilograms of carbon dioxide, seven bowls of surface carbon reduction, which is approximately equal to a football-sized carbon dioxide The amount of fifteen bowls is equivalent to a tree, and the average amount of carbon is reduced every day. In addition, through the most advanced and low-energy technology, a high concentration of astaxanthin is extracted, and the “salofin series maintenance" is launched to create carbon reduction. It also promotes Taiwan to have an advantage in the international competitiveness level and exert influence in the global environmentally sustainable development trend.

5.2. Recommendations

This study proposes several recommendations for Taiwan’s green conference and exhibition strategy:
(1) The government should establish a dedicated national green exhibition marketing agency, combining all relevant departments, to promote general marketing strategies.
(2) Existing organizations should be divided into NPOs and policy-oriented organizations, and should counsel private conference and exhibition host organizations on methods to improve international competitiveness and guarantee mechanisms for sustained organizational innovation.
(3) The government should clearly stipulate advantageous combinations for to promote green conference and exhibition development; these should have a tendency towards holistic marketing strategies.
(4) Cross-strait exchange mechanisms should be used to increase market share and promote the international position of Taiwan’s green conferences and exhibitions.

5.3. Limitations and Further Research

Taiwan’s conference and exhibition industry are limited by economic scale and political situation, and lacks opportunities to show advantages. Researchers are also committed to the academic platform to gain a status of commentary while exploring the current situation, thereby enhancing overall competitiveness.
Future research should focus on how to achieve a mutually beneficial and co-prosperous environment in conjunction with global regional organizations to create a sustainable environment for coexistence.

Author Contributions

Conceptualization, S.-P.W. and M.-J.L.; Methodology, S.-P.W.; Software, S.-P.W.; Validation, S.-P.W., M.-J.L. and S.-P.W.; Formal Analysis, M.-J.L.; Investigation, S.-P.W.; Resources, M.-J.L.; Data Curation, S.-P.W.; Writing-Original Draft Preparation, M.-J.L.; Writing-Review & Editing, S.-P.W.

Funding

This research received no external funding.

Conflicts of Interest

The authors declare no conflicts of interest.

References

  1. WEF. The Global Competitiveness Report 2018. Available online: http://www3.weforum.org/docs/GCR2018/05FullReport/TheGlobalCompetitivenessReport2018.pdf (accessed on 18 October2018).
  2. Leigh, N.G.; Lee, H. Sustainable and Resilient Urban Water Systems: The Role of Decentralization and Planning. Sustainability 2019, 11, 918. [Google Scholar] [CrossRef]
  3. Seeliger, L.; Turok, I. Towards sustainable cities: Extending resilience with insights from vulnerability and transition theory. Sustainability 2013, 5, 2108–2128. [Google Scholar] [CrossRef]
  4. Oppermann, M. Convention destination images: Analysis of association meeting planners’ perceptions. Tour. Manag. 1996, 17, 175–182. [Google Scholar] [CrossRef]
  5. Bai, Y. Current development potential of Taiwan’s conference industry. Econ. Outlook Bimon. 2006, 104, 72–75. [Google Scholar]
  6. Sharma, A.; Iyer, G.R.; Mehrotra, A.; Krishnan, R. Sustainability and business to business marketing: A framework and implications. Ind. Mark. Manag. 2010, 39, 330–341. [Google Scholar] [CrossRef]
  7. Mi, Z.; Guan, D.; Liu, Z.; Liu, J.; Vigui_e, V.; Fromer, N.; Wang, Y. Cities: The core of climate change mitigation. J. Clean. Prod. 2019, 207, 582–589. [Google Scholar] [CrossRef]
  8. Nykiel, R.A. Hospitality Management Strategies; Pearson Prentice Hall: New York, NY, USA, 2005. [Google Scholar]
  9. Meet Taiwan (n.d.). Available online: from https://www.meettaiwan.com/en_US/index.html (accessed on 17 August 2017).
  10. Zhu, Z. Exhibition Event Planning; MOEA Department of Commerce: Taipei, Taiwan, 2009. [Google Scholar]
  11. Huang, Z. Exhibition Industry Overview: A Series on the Exhibition and Conference Service Industry; MOEA: Taipei, Taiwan, 2010. [Google Scholar]
  12. Wen, Y.; Duan, E. Exhibitor Marketing; Taiwan External Trade Council: Taipei, Taiwan, 2008. [Google Scholar]
  13. Qiu, C.; Chen, Y.; You, C.; Zhang, W.; Lin, Y.; Xu, X. Exploring the key success factors in promoting Taiwan’s international forums and exhibitions. Manag. Inf. Comput. 2014, 3, 99–119. [Google Scholar]
  14. MOEA BOFT. Green Conferences. Available online: from https://www.meettaiwan.com/zh_TW/index.html (accessed on 17 August 2017).
  15. Lu, Z.; Huang, Z. The relationship between green supply chain management, quality management activities, and economic performance for backlight modules. Qual. J. 2009, 45, 35–39. [Google Scholar]
  16. Guide for Green Conferences (n.d.). MEET Taiwan. Available online: https://www.meettaiwan.com/zh_TW/menu/M0000869/%E7%B6%A0%E8%89%B2%E6%9C%83%E5%B1%95%E6%8C%87%E5%8D%97.html?function=M0000869 (accessed on 17 August 2018).
  17. Drucker, P. Management Tasks, Responsibilities, Practices; Commonwealth Magazine Publishing: Taipei, Taiwan, 2002. [Google Scholar]
  18. Kotler, P. Philip Kotler’s FAQs on Marketing; Heliopolis Publishing: Taipei, Taiwan, 2005. [Google Scholar]
  19. Kotler, P. Kellogg on Branding: The Marketing Faculty of the Kellogg School of Management; John Wiley & Sons: Taipei, Taiwan, 2011. [Google Scholar]
  20. Kotler, P. Kotler on Marketing; YLib Publishing: Taipei, Taiwan, 2000. [Google Scholar]
  21. Kotler, P.; Kartajaya, H.; Setiajan, I. Marketing 3.0: From Products to Customers to the Human Spirit; Commonwealth Magazine: Taipei, Taiwan, 2011. [Google Scholar]
  22. Leonidou, C.N.; Katsikeas, C.S.; Morgan, N.A. “Greening” the marketing mix: Do firms do it and does it pay off? J. Acad. Mark. Sci. 2013, 41, 151–170. [Google Scholar] [CrossRef]
  23. Chen, Y.S. The drivers of green brand equity: Green brand image, green satisfaction, and green trust. J. Bus. Ethics 2010, 93, 307–319. [Google Scholar] [CrossRef]
  24. Rao, S.; Stenger, A.J.; Young, R.R. Corporate framework for developing and analyzing logistics strategies. Counc. Logist. Manag. 1988, 1, 243–262. [Google Scholar]
  25. Maxwell, J.; Rothenberg, S.; Briscoe, F.; Marcus, A. Green schemes: Corporate environmental strategies and their implementation. Calif. Manag. Rev. 1997, 39, 118–134. [Google Scholar]
  26. Sarkis, J. A strategic decision framework for green supply chain management. J. Clean. Prod. 2003, 11, 397–409. [Google Scholar] [CrossRef]
  27. Vachon, S.; Klassen, R.D. Environmental management and manufacturing performance: The role of collaboration in the supply chain. Int. J. Prod. Econ. 2008, 111, 299–315. [Google Scholar] [CrossRef]
  28. Liu, D.-Y.; Hsu, H.-F. An international comparison of empirical generalized double diamond model approaches to Taiwan and Korea, Competitiveness Review. Int. Bus. J. 2009, 19, 160–174. [Google Scholar]
  29. Chai, S. Green Consumption. Green Mark Newsletter. Volume 1, pp. 4–7. Available online: http://readopac3.ncl.edu.tw/nclserialFront/search/detail.jsp?sysId=0005501976&dtdId=000040&search_type=detail&la=ch&checked=&unchecked=0610005524075,0620005524076,0630005524077,0640005524078,0650005501976,0660005501977,0670005501978,0680005501979,0690005489005,0700005489006,0710005480730,0720005480731,0730005480732,0740005480733,0750005468236,0760005473262,0770005473263,0780005473264,0790005473265 (accessed on 17 August 2017).
  30. Chen, M. Green consumption begins in daily life. Green Mark Newslett. 2001, 25, 6. [Google Scholar]
  31. Bansal, P.; Roth, K. Why companies go green: A model of ecological responsiveness. Acad. Manag. J. 2000, 43, 717–736. [Google Scholar] [CrossRef]
  32. Piasecki, B. Corporate Environmental Strategy: The Avalanche of Change Since Bhopal; John Wiley & Sons: New York, NY, USA, 1995. [Google Scholar]
  33. Chen, Q.; Gao, Y. Development and analysis of green production and consumption systems assessment frameworks. J. Hum. Soc. Sci. 2005, 1, 1–17. [Google Scholar]
  34. Liu, F. Taiwan Service Alliance: Expanding the Transformation of the Exhibition Industry. Taiwan Coalition of Service Industries. Available online: http://www.twcsi.org.tw/topic_detail.php?Iid=129 (accessed on 17 August 2017).
  35. Porter, M.E. The competitive advantage of nations. Harv. Bus. Rev. 1990, 68, 73–93. [Google Scholar]
  36. Zhu, Y. Industrial Analysis, 3rd ed.; Wunan Books: Taipei, Taiwan, 2006. [Google Scholar]
  37. Zhao, Z.Y.; Zhang, S.Y.; Zuo, J. A critical analysis of the photovoltaic power industry in China—From diamond model to gear model. Renew. Sustain. Energy Rev. 2011, 15, 4963–4971. [Google Scholar] [CrossRef]
  38. Mihaela Herciu, Measuring International Competitiveness of Romania by Using Porter’s Diamond and Revealed Comparative Advantage. Procedia Econ. Financ. 2013, 6, 273–279. [CrossRef]
  39. Mitschke, A. The Influence of National Competitiveness Policy on the International Competitiveness of Nations; Springer: Berlin, Germany, 2008. [Google Scholar]
  40. MOEA BOFT. Plan for Improving Taiwanese Conferences and Exhibitions. Available online: http://www.moea.gov.tw/MNS/english/home/English.aspx (accessed on 17 August 2018).
  41. MOEA. Report on the Overall Development Strategy and Practices of Taiwan’s Exhibition Industry. Available online: lci.ly.gov.tw/LyLCEW/agenda1/02/word/08/07/…/LCEWA01_080705_00189.doc (accessed on 17 August 2018).
  42. Dyson, R.G. Strategic Development and SWOT Analysis at the University of Warwick. Eur. J. Oper. Res. 2004, 152, 631–640. [Google Scholar] [CrossRef]
  43. Pearce, P. Construction Marketing: A Professional Approach, 1st ed.; Thomas Telford: London, UK, 1992. [Google Scholar]
  44. Wang, K.L.; Hong, W.C. Competitive advantage analysis and strategy formulation of airport city development the case of Taiwan. Transp. Policy 2011, 18, 276–288. [Google Scholar] [CrossRef]
  45. Lawson, A.B.; Biggeri, A.B.; Boehning, D.; Lesaffre, E.; Viel, J.F.; Clark, A.; Divino, F. Disease mapping models: An empirical evaluation. Disease Mapping Collaborative Group. Stat. Med. 2000, 19, 2217–2241. [Google Scholar] [CrossRef] [PubMed]
  46. MOEA. Research Report on the 2018 Green Exhibition Guide. Available online: https://www.meettaiwan.com/mtfiles/mt//menu/201810/1539913256276-0.pdf (accessed on 1 October 2018).
  47. Huang, S.; Qiu, C.; Weng, Z. Success factors for promoting green conferences and exhibitions. Manag. Inf. Comput. 2011, 8, 208–220. [Google Scholar]
  48. Carbon Inventory: ISO 14064-1. Green Exhibition (n.d.). Available online: https://www.meettaiwan.com/zh_TW/menu/M0000886/%E7%A2%B3%E7%9B%A4%E6%9F%A5%EF%BC%9AISO%2014064-1.html?function=M0000886 (accessed on 17 August 2017).
  49. Porter, M.E. Competitive Advantage of Nations: Creating and Sustaining Superior Performance; Simon and Schuster: New York, NY, USA, 2011. [Google Scholar]
  50. Porter, M.E. Towards a dynamic theory of strategy. Strateg. Manag. J. 1991, 12, 95–117. [Google Scholar] [CrossRef] [Green Version]
  51. Mulder, P. Porter Diamond Model. Available online: https://www.toolshero.com/strategy/porter-diamond-model/ (accessed on 17 August 2018).
  52. Riasi, A. Competitive advantages of shadow banking industry: An analysis using Porter diamond model. Bus. Manag. Strateg. 2015, 6, 15–27. [Google Scholar] [CrossRef]
  53. Wang, H.B. Measurements on Taiwan’s national customer satisfaction: Empirical re-examination on four representative products. Int. J. Organ. Innov. 2012, 4, 175–195. [Google Scholar]
  54. Li, S.; Zhan, F. Developing competitiveness in the Guiyang exhibition and conference industry: A study based on the Porter Diamond Model. Mark. Modern. Mag. 2009, 10, 77–78. [Google Scholar]
  55. Statistics of the International Conference Association Released (2016, May 30). Available online: https://www.meettaiwan.com/zh_TW/news/2016050032/6/%E5%9C%8B%E9%9A%9B%E6%9C%83%E8%AD%B0%E5%8D%94%E6%9C%832015%E5%B9%B4%E7%B5%B1%E8%A8%88%E8%B3%87%E6%96%99%E5%87%BA%E7%88%90.html?function=3D9904CB8BD5DDC6D0636733C6861689 (accessed on 17 August 2018).
  56. Institute for Information Industry. III Integration of Tourism Information, and Messaging Apps in the Internet of Things to Create a Smart Conference and Tourism Service in Kaohsiung. Available online: http://www.iii.org.tw/Press/NewsDtl.aspx?nsp_sqno=1473&fm_sqno=14 (accessed on 17 August 2017).
  57. Kotler, P.; Keller, K. Marketing Management, 14th ed.; Donghwa Publishing: Taipei, Taiwan, 2012. [Google Scholar]
  58. Taoyuan Aerotropoils (n.d.). Available online: http://taoyuan-aerotropolis.com/en_content/index.aspx (accessed on 17 August 2018).
  59. Lin, M. Development status of Asia’s exhibition and conference industry. Taiwan Econ. Res. Mon. 2014, 37, 85–92. [Google Scholar]
  60. Wang, L. The new model of enterprise marketing: Green marketing. J. Environ. Manag. 2000, 1, 165–176. [Google Scholar]
Figure 1. The Porter’s Diamond Model. Source: Porter (1990).
Sustainability 11 01220 g001
Figure 2. The Gear model of dynamic competitiveness improvement progress. Source: Zhen-yu Zhao, et al. (2011) [37].
Sustainability 11 01220 g002
Figure 3. The dimensions of international competitiveness of nations, Source: Mitschke (2008) [39].
Sustainability 11 01220 g003
Figure 4. Holistic marketing components. Source: Kotler (2012) [57].
Sustainability 11 01220 g004
Table 1. Factors of the diamond model, adapted from Porter [35].
ComponentsContent
Major factors
Factor conditionFactor of production such as human resources, capital resources, and research and development.
Demand conditionConstruction market and its development that helps companies develop a competitiveness advantage.
Related and support industryMeasures of access to capable, financial support, and firms in related fields.
Firm strategy, structure, and rivalryThe local context and rules, the incentive systems, and open and vigorous competition.
Accessorial factors
GovernmentThe role of the host country government.
ChanceEvents are occurrences that are outside of control of a firm.
Table 2. SWOT matrix of Taiwan’s conference and exhibition industry.
StrengthsWeaknesses
S1: Completion of a number of industrial clustersW1: Taiwan’s conference market is relatively small
S2: Innovative technological applicationsW2: Insufficient international flights and destinations
S3: Rich tourism resourcesW3: Insufficient international conference staff
S4: The government considers the conference and exhibition industry a key development industryW4: Relatively small scale in domestic conference and exhibition industry members.
S5: Taiwan is located in the center of the Asia-Pacific region.
OpportunitiesThreats
O1: Some conventional brands already have an international reputationT1: Fierce competition from Asian conference holding cities
O2: The Asia-Pacific region is an emerging conference marketT2: Construction of new conference centers by neighboring Asian countries
O3: The government assists with entrance to important international conference organizations and is responsible for key aspects.T3: Provision of conference incentives by neighboring Asian countries
T4: Active training of conference personnel by neighboring Asian countries.
Source: MOEA (2015) [41,45].
Table 3. Porter’s Diamond Model analysis of the conference and exhibition industry.
Factor ElementABCDE
Relevance Element
AAA1BA1 (53%)CA1 (54%)DA1 (41%)E1
AA2BA2 (26%)CA2 (32%)
AA3
AA4
AA5
AA6
BAB1 (85%) *BB1CB1 (27%) *DB1 (64%)E2
BB2
CAC1 (16%) *BC1 (12%)CC1DC1 (33%)
AC2 (10%)CC2
CC3
CC4
CC5
DAD1 (10%)BD1 (42%)CD1 (11%) *DD1
AD2 (17%)DD2
FF1 F2 F3
Source: Author’s compilation (“*”: carbon footprint) [48].
Table 4. The analysis of factors in Porter’s Diamond Model.
A. Factor ConditionsAA1. Comprehensive economic level
AA2. Location environment
AA3. Natural environment
AA4. Cultural environment
AA5. Basic urban infrastructure
AA6. Human and technological resources
B. Demand ConditionsBB1. Domestic demand
BB2. Foreign demand
C. Related and Support IndustriesCC1. Tourism industry
CC2. Hotel industry
CC3. Transportation and shipping industry
CC4. Communication industry
CC5. Advertising industry
D. Firm Strategy, Structure, and RivalryDD1. Support measures for exhibition venue
DD2. Planning and strategy of conference and exhibition industry
E. GovernmentE1. Conference and exhibition system
E2. Conference and exhibition policies
F. ChanceF1. Administrative innovation and service
F2. Technological integration of environmental protection, energy savings, and communication
F3. Industrial upgrading with international competitiveness
Source: Li and Zhan (2009) [54].
Table 5. Analysis of factors in Porter’s Diamond Model by American Society of Association Executives (ASAE).
A. Factor ConditionsAB1. Exhibition hall and conference center infrastructure (85%)
AC1. Festival activities (16%)
AC2. Other (10%): Including purchases, local resident language ability, ADA infrastructure, etc.
AD1. Climate (10%)
AD2. Accessibility of host location (17%)
B. Demand ConditionsBA1. Level of government support (53%)
BA2. Overall cost (26%)
BC1. Scenic tourism (12%)
BD1. Attractiveness of host location (42%)
C. Related and Support IndustriesCA1. Number of hotel rooms (54%)
CA2. Convenience of transportation (32%)
CB1. F&B service quality (27%)
CD1. Leisure activities (11%)
D. Firm Strategy, Structure, and RivalryDA1. Appearance of host location (41%)
DB1. Conference service quality and efficiency (64%)
DC1. Safety and friendliness of local environment (33%)
Source: Author’s compilation and ASAE [25].

