Features, Driving Forces and Transition of the Household Energy Consumption in China: A Review


Abstract
1. Introduction
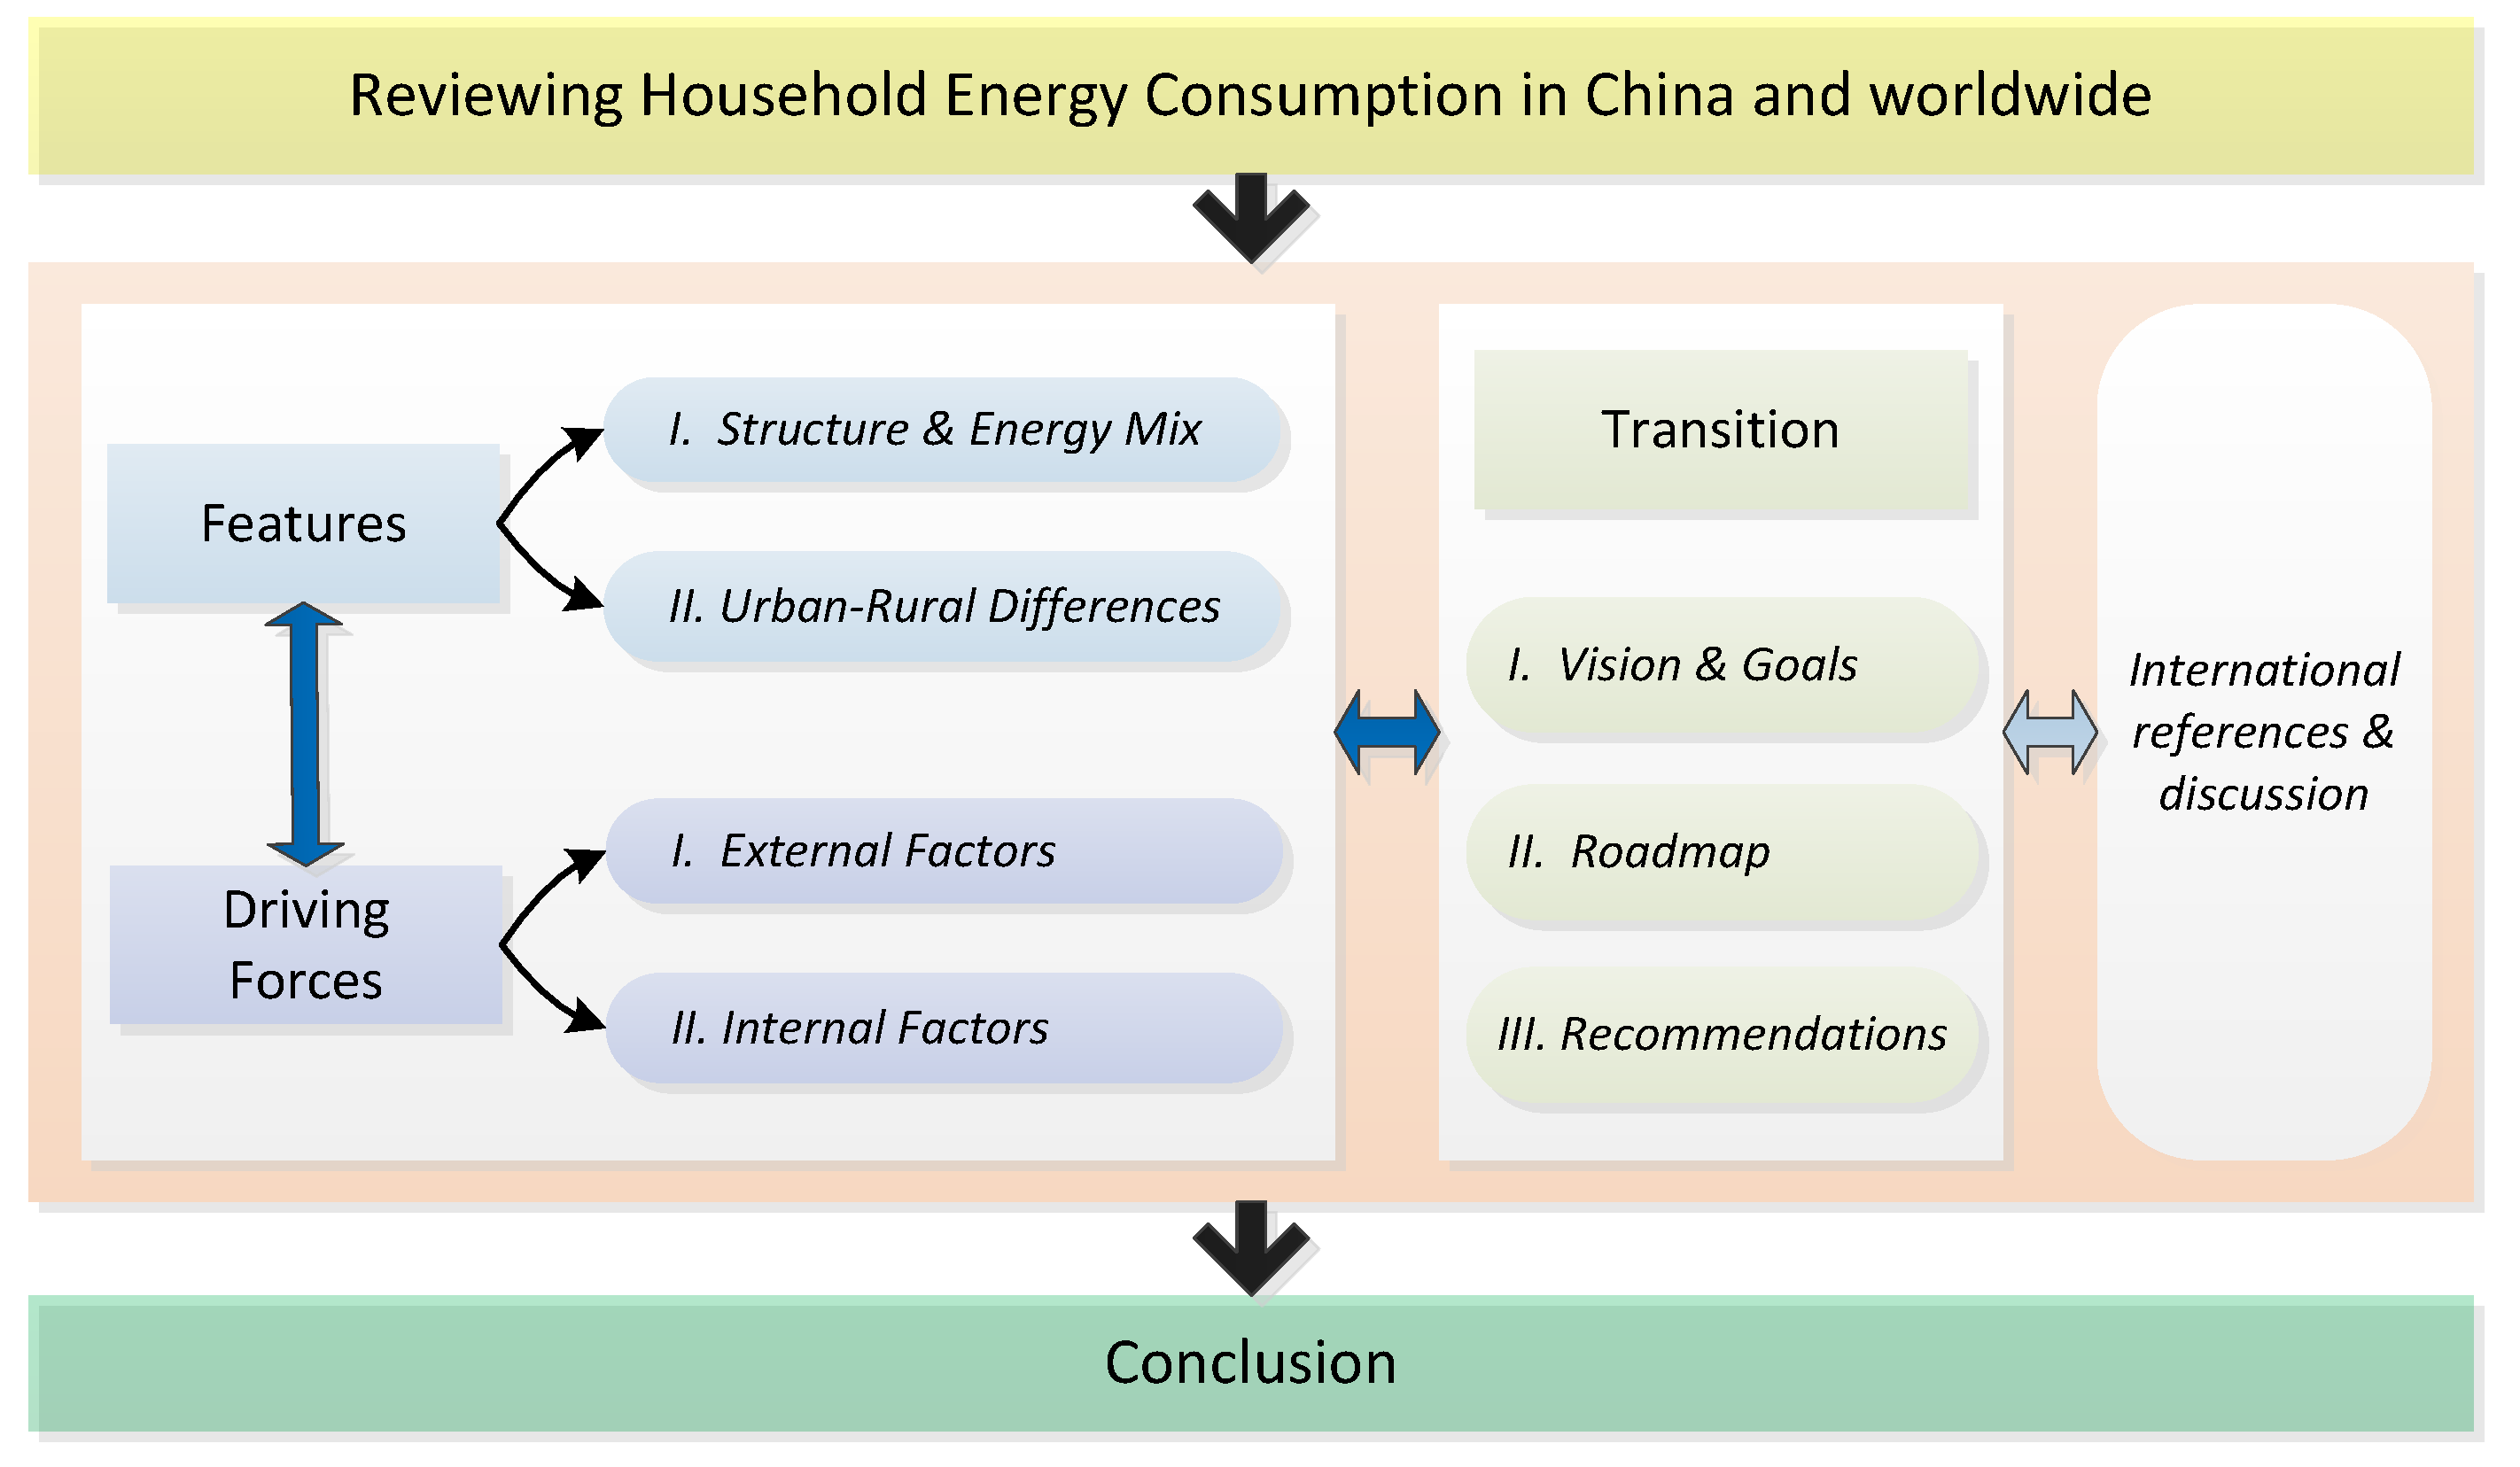
2. Literature Review and Analytical Framework
3. Methods and Data
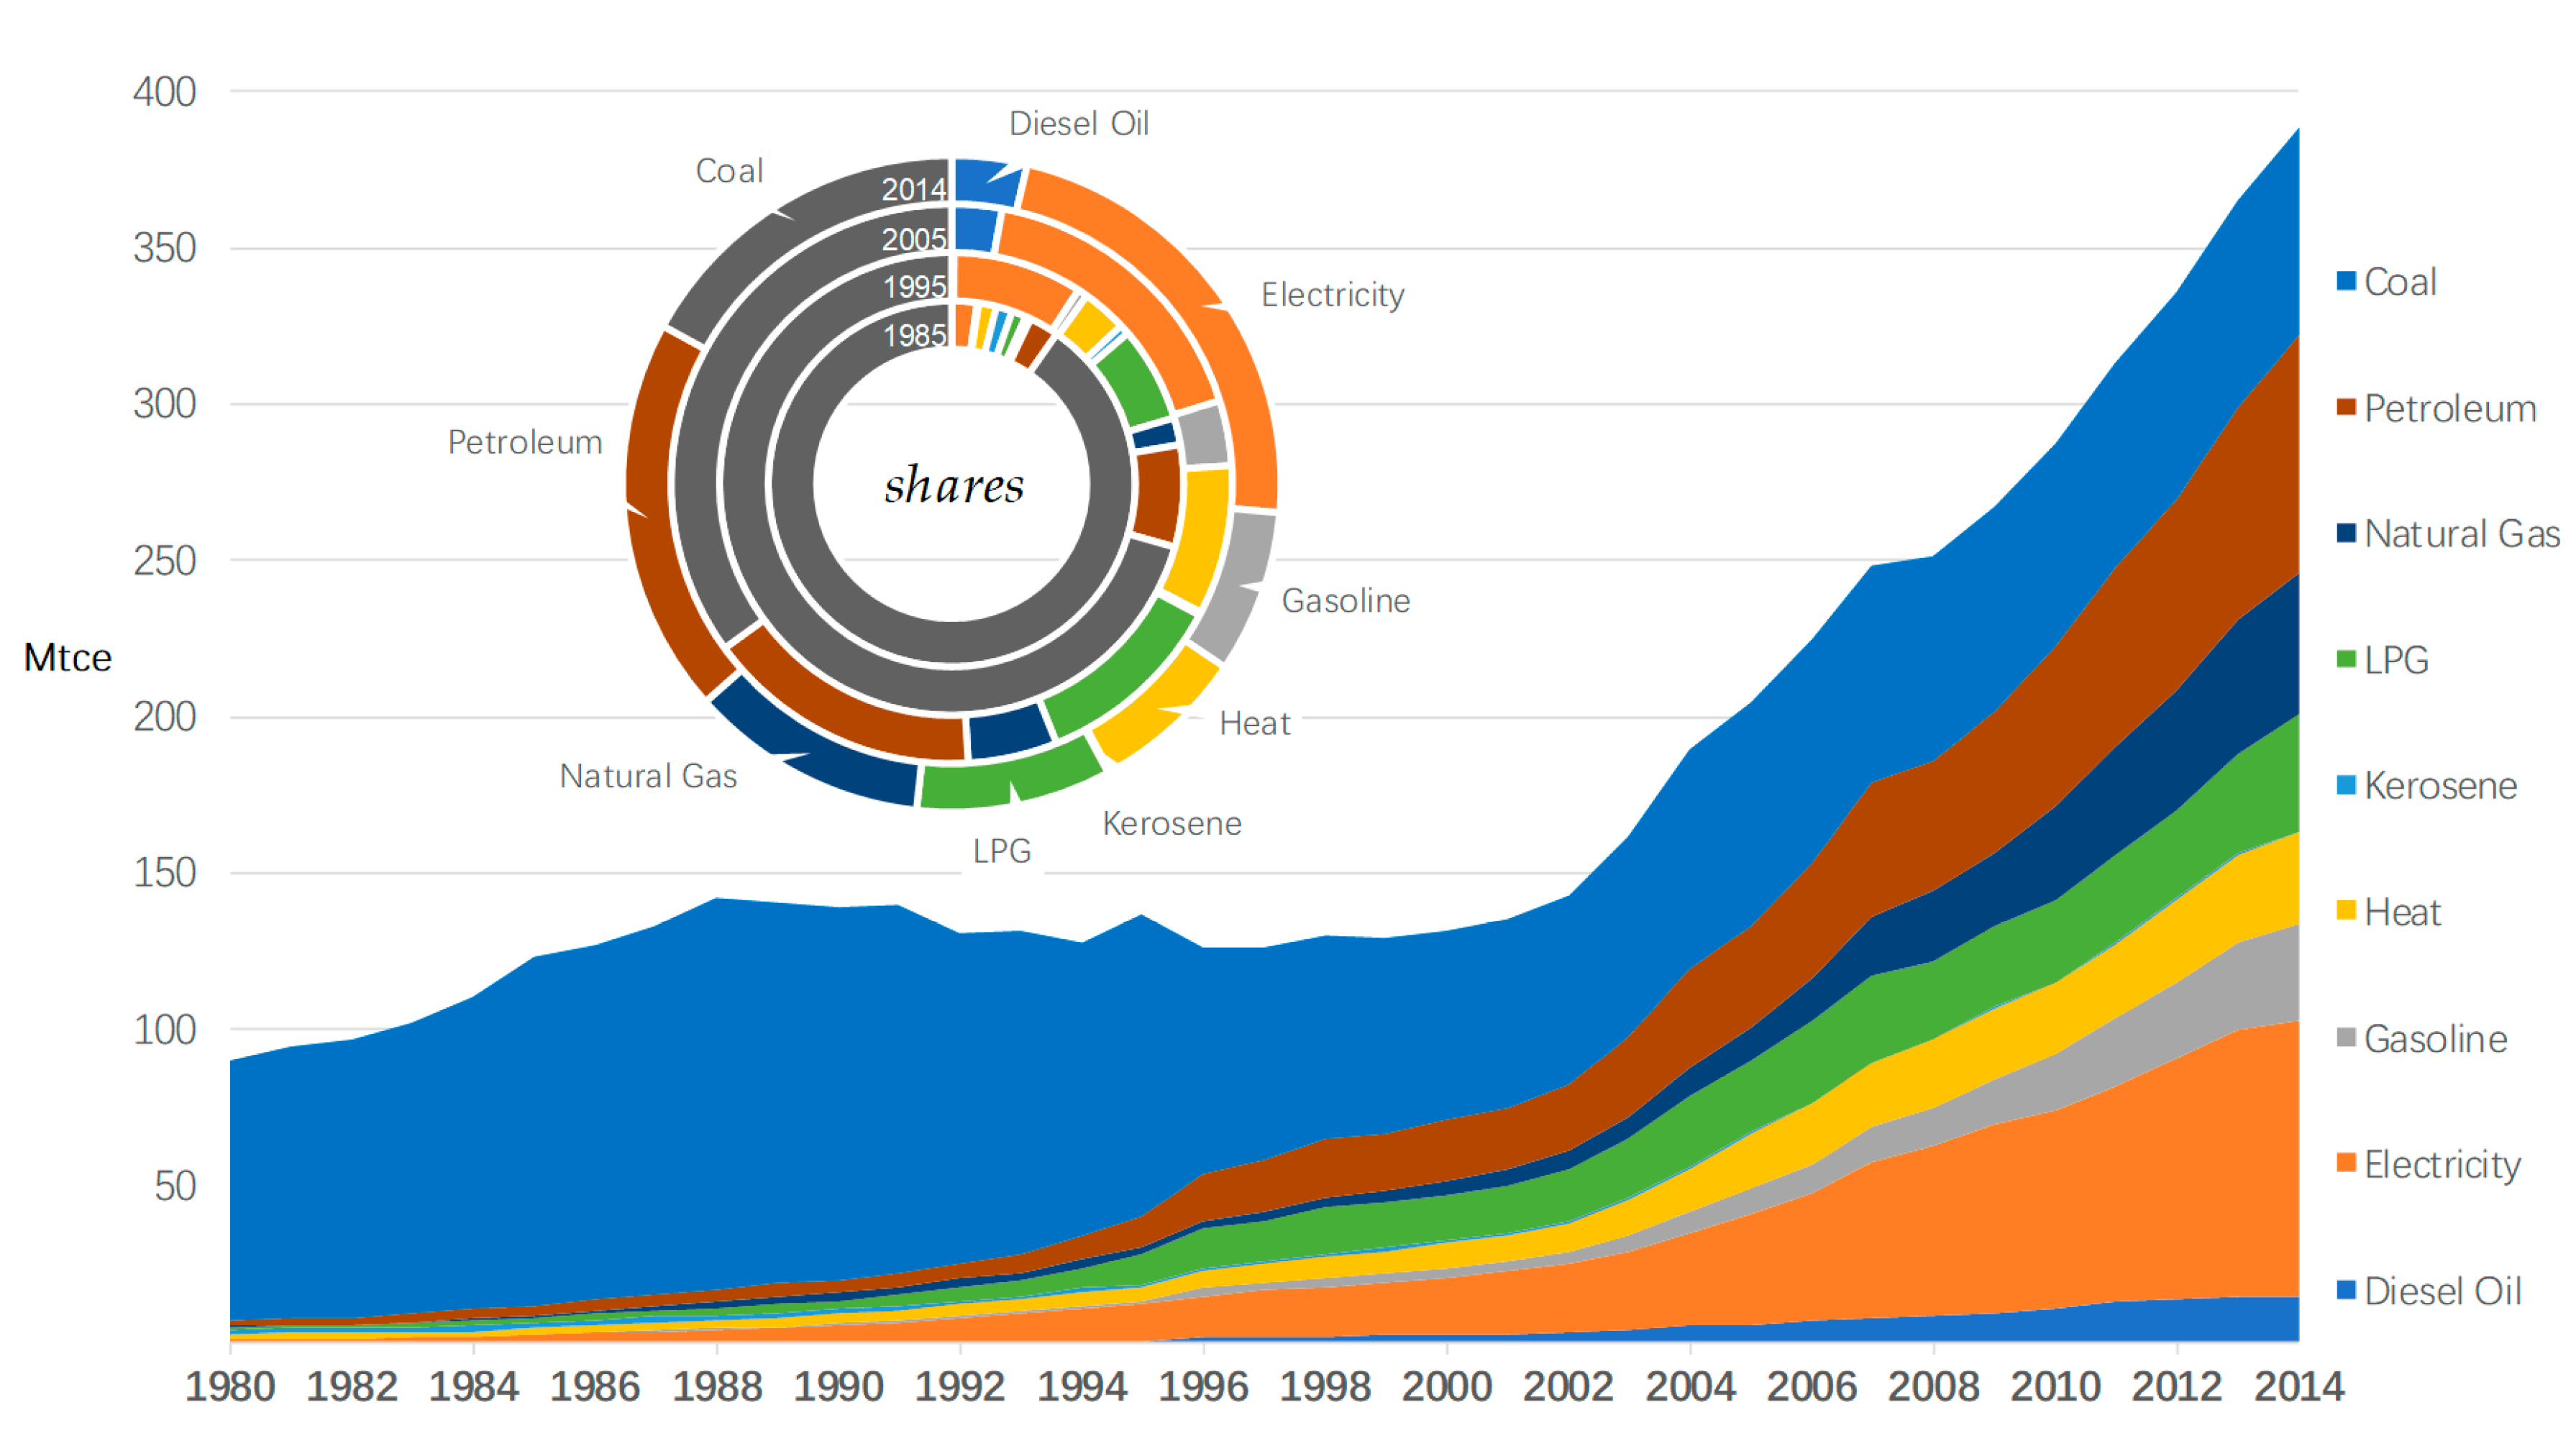
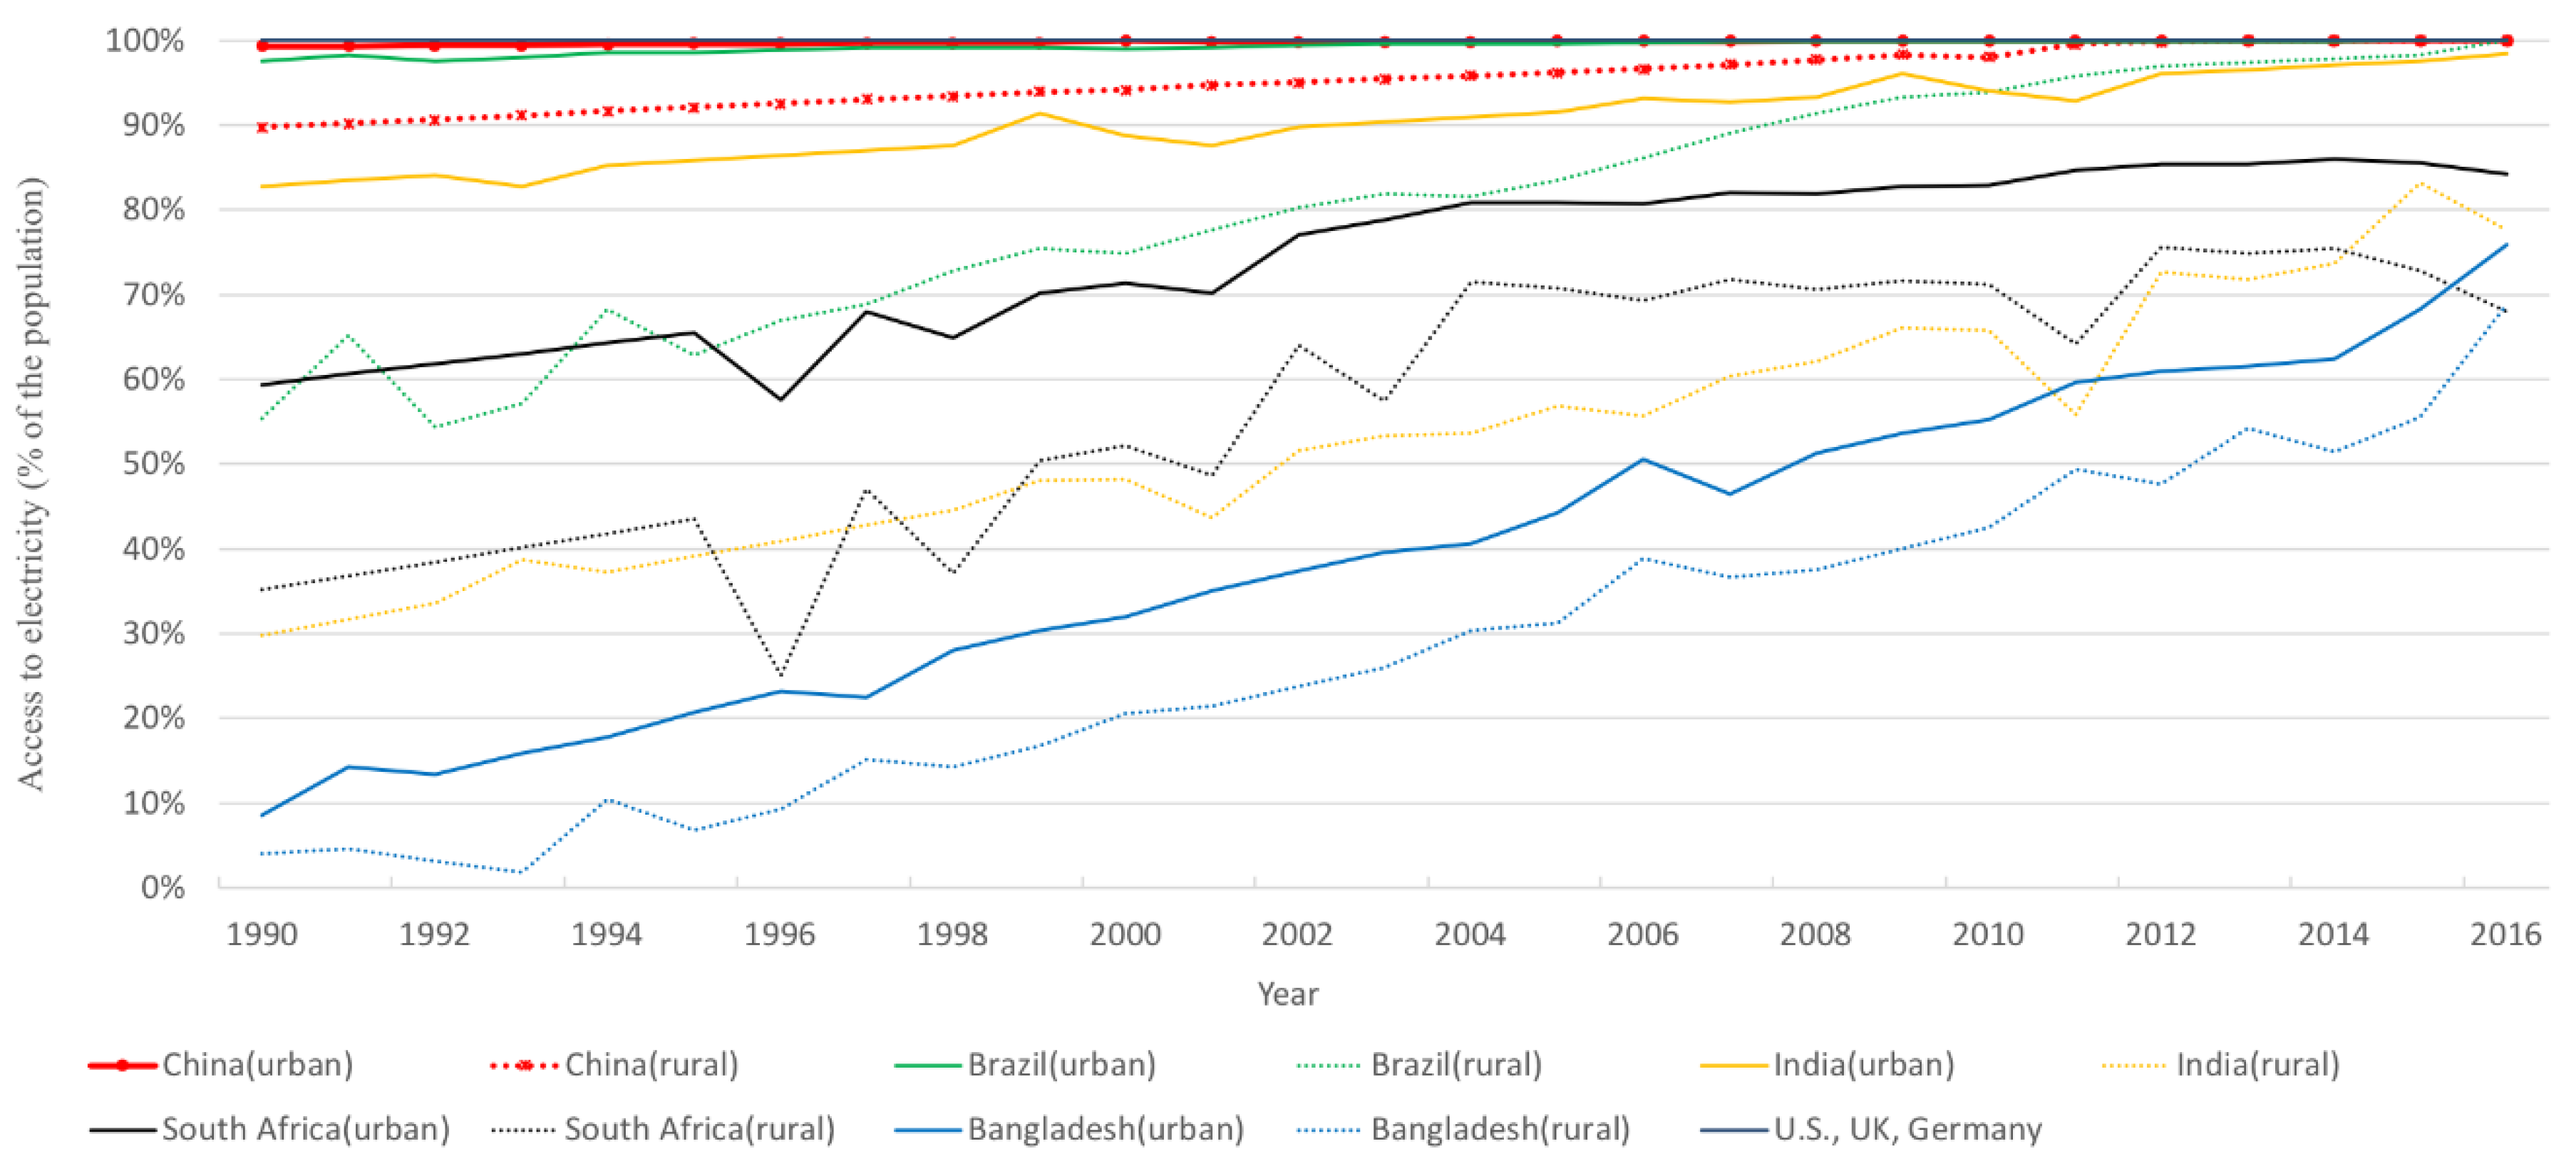
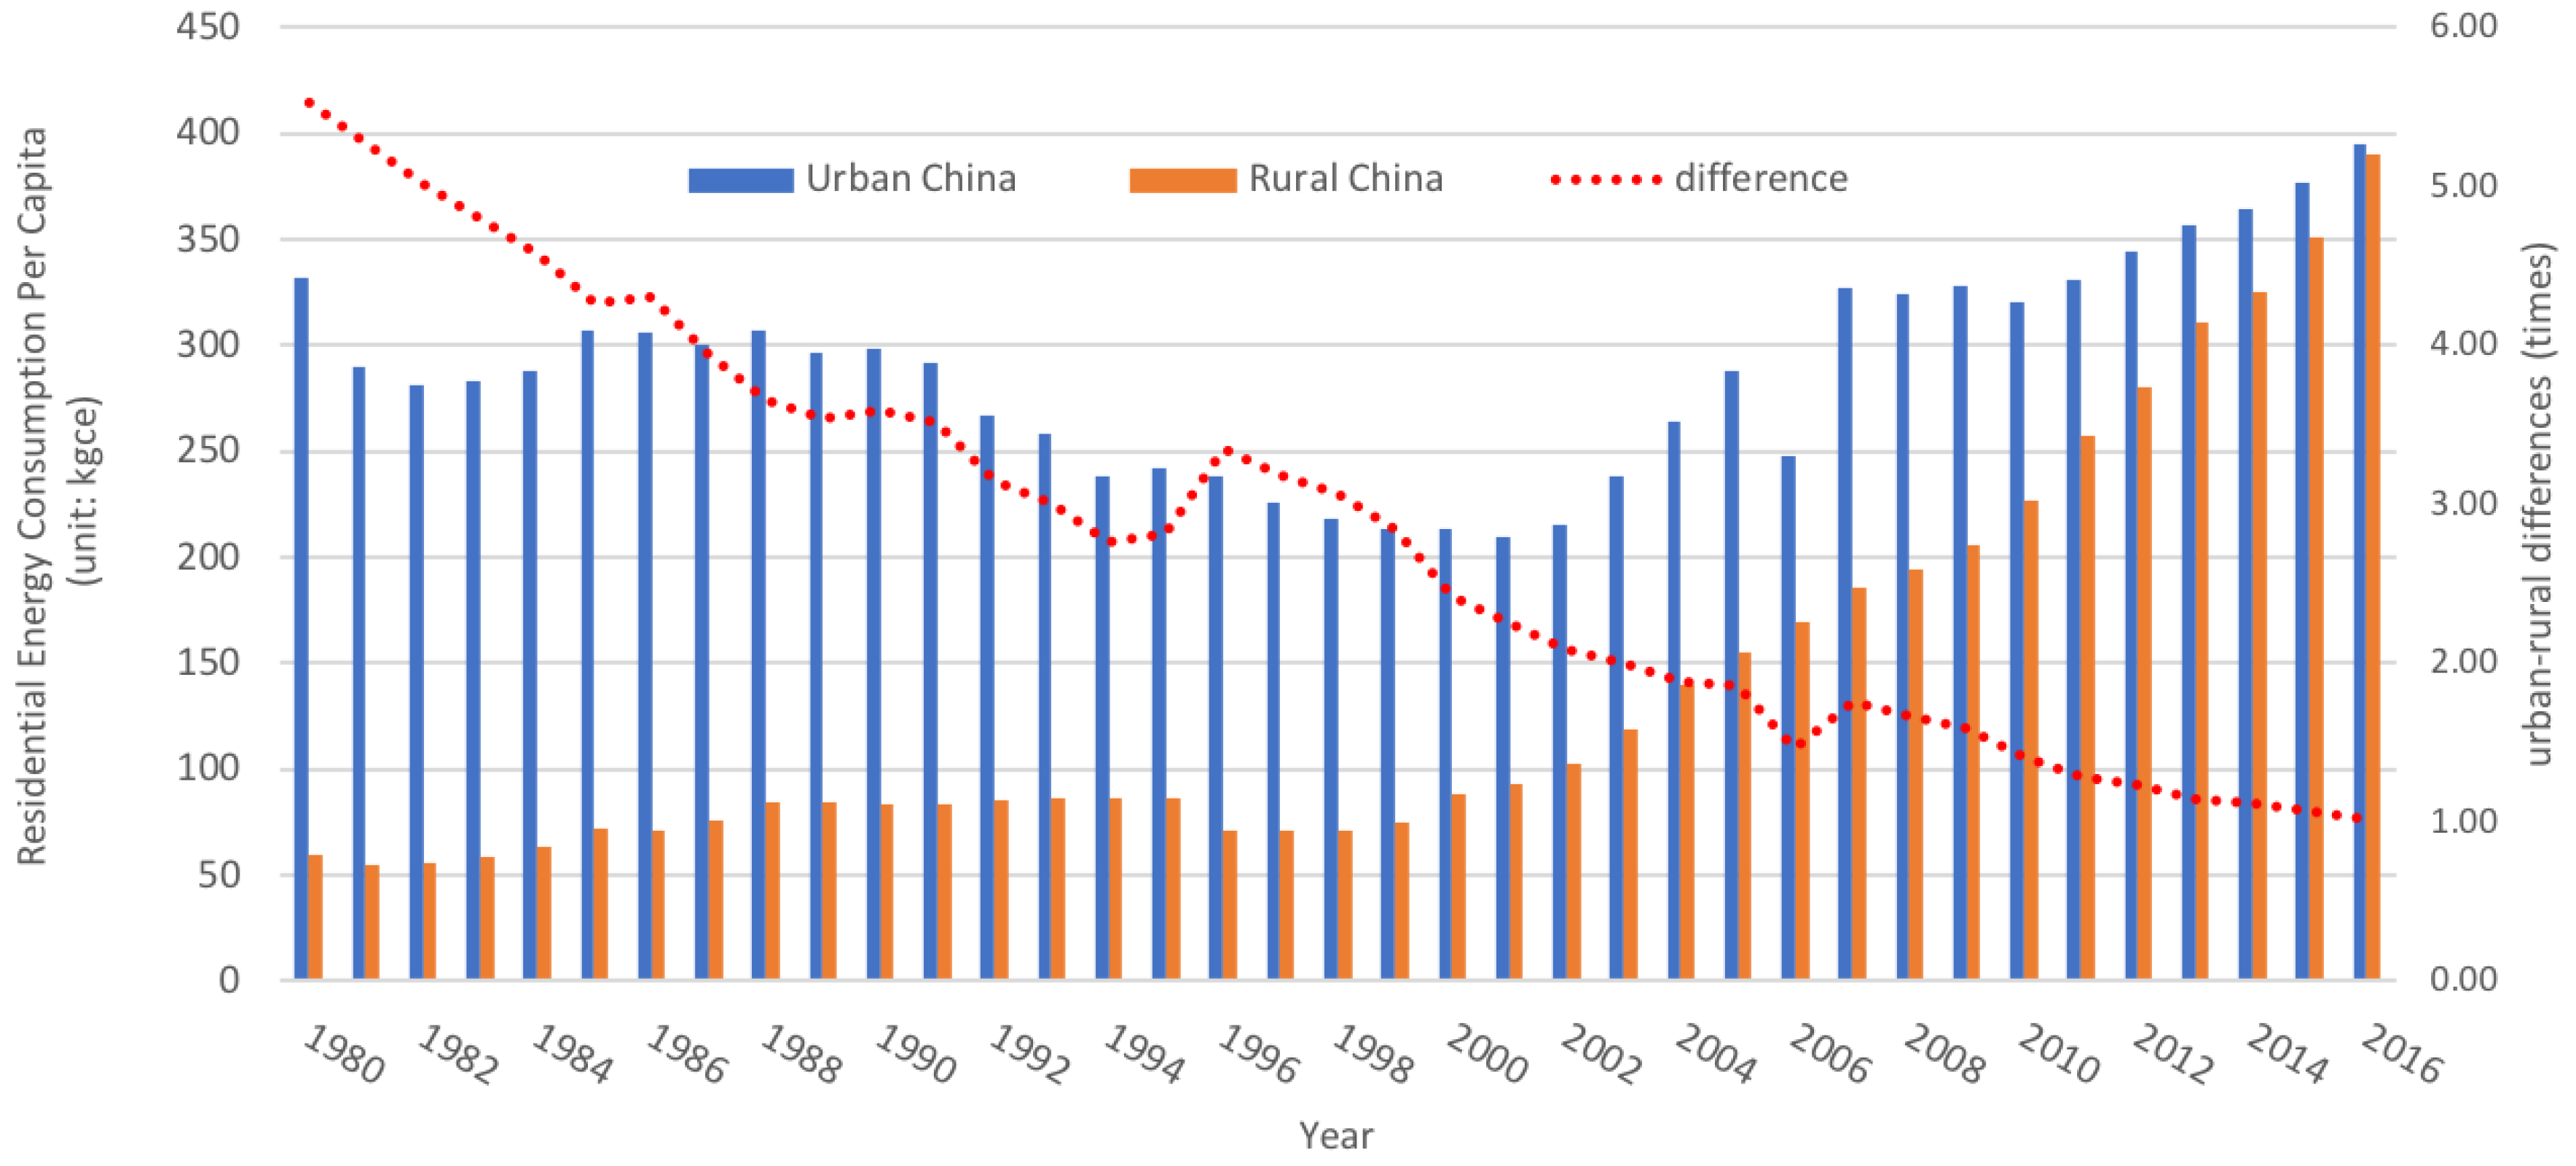
4. Features
5. Driving Forces: Determinants and Performance
6. The Transition towards a Sustainable Energy System
7. Conclusions
Author Contributions
Funding
Acknowledgments
Conflicts of Interest
References
- The United Nations. Transforming our World: The 2030 Agenda for Sustainable Development. 2015. Available online: http://www.un.org (accessed on 10 November 2018).
- UNFCCC. The Paris Agreement. 2015. Available online: http://www.un.org (accessed on 10 November 2018).
- IEA (International Energy Agency). Real-World Policy Packages for Sustainable Energy Transitions. 2017. Available online: http://www.iea.org (accessed on 10 November 2018).
- Global Carbon Project. Carbon Budget and Trends 2017 [EB/OL]. Available online: http://www.globalcarbonproject.org (accessed on 10 November 2018).
- IEA. Global Energy & CO2 Status Report 2017 [EB/OL]. Available online: https://www.iea.org/ (accessed on 23 November 2018).
- Xue, B.; Mitchell, B.; Geng, Y.; Ren, W.; Müller, K.; Ma, Z.; de Oliveira, J.A.; Fujita, T.; Tobias, M. A review on China’s pollutant emissions reduction assessment. Ecol. Indicat. 2014, 38, 272–278. [Google Scholar] [CrossRef]
- Glass, N.R. Environmental effects of increased coal utilization: ecological effects of gaseous emissions from coal combustion. Environ. Health Perspect. 1979, 33, 249–272. [Google Scholar] [CrossRef]
- Xue, B.; Butler, T.; Ren, W.; Zhang, Z.L.; Wang, Y.; Mu, Z.L. Reviewing Air Pollution and Public Health in China. Eng. Sustain. 2018, 171, 358–367. [Google Scholar] [CrossRef]
- Swan, L.G.; Ugursal, V.I. Modeling of end-use energy consumption in the residential sector: A review of modeling techniques. Renew. Sustain. Energy Rev. 2009, 13, 1819–1835. [Google Scholar] [CrossRef]
- EU Eurostat. Energy Consumption in Households. 2018. Available online: https://ec.europa.eu/eurostat/ (accessed on 28 November 2018).
- Estiri, H. Household Energy Consumption and Housing Choice in the U.S. Residential Sector. Hous. Policy Debate 2016, 26, 231–250. [Google Scholar] [CrossRef]
- NBSC (National Bureau of Statistics of China). National Data 2018. Available online: http://data.stats.gov.cn/ (accessed on 28 November 2018).
- Niu, S.; Li, Z.; Qiu, X.; Dai, R.; Wang, X.; Qiang, W.; Hong, Z. Measurement of effective energy consumption in China’s rural household sector and policy implication. Energy Policy 2019, 128, 553–564. [Google Scholar] [CrossRef]
- Sashank, M.; Katherine, K.; Kockelman, M. Household energy use and travel: Opportunities for behavioral change. Transp. Environ. 2011, 16, 49–56. [Google Scholar]
- Gao, B.; Liu, X.; Zhu, Z. A Bottom-Up Model for Household Load Profile Based on the Consumption Behavior of Residents. Energies 2018, 11, 2112. [Google Scholar] [CrossRef]
- EIA (U.S. Energy Information Administration). International Energy Outlook 2016. Available online: http://www.eia.gov/ (accessed on 20 November 2018).
- Sheng, C.; Cao, Y.; Xue, B. Residential Energy Sustainability in China and Germany: The impact of national energy policy system. Sustainability 2018, 10, 4535. [Google Scholar] [CrossRef]
- National Bureau of Statistics. China Statistical Yearbook 2017. Available online: http://www.stats.gov.cn/ (accessed on 28 November 2018).
- REN21. Advancing the Global Renewable Energy Transition. 2017. Available online: http://www.ren21.net (accessed on 10 September 2018).
- Westphal, K. Globalizing the German Energy Transition. 2012. Available online: https://www.swp-berlin.org (accessed on 10 September 2018).
- Clean Energy Wire. The People’s Energiewende: Germany between Citizens’ Energy and Nimbyism. Available online: https://www.cleanenergywire.org (accessed on 28 November 2018).
- World Energy Council. Average Electricity Consumption per Electrified Household. 2016. Available online: https://wec-indicators.enerdata.net (accessed on 28 November 2018).
- Ravindra, K.; Kaur-Sidhu, M.; Mor, S.; John, S. Trend in household energy consumption pattern in India: A case study on the influence of socio-cultural factors for the choice of clean fuel use. J. Clean. Prod. 2019, 213, 1024–1034. [Google Scholar] [CrossRef]
- Nakagami, H.; Murakoshi, C.; Iwafune, Y. International comparison of household energy consumption and its indicator. 2008 ACEEE Summer Study on Energy Efficiency in Buildings. Available online: https://aceee.org (accessed on 28 November 2018).
- Zhao, X.; Li, N.; Ma, C. Residential energy consumption in urban China: A decomposition analysis. Energy Policy 2012, 41, 644–653. [Google Scholar] [CrossRef]
- Wu, S.; Zheng, X.; Wei, C. Measurement of inequality using household energy consumption data in rural China. Nat. Energy 2017, 2, 795–803. [Google Scholar] [CrossRef]
- Mashhoodi, B. Spatial dynamics of household energy consumption and local drivers in Randstad, Netherlands. Appl. Geogr. 2018, 91, 123–130. [Google Scholar] [CrossRef]
- Reid, L.; Sutton, P.; Hunter, C. Theorizing the meso level: The household as a crucible of pro-environmental behavior. Prog. Hum. Geogr. 2010, 34, 309–327. [Google Scholar] [CrossRef]
- AGEB. Energy Stream Picture 2017 for Germany. 2017. Available online: https://ag-energiebilanzen.de (accessed on 28 November 2018).
- Ministry of Economic Affairs. Third National Energy Efficiency Action Plan for The Netherlands. Available online: https://ec.europa.eu/energy/sites/ener/files/documents/NEEAP_2014_nl-en.pdf (accessed on 28 November 2018).
- Pablo-Romero, M.P.; Pozo-Barajas, R.; Yñiguez, R. Global changes in residential energy consumption. Energy Policy 2017, 101, 342–352. [Google Scholar] [CrossRef]
- World Energy Council. Dynamic Data. Available online: https://www.worldenergy.org/data/ (accessed on 28 November 2018).
- US Energy Information Administration. Residential Energy Consumption Survey 2015. Available online: https://www.eia.gov/consumption/residential (accessed on 28 November 2018).
- Hojjati, B.; Wade, S.H. U.S. household energy consumption and intensity trends: A decomposition approach. Energy Policy 2012, 48, 304–314. [Google Scholar] [CrossRef]
- Mohr, T.M. Fuel poverty in the US: Evidence using the 2009 Residential Energy Consumption Survey. Energy Econ. 2018, 74, 360–369. [Google Scholar] [CrossRef]
- Song, N.; Aguilar, F.X.; Shifley, S.R.; Goerndt, M.E. Factors affecting wood energy consumption by U.S. households. Energy Econ. 2012, 34, 389–397. [Google Scholar] [CrossRef]
- EEA. Final Energy Consumption by Sector and Fuel 2018. Available online: https://www.eea.europa.eu/data-and-maps/indicators/final-energy-consumption-by-sector-9/assessment-1 (accessed on 29 November 2018).
- EEA. Global and European Temperature. Available online: https://www.eea.europa.eu/data-and-maps/indicators/global-and-european-temperature-8/assessment (accessed on 29 November 2018).
- Eurostat. Data-Energy. Available online: https://ec.europa.eu/eurostat/statistics-explained/index.php/Energy_consumption_in_households (accessed on 29 November 2018).
- Borozan, D. Regional-Level Household Energy Consumption Determinants: The European Perspective. Renew. Sustain. Energy Rev. 2018, 90, 347–355. [Google Scholar] [CrossRef]
- Summerfield, A.J.; Lowe, R.J.; Oreszczyn, T. Two models for benchmarking UK—Domestic delivered energy. Build. Res. Inf. 2010, 38, 12–24. [Google Scholar] [CrossRef]
- Belaïd, F. Understanding the spectrum of domestic energy consumption: Empirical evidence from France. Energy Policy 2016, 92, 220–233. [Google Scholar] [CrossRef]
- Blazquez, L.; Boogen, N.; Filippini, M. Residential electricity demand for Spain: New empirical evidence using aggregate data. Energy Econ. 2013, 36, 648–657. [Google Scholar] [CrossRef]
- Stoppok, M.; Jess, A.; Freitag, R.; Albera, E. Of culture, consumption and cost: A comparative analysis of household energy consumption in Kenya, Germany and Spain. Energy Res. Soc. Sci. 2018, 40, 127–139. [Google Scholar] [CrossRef]
- Sailor, D.J.; Muñoz, J.R. Sensitivity of electricity and natural gas consumption to climate in the U.S.A.—Methodology and results for eight states. Energy 1997, 22, 987–998. [Google Scholar] [CrossRef]
- Mukherjee, S.; Nateghi, R. Climate sensitivity of end-use electricity consumption in the built environment: An application to the state of Florida, United States. Energy 2017, 128, 688–700. [Google Scholar] [CrossRef]
- Wu, S.; Zheng, X.; You, C.; Wei, C. Household Energy Consumption in Rural China: Historical Development, Present Pattern and Policy Implication. J. Clean. Prod. 2018, 27. [Google Scholar] [CrossRef]
- Keirstead, J. Evaluating the applicability of integrated domestic energy consumption frameworks in the UK. Energy Policy 2006, 34, 3065–3077. [Google Scholar] [CrossRef]
- Motawa, I.; Oladokun, M. A model for the complexity of household energy consumption. Energy Build. 2015, 87, 313–323. [Google Scholar] [CrossRef]
- Karunathilake, H.; Hewage, K.; Sadiq, R. Opportunities and challenges in energy demand reduction for Canadian residential sector: A review. Renew. Sustain. Energy Rev. 2018, 82, 2005–2016. [Google Scholar] [CrossRef]
- Anderson, K.; Song, K.; Lee, S.H.; Lee, H.; Park, M. Energy consumption in households while unoccupied: Evidence from dormitories. Energy Build. 2015, 87, 335–341. [Google Scholar] [CrossRef]
- Yun, G.Y.; Kim, H.; Kim, J.T. Effects of occupancy and lighting use patterns on lighting energy consumption. Energy Build. 2012, 46, 152–158. [Google Scholar] [CrossRef]
- D’Oca, S.; Hong, T.; Langevin, J. The human dimensions of energy use in buildings: A review. Renew. Sustain. Energy Rev. 2018, 81, 731–742. [Google Scholar] [CrossRef]
- Wang, X.; Fend, Z. Survey of rural household energy consumption in China. Energy 1996, 21, 703–705. [Google Scholar]
- Wang, X.; Dai, X.; Zhou, Y. Domestic energy consumption in rural China: A study on Sheyang County of Jiangsu Province. Biomass Bioenergy 2002, 22, 251–256. [Google Scholar]
- Zheng, X.; Wei, C.; Qin, P.; Guo, J.; Yu, Y.; Song, F.; Chen, Z. Characteristics of residential energy consumption in China: Findings from a household survey. Energy Policy 2014, 75, 126–135. [Google Scholar] [CrossRef]
- Zhang, R.; Wei, T.; Glomsrød, S.; Shi, Q. Bioenergy consumption in rural China: Evidence from a survey in three provinces. Energy Policy 2014, 75, 136–145. [Google Scholar] [CrossRef]
- Du, G.; Lin, W.; Sun, C.; Zhang, D. Residential electricity consumption after the reform of tiered pricing for household electricity in China. Appl. Energy 2015, 157, 276–283. [Google Scholar] [CrossRef]
- Sun, C.; Ouyang, X.; Cai, H.; Luo, Z.; Li, A. Household pathway selection of energy consumption during urbanization process in China. Energy Convers. Manag. 2014, 84, 295–304. [Google Scholar] [CrossRef]
- Tian, X.; Geng, Y.; Dong, H.; Dong, L.; Fujita, T.; Wang, Y.; Zhao, H.; Wu, R.; Sun, L. Regional household carbon footprint in China: A case of Liaoning province. J. Clean. Prod. 2016, 114, 401–411. [Google Scholar] [CrossRef]
- Shan, M.; Wang, P.; Li, J.; Yue, G.; Yang, X. Energy and environment in Chinese rural buildings: Situations, challenges, and intervention strategies. Build. Environ. 2015, 91, 271–282. [Google Scholar] [CrossRef]
- Niu, H.; He, Y.; Desideri, U.; Zhang, P.; Qin, H.; Wang, S. Rural household energy consumption and its implications for eco-environments in NW China: A case study. Renew. Energy 2014, 65, 137–145. [Google Scholar] [CrossRef]
- Chen, Q. Biomass Energy Economics and Rural Livelihoods in Sichuan, China. Available online: http://hss.ulb.uni-bonn.de/2017/4790/4790.pdf (accessed on 30 November 2018).
- Zhou, S.; Cui, Q.; Wang, C. Study on the Quantity, Structure and Influencing Factors of Rural Household Energy Consumption: A Case Study in Inner Mongolia. Resour. Sci. 2009, 4, 696–702. [Google Scholar]
- Chen, C.; Neng, Z.; Kun, Y.; Fan, Y. Data and analytics for heating energy consumption of residential buildings: The case of a severe cold climate region of China. Energy Build. 2018, 172, 104–115. [Google Scholar]
- Li, G.; Niu, S.; Ma, L.; Zhang, X. Assessment of Environmental and Economic Costs of Rural Household Energy Consumption in Loess Hilly Region, Gansu Province, China. Renew. Energy 2009, 6, 1438–1444. [Google Scholar] [CrossRef]
- Zhao, X.; Mao, X. Comparison environmental impact of the peasant household in han, zang and hui nationality region: Case of Zhangye, Gannan and Linxia in Gansu Province. Acta Ecol. Sin. 2013, 17, 5397–5406. (In Chinese) [Google Scholar] [CrossRef]
- Liu, G.; Lucas, M.; Shen, L. Rural household energy consumption and its impacts on eco-environment in Tibet: Taking Taktse county as an example. Renew. Sustain. Energy Rev. 2008, 12, 1890–1908. [Google Scholar] [CrossRef]
- Feng, T.; Cheng, S.; Min, Q.; Li, W. Productive use of bioenergy for rural household in ecological fragile area, Panam County, Tibet in China: The case of the residential biogas model. Renew. Sustain. Energy Rev. 2009, 13, 2070–2078. [Google Scholar] [CrossRef]
- Liang, Y.; Fan, J.; Sun, W.; Han, X.; Sheng, K.; Ma, H.; Xu, Y.; Wang, C. The Influencing Factors of Rural Household Energy Consumption Structure in Mountainous Areas of Southwest China: A Case Study of Zhaotong City of Yunnan Province. Acta Geogr. Sin. 2012, 2, 221–229. (In Chinese) [Google Scholar]
- Yang, X.; Xu, J.; Xu, X.; Yi, Y.; Hyde, W.F. Collective forest tenure reform and household energy consumption: A case study in Yunnan Province, China. China Econ. Rev. 2017. [Google Scholar] [CrossRef]
- CRECS. Available online: http://econ.ruc.edu.cn/more_Database.php?cid=10876 (accessed on 30 November 2018).
- CRECS. Report of the Chinese Residential Energy Consumption. 2015. Available online: http://nads.ruc.edu.cn/upfile/file/20160524085312_906914_35342.pdf (accessed on 30 November 2018). (In Chinese).
- Web of Science. Database of WoS Core Collection. Available online: http://www.webofknowledge.com/ (accessed on 20 September 2018).
- China National Knowledge Infrastructure (CNKI). Available online: http://cnki.net/ (accessed on 20 September 2018).
- Google. Available online: http://www.google.com (accessed on 10 October 2018).
- Richerzhagen, C.; von Frieling, T.; Hansen, N.; Minnaert, A.; Netzer, N.; Russbild, J. Energy Efficiency in Buildings in China: Policies, Barriers and Opportunities. Available online: https://www.die-gdi.de/uploads/media/Studies_41.2008.pdf (accessed on 20 October 2018).
- Chen, C.M. Citespace II: Detecting and visualizing emerging trends and transient patterns in scientific literature. J. Am. Soc. Inf. Sci. Technol. 2006, 57, 359–377. [Google Scholar] [CrossRef]
- Ouyang, W.; Wang, Y.; Lin, C.; He, M.; Hao, F.; Liu, H.; Zhu, W. Heavy metal loss from agricultural watershed to aquatic system: A scientometrics review. Sci. Total Environ. 2018, 637, 208–220. [Google Scholar] [CrossRef] [PubMed]
- García-Lillo, F.; Úbeda-García, M.; Marco-Lajara, B. Organizational ambidexterity: Exploring the knowledge base. Scientometrics 2016, 107, 1021–1040. [Google Scholar] [CrossRef]
- The China Energy Group at the Lawrence Berkeley National Laboratory. China Energy Databook Version 9.0. Available online: https://china.lbl.gov/research-projects/china-energy-databook (accessed on 20 October 2018).
- Dong, K.; Sun, R.; Li, H.; Jiang, H. A review of China’s energy consumption structure and outlook based on a long-range energy alternatives modeling tool. Petrol. Sci. 2017, 14, 214–227. [Google Scholar] [CrossRef]
- Department of Energy & Climate Change. Energy Consumption in the UK. 2015. Domestic Energy Consumption in the UK between 1970 and 2014. Available online: https://www.connaissancedesenergies.org/sites/default/files/pdf-actualites/ecuk_chapter_3_-_domestic_factsheet.pdf (accessed on 20 November 2018).
- Li, J.; Xing, Z.; DeLaquil, P.; Larson, E.D. Biomass energy in China and its potential. Energy Sustain. Dev. 2001, 5, 66–80. [Google Scholar]
- Zheng, X.Y.; Wei, C.; Yu, Y.H.; Qin, P. Chinese Residential Energy Consumption Report 2016; Science Press: Beijing, China, 2017; ISBN 9787030525512. [Google Scholar]
- Qin, Z.C.; Zhuang, Q.L.; Cai, X.M.; He, Y.; Huang, Y.; Jiang, D.; Lin, E.; Liu, Y.; Tang, Y.; Wang, M.Q. Biomass and biofuels in China: Toward bioenergy resource potentials and their impacts on the environment. Renew. Sustain. Energy Rev. 2018, 82, 2387–2400. [Google Scholar] [CrossRef]
- Carter, E.; Shan, M.; Zhong, Y.; Ding, W.; Zhang, Y.; Baumgartner, J.; Yang, X. Development of renewable, densified biomass for household energy in China. Energy Sustain. Dev. 2018, 46, 42–52. [Google Scholar] [CrossRef]
- IEA (International Energy Agency). World Energy Outlook 2016. Available online: http://www.iea.org (accessed on 20 November 2018).
- Wu, J.; He, L. Urban–rural gap and poverty traps in China: A prefecture level analysis. Appl. Econ. 2018, 50, 3300–3314. [Google Scholar] [CrossRef]
- Jain-Chandra, S.; Khor, N.; Mano, R.; Schauer, J.; Wingender, R.; Zhuang, J. IWF Working Paper: Inequality in China—Trends, Drivers and Policy Remedies. International Monetary Fund. 2018. Available online: https://www.imf.org/ (accessed on 20 November 2018).
- IEA. Modern Energy for All. Available online: http://www.worldenergyoutlook.org/ (accessed on 20 November 2018).
- World Bank. Energy Overview. Available online: http://www.worldbank.org/ (accessed on 20 November 2018).
- IEA. Energy Poverty. Available online: http://www.iea.org/topics/energypoverty/ (accessed on 20 November 2018).
- World Bank. Data Sustainable Energy for All. Available online: http: //databank.worldbank.org/ (accessed on 20 November 2018).
- National Bureau of Statistics of China. China Energy Statistical Yearbook 2017; China Statistics Press: Beijing, China, 2017.
- Yang, X.; Wang, T.; Xu, J. Empirical study on rural households’ demand for energy consumption in Western ethical minority areas. For. Econ. 2016, 6, 14–22. [Google Scholar]
- Wu, Y.H.; Cao, B.; Gao, F.; Xia, J. Studies on current rural energy resources utilization and bio-energy development in Northwest Yunnan—The case study on Lanping and Shangi-La counties. J. Nat. Resour. 2008, 5, 781–789. (In Chinese) [Google Scholar]
- Liu, G. Energy Consumption Patterns and Its Environmental Effects in Tibet; Graduate University of Chinese Academy of Sciences: Beijing, China, 2007. [Google Scholar]
- Yao, C.; Chen, C.; Li, M. Analysis of rural residential energy consumption and corresponding carbon emissions in China. Energy Pol. 2012, 41, 445–450. [Google Scholar] [CrossRef]
- Zhang, L.; Yang, Z.; Chen, B.; Chen, G. Rural energy in China: Pattern and policy. Renew. Energy 2009, 34, 2813–2823. [Google Scholar] [CrossRef]
- Hu, S.; Yan, D.; Guo, S.; Cui, Y.; Dong, B. A survey on energy consumption and energy usage behavior of households and residential building in urban China. Energy Build. 2017, 148, 366–378. [Google Scholar] [CrossRef]
- O’Neill, B.C.; Chen, B.S. Demographic Determinants of Household Energy Use in the United States. Popul. Dev. Rev. 2002, 28, 53–88. [Google Scholar]
- U.S. National Research Council. Environmentally Significant Consumption: Research Directions. 1997. Available online: http://www.nap.edu/catalog/5430.html (accessed on 20 November 2018).
- Brandon, G.; Lewis, A. Reducing household energy consumption: A qualitative and quantitative field study. J. Environ. Psychol. 1999, 19, 75–85. [Google Scholar] [CrossRef]
- Poortinga, W.; Steg, L.; Vlek, C. Values, Environmental Concern, and Environmental Behavior: A Study into Household Energy Use. Environ. Behav. 2004, 36, 70–93. [Google Scholar] [CrossRef]
- Wachsmann, U.; Wood, R.; Lenzen, M.; Schaeffer, R. Structural decomposition of energy use in Brazil from 1970 to 1996. Appl. Energy 2009, 86, 578–587. [Google Scholar] [CrossRef]
- Cellura, M.; Longo, S.; Mistretta, M. Application of the Structural Decomposition Analysis to assess the indirect energy consumption and air emission changes related to Italian households’ consumption. Renew. Sustain. Energy Rev. 2012, 16, 1135–1145. [Google Scholar] [CrossRef]
- Uhunamure, S.E.; Nethengwe, N.S.; Musyoki, A. Driving forces for fuelwood use in households in the Thulamela municipality, South Africa. J. Energy South. Afr. 2017, 28, 25–34. [Google Scholar] [CrossRef]
- Kulindwa, Y.J.; Lokina, R.; Ahlgren, E.O. Driving forces for households’ adoption of improved cooking stoves in rural Tanzania. Energy Strategy Rev. 2018, 20, 102–112. [Google Scholar] [CrossRef]
- Wilson, C.; Dowlatabadi, H. Models of Decision Making and Residential Energy Use. Annu. Rev. Environ. Resour. 2007, 32, 169–203. [Google Scholar] [CrossRef]
- Gupta, A.K.; Roach, D.C.; Rinehart, S.M.; Best, L.A. Decision-Making Impacts on Energy Consumption Display Design. Energy Technol. Policy 2015, 2, 133–142. [Google Scholar] [CrossRef]
- Jones, D.W. How urbanization affects energy-use in developing countries. Energy Policy 1991, 19, 621–630. [Google Scholar] [CrossRef]
- Fan, J.; Zhang, Y.; Wang, B. The impact of urbanization on residential energy consumption in China: An aggregated and disaggregated analysis. Renew. Sustain. Energy Rev. 2017, 75, 220–233. [Google Scholar] [CrossRef]
- Liu, H.; Lei, J. The impacts of urbanization on Chinese households’ energy consumption: An energy input-output analysis. J. Renew. Sustain. Energy Rev. 2018, 10, 015903. [Google Scholar] [CrossRef]
- Xue, B.; Chen, X.; Geng, Y.; Guo, X.; Lu, C.P.; Zhang, Z.; Lu, C.Y. Survey of officials’ awareness on circular economy development in China: Based on municipal and county level. Resour. Conserv. Recycl. 2010, 54, 1296–1302. [Google Scholar] [CrossRef]
- Zhang, Z.; Zind, J.A.; Li, W. Forest transitions in Chinese villages: Explaining community-level variation under the returning farmland to forest program. Land Use Policy 2017, 64, 245–257. [Google Scholar] [CrossRef]
- Chen, X.; Lupi, F.; Liu, J. Accounting for ecosystem services in compensating for the costs of effective conservation in protected areas. Biol. Conserv. 2017, 215, 233–240. [Google Scholar] [CrossRef]
- Zhao, X. Impacts of human activity on environment in the high-cold pasturing area: A case of Gannan pasturing area. Acta Ecol. Sin. 2010, 30, 141–149. [Google Scholar] [CrossRef]
- Ding, H.; Qin, C.; Shi, K. Development through electrification: Evidence from rural China. China Econ. Rev. 2018, 50, 313–328. [Google Scholar] [CrossRef]
- Bhattacharyya, S.C.; Ohiare, S. The Chinese electricity access model for rural electrification: Approach, experience and lessons for others. Energy Policy 2012, 49, 676–687. [Google Scholar] [CrossRef]
- Reddy, K.S.; Sharon, H. Energy-environment-economic investigations on evacuated active multiple stage series flow solar distillation unit for potable water production. Energy Convers. Manag. 2017, 1, 259–285. [Google Scholar] [CrossRef]
- Liu, J.; Zhu, L. Empirical Study on the Rural Household Energy Consumption of China—Based on the Survey Data of Farmers from Hebei, Hunan, and Xinjiang. J. Agrotech. Econ. 2011, 5, 35–40. [Google Scholar]
- Zhang, X. Multi-Dimensional Analysis of Urban and Rural Household Energy Consumption and Its Living Situation; Lanzhou University: Lanzhou, China, 2012. [Google Scholar]
- Jin, L. Rural Household Energy Consumption and the Influencing Factors; Nanjing Agricultural University: Nanjing, China, 2010. [Google Scholar]
- Yao, J. Research on Household Energy Consumption Behavior. Energy Res. Util. 2009, 4, 7–12. [Google Scholar]
- Wu, W.; Wu, Y.; Li, T. Regional differentiation of rural household energy use—A case study of Linwei District, Guanzhong area. J. Nat. Resour. 2013, 9, 1593–1603. [Google Scholar]
- Chen, B. Research on Living Energy Consumption of Rural Household—Based on the Rurual Household Survey in Hunan, Chongqing and Guizhou under the Perspective of Economic and Social Transactions; Economy & Management Publishing House: Beijing, China, 2016; pp. 34–78. [Google Scholar]
- Li, G.; Yu, G.; Lu, W.; Niu, S. Differences in rural household energy consumption across the loess hilly region of Gansu. Resour. Sci. 2012, 10, 1839–1844. (In Chinese) [Google Scholar]
- Dong, M.; Xu, Z. Energy Consumption Structure of Rural Households and Influencing Factors: Based on 1 303 Rural Households in Shanxi. J. Agro-For. Econ. Manag. 2018, 1, 45–53. [Google Scholar]
- Yang, Z. Analysis on environmental effect of rural energy consumption and its influence factors. Trans. Chin. Soc. Agric. Eng. 2011, 1, 268–272. [Google Scholar]
- Qiu, H.; Yan, J. Residential Energy Consumption in Rural China: Current Situation and Determinants for Future Trend—An Empirical Study Based on Filed Survey Data of 4 Provinces. China Soft Sci. 2015, 11, 28–38. [Google Scholar]
- Shi, Q.; Peng, X.; Zhang, R. A Field Survey of Rural Energy Consumption in China—A Case Study of 2253 Farmers in Shanxi, Guizhou, and Zhejiang Provinces. Manag. World 2014, 5, 80–92. [Google Scholar]
- Lou, B. Research on Rural Household’s Selection Behavior of Livelihood Energy Consumption; Chinese Academy of Agricultural Sciences: Beijing, China, 2008. [Google Scholar]
- Hua, G. Aggregate Effect and Energy Structure Effect of the Energy Consumption Growth of China; People’s Publishing House: Shanghai, China, 2017; pp. 178–198. [Google Scholar]
- NDRC (National Development Reform Commission of China). 13th Five-Year Plan for Energy Development. Available online: http://www.ndrc.gov.cn/zcfb/zcfbghwb/201701/W020170117350627940556.pdf (accessed on 1 December 2018).
- State Council of China. Energy Development Strategic Action Plan (2014–2020). Available online: http://www.gov.cn/zhengce/content/2014-11/19/content_9222.htm (accessed on 1 December 2018).
- NDRC (National Development Reform suCommission of China). Action Plan of Energy Technology Innovation (2016–2030). Available online: http://www.ndrc.gov.cn/fzgggz/fzgh/ghwb/gjjgh/201706/t20170607_850180.html (accessed on 1 December 2018).
- NDRC (National Development Reform Commission of China). Energy Production and Consumption Revolution strategy (2016–2030). Available online: http://www.gov.cn/xinwen/2017-04/25/5230568/files/286514af354e41578c57ca38d5c4935b.pdf (accessed on 1 December 2018).
- ENavi Kopernikus Project. Available online: https://www.kopernikus-projekte.de/en/projects/system-integration (accessed on 20 December 2018).
- Zhang, A.; Xia, C.; Chu, J.; Lin, J.; Li, W.; Wu, J. POI-based analysis on retail’s spatial hot blocks at a city level: A case study of Shenyang, China. Econ. Geogr. 2018, 5, 36–43. [Google Scholar]


| Category | Determinants |
|---|---|
| External | energy-environment policy (E1) |
| geographical location (E2) | |
| socioeconomic situation (E3) | |
| energy accessibility (E4) | |
| Internal | household income and livelihood strategy (I1) |
| family size(I2) | |
| end-use behavior(I3) |
| Category | Key Methods | Policy Document |
|---|---|---|
| Energy Service | Universal Service of energy. Realizing the convenience of basic energy service and narrow the gap in electricity consumption between urban and rural residents. | Five-year Plan for Energy Development (FPED) (2016–2020) |
| Improve the fair allocation of energy resources and emergency response mechanisms to ensure the basic energy needs of urban and rural residents. | FPED (2016–2020) | |
| Improve property management and professional services. In 2030, the rural areas will realize in establishing commercialized energy service system. | Energy Supply and Consumption Revolution Strategy (ESCRS) (2016–2030) | |
| Energy Supply | Promote energy replacement by electricity, and use the storage energy for heating in the new energy-rich areas. | FPED (2016–2020) |
| Improve energy infrastructure. Coordinate the upgrading of power grids and the replacement of electricity to meet the electricity substitution in residential heating. | FPED (2016–2020) | |
| Implement the urban gasification projects. By 2020, urban residents will use natural gas. | Energy Development and Strategic Action Plan (EDSAP) (2014–2020) | |
| Develop small hydropower and other renewable energies in a rural area, promote the efficient use of non-commercial energy, and strengthen rural energy conservation. | EDSAP (2014–2020) | |
| Energy Management | Implement the Energy Conservation Plan to ensure saving energy being a conscious action of the whole society. | EDSAP (2014–2020) |
| Formulate urban comprehensive energy planning, and develop distributed energy. | EDSAP (2014-2020) | |
| Implement the “all line into one grid” plan, develop the smart household energy system. | Action Plan of Energy Technology Innovation (APETI) (2016–2030) | |
| Promotion of rural distribution network construction, solar photovoltaic power generation, and heat utilization. | ESCRS (2016–2030) | |
| Support residents to participate in clean energy production in various forms such as rooftop PV. | FPED (2016–2020) | |
| Pilot Projects | Clean energy demonstration provinces, green energy cities (counties), and smart energy towns. | FPED (2016–2020) |
| Building low-carbon smart town. | EDSAP (2014–2020) | |
| Demonstration of low-carbon communities, and near-zero carbon emission zones. | ESCRS (2016–2030) | |
| Building green household. | ESCRS (2016–2030) |
© 2019 by the authors. Licensee MDPI, Basel, Switzerland. This article is an open access article distributed under the terms and conditions of the Creative Commons Attribution (CC BY) license (http://creativecommons.org/licenses/by/4.0/).
Share and Cite
Jiang, L.; Chen, X.; Xue, B. Features, Driving Forces and Transition of the Household Energy Consumption in China: A Review. Sustainability 2019, 11, 1186. https://doi.org/10.3390/su11041186
Jiang L, Chen X, Xue B. Features, Driving Forces and Transition of the Household Energy Consumption in China: A Review. Sustainability. 2019; 11(4):1186. https://doi.org/10.3390/su11041186
Chicago/Turabian StyleJiang, Lu, Xingpeng Chen, and Bing Xue. 2019. "Features, Driving Forces and Transition of the Household Energy Consumption in China: A Review" Sustainability 11, no. 4: 1186. https://doi.org/10.3390/su11041186
APA StyleJiang, L., Chen, X., & Xue, B. (2019). Features, Driving Forces and Transition of the Household Energy Consumption in China: A Review. Sustainability, 11(4), 1186. https://doi.org/10.3390/su11041186