Article

Exploring the Driving Forces and Reduction Potential of Industrial Energy-Related CO2 Emissions during 2001–2030: A Case Study for Henan Province, China

1
College of Chemistry and Molecular Engineering, Zhengzhou University, Zhengzhou 450001, China
2
Research Institute of Environmental Science, Zhengzhou University, Zhengzhou 450001, China
*
Authors to whom correspondence should be addressed.
Sustainability 2019, 11(4), 1176; https://doi.org/10.3390/su11041176
Submission received: 18 January 2019 / Revised: 14 February 2019 / Accepted: 20 February 2019 / Published: 22 February 2019
(This article belongs to the Special Issue Climate Change and Sustainable Development Policy)

Abstract

:
In China, the industrial sector is the main contributor to economic development and CO2 emissions, especially for the developing regional provinces. This study employs the Logarithmic Mean Divisia Index (LMDI) approach to decompose industrial energy-related CO2 emission into eight factors during 2001–2015 for Henan Province. Furthermore, the future CO2 emissions under different scenarios (Business as Usual (BAU), Efficiency Improvement (EI), Structural Optimization (SO), R&D Input (RD), and Comprehensive Policy (CP) scenarios) over 2016–2030 are projected. The results indicate that among these factors, the economic output, R&D intensity, investment intensity, and energy structure are the drivers for increasing CO2 emissions over the entire period, with the contribution of 293, 83, 80, and 1% of the total CO2 emissions changes, respectively. Conversely, the energy intensity, R&D efficiency, and industrial internal structure can decrease CO2 emissions with contributions of −86, −163, and −108% to the changes, respectively. Under the five scenarios, CO2 emissions in 2030 will reach 1222, 1079, 793, 987, and 638 Mt with an annual growth rate of 4.7%, 3.8%, 1.8%, 3.3%, and 0.4%, respectively. In particular, the CO2 emission peak for SO and CP scenarios is observed before 2030. Finally, some policy implications are suggested to further mitigate industrial emissions.

1. Introduction

Over the past decades, climate change has become a serious public issue worldwide [1]. Under the Paris Agreement, many countries in the world have taken proactive actions to mitigate carbon dioxide (CO2) emissions, which is the main contributor of greenhouse gases [2].
Since its economic reform and opening up to the global market, China’s economy has been developed rapidly for a long period. However, the rapid economic development has resulted in many energy and environmental problems along with high CO2 emissions [3,4]. In fact, China has become the world’s largest carbon emitter since 2011 [5,6,7]. To mitigate CO2 emissions, the Chinese government has formulated a series of CO2 emission reduction targets. For instance, in 2014, the government announced that it would achieve peak CO2 emissions around 2030, if not sooner, in the U.S.–China Joint Announcement on Climate Change [8]. Furthermore, in 2015, the Chinese government promulgated the official document of China’s Intended Nationally Determined Contributions in which China committed to cut its CO2 emissions intensity (t-CO2/GDP) by 60–65% of the 2005 level [9]. Achieving these targets is a huge challenge for China; especially because China is a developing country with continueing industrialization and urbanization.
In the past 30 years, the industrial sector has played a significant role in China’s economic growth along with its CO2 emissions. As the largest contributor to China’s CO2 emissions, the industrial sector, which has accounted for more than 65% [10], has undertaken greater emission reduction tasks. To abate industrial CO2 emissions, efficiency improvement and structural adjustment are considered to be two major approaches [11,12]. Since the 11th Five-Year Plan (FYP, the Five-Year Plan period by National Economical Plan of Chinese government) (2006–2010), China has formulated a series of policy plans based on both measures, for example, reducing the unit energy consumption of industrial products, vigorously developing new and high-tech industries, and replacing coal-fired boilers with gas-fired ones. Of the promulgated policies, China has paid more attention to the policies on energy efficiency improvement before the 12th FYP period (2011–2015). As a result, over time, energy efficiency of certain industries has been improved to a considerable level (up to international advanced level), but it will be difficult to further increase in the future. Therefore, at present, the promotion of technological innovation and industrial restructuring is urgently on the agenda. Moreover, with China’s economy entering into the new stage, how to make China’s economy turn to a green and low-carbon development road has become a key task. Thence, it is of great significance for formulating CO2 emission reduction strategies and mechanisms to study the influencing factors of industrial energy-related CO2 emissions and quantify their contribution levels and future development trends.
Under these conditions, this study attempts to answer the above questions. Thus, we first utilize an extended Logarithmic Mean Divisia Index (LMDI) method to reveal the main driving factors in CO2 emission changes, especially the impacts of technological innovation and investment intensity. The application of LMDI in the decomposition of carbon emissions has been widely used [13,14,15,16] and from the results we can interpret which factors are the most important (see Section 2 literature review). The flow diagram of our research is illustrated in Figure 1, which covers the sequence of our study as well as the rationale for each step. Since Henan province is a key part of the Central Plains Urban Agglomeration and as one of the highest population provinces, the evaluation of its CO2 emissions is of interest and importance. Consequently, CO2 emission data in the industrial sector in Henan Province of China were decomposed into eight factors to see the extent of contribution of each factor towards the overall CO2 emission changes. In addition, a prediction method combined with a scenario analysis based on the decomposition model is then applied to forecast the CO2 emissions in the future (up to 2030) under different scenarios including Business as Usual (BAU), Efficiency Improvement (EI), Structural Optimization (SO), R&D Input (RD), and Comprehensive Policy (CP) scenarios. Then, uncertainty and sensitivity analyses are discussed. Finally, based on the evaluation of CO2 emission factors and emission reduction potential, the corresponding CO2 emission reduction recommendations are provided for Henan Province, which are also hoped to be broadly applicable to other regions of China.
In particular, in order to understand the impact of R&D activities on CO2 emissions, this paper specifically constructs an RD scenario to better observe the CO2 mitigation potential compared to an EI scenario. Further, the finding of the importance of R&D activities might help local governments formulate more realistic CO2 emission reduction policies. In addition, the change trend of the influencing factors is based on national FYP to make prediction results more reasonable.
The paper is organized as described below. After the introduction and literature review sections, the research methodology and data are presented in Section 3. The research results and a discussion are presented in Section 4. Section 5 discusses the uncertainty and performs sensitivity analysis. Finally, the conclusions and implications of the study are presented in Section 6.

2. Literature Review

Since the 1980s, decomposition methods have been used to analyze the driving forces of energy consumption/energy intensity and carbon emissions/carbon intensity, which are mainly divided into two primary categories: structural decomposition analysis (SDA) and index decomposition analysis (IDA) [17]. The former method is based on input–output table to analyze indirect changes and impacts between economic sectors. In fact, many researchers used this method to study the changes of energy consumption and carbon emissions [18,19,20,21,22,23,24,25]. For example, Geng et al. [21] conducted an SDA approach to provide a holistic picture for Liaoning’s CO2 emissions and indicated that the CO2 emission growth of Liaoning Province was mainly caused by the rapid increase of per capita consumption activities. Mi et al. [24] applied an environmentally extended input–output analysis and structural decomposition analysis to investigate the driving forces behind changes in CO2 emissions embodied in China’s domestic and foreign trade from 2007 to 2012. Furthermore, they used the same method to estimate the driving forces of Chinese export-embodied carbon emissions and found Chinese export-embodied CO2 emissions peaked in 2008 at a level of 1657 million tones [25].
Due to the advantage of data availability, the IDA method has become more widely used and divided into different kinds of approaches: Passche index method, Laspeyres index method, Arithmetic Mean Divisia Index method, and LMDI method [10]. From a comprehensive comparison, the LMDI method is more widely used than other IDA approaches. It has several advantages of full decomposition, no unexplainable residuals, ease of use, and better understanding [26]; especially, it can solve the problem of the dataset without energy data [27]. Thus, it has been widely applied in subsequent carbon emission decomposition studies [28,29,30].
From the perspective of the study areas, based on different spatial dimensions, the LMDI approach has been mainly used in the following main aspects: national level, regional level, and provincial level. In terms of the LMDI method for studying the national level, Fernádez González et al. [31] employed the LMDI method to analyze the factors behind the change in aggregate energy consumption in the EU-27; also identifying differences between member states. In addition, many studies have focused on the driving factors of carbon emission for various countries, such as the UK [32], China [13], Brazil [33], Greece [28], Turkey [30], Portugal [34], Ireland [35], Mexico [36] and South Korea [37]. As for the regional and provincial level, a growing number of studies have been mainly concentrated in China [10,14,38,39], due to the rapid growth of carbon emissions and significant disparities across regions in China. For example, using the LMDI decomposition, Xu et al. [39] decomposed national carbon intensity into three factors and grouped China into seven regions to compare the differences of the influencing factors among each region; and Zhou grouped China into eight regions to analyze the driving factors of CO2 emissions for each region [10].
In addition to studies conducted at the national or regional level, LMDI has been used for studying different sectors, including the economic sector [40], industrial sector [14,41], residential sector [42], transport sector [43] and industrial sub-sectors [44,45,46,47]. For example, Zhao et al. [40] decomposed the CO2 emissions from five major economic sectors and measured the contribution of each factor to the decoupling of China’s overall economy from CO2 emissions. Zhang et al. [42] employed the LMDI method to decompose the changes in residential energy consumption into four factors: energy structure, energy efficiency, floor area, and population. They indicated that the population and floor area factors were the most responsible for increasing urban residential energy consumption. Zhang et al. [43] identified the relations between transportation energy consumption and analyzed the nature of the factors influencing the changes in transportation energy consumption.
Currently, based on the decomposition of carbon emissions, some investigators have applied a decoupling model to evaluate the relationship between economic growth and carbon emissions [10,40]. On the other hand, some used scenario analysis to design different scenarios and combined different methods to predict future carbon emissions, such as Kaya Identity [46], the co-integration method [41,48], and the Monte Carlo simulation approach [12].
In this study, a prediction method introduced by Lin and Ouyang [49] is selected to forecast the CO2 emissions in the future (up to 2030) under different scenarios after decomposition analysis. Although there have been a few studies regarding the application of the LMDI model with microeconomic factors (including R&D and investment factors) as well as utilizing different prediction methods for forecasting future CO2 emissions, to the best of our knowledge, this is the first attempt to combine these two tasks together, since different scenarios in the future forecasting analysis should be based on the decomposition results. It is our hope that approaches for achieving CO2 emission reduction from the optimal scenario analysis are useful for regulatory agency and the corresponding strategies and measures taken to achieve realistic CO2 emission reduction.

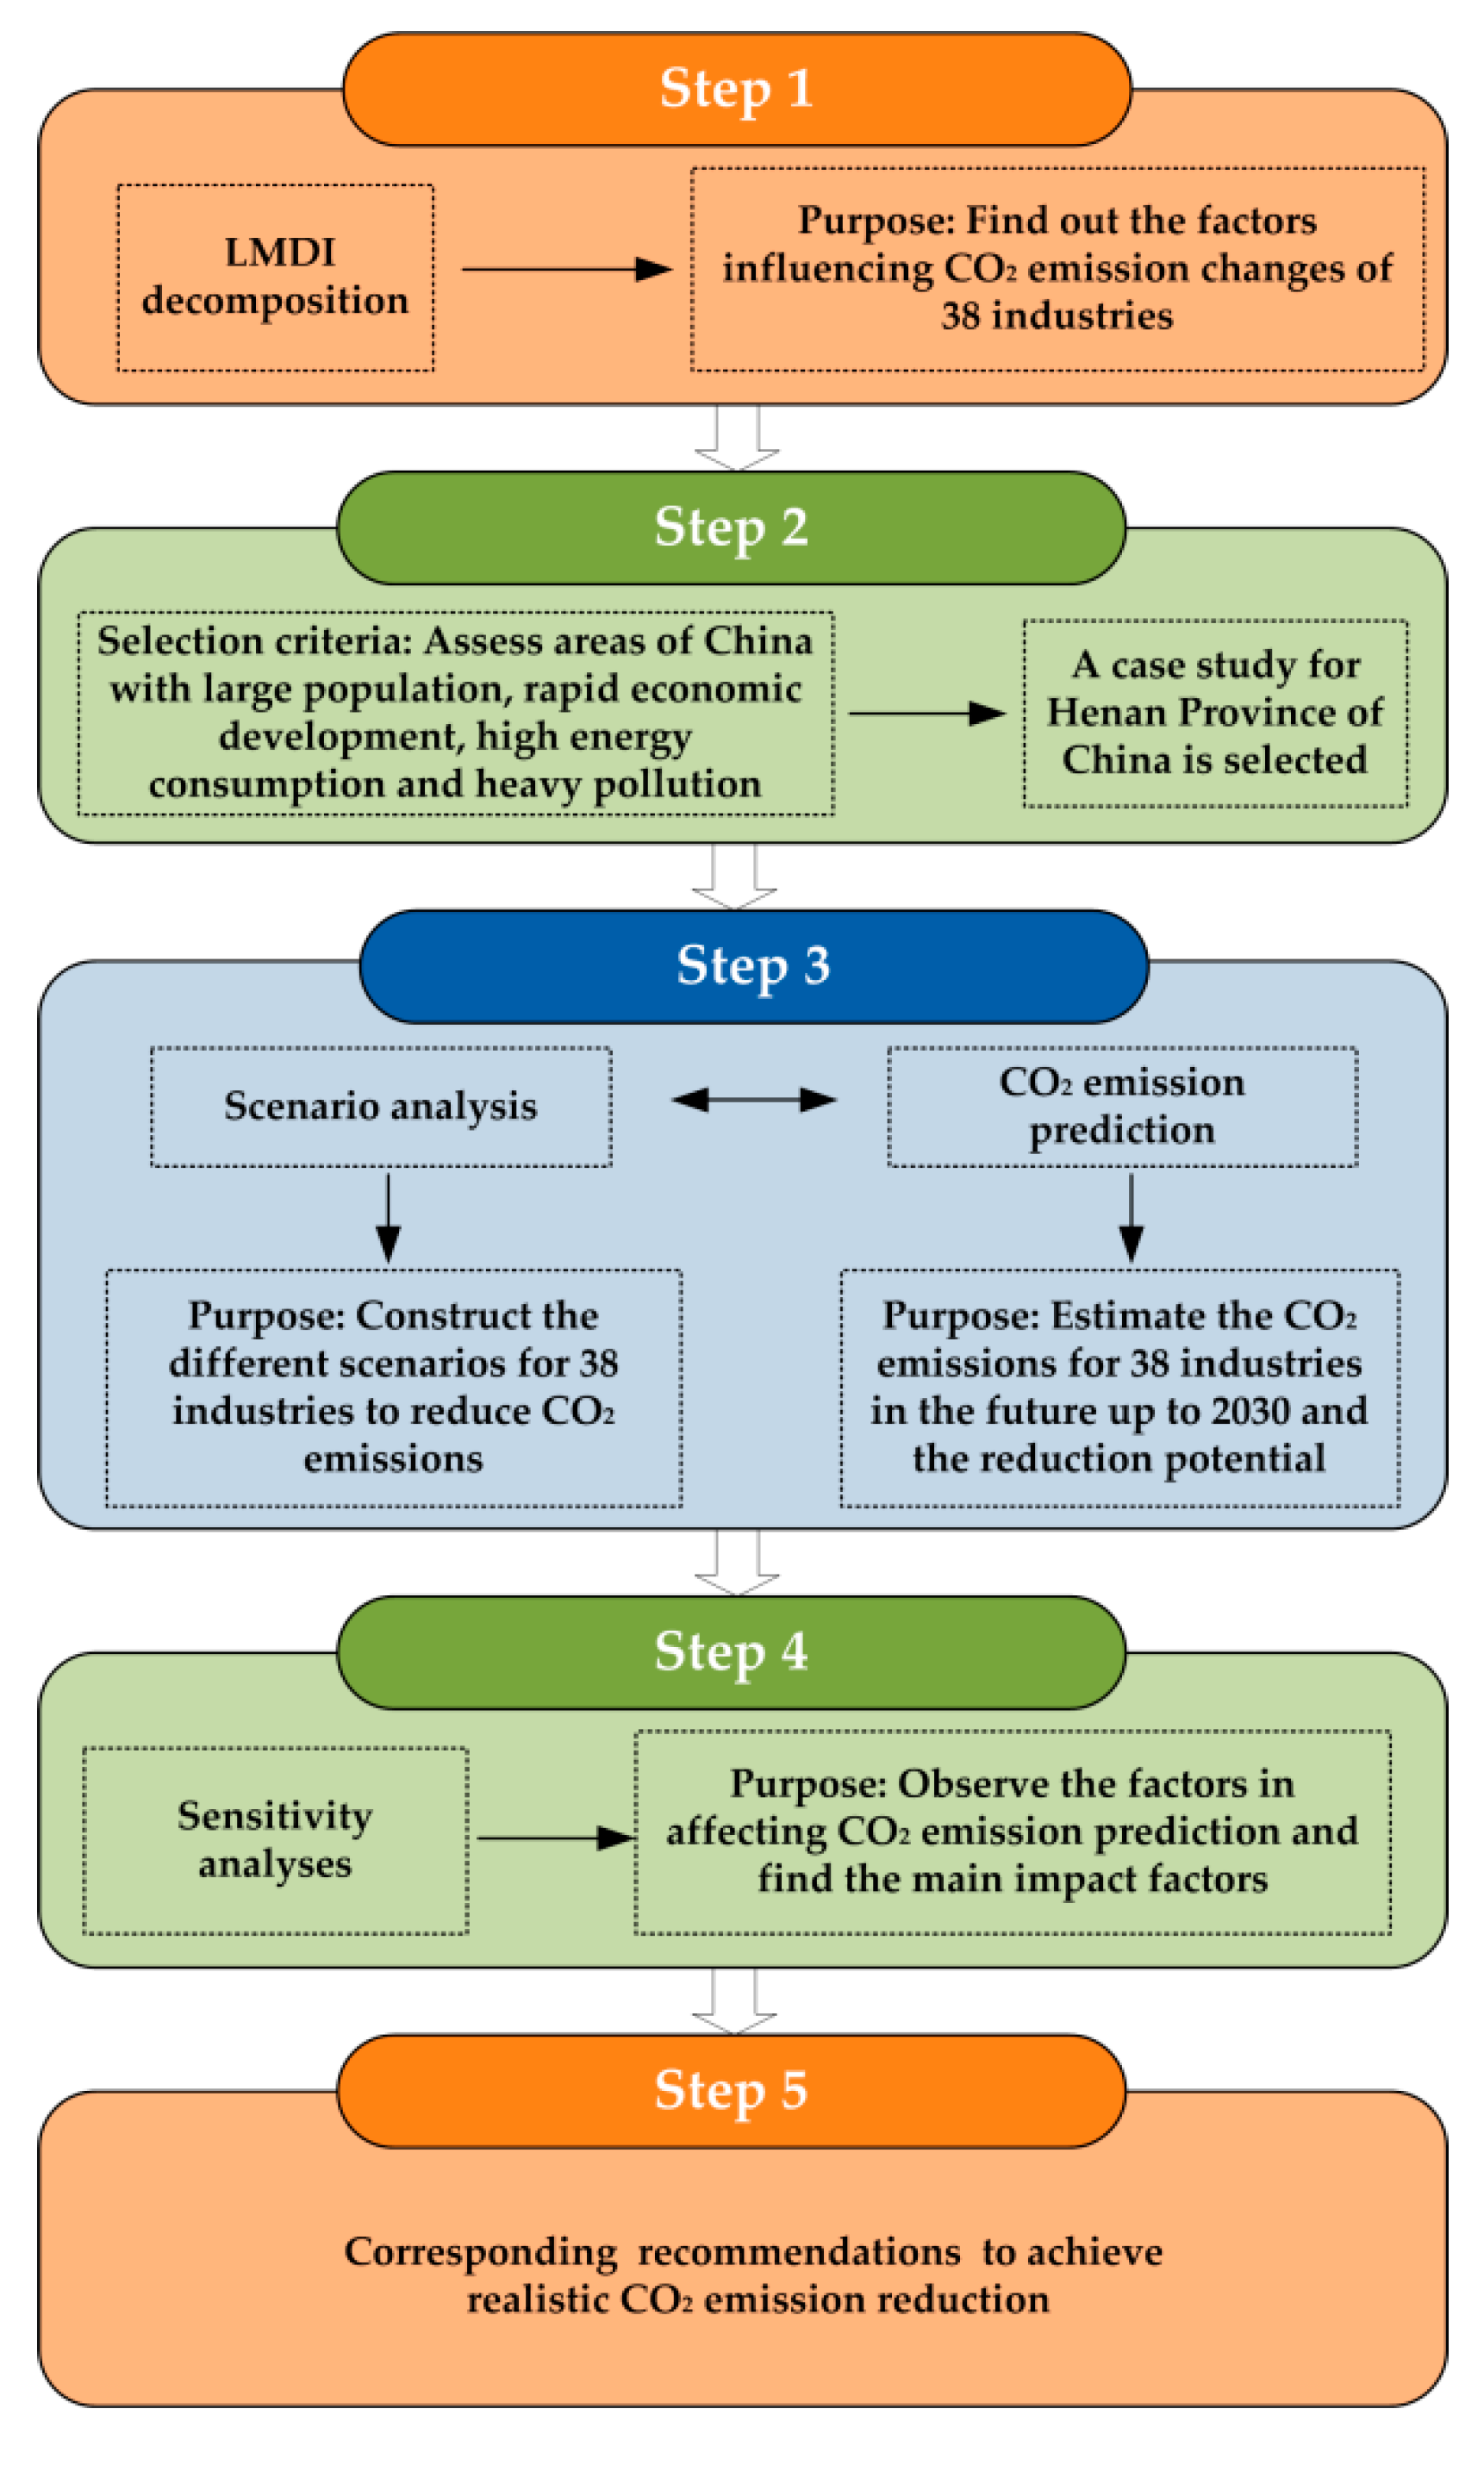
3. Research Methods and Data Sources
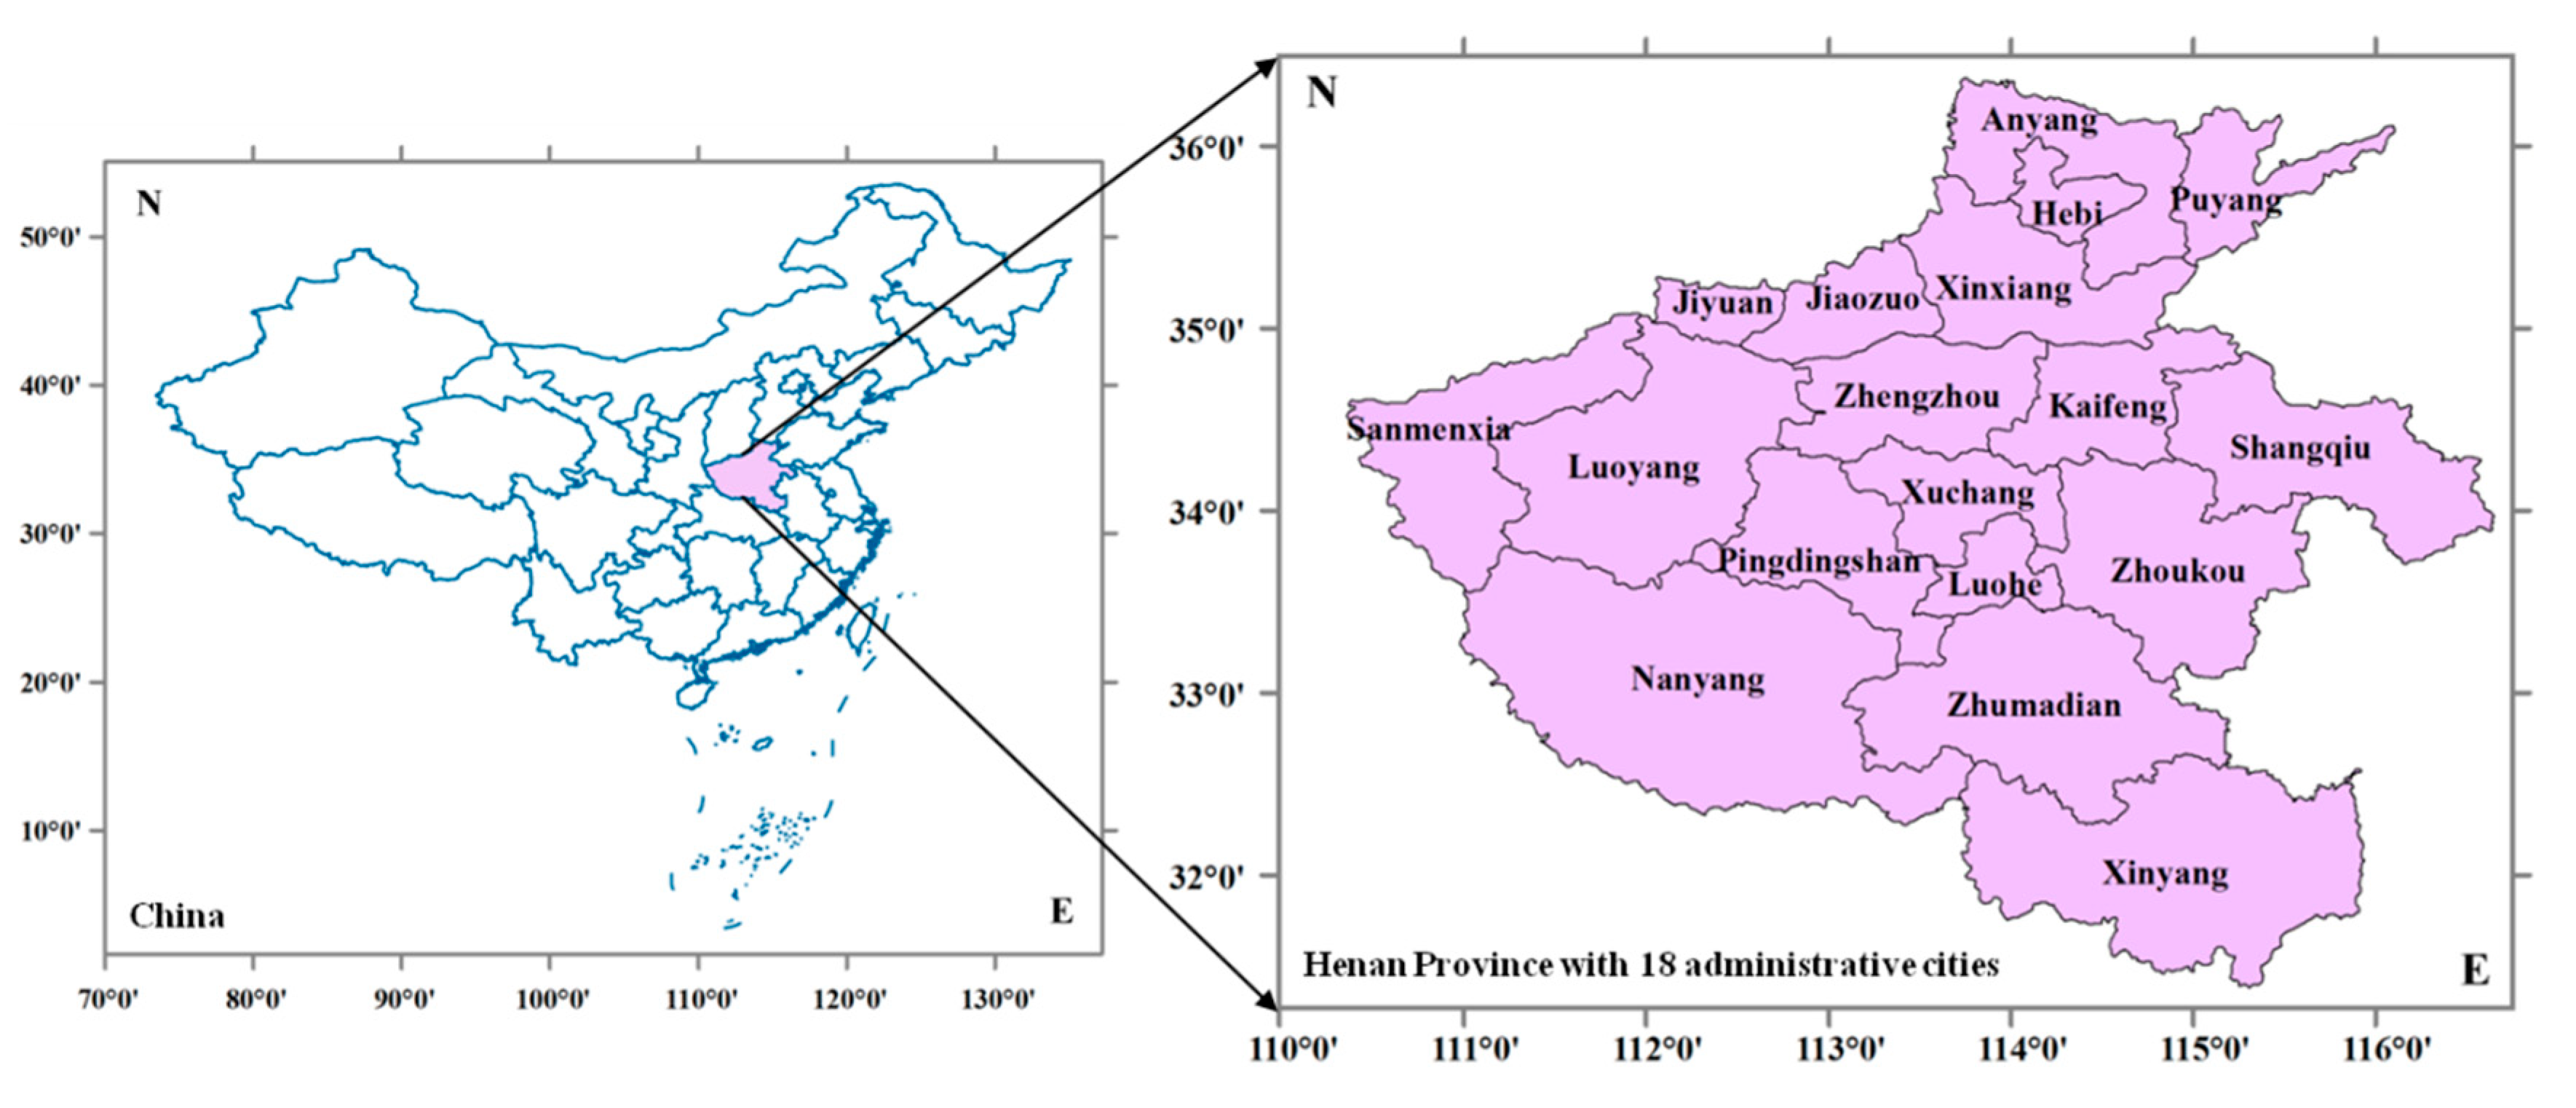
3.1. Study Domain

The study domain of Henan Province is in the center of China, including 18 administrative cities (Figure 2), which is as a key part of the Central Plains Urban Agglomeration classified by the National State Council. As one of the most populous and industrializing provinces of China, the average annual growth rate of gross domestic product (GDP) was 10.7% during the period of 2001–2015. In 2015, its overall GDP was about 2530×109 RMB (2001 constant price, Figure 3a), accounting for approximately 6% of China’s GDP. Furthermore, its economic growth was mainly driven by the development of the industry sector, which accounted for 42% of the entire GDP in 2015 (Figure 3a). The corresponding energy consumption for all sectors reached 232 Mtce (million metric ton coal equivalent) in 2015, with industrial energy consumption accounting for about 70% (Figure 3b). The entire energy-related carbon emissions also had a high annual growth of 6.5% between 2001 and 2015. Through implementing energy-saving and emission reduction measures, the growth of energy consumption and CO2 emissions has slowed down since 2010 as clearly demonstrated in Figure 3b. Nonetheless, the amount of CO2 emissions is still large and needs to be further reduced to achieve CO2 emission peak before 2030.

3.2. Estimation of CO2 Emissions

The calculation of industrial energy-related CO2 emissions refers to the method proposed by the IPCC [50] as follows. The definitions of relevant variables are listed in Table 1.
E C = i j E C i j = i j E i j · N C V j · C C j · O j · 44 12

3.3. LMDI Decomposition

This study applied Kaya identity to propose the following expression of industrial energy-related CO2 emissions. Based on Shao et al. [14], the identity is further extended to quantitatively analyze the eight factors affecting CO2 emissions as in Equation (2), and the meanings of relevant variables are also presented in Table 1.
E C = i j E C i j = i j E C i j E i j · E i j E i · E i Y i · Y i R i · R i I i · I i Y i · Y i Y · Y = i j E F i j · E S i j · E I i j · R E i · R I i · I I i · I S i · Y
Thus, according to the LMDI method, the CO2 emission changes can be decomposed into eight factors: carbon emission coefficient (ΔECEF), energy structure (ΔECES), energy intensity (ΔECEI), R&D efficiency (ΔECRE), R&D intensity (ΔECRI), investment intensity (ΔECII), industrial internal structure (ΔECIS), and economic output (ΔECY) as shown in Equation (3).
Δ E C t o t = E C T E C 0 = Δ E C E F + Δ E C E S + Δ E C E I + Δ E C R E + Δ E C R I + Δ E C I I + Δ E C I S + Δ E C Y
where, ΔECtot represents the total changes in CO2 emission (Mt) and ECT and EC0 represent the CO2 emissions in the Tth and base year, respectively. ΔECEF, ΔECES, ΔECEI, ΔECRE, ΔECRI, ΔECII, ΔECIS, and ΔECY represent the above difference effects of CO2 emissions between Tth and the base year.
Considering that the carbon emission coefficients of various fuels are relatively fixed in a given period, the coefficient effect on CO2 emission can be negligible (i.e., ΔECEF = 0) as also performed in similar studies [13,51]. Therefore, based on the LMDI method, the resultant seven factors in Equation (3) can be calculated as follows [52]:
Δ E C E S = i j E C i j T E C i j 0 l n E C i j T l n E C i j 0 l n ( E S i j T E S i j 0 )
Δ E C E I = i j E C i j T E C i j 0 l n E C i j T l n E C i j 0 l n ( E I i T E I i 0 )
Δ E C R E = i j E C i j T E C i j 0 l n E C i j T l n E C i j 0 l n ( R E i T R E i 0 )
Δ E C R I = i j E C i j T E C i j 0 l n E C i j T l n E C i j 0 l n ( R I i T R I i 0 )
Δ E C I I = i j E C i j T E C i j 0 l n E C i j T l n E C i j 0 l n ( I I i T I I i 0 )
Δ E C I S = i j E C i j T E C i j 0 l n E C i j T l n E C i j 0 l n ( I S i T I S i 0 )
Δ E C Y = i j E C i j T E C i j 0 l n E C i j T l n E C i j 0 l n ( Y T Y 0 )
For ( E C i j T E C i j 0 ) / ( l n E C i j T l n E C i j 0 ) in Formula (4)–(10), we define
L ( E C i j T , E C i j 0 ) = { ( E C i j T E C i j 0 ) / ( l n E C i j T l n E C i j 0 )   , if   E C i j T E C i j 0 E C i j T   or   E C i j 0 ,   if   E C i j T = E C i j 0 0 ,   if   E C i j T × E C i j 0 = 0

3.4. Prediction of CO2 Emissions

According to Lin and Ouyang [49] and Zhu et al. [11], we assume that α, β, γ, δ, θ, ν, μ, and φ are the annual growth rate of change of the carbon emission coefficient (ΔECEF), economic output (ΔECY), industrial internal structure (ΔECIS), energy structure (ΔECES), energy intensity (ΔECEI), R&D intensity (ΔECRI), R&D efficiency (ΔECRE), and investment intensity (ΔECII) from base year 0 to target year T, respectively. Therefore, ECEF(T) = ECEF(0)(1+α), ECY(T) = ECY(0)(1+β), ECIS(T) = ECIS(0)(1+γ), ECES(T) = ECES(0)(1+δ), ECEI(T) = ECEI(0)(1+θ), ECRI(T) = ECRI(0)(1+ν), ECRE(T) = ECRE(0)(1+μ), and ECII(T) = ECII(0)(1+φ). Moreover, because the value of i j E C i j T E C i j 0 l n E C i j T l n E C i j 0 can be estimated as an approximation, the following expressions can be obtained.
Δ E C E F i j E C i j T E C i j 0 l n E C i j T l n E C i j 0 ln ( 1 + α )
Δ E C Y i j E C i j T E C i j 0 l n E C i j T l n E C i j 0 ln ( 1 + β )
Δ E C I S i j E C i j T E C i j 0 l n E C i j T l n E C i j 0 ln ( 1 + γ )
Δ E C E S i j E C i j T E C i j 0 l n E C i j T l n E C i j 0 ln ( 1 + δ )
Δ E C E I i j E C i j T E C i j 0 l n E C i j T l n E C i j 0 ln ( 1 + θ )
Δ E C R I i j E C i j T E C i j 0 l n E C i j T l n E C i j 0 ln ( 1 + ν )
Δ E C R E i j E C i j T E C i j 0 l n E C i j T l n E C i j 0 ln ( 1 + μ )
Δ E C I I i j E C i j T E C i j 0 l n E C i j T l n E C i j 0 ln ( 1 + φ )
In the above expressions, we define that W = i j E C i j T E C i j 0 l n E C i j T l n E C i j 0 , where
W = E C 0 · [ ( 1 + α ) · ( 1 + β ) · ( 1 + γ ) · ( 1 + δ ) · ( 1 + θ ) · ( 1 + ν ) · ( 1 + μ ) · ( 1 + φ ) 1 ] L n [ ( 1 + α ) · ( 1 + β ) · ( 1 + γ ) · ( 1 + δ ) · ( 1 + θ ) · ( 1 + ν ) · ( 1 + μ ) · ( 1 + φ ) ]
Based on the above models, future industrial energy-related CO2 emissions can be predicted, and the contributions of each factor can also be quantified. Therefore, Equation (3) can be rewritten as Equation (21) to forecast the CO2 emissions in year T:
E C T = E C 0 + Δ E C E F + Δ E C E S + Δ E C E I + Δ E C R E + Δ E C R I + Δ E C I I + Δ E C I S + Δ E C Y

3.5. Data Processing

According to the Henan Statistical Yearbook, 38 industrial subsectors are considered in this study as listed in Table 2. For convenience, the data of the 38 sectors are aggregated in four major industrial sectors (including Mining and Quarrying; Manufacturing; Production and Supply of Electric Power, Gas and Water; and Other Industries). Long term data (from 2001 to 2015) were retrieved from different sources. The economic (industrial added value, R&D expenditure, and fixed asset investment) and energy consumption (fuel) data were obtained for each subsector of the overall 38 industrial sectors from the Henan Statistical Yearbook [53]. In order to ensure the comparability of the data, all the economic variables were adjusted to 2001 constant prices based on the consumer price index. Five types of fuels were considered in the study, including coal, coke, crude oil, diesel oil, and fuel oil. The values of NCV, CC, and O on each fuel were obtained from China Energy Statistics Yearbook [54] (NBS, 2015), IPCC [50] and Wang et al. [55], respectively, and they are assumed to be constant over the study period (2001–2015).

4. Results and Discussions

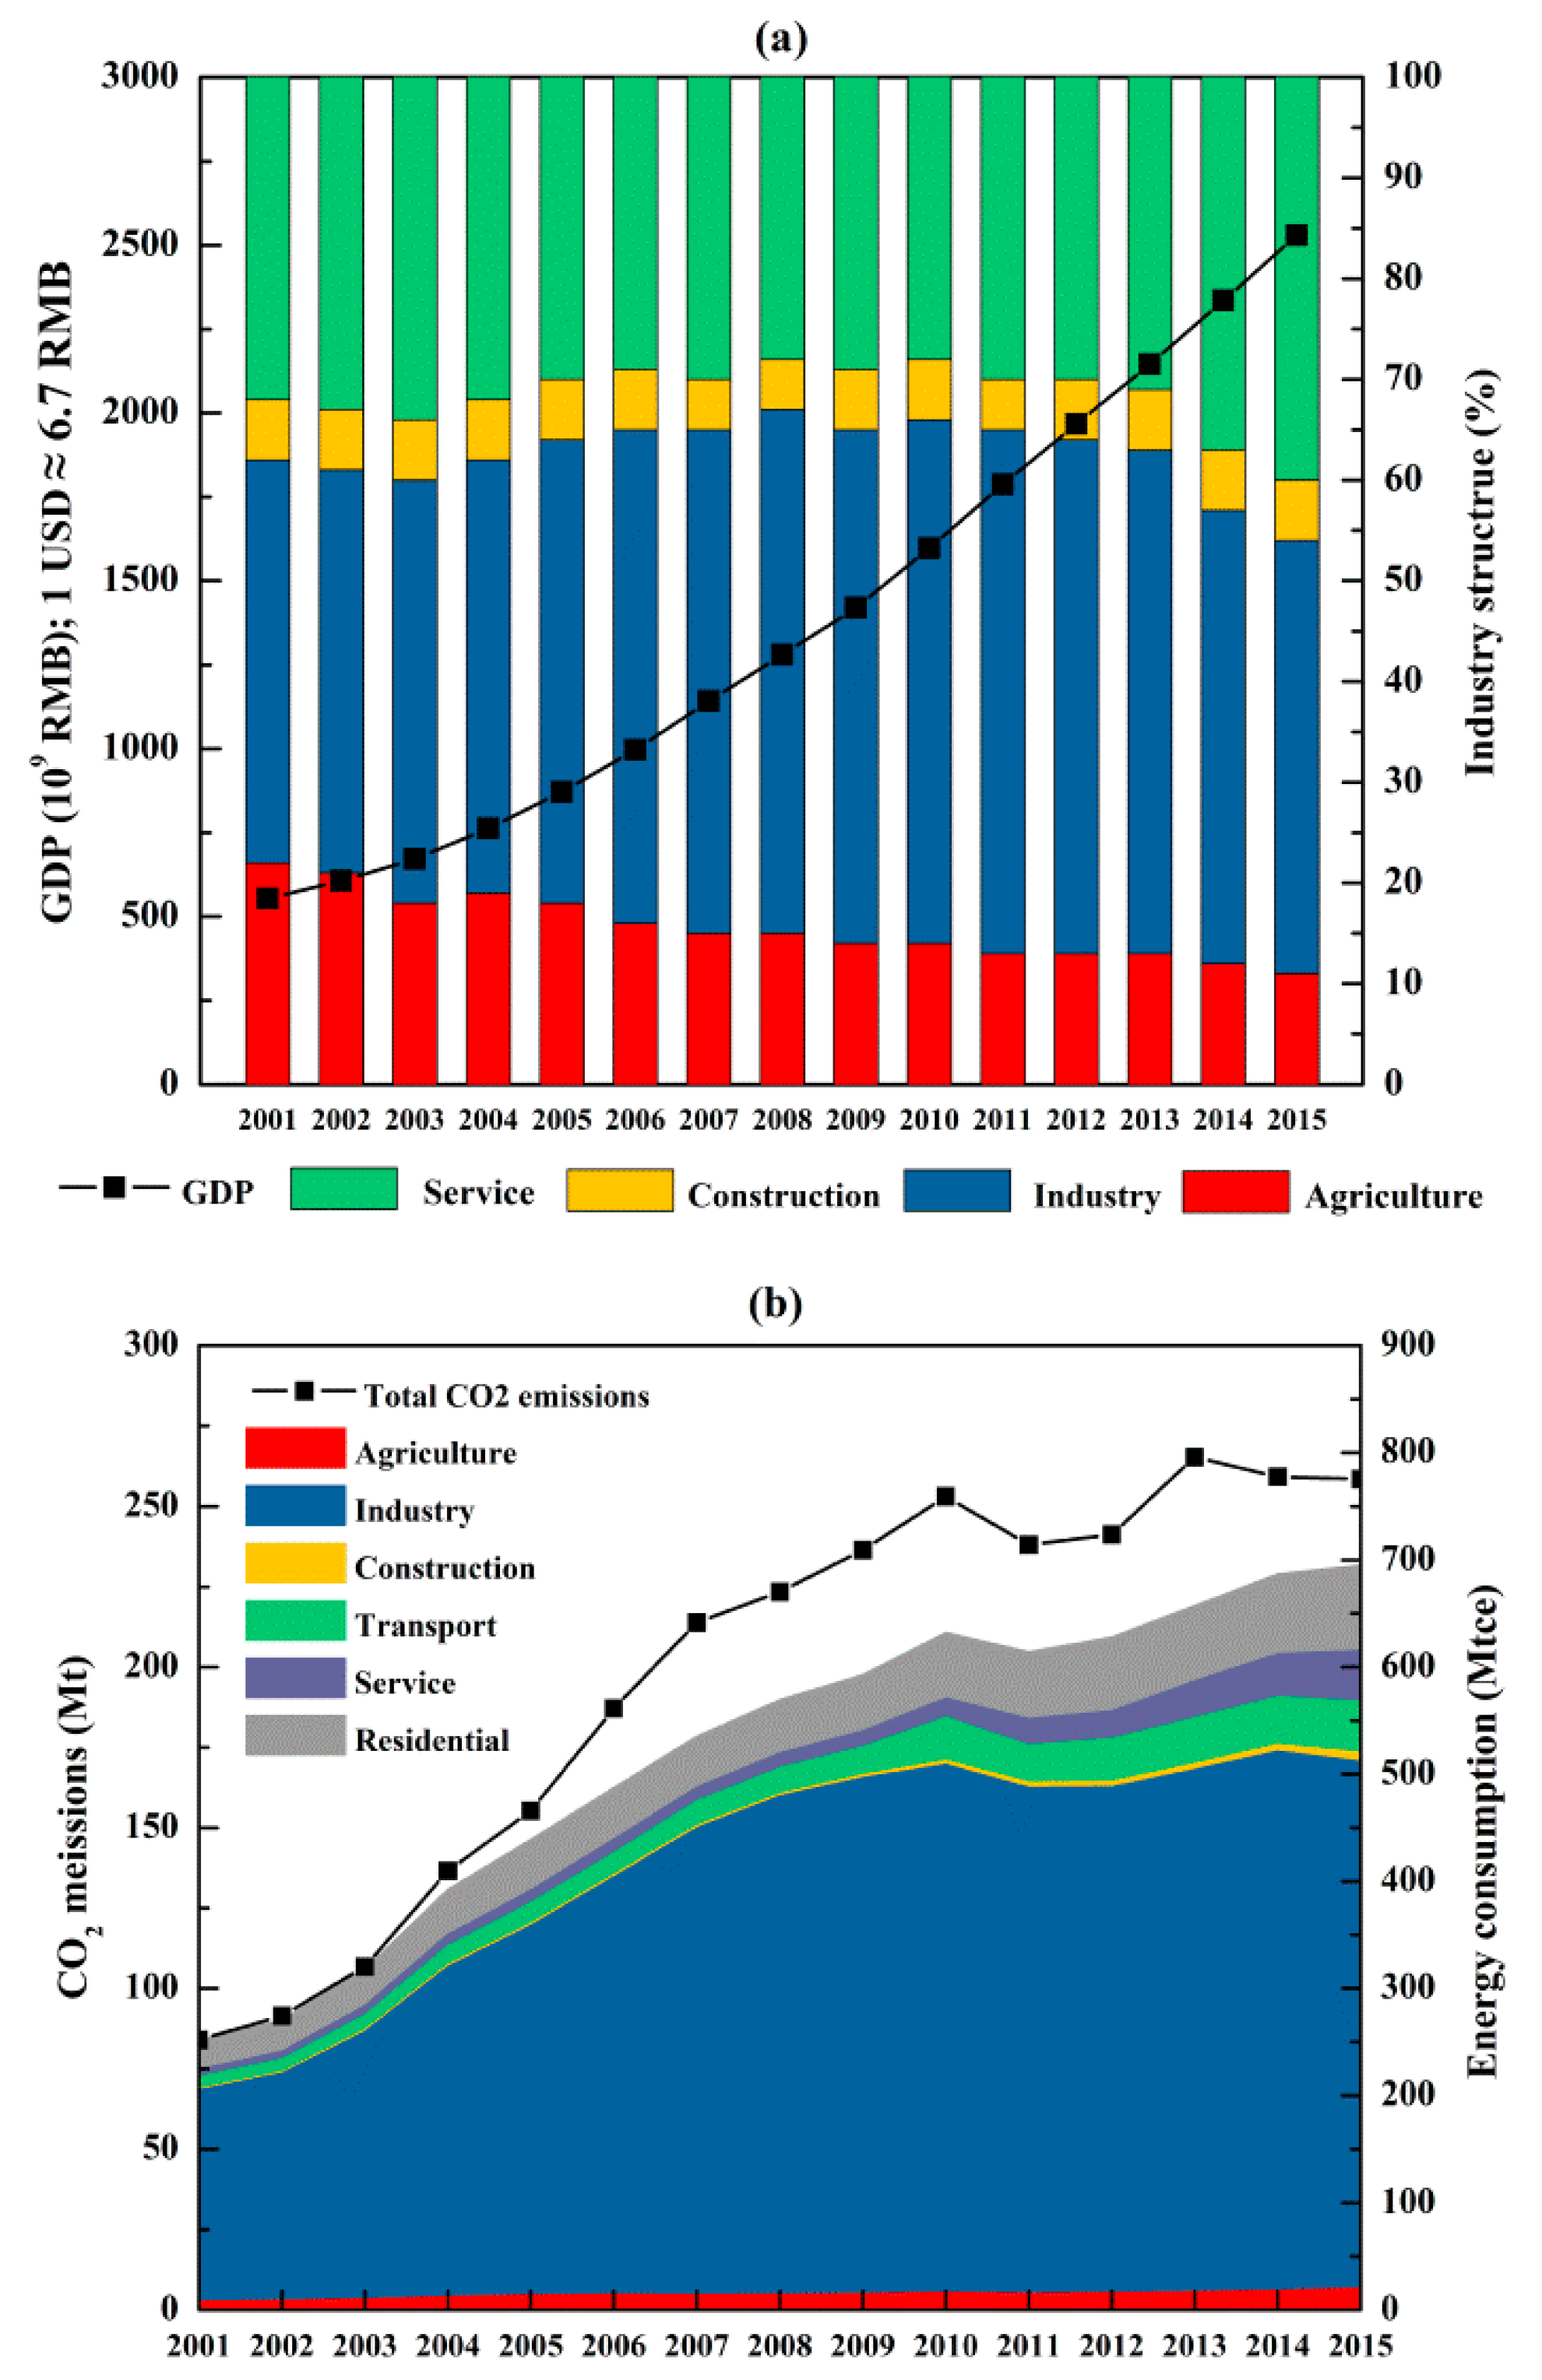
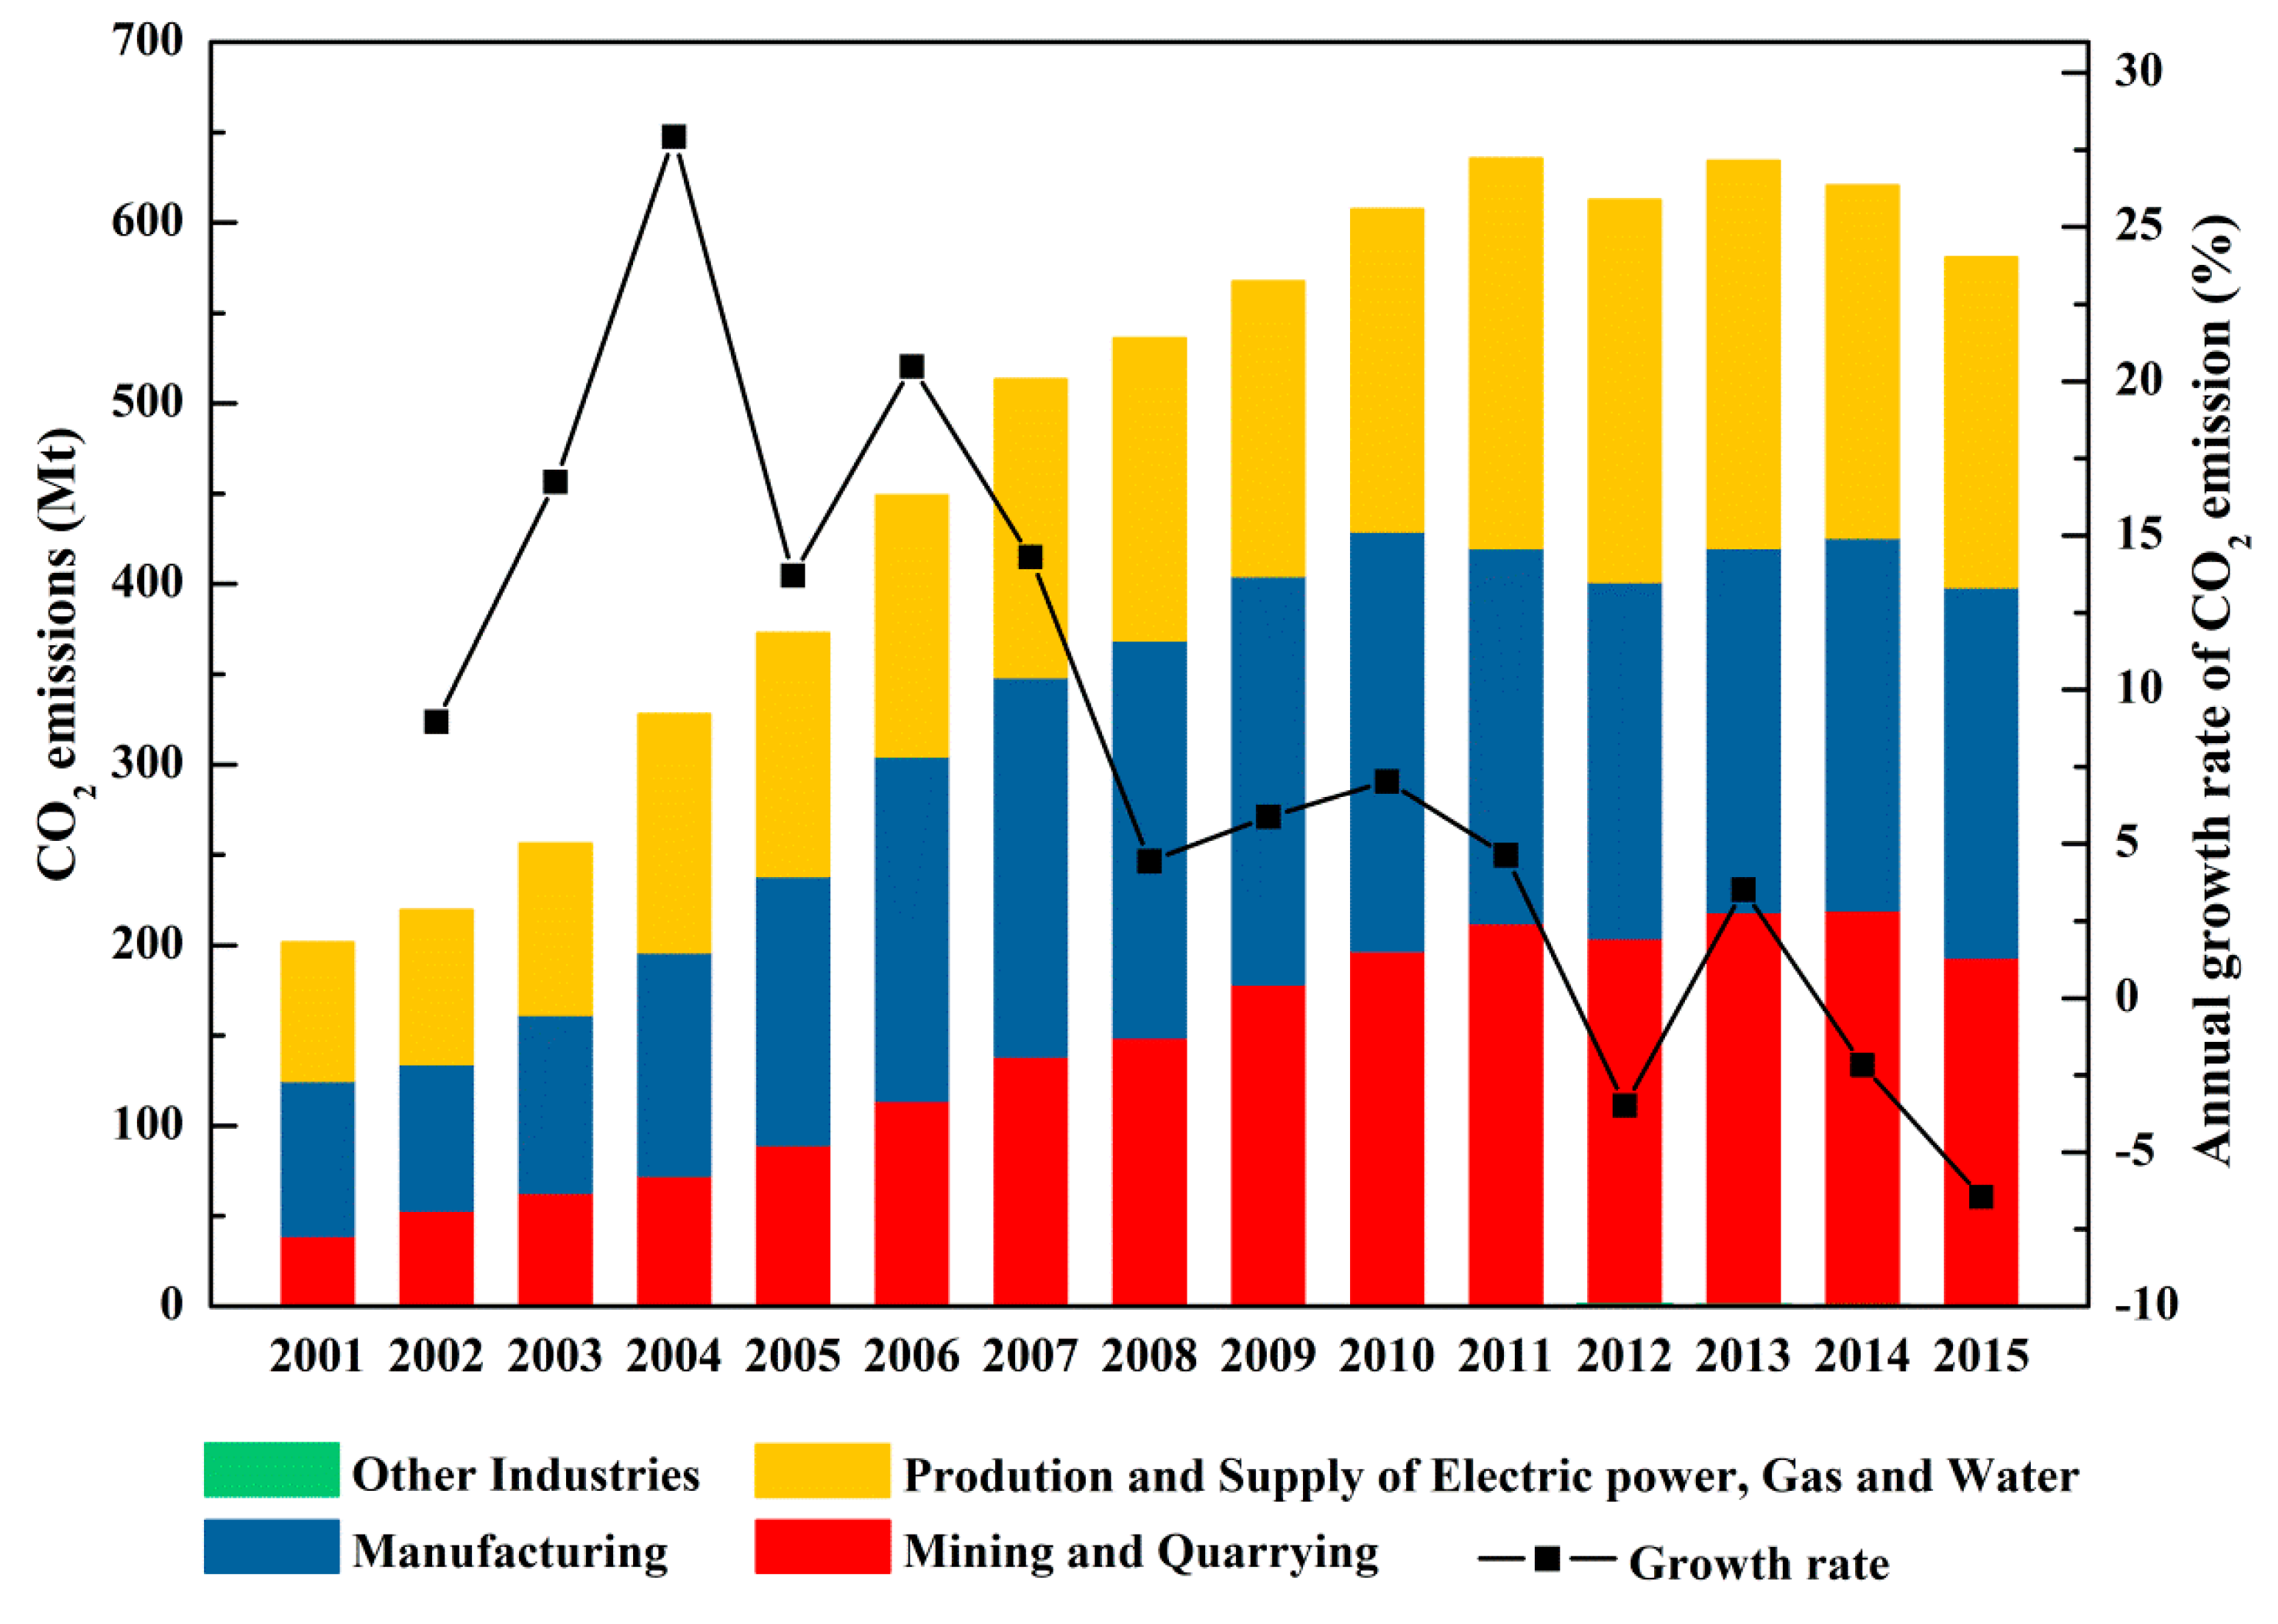
4.1. Analysis of Industrial Energy-Related CO2 Emission Features

With the rapid development of industry in Henan Province, its industrial energy-related CO2 emissions experienced an increasing trend, with an increasing amount of 381 Mt from 2001 to 2015 (Figure 4). During the three consecutive FYP stages, the CO2 emissions present a positive increasing trend during the 10th (2001–2005) and 11th (2006–2010) FYP periods. As the Chinese government gradually intensified the implementation of CO2 emission reduction policy, the growth rate of the CO2 emissions decreased (except for 2013 year) as reflected by CO2 emissions during the 12th FYP period (2010–2015) shown in Figure 4.
In order to better understand the changes in the inner components of CO2 emissions of the industrial sector, the industrial sector was further divided into four categories as mentioned before. As indicated from Figure 4, the quantity of CO2 emissions of the Mining and Quarrying subsector increased from 2001 to 2011 (from 39 to 212 Mt) and then stayed at a relatively certain level afterwards. The increase is due to the fact that Henan Province is rich in coal resources, and governmental policy in closing small mining industries caused the slowdown in this subsector after 2011. In contrast, due to the shift of the industrial structure (to the service sector), the contribution of the Manufacturing subsector to CO2 emissions has been decreasing (from 43% in 2001 to 35% in 2015). As for the subsector of Production and Supply of Electric Power, Gas and Water, there is a slight CO2 emissions decrease in the proportion of the entire industrial sector (from 38% to 31% in 2015) because of increasing renewable energy and new energy generation.

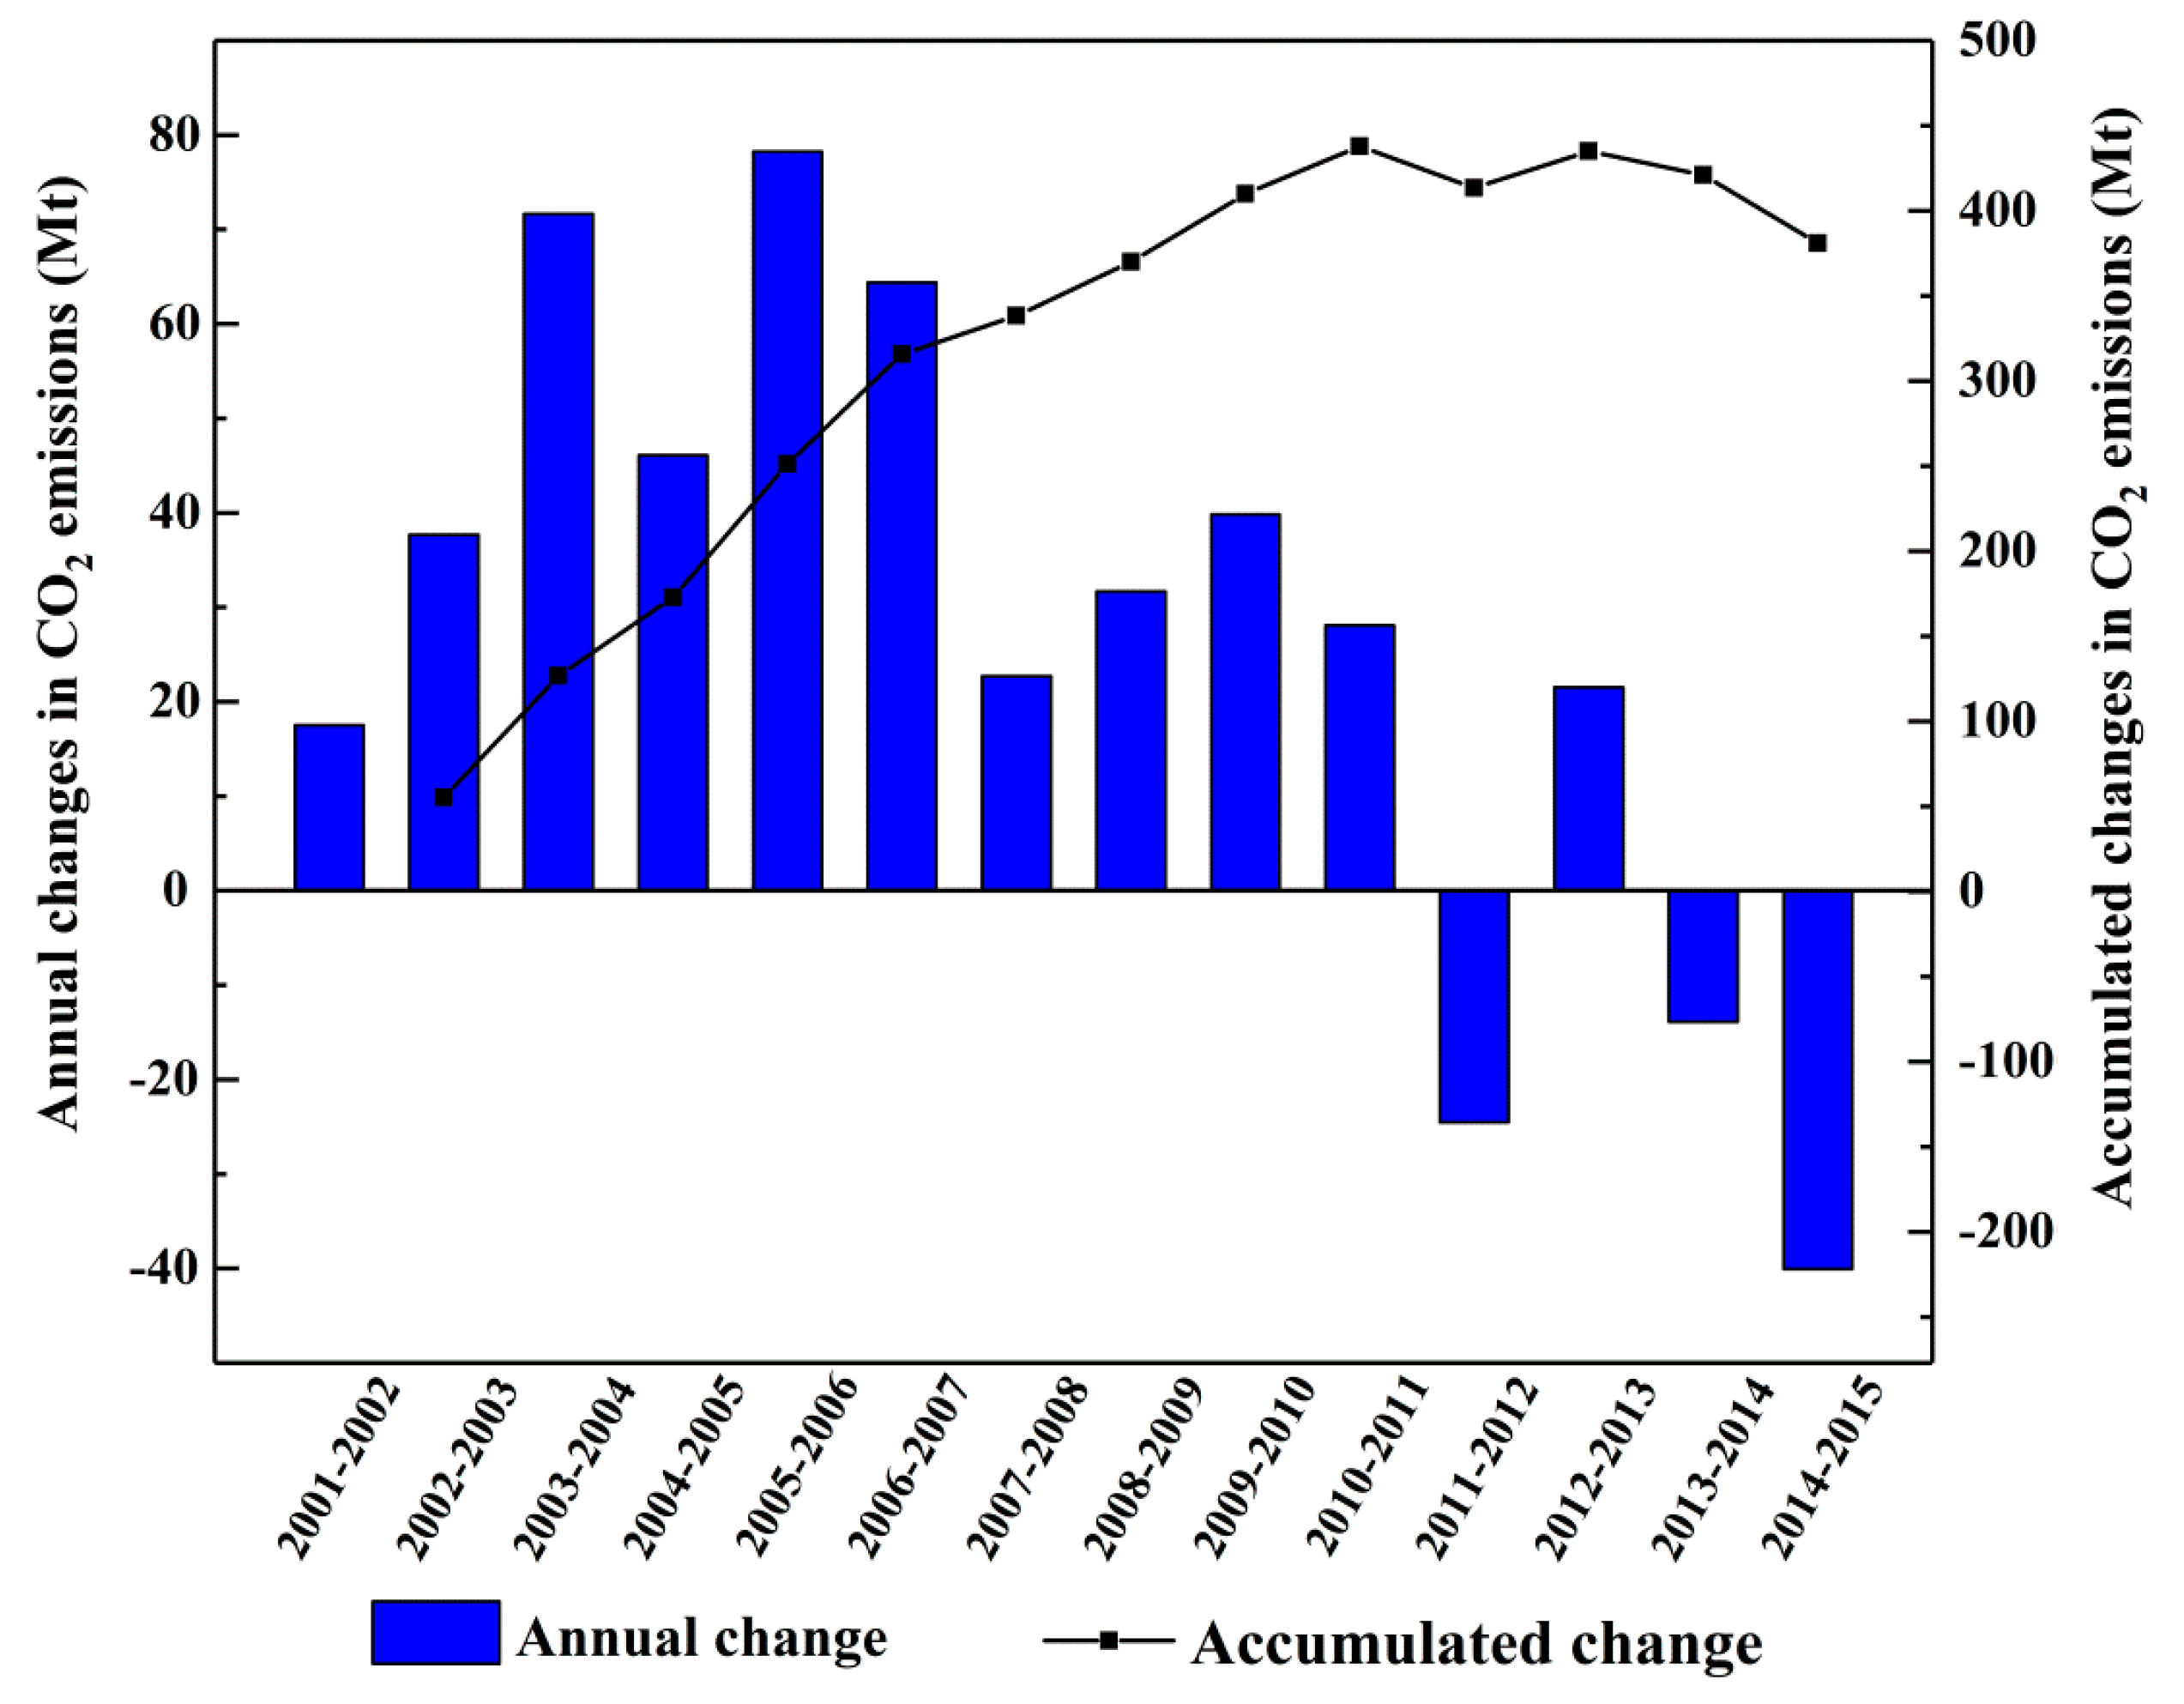
4.2. Analysis of Emission Change Trends and Contributions of Various Factors

Based on the LMDI decomposition model, changes in the industrial energy-related CO2 emissions during the 2001–2015 periods are decomposed into the following seven factors as mentioned before. Table 3 lists the CO2 emission changes among these factors between the years and the contribution of each factor towards the total emissions change. For the contribution ratios, negative numbers in Table 3 denote the positive contribution of reducing CO2 emissions. From the cumulative perspective (Table 3 and Figure 5), CO2 emissions increased approximately 381 Mt over the 2001–2015 period. The economic output, R&D intensity, and investment intensity were the positive drivers (increasing CO2 emissions) of changes in CO2 emissions, with contributions of 293%, 83%, and 80% of total CO2 emission changes, respectively. Conversely, the industrial internal structure, energy intensity, and R&D efficiency exhibited a negative impact (decreasing CO2 emissions), with contributions of −108%, −86%, and −163% to the changes, respectively. It is interesting to note that energy structure has little effect on CO2 emission changes, which will be discussed in Section 4.3. Obviously, the accumulative negative effects are not sufficient to offset the positive effects, as also reported in Wang and Feng [56] for decomposing changes in energy-related CO2 emissions in China over the 2000–2014 period. From the year-by-year data (Table 3 and Figure 5), the net effects of CO2 emission changes in all these years are positive, except for the last three periods (2011–2012, 2013–2014 and 2014–2015); the reduction is certainly due to governmental policies in combating CO2 emission.
Considering that the industrial sector is the largest contributor to CO2 emissions, decomposition analysis for its three main subsectors is further discussed and shown in Figure 6. Also, the effect of various stages of national FYP (10th (2001–2005), 11th (2006–2010), and 12th FYP (2011–2015)) on CO2 emissions can be seen in Figure 6. For the Manufacturing subsector, the changes on CO2 emissions are 63.9, 42.0, and −4.0 Mt at the three stages, respectively. Clearly, the impact of various policies in these FYPs on CO2 emission reduction is significant, particularly the 12th FYP (from 42 to −4 Mt). The most important factor in this subsector affecting CO2 emission changes for these three FYPs is different: R&D intensity (negative), economic output (positive) and economic output (positive), respectively, for the 10th, 11th and 12th FYP. Furthermore, the energy intensity factor was the primary contributor to the reducing emissions in the three FYP periods. With the effective implementation of energy intensity reduction technologies of the manufacturing industry (e.g., steel, cement and other high energy-consuming industries), energy efficiency has been greatly improved resulting in significant CO2 emissions reduction. Incidentally, the industry sector S19 (Manufacturing of Raw Chemical Materials and Chemical Products) had the highest CO2 emissions in 2015 (45 Mt) in the Manufacturing subsector while S18 (Processing of Petroleum, Coking, Processing of Nuclear Fuel) industry achieved the highest reduction change between 2011 and 2015 (−9 Mt).
As for the Mining and Quarrying subsector, the increases in CO2 emissions are 51.2, 82.9, and −19.0 Mt during the three stages, respectively. The R&D intensity (negative) and investment intensity (positive) had a greater impact on changes in CO2 emissions during the 10th FYP period. By the time of the 11th FYP, the most influential factors were economic output (positive) and R&D intensity, while investment intensity became a negative driver, albeit with an insignificant impact. Although the important factors in the 12th FYP were the same as that of the 10th FYP, the effects on CO2 emissions were reversed, i.e., investment intensity became a negative driver with R&D intensity being a positive one; the negative factor offset the positive, resulting in negative CO2 emission changes (−19 Mt). Over the entire period 2001–2015, R&D efficiency and industrial internal structure were the main factors mitigating the CO2 emissions, while the effects of energy intensity and energy structure were minimal on reducing CO2 emissions. Based on the current positive drivers, a sensible approach is to further promote R&D intensity to lower its positive impact and even make it a negative driver.
The other subsector for producing energy (Production and Supply of Electric Power, Gas and Water) demands a lot of energy and thus produces substantial CO2 emissions [57]. Therefore, it is also an important sector for emission reduction. The changes of energy-related CO2 emissions are 57.8, 33.7, and −33.3 Mt at the three stages, respectively; again demonstrating the effectiveness of governmental measures in FYPs. In mitigating the CO2 emissions over 2001–2015, R&D efficiency (negative) and industrial internal structure (negative) were the main factors while the energy structure (negative) had little effect; the phenomenon is consistent with the Mining and Quarrying subsector.
To prove a better comprehension, Table 4 lists the CO2 emissions in the beginning year of 2001 and 2015 as well as the extent of increase. The manufacturing subsector had the highest CO2 emissions in 2001 (86 Mt) but the increased percentage between 2001 and 2015 was the lowest (138%) compared to two other subsectors. Also, the subsector of Production and Supply of Electric Power, Gas and Water had the smaller CO2 emission changes (106 Mt), implying its CO2 emissions grow slowly compared to the other two subsectors. Since the increased percentage for the Mining subsector between 2001 and 2015 was the highest (395%), the efforts to reduce its activity are significant including the governmental policy to limit coal consumption by 2030 and use of clean energy.

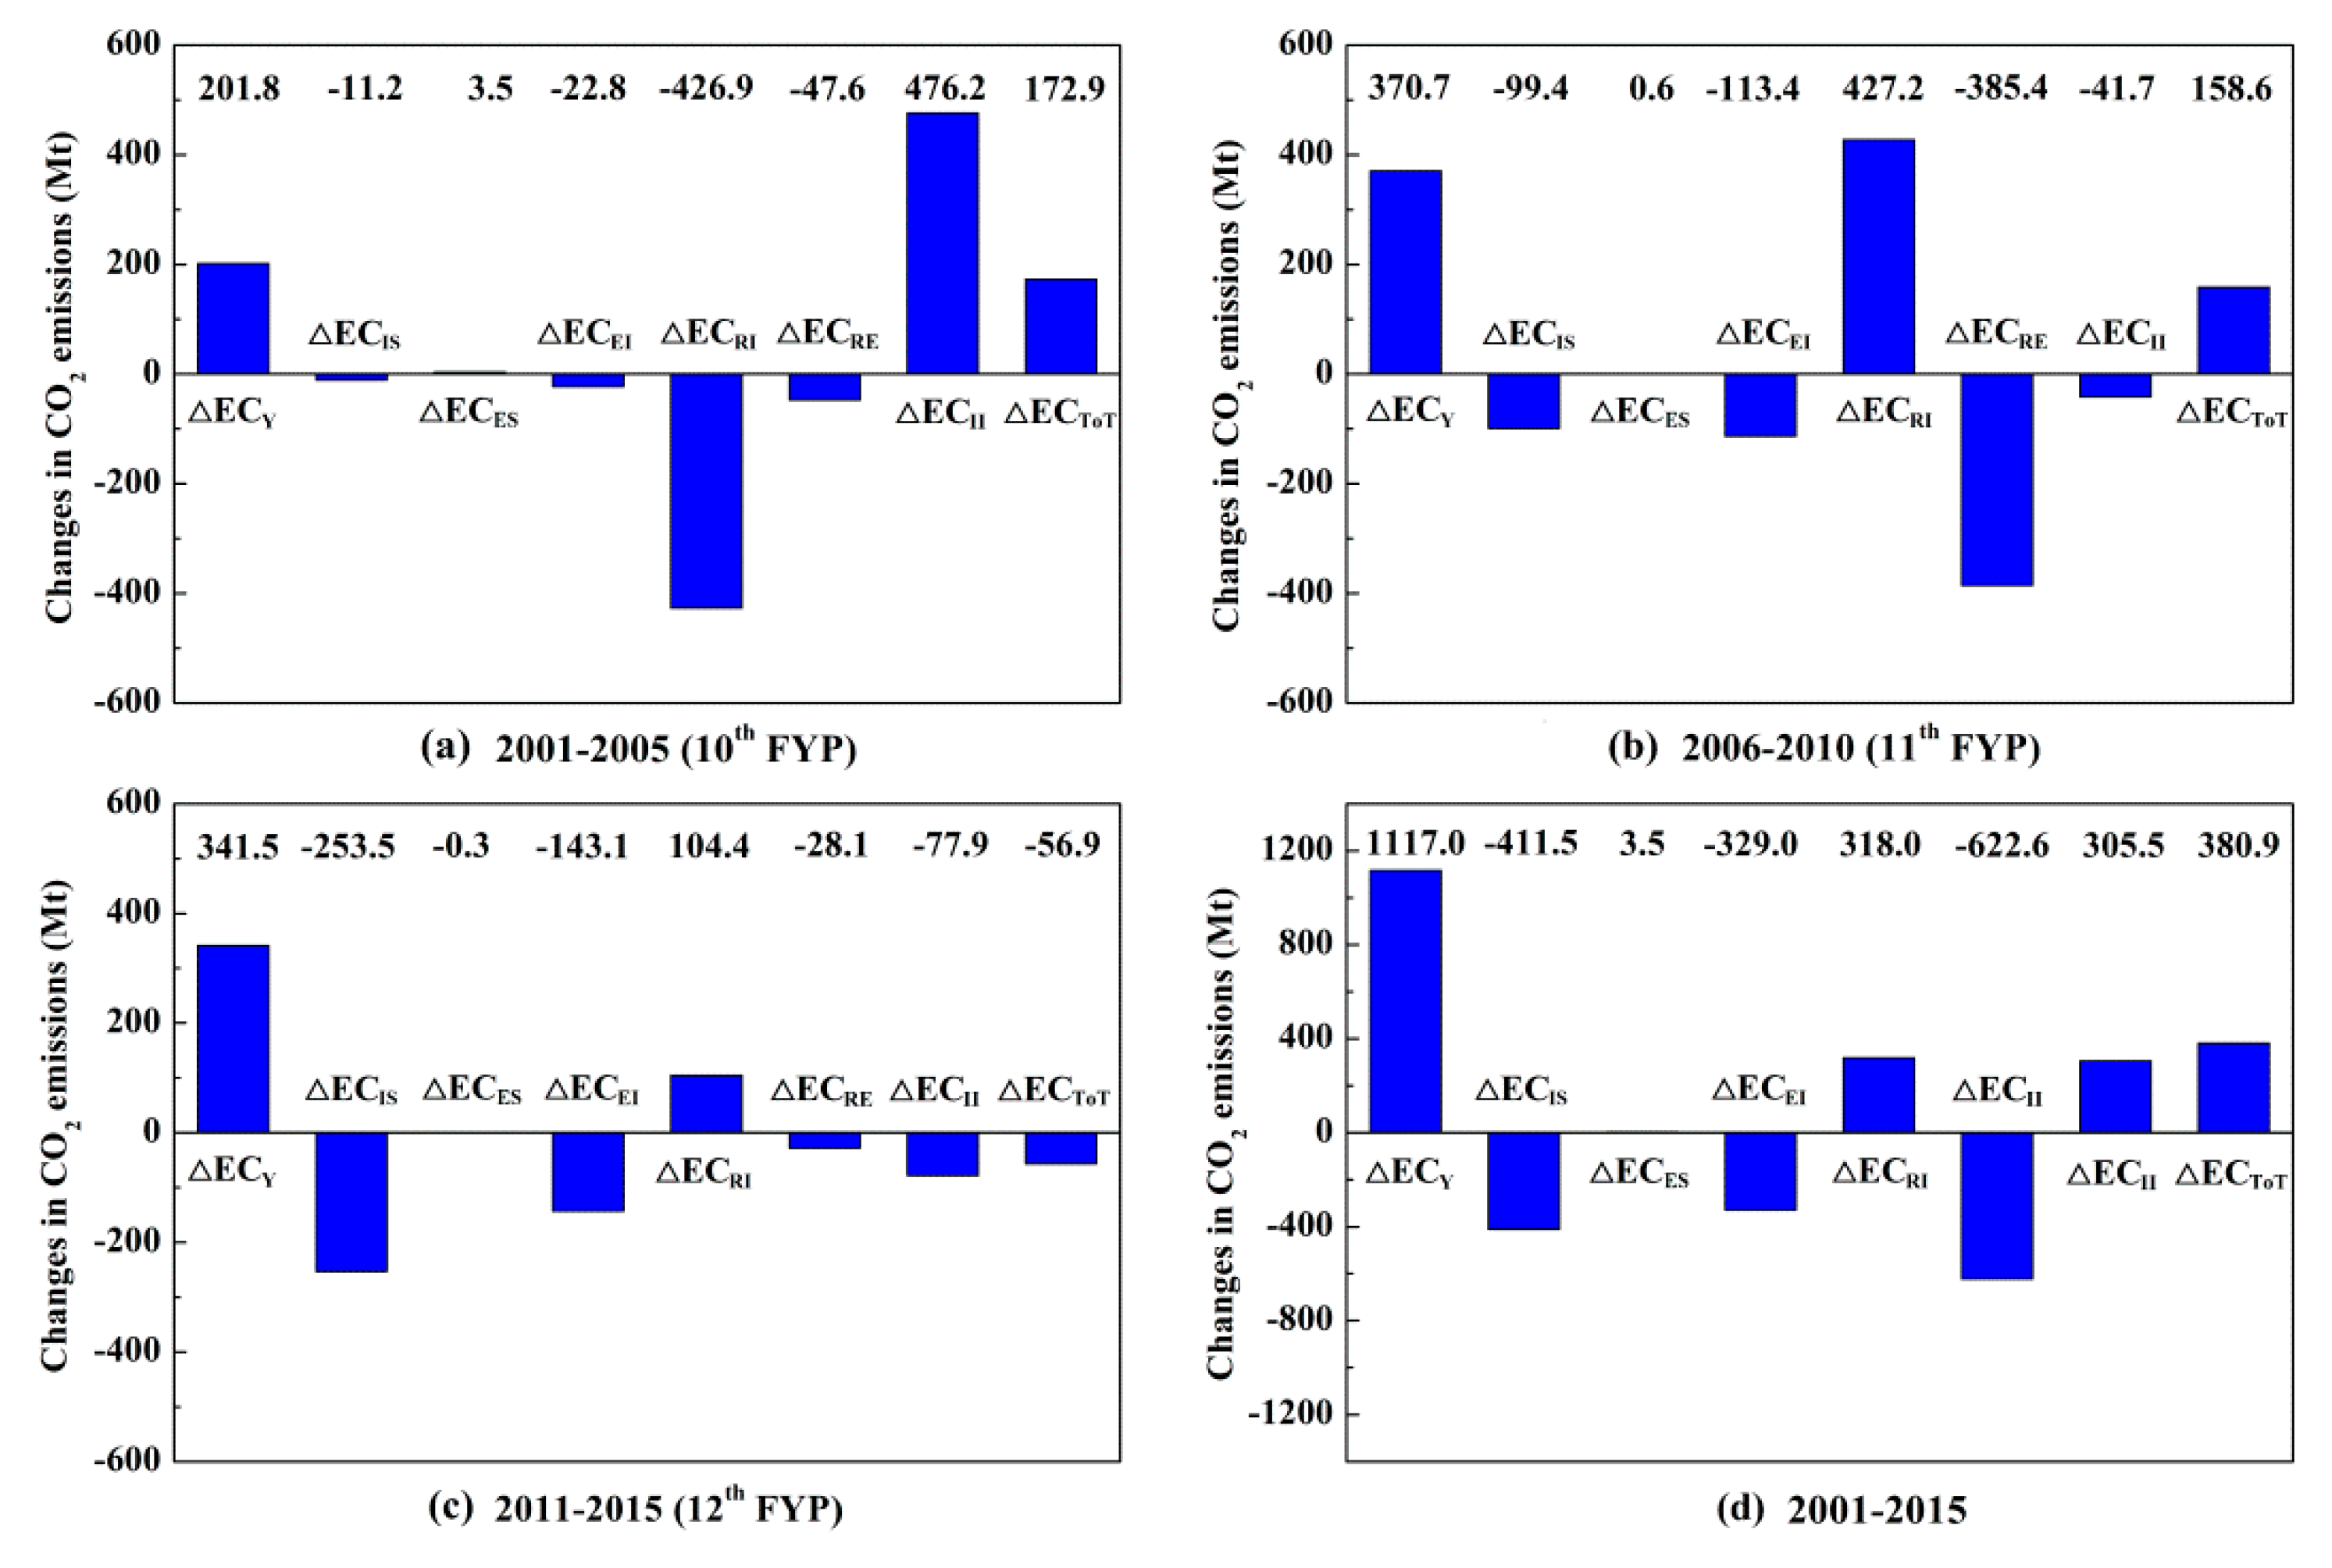
4.3. Decomposition Analysis of Driving Factors at Different Stages

The Chinese government always issues FYP for its national economic and social development including environment-related issues; thus, the extent of implementation as well as the effectiveness of environmental policies can be revealed through environmental data analysis, as in the case of the characteristics and changes in CO2 emissions in the present study. The trend of each factor affecting CO2 emissions change for each FYP period as well as the entire period (2001–2015) is shown Figure 7. For better illustration, data in Figure 7 are further tabulated in Table 5 to indicate the effectiveness of policies formulated in each FYP period, if any, on the contribution of each factor towards emission changes. The analysis of each factor for the CO2 emission changes as related to different FYP periods will be discussed in the following section.
Economic output (ΔECY): Of all seven factors, the economic output played a prominent role in the contribution to the CO2 emission changes at three FYP stages (Table 5 and Figure 7), which is in line with almost all previous studies [51,58]. According to Wang et al. [59], economic development characterized by industrialization and urbanization depends on substantial energy consumption with corresponding high CO2 emissions. As shown in Figure 7, the average increases during each FYP period in CO2 emissions resulting from economic output growth were 202, 371, and 342 Mt, for 10th, 11th, and 12th period, respectively. Obviously, the CO2 emissions caused by the economic development during the 12th FYP were reduced. The annual average CO2 emission increased from 8% to −2% from the 11th to 12th FYP. Correspondingly, the average annual growth rates of industrial economic output were 19% and 15% at two stages, respectively, indicating that CO2 emissions and industrial economic output have similar trends and thus, industrial energy-related CO2 emission changes largely depend on industrial growth.
Industrial internal structure (ΔECIS): Industrial structure adjustment presents a mitigating effect on CO2 emissions at all three stages (Figure 7 and Table 5). According to Shao et al. [14], industrial structure adjustment causes the changes of output to be shared among different sectors (i.e., transfer from industrial sector to service sector), and within industrial subsectors (i.e., transfer from high energy intensive/high CO2 emission subsectors to lower energy users). As shown in Figure 7, the decreases in CO2 emissions resulting from industrial structure adjustment are 11, 99, and 254 Mt at three stages, respectively, showing a clear effectiveness of industrial structure adjustment for these FYP stages. In fact, since the 11th FYP, the Chinese government promoted industrial structure optimization policies, and consequently, the industrial structure of Henan Province has gradually transformed from raw material processing and manufacturing with high energy use and high pollutant emissions to high-tech industries with high added values and low energy uses, such as the electronic and information technology industry. Over the 2001–2015 period, the output share of low emission industrial subsectors continuously increased (e.g., 1% of the electronic and information technology industry in 2001 has increased to 16% in 2015). Therefore, the industrial internal structure change should be emphasized in the manufacturing sector of information and communication to reduce the overall CO2 emissions, which is exemplified by the establishment of Foxconn (iPhone maker) in Henan.
Energy structure (ΔECES): Unlike economic output and industrial internal structure factors, energy structure plays an insignificant role in the change of CO2 emissions in all years (Table 3), or only 3.4, 0.6, and −0.3 Mt at three stages (Table 5 and Figure 7), respectively. Other studies [57,60] also reported the minor role of energy structure played in the energy-related industrial CO2 emissions in China. The reason is certainly due to the fact that Henan is a coal-dominant energy endowment and coal-related consumption structure as the CO2 emissions coefficient of coal is higher than that of oil and gas. In reality, it will be difficult to alter the traditional coal-dominant energy structure in the near future. The low-carbon pathway of energy structure adjustment requires a longer time and more efforts to encourage the use of non-fossil energy. Nevertheless, the small CO2 emissions decreasing amount after 2011 may indicate the successful implementation of some policies during the 12th FYP period.
Energy intensity (ΔECEI): From Figure 7 and Table 5, energy intensity remains to have a mitigating effect on CO2 emissions at three stages (or −23, −113, and −143 Mt, respectively), which is similar to most related studies (e.g., Wang and Feng [56] in decomposition of energy-related CO2 emissions in China). The reduced energy intensity should decrease CO2 emissions, indicating the improvement of energy efficiency [61]. The energy intensity of the entire 38 industries has dropped from 6.12 to 1.62 tce/104 RMB from 2001 to 2015 in Henan Province, or 74% reduction over the 15-year span. Typically, there are many approaches for reducing energy intensity, including use of innovative technologies [62], energy management [63], and change of fuel [64,65], among others. One particular emphasis regarding energy intensity that needs to be mentioned is the full utilization of energy cascade, or try to extract residual energy from waste steam/liquid within one particular plant or among different plants, or even from different industrial subsectors.
The previous investigators [12,14] used several new terms such as “R&D intensity”, defined as the amount of RMB invested in R&D/total fixed assets in RMB, in which one of the aims is to develop new technology in R&D efforts for carbon reduction and energy saving. We will discuss these new factors (in addition to R&D intensity, they also include R&D efficiency and investment intensity) and their effect on CO2 emission changes in the following paragraph.
R&D intensity (ΔECRI): From the decomposition results of the R&D intensity (Figure 7 and Table 5), the changes in industrial CO2 emissions resulting from R&D intensity are −427, 427, and 104 Mt, respectively, for three stages. During the initial 10th FYP stage, the efforts in R&D intensity really payed off in mitigating such large amounts of CO2 emissions. Afterwards, the R&D intensity apparently did not transfer CO2 emission reductions, perhaps because of a lack of R&D efforts to develop energy-saving and carbon-reduction technologies; instead, R&D activities may shift to identify new products, enhance the overall industrial growth and promote cost saving to compete. In fact, developing new products will further lead to an increase in CO2 emissions. On the other hand, Shao et al. [14] reported that the R&D intensity had a mitigating effect on industrial CO2 emissions in most years (1994–2011) in Shanghai, due to their R&D efforts in pursuing cleaner production technologies as well as other innovative technologies. Compared to the well-developed industrial state in Shanghai, Henan Province is in a so-called “extensive state”, or has high energy use with high CO2 emissions as well as low value added products. In short, to achieve low carbon development, the priority of R&D activities should be towards promoting technological innovation of energy-saving and emission-reduction in Henan Province.
R&D efficiency (ΔECRE): R&D efficiency exhibits the highest mitigation in the industrial CO2 emission changes, or −48, −385, and −28 Mt at three stages, respectively (Figure 7 and Table 5). Especially, the effect played a more important role of mitigating CO2 emission in the 11th FYP than the other two periods. Such results imply an evident volatility of R&D efficiency on industrial CO2 emissions. The R&D efficiency is closely related to the focus of R&D efforts of industrial enterprises. These efforts, unfortunately, do not necessarily reduce CO2 emissions, if R&D investment is used for enhancing productivity. On the contrary, industrial enterprises focus on more R&D investment to improve the energy saving and emission reduction technology; industrial CO2 emissions can be mitigated. Realistically, it is not too difficult to have high R&D efficiency, yielding lower CO2 emissions, by concentrating on improving energy efficiency and carbon reducing emissions in industrial processes.
Investment intensity (ΔECII): As shown in Figure 7, the changes in industrial CO2 emissions resulting from investment intensity are 476, −42, and −78 Mt at three stages, respectively, corresponding to the increasing investment intensity of the entire 38 industries from 0.15 (2001) to 0.89 investment RMB/added value RMB (2015), with 488% growth during the 15-year span. As a result, investment intensity showed a positive result in CO2 emissions reduction in the 11th and 12th FYPs. Like R&D intensity, investment expenditure also has a dual role. Although promoting the investment intensity can increase CO2 emissions through production scale expansion, it can also abate CO2 emissions through upgrading production equipment to improve energy utilization efficiency [14]. Thus, the efforts made by Henan Province in industrial upgrading under the guidance of energy-saving and emission-reduction policy reduced CO2 emission. Industrial investment should aim for achieving higher energy efficiency by changing their investment direction towards production facility.

4.4. Emissions Reduction Scenario Analysis

4.4.1. Scenario Design

To abate CO2 emissions, efficiency improvement and structural adjustment are two major approaches [66]. According to the various influential factors discussed above, the factors related to efficiency include energy intensity, R&D intensity, investment intensity, and R&D efficiency. Correspondingly, improving the efficiency refers to reducing energy intensity and R&D efficiency and increasing R&D intensity and investment intensity. On the other hand, the structural adjustment refers to optimizing the structures of both the industrial and energy structure.
To better understand the trend of CO2 emissions in Henan Province, we further conduct five scenarios to estimate CO2 emissions up to 2030 with 2015 used as the base year. The five scenarios include Business as Usual (BAU), Efficiency Improvement (EI), Structural Optimization (SO), R&D input (RD) and Comprehensive Policy (CP) scenarios. According to Equations 12–21, if the growth rates of these seven factors (α, β, γ, δ, θ, ν, μ and φ) are given, the industrial energy-related CO2 emissions in the future can be estimated. Thus, our scenarios essentially consider the changes in these growth rates of seven factors.
For all scenarios, we assume that the future carbon emission factor for a particular energy source (fuel) will remain unchanged, based on historical data. Also, taking into account historical and future economic development trends, the annual growth rates of economic output are assumed to be 10%, 9%, and 8% at the 13th, 14th and 15th FYP periods, respectively. As for other factors of efficiency improvement (R&D intensity, energy intensity, R&D efficiency, and investment intensity) and structural adjustment (energy structure and industrial internal structure), their annual growth rates in the future FYP periods are different under the five scenarios. This adjustment makes sense as with others [12] that also modified their growth rate with time. In addition, we used the growth rate of proportion of coal in energy consumption to represent the growth rate of the energy structure. Similarly, the growth rates of proportion of six high energy-consuming industries (Electricity, Steel, Coal, Non-ferrous metals, Cement, and Chemical industries) in the entire industry are assumed to represent the growth rate of the industrial structure. The simplified assumption of using the average of six industrial subsectors in representing the growth rate of the entire industrial structure would make calculation easy and result in better comprehension as compared to assuming the growth rate for each one of the 36 subsectors as in Zhang et al. [12].
The other assumption or description for each of the five scenarios is covered as follows. In the BAU scenario, the annual growth rate of each factor is set as the arithmetic mean of the period from 2001 to 2015 according to the historical annual growth trend, and the factors will maintain their current trends unchanged for each year up to 2030. For example, energy intensity will stay at the same level from 2015 to 2030 (−8.9% of annual growth in tce/104 RMB) as shown in Table 6. For the scenario of EI, this scenario only considers higher efficiency improvement, as compared with the BAU scenario and, as mentioned before, the efficiency is different with three periods (i.e., further improved in the 13th, 14th and 15th FYP periods). To achieve this step-by-step enhancement, more effective policies should be formulated and implemented in reducing energy intensity and R&D efficiency and increasing R&D intensity and investment intensity. Thus, using the same example as before, energy intensity is projected to be −10, −11 and −12% for 13th, 14th and 15th for the FYP period, respectively (Table 6, first column). The third SO scenario considers significant structural adjustment without considering energy intensity. As a result, energy intensity is the same as the BAU scenario (or −8.9% for each of three FYP periods; Table 6) while the industrial structure is progressively adjusted during each of three stages: −3, −4.5 and −5.5% (Table 6) for the 13th, 14th and 15th FYP periods. To achieve the target growth rate, the industrial sector must transfer the energy-intensive industrial subsectors to the high-tech subsectors and consume less carbon-intensive energy sources including using non-fossil energy. As for the 4th R&D scenario, it mainly considered R&D expenditure. Therefore, with the increased R&D expenditure, the R&D efficiency becomes lower while R&D intensity is increased. If R&D expenditure is devoted to technologies for carbon reduction and energy saving, the resultant energy intensity would be lower, an hence, have the potential for more CO2 emission reduction. Consequently, energy intensity is set to be lower than that of the EI scenario (−10.5, −11.5, and −12.5%; Table 6). Finally, the last CP scenario is the combination of the EI, SO and RD scenarios. Under this scenario, the CO2 emission reduction potential should be more than that of each of the above four scenarios.
In summary, the assumed annual growth rates for each of the three stages (13th, 14th and 15th) under each of the six factors are shown in Table 6. The extent of uncertainty in assuming these values will be discussed later in the uncertainty section as well as in sensitive analysis.

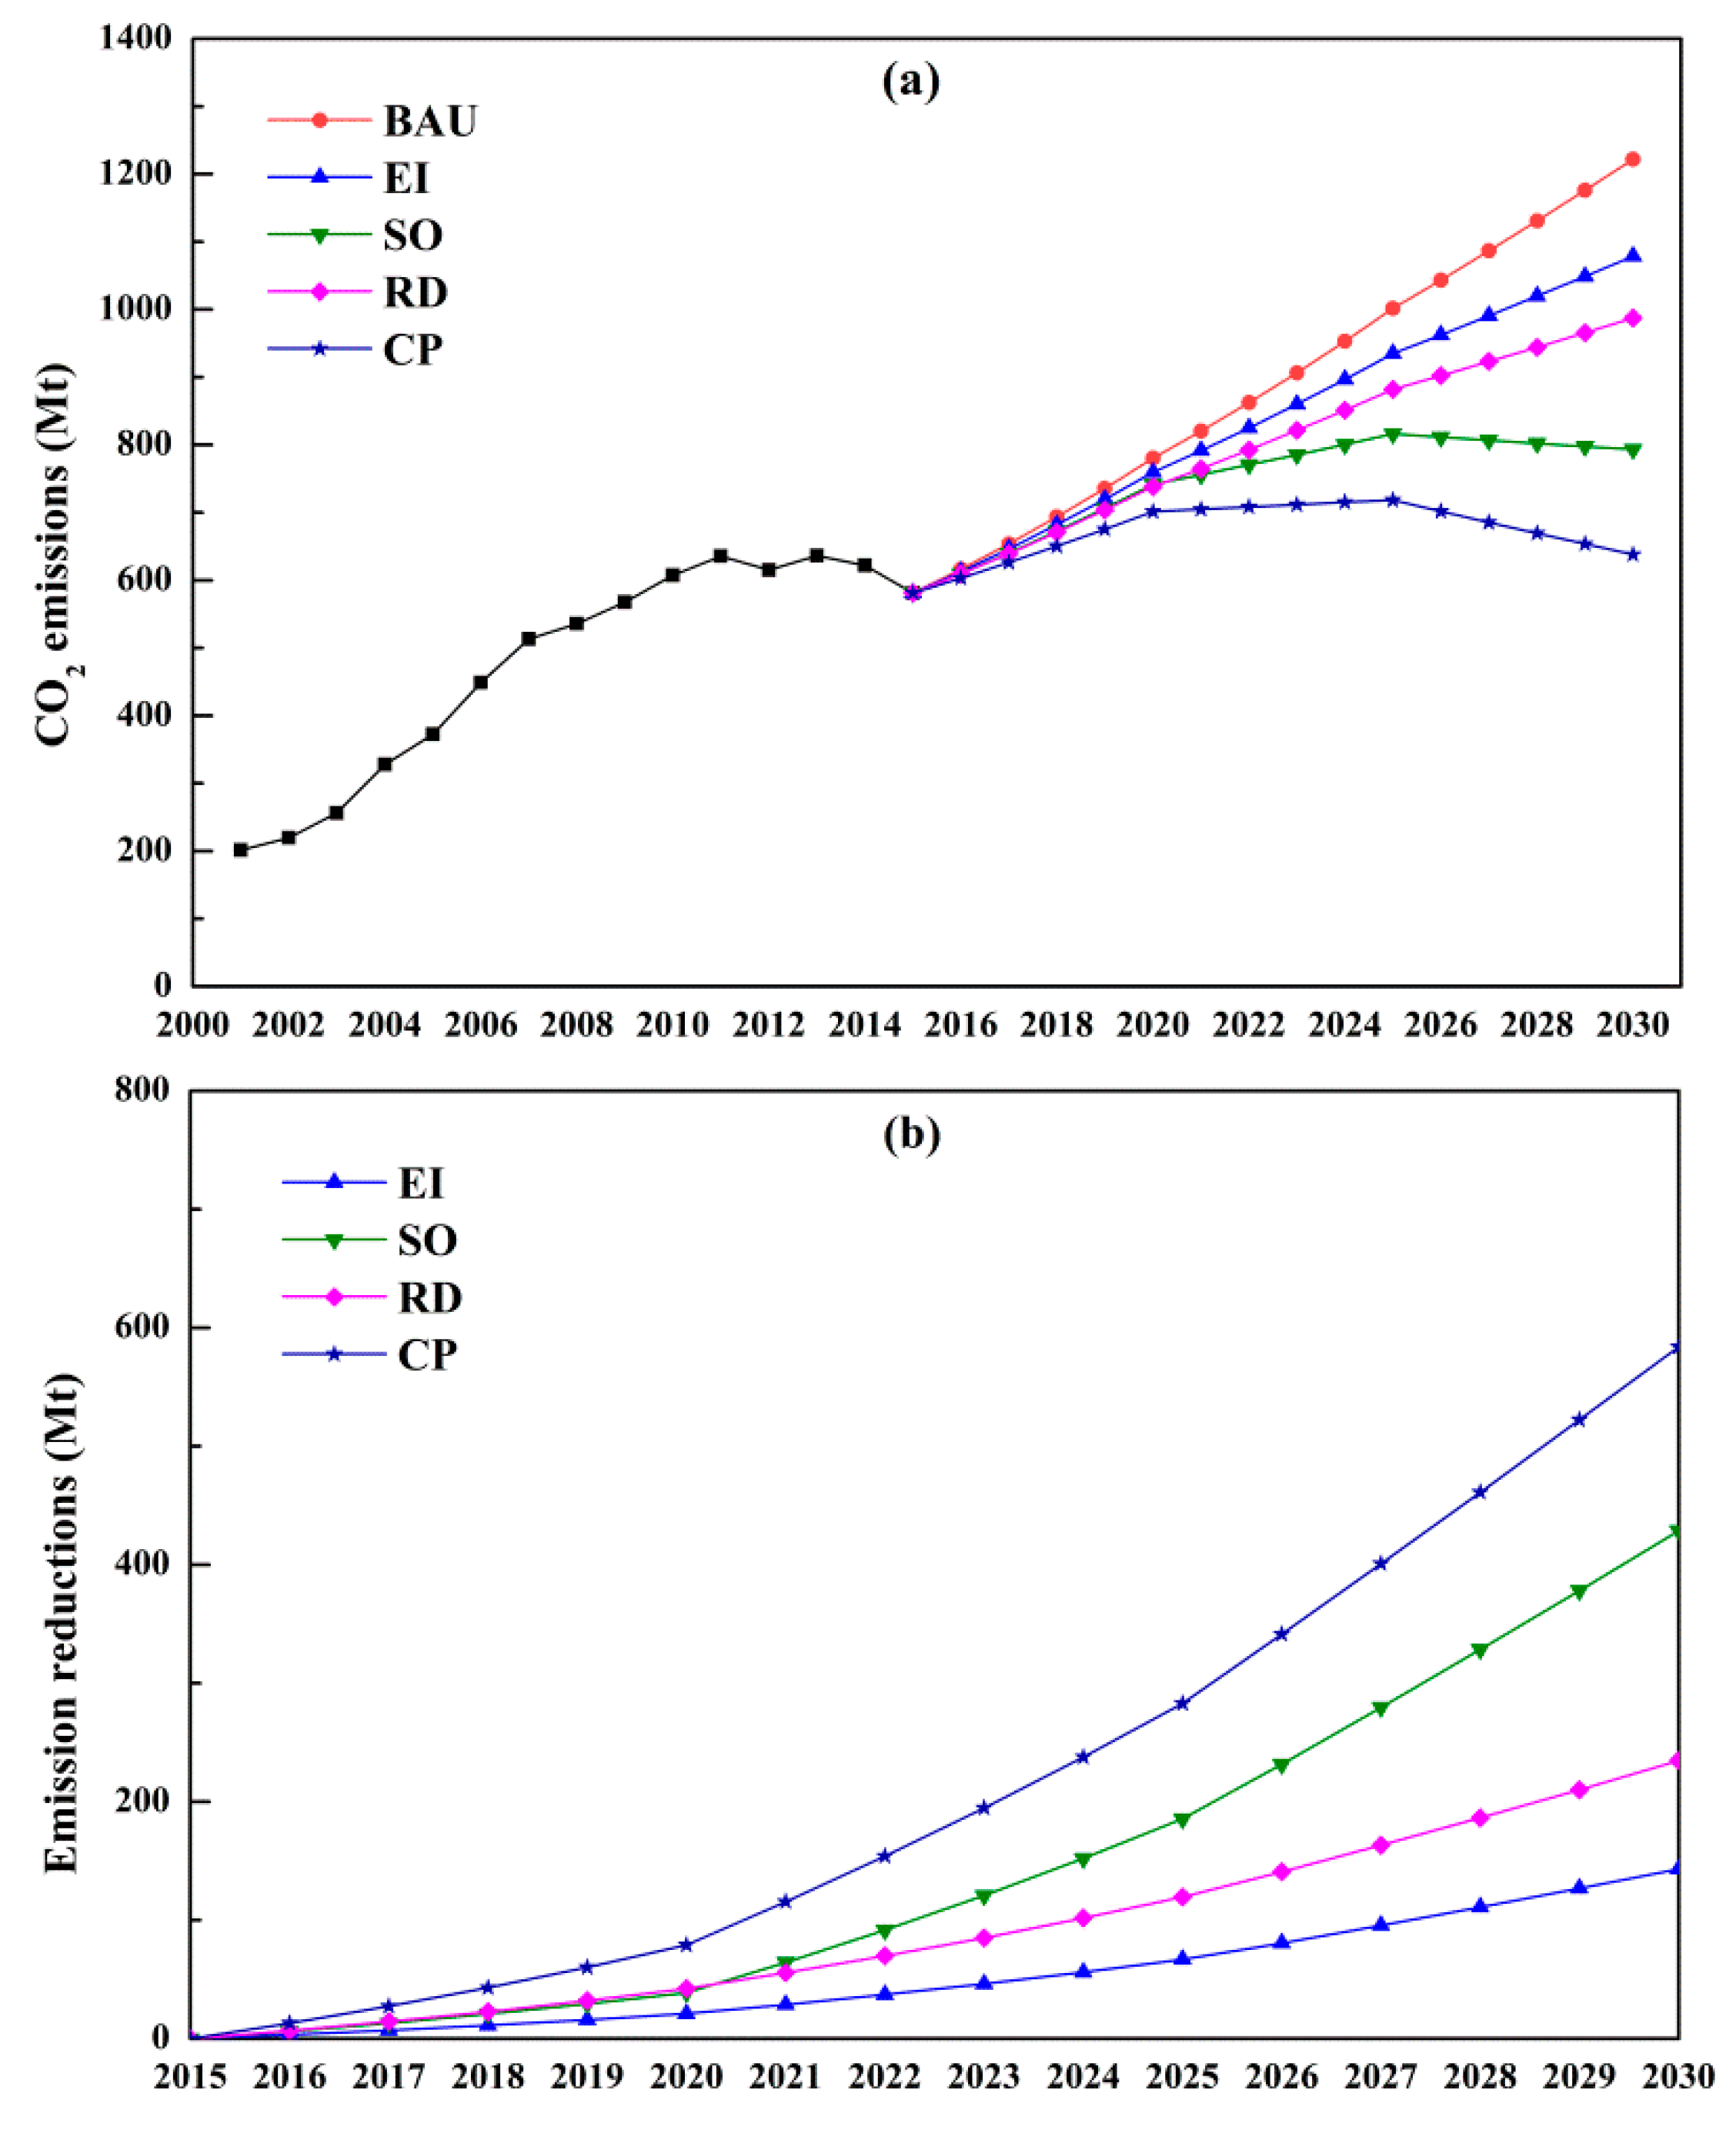
4.4.2. Estimates of the energy-related CO2 emissions and the emission reduction potential

Based on the above scenario settings, the future industrial energy-related CO2 emissions under different scenarios are presented in Figure 8a. Under the BAU scenario, CO2 emissions will increase two-fold to 1222 Mt in 2030 at an annual growth rate of 4.7%. In the other four scenarios, CO2 emissions in 2030 will reach 1079, 793, 987 and 638 Mt with an annual growth rate of 3.8%, 1.8%, 3.3% and 0.4%, respectively. Cleary, CO2 emissions under the best scenario is only about 50% of the BAU case, due to the consideration of both intensity and structure adjustment. Zhu et al. [11] projected the industrial energy-related CO2 emissions for Yangtze River Delta region with a range of 796 to 1508 Mt in 2020, comparing with our results of 701 to 780 Mt. Since the industrial added value in Yangtze River Delta is much higher than that in Henan, the resultant carbon intensity in Henan (3.2–3.6 t-CO2/104 RMB in 2020 at 2001 constant prices; Table 7, and 2.8–3.2 t-CO/104 RMB at 2005 constant prices) is much higher than that in Yangtze River Delta (0.3–0.6 t-CO2/104 RMB in 2020 at 2005 constant prices). Thus, the key approach in reducing CO2 emissions should be a lower carbon intensity to the level of the well-developed industrial region (e.g., Yangtze River Delta) and developed countries (e.g., 0.26 t-CO2/104 RMB of entire economic sectors in 2014 at 2005 constant prices in Japan, IEA [67]).
Obviously, under our assumptions, CO2 emissions under various scenarios are still growing under the BAU, EI, and RD scenarios. Fortunately, the industrial sector in Henan Province can achieve the peak target set by the Chinese government (peak by 2030 or early) in 2025 under the SO and CP scenarios, indicating that if efficiency improvement and structural adjustment are strengthened, especially structural adjustment, the industrial sector in Henan Province can reach its carbon emission peak before 2030. In addition, government also set the target for carbon intensity: that in 2020, CO2 emission intensity should be reduced by 40–45% as compared to 2005 (set in 11th FYP); and in 2030, it should be 60–65% the level of 2005 (set in 12th FYP). The results shown in Table 7 clearly indicate under all five scenarios the carbon intensity reductions (55–63% in 2020 and 68–85% in 2030) meet both set targets in 2020 (40–45%) and in 2030 (60–65%).
According to the above scenario analyses, the estimated mitigation potentials for four scenarios are shown in Figure 8b. Under the EI, SO, RD, and CP scenarios, 143, 429, 235, and 584 Mt of CO2 emissions can be mitigated by 2030, compared to BAU. Clearly, the mitigation potential in the SO scenario is larger than that of the EI scenario. The finding is consistent with the results of previous studies regarding the industrial sector [12], as well as the entire economic sector including all three sectors [68] for China. There are many reasons to explain the observed phenomenon. First, Henan Province is in the middle of industrialization and has to maintain a targeted GDP growth rate. However, it lags behind the industrial structure as compared to other regions in that transfering high energy-high pollutant emitting industry to low energy usage with less pollutant emissions. For example, introducing renewable industries (e.g., solar panel and wind turbine) in Henan will not only provide enterprise output economic value but also provide or promote renewable energy technology. Secondly, the economy in Henan mostly replies on the development of the industrial sector (e.g., 42% of the overall GDP); structural change by moving some high carbon emission industries to the service sector would surely reduce CO2 emission. Thus, considering these structural changes in the future scenario analysis, high CO2 emission reduction would be expected. Thirdly, since the SO scenario also includes energy structure change, the energy source converted from the coal consumption-based industry in Henan to gas or renewable energy would result in significant CO2 emissions reduction. In fact, the reduction of coal consumption as well as increasing the usage of renewable energy is governmental policy. The high energy consumption does not necessarily translate into high CO2 emissions, since some of the energy sources are from clean energy including nuclear and renewable energy.

5. Uncertainty and Sensitivity Analysis

5.1. Uncertainty Analysis

In this study, the overall uncertainties are based on the following three aspects: (1) calculation of CO2 emission over 2001–2015, (2) LMDI decomposition, and (3) CO2 emission prediction.
Uncertainties related to the calculation of CO2 emissions originate from four factors: energy consumption, average net calorific value of fuel (NCV), carbon content of fuel (CC), and the carbon oxidation factor (O). Energy consumption data were obtained from the Henan Statistical Yearbook. The statistics departments mainly use the bottom-up approach to generate a progressive summary, so there are potential errors in energy consumption data. For example, the accuracy of the individual industry in its overall energy consumption remains to be seen. For the other three factors, the net calorific value of fuel was obtained from China Energy Statistics Yearbook, but the quality of these fuels is unknown resulting in some uncertainty in calorific fuel estimation. The content of fuel and the carbon oxidation factor were obtained from the IPCC and the literature, and some single value (e.g., carbon in coal is 26.42 t-C/TJ and oxidation factor 93%) would render the results of complex fuels uncertain. In some studies, NCV × CC × O is defined as an emission factor [69,70]. If the emission factors determined in the literature are used directly to estimate carbon emissions, the uncertainty can be reduced compared to three unknown parameters.
As for the uncertainties of LMDI decomposition, there are also four parameters involved: energy consumption, added value, R&D expenditure, and fixed asset investment, which are all from the statistical year book. Without doubt, there must be some errors either manual or technical in summarizing hundreds and thousands data. Finally, in predicting CO2 emissions, the main uncertainties are the annual growth rates of the seven parameters shown in Table 6 (i.e., β, γ, δ, θ, ν, μ, and φ). The assumption for these parameters depends mainly on historical data trends, formulated national policy plans and our best knowledge with little theoretical basis.

5.2. Sensitivity Analysis

To address the uncertainty of the CO2 emissions prediction result, a sensitivity analysis for seven parameters (i.e., β, γ, δ, θ, ν, μ, and φ) based on equations 12–21 was conducted. In each calculation, only one input parameter was changed while all others were kept constant. For each parameter, we set upward and downward adjustments (within a 10% band) of the original value. The range of these input parameters for subsequent sensitivity analysis for the CP scenario is shown in Table 8 with the resultant CO2 emissions compared to the CO2 emissions under the CP scenario. As a result, the CO2 emissions are reduced with the decreases in the 10% growth rates of industrial internal structure (γ), energy structure (δ), energy intensity (θ), and R&D efficiency (μ); corresponding with the CO2 emission reductions of 7, 1, 18, and 9% compared with the original value. On the other hand, with the increases of 10% of the growth rate of these factors, the CO2 emission would increase by 7, 1, 21, and 10% from the original results. As for the other two factors, R&D intensity (ν) and investment intensity (φ),they exhibit the opposite trend in that decreases in the growth rate would increase CO2 emission and vice versa. Fox example, in the case of the R&D intensity (ν), the CO2 emissions is increased by 3% when its growth rate is 10% lower than the original growth rate.
Among the effect of these seven parameters, the greatest impact on CO2 emissions prediction was investment intensity, which was followed by energy intensity and economic output. The reason for this is that they have greater impacts on the CO2 emission changes (Table 3) and, more importantly, their higher assumed growth rates (absolute value from 10 to 20%; three highest factors among seven factors; last row in Table 6). As a result of our findings, the realistic and sensible approach to reduce future CO2 emissions is of course to increase the annual growth of investment intensity and reduce energy intensity.

6. Conclusions and Policy Implications

In this paper, using the LMDI decomposition approach, changes in industrial energy-related CO2 emission are decomposed into eight factors during 2001–2015 in Henan Province. In addition, future trajectories of CO2 emissions under different scenarios over 2016–2030 are projected. The main conclusions drawn from the study are summarized as follows.
With the rapid development of industry in Henan Province, its industrial energy-related CO2 emissions increased from 201 Mt in 2001 to 637 Mt in 2013 and then decreased to 582 Mt in 2015. Among these factors, the economic output, R&D intensity, investment intensity, and energy structure were the positive drivers of changes in CO2 emissions over the period 2001–2015, with contributions of 293, 83, 80, and 1% of total CO2 emission changes, respectively. Conversely, the energy intensity, R&D efficiency, and industrial internal structure exhibited a negative effect, with contributions of −86, −163, and −108%, respectively. In the five scenarios, CO2 emissions from energy consumption in 2030 will reach 1222, 1079, 793, 987, and 638 Mt with an annual growth rate of 4.7%, 3.8%, 1.8%, 3.3%, and 0.4%, respectively. In particular, the CO2 emission peak for the SO and CP scenarios is observed before 2030; for comparison, the peak value for the CP scenario in 2025 is 719 Mt as compared to 638 Mt in 2030. According to the scenario analyses, all the five scenarios will achieve the 2020 and 2030 reduction target of carbon intensity as specified in the 11th and 12th FYP. Under the EI, SO, RD and CP scenarios, 143, 429, 235 and 584 Mt of CO2 emissions can be mitigated by 2030, compared to BAU. In short, structural adjustment with its higher mitigation potential than efficiency improvement plays an important role in the overall CO2 emissions reduction.
Based on the above research findings for the industry sector, certain policy recommendations are proposed. In terms of industrial structural adjustment, the transformation from energy-intensive industries to technology-intensive industries for the industrial sector should be considered as a key policy to mitigate emissions. Other policies and measures by the government should be made, including constraining the development of high-pollution heavy industries and subsidizing the high-tech industries (e.g., internet and communication industry) and renewable industries (e.g., solar panel and wind turbine); this represents the development direction of modern industry and encourages the production of high value-added goods. Another significant structural adjustment of emission mitigation is to optimize the energy mix. Clean and renewable energy sources with its government subside, and lower energy pricing in the future should be introduced to industrial enterprises through restricting fossil fuel usage. As for efficiency improvement, reducing energy intensity is always a major strategy for mitigating CO2 emissions. It can be achieved by promoting the application of energy-saving technologies and encouraging energy conservation through fiscal incentives. Moreover, increasing R&D expenditure and fixed asset investment for developing energy-saving and emission-reduction technologies and upgrading production facilities can also improve energy efficiency. However, there will be a key concern for industry to decide its best outcome for their investment: developing energy-saving and emission-reduction technologies or expanding the production line for making more products. Therefore, the government should strengthen the fiscal policies on the regulation of enterprises’ CO2 emissions, including taxation and subsidies, so that industrial enterprises would make more efforts to develop low-carbon technologies. Overall, how to seek a trade-off between economic development and emissions reduction to achieve a “win-win” situation is the key issue.

Author Contributions

L.L., R.Z. and X.T. conceived and designed the experiments; L.L., K.W. and S.W. performed the experiments; L.L. and K.W. analyzed the data; and L.L. wrote the paper. All authors read and approved the final manuscript.

Acknowledgments

This work was founded by the China Sustainable Energy Project of U.S. Energy Foundation (No. G-1410-22231) and Clean Development Mechanism Funds (No. 2014036), and we thank the editor and reviewers for their constructive comments and suggestions on the manuscript.

Conflicts of Interest

The authors declare no conflict of interest.

References

  1. IPCC (Intergovernmental Panel on Climate Change). Climate Change 2013: The Physical Science Basis; IPCC: Cambridge, UK; New York, NY, USA, 2013. [Google Scholar]
  2. IPCC (Intergovernmental Panel on Climate Change). Climate Change 2007: Synthesis Report; IPCC: Geneva, Switzerland, 2007. [Google Scholar]
  3. Yu, S.; Wei, Y.M.; Guo, H.; Ding, L. Carbon emission coefficient measurement of the coal-to-power energy chain in China. Appl. Energy 2014, 114, 290–300. [Google Scholar] [CrossRef]
  4. Mi, Z.F.; Pan, S.Y.; Yu, H.; Wei, Y.M. Potential impacts of industrial structure on energy consumption and CO2 emission: A case study of Beijing. J. Clean. Prod. 2015, 103, 455–462. [Google Scholar] [CrossRef]
  5. Guo, Z.Q.; Zhang, X.P.; Zheng, Y.H.; Rao, R. Exploring the impacts of a carbon tax on the Chinese economy using a CGE model with a detailed disaggregation of energy sectors. Energy Econ. 2014, 45, 455–462. [Google Scholar] [CrossRef]
  6. BP (British Petroleum). Statistical Review of World Energy Full Report; British Petroleum: London, UK, 2015. [Google Scholar]
  7. Liu, Z. National carbon emissions from the industry process: Production of glass, soda ash, ammonia, calcium carbide and alumina. Appl. Energy 2016, 166, 239–244. [Google Scholar] [CrossRef]
  8. National State Council (NSC). U.S.-China Joint Announcenment on Climate Change. Available online: http://www.scio.gov.cn/xwfbh/xwbfbh/wqfbh/2015/20151119/xgzc33810/Document/1455884/1455884.htm (accessed on 19 November 2015).
  9. National Development and Reform Commission (NDRC). Enhanced Actions on Climate Change: China’s Intended Nationally Determined Contributions. Available online: https://www.mfa.gov.cn/ce/cese/eng/zgxw/t1278285.htm (accessed on 3 July 2015).
  10. Zhou, X.; Zhang, M.; Zhou, M.H.; Zhou, M. A comparative study on decoupling relationship and influence factors between China’s regional economic development and industrial energy-related carbon emissions. J. Clean. Prod. 2017, 142, 783–800. [Google Scholar] [CrossRef]
  11. Zhu, X.H.; Zou, J.W.; Feng, C. Analysis of industrial energy-related CO2 emissions and the reduciton potential of cities in the Yangtze River Delta region. J. Clean. Prod. 2017, 168, 791–802. [Google Scholar] [CrossRef]
  12. Zhang, X.; Zhao, X.R.; Jiang, Z.J.; Shao, S. How to achieve the 2030 CO2 emission-reduction targets for China’s industrial sector: Retrospective decomposition and prospective trajectories. Global Environ. Chang. 2017, 44, 83–97. [Google Scholar] [CrossRef]
  13. Xu, S.C.; He, Z.X.; Long, R.Y. Factors that influence carbon emissions due to energy consumption in China: Decomposition analysis using LMDI. Appl. Energy 2014, 127, 182–193. [Google Scholar] [CrossRef]
  14. Shao, S.; Yang, L.L.; Gan, C.H.; Cao, J.H.; Geng, Y.; Guan, D.B. Using an extended LMDI model to explore techno-economic drivers of energy-related industrial CO2 emission changes: A case study for Shanghai (China). Renew. Sust. Energ. Rev. 2016, 55, 516–536. [Google Scholar] [CrossRef]
  15. Liu, L.; Wang, S.S.; Wang, K.; Zhang, R.Q.; Tang, X.Y. LMDI decomposition analysis of industry carbon emissions in Henan Province, China: Comparison between different 5-year plans. Nat. Hazards 2016, 80, 997–1014. [Google Scholar] [CrossRef]
  16. Chong, C.H.; Liu, P.; Ma, L.W.; Li, Z.; Ni, W.D.; Li, X.; Song, S.Z. LMDI decomposition of energy consumption in Guangdong Province, China, based on an energy allocation diagram. Energy 2017, 133, 525–544. [Google Scholar] [CrossRef]
  17. Rose, A.; Casler, S. Input-output structural decomposition analysis: A critical appraisal. Econ. Syst. Res. 1996, 8, 33–62. [Google Scholar] [CrossRef]
  18. Chang, Y.F.; Lin, S.J. Structural decomposition of industrial CO2 emission in Taiwan: An input-output approach. Energy Policy 1998, 26, 5–12. [Google Scholar] [CrossRef]
  19. Zhang, Y.G. Structural decomposition analysis of sources of decarbonizing economic development in China: 1992–2006. Ecol. Econ. 2009, 68, 2399–2405. [Google Scholar] [CrossRef]
  20. Wang, Y.F.; Zhao, H.Y.; Li, L.Y.; Liu, Z.; Liang, S. Carbon dioxide emission drivers for a typical metropolis using input-output structural decomposition analysis. Energy Policy 2013, 58, 312–318. [Google Scholar] [CrossRef]
  21. Geng, Y.; Zhao, H.Y.; Liu, Z.; Xue, B.; Fujita, T.; Xi, F.M. Exploring driving factors of energy-related CO2 emissions in Chinese provinces: A case of Liaoning. Energy Policy 2013, 60, 820–826. [Google Scholar] [CrossRef]
  22. Tian, X.; Chang, M.; Tanikawa, H.; Shi, F.; Imura, H. Structural decomposition analysis of the carbonization process in Beijing: A regional explanation of rapid increasing carbon dioxide emission in China. Energy Policy 2013, 53, 279–286. [Google Scholar] [CrossRef]
  23. Wei, J.; Huang, K.; Yang, S.S.; Li, Y.; Hu, T.T.; Zhang, Y. Driving forces analysis of energy-related carbon dioxide (CO2) emissions in Beijing: An input-output structural decomposition analysis. J. Clean. Prod. 2017, 163, 58–68. [Google Scholar] [CrossRef]
  24. Mi, Z.F.; Meng, J.; Guan, D.B.; Shan, Y.L.; Song, M.L.; Wei, Y.M.; Liu, Z.; Hubacek, K. Chinese CO2 emission flows have reversed since the global financial crisis. Nat. Commun. 2017, 8, 1712. [Google Scholar] [CrossRef] [PubMed]
  25. Mi, Z.F.; Meng, J.; Green, F.; Coffman, D.M.; Guan, D.B. China’s “Exported Carbon” Peak: Patterns, Drivers, and Implications. Geophys. Res. Lett. 2018, 45, 4309–4318. [Google Scholar] [CrossRef]
  26. Ang, B.W. Decomposition analysis for policy making in energy: Which is the preferred method? Energy Policy 2004, 32, 1131–1139. [Google Scholar] [CrossRef]
  27. Ang, B.W.; Liu, N. Handling zero values in the logarithmic mean Divisia index decomposition approach. Energy Policy 2007, 35, 238–246. [Google Scholar] [CrossRef]
  28. Hatzigeorgiou, E.; Polatidis, H.; Haralambopoulos, D. CO2 emissions in Greece for 1990-2002: A decomposition analysis and comparison of results using the arithmetic mean Divisia index and logarithmic mean Divisia index techniques. Energy 2008, 33, 492–499. [Google Scholar] [CrossRef]
  29. Zhao, M.; Tan, L.R.; Zhang, W.G.; Ji, M.H.; Liu, Y.; Yu, L.Z. Decomposing the influencing factors of industrial carbon emissions in Shanghai using the LMDI method. Energy 2010, 35, 2505–2510. [Google Scholar] [CrossRef]
  30. Akbostancı, E.; Tunç, G.I.; Asık, S.T. CO2 emissions of Turkish manufacturing industry: A decomposition analysis. Appl. Energy 2011, 88, 2273–2278. [Google Scholar] [CrossRef]
  31. Fernández González, P.; Landajo, M.; Presno, M.J. Multilevel LMDI decomposition of changes in aggregate energy consumption. A cross country analysis in the EU-27. Energy Policy 2014, 68, 576–584. [Google Scholar] [CrossRef]
  32. Hammond, G.P.; Norman, J.B. Decomposition analysis of energy-related carbon emission from UK manufacturing. Energy 2012, 41, 220–227. [Google Scholar] [CrossRef]
  33. Freitas, L.C.; Kaneko, S. Decomposition of CO2 emissions change from energy consumption in Brazil: Challenges and policy implications. Energy Policy 2011, 39, 1495–1504. [Google Scholar] [CrossRef]
  34. Margarita, R.A.; Victor, M. Decomposition analysis and innovative accounting approach for energy-related CO2 (carbon dioxide) emissions intensity over 1996-2009 in Portugal. Energy 2013, 57, 775–787. [Google Scholar]
  35. Tadhg, O.M. Decomposition of Ireland’s carbon emissions from 1990 to 2010: An extended Kaya identity. Energy Policy 2013, 59, 573–581. [Google Scholar]
  36. Domingo, G.; Manuel, M. Changes in CO2 emission intensities in the Mexican industry. Energy Policy 2012, 51, 149–163. [Google Scholar]
  37. Jung, S.; An, K.J.; Dodbiba, G.; Fujita, T. Regional energy-related carbon emission characteristics and potential mitigation in eco-industrial parks in South Korea: Logarithmic mean Divisia index analysis based on the Kaya identity. Energy 2012, 46, 231–241. [Google Scholar] [CrossRef]
  38. Gao, C.C.; Liu, Y.H.; Jin, J.; Wei, T.Y.; Zhang, J.Y.; Zhu, L.Z. Driving forces in energy-related carbon dioxide emissions in east and south coastal China: Commonality and variations. J. Clean. Prod. 2016, 135, 240–250. [Google Scholar] [CrossRef]
  39. Xu, S.C.; Han, H.M.; Zhang, W.W.; Zhang, Q.Q.; Long, R.Y.; Chen, H.; He, Z.X. Analysis of regional contributions to the national carbon intensity in China in different Five-Year Plan periods. J. Clean. Prod. 2017, 145, 209–220. [Google Scholar] [CrossRef]
  40. Zhao, X.R.; Zhang, X.; Li, N.; Shao, S.; Geng, Y. Decoupling economic growth from carbon dioxide emissions in China: A sectoral factor decomposition analysis. J. Clean. Prod. 2017, 142, 3500–3516. [Google Scholar] [CrossRef]
  41. Wang, J.; Zhao, T.; Wang, Y.N. How to achieve the 2020 and 2030 emissions targets of China: Evidence from high, mid and low energy-consumption industrial sub-sectors. Atmos. Environ. 2016, 145, 280–292. [Google Scholar] [CrossRef]
  42. Zhang, M.; Song, Y.; Li, P.; Li, H. Study on affecting factors of residential energy consumption in urban and rural Jiangsu. Renew. Sust. Energ. Rev. 2016, 53, 330–337. [Google Scholar] [CrossRef]
  43. Zhang, M.; Li, H.; Zhou, M.; Mu, H. Decomposition analysis of energy consumption in Chinese transportation sector. Appl. Energy 2011, 88, 2279–2285. [Google Scholar] [CrossRef]
  44. Lin, B.Q.; Zhang, Z.H. Carbon emissions in China’s cement industry: A sectorand policy analysis. Renew. Sust. Energ. Rev. 2016, 58, 1387–1394. [Google Scholar] [CrossRef]
  45. Lin, B.Q.; Long, H.Y. Emissions reduction in China’s chemical industry-Based on LMDI. Renew. Sust. Energ. Rev. 2016, 53, 1348–1355. [Google Scholar] [CrossRef]
  46. Xie, X.; Shao, S.; Lin, B.Q. Exploring the driving forces and mitigation pathways of CO2 emissions in China’s petroleum refining and coking industry: 1995–2031. Appl. Energy 2016, 184, 1004–1015. [Google Scholar] [CrossRef]
  47. Wang, M.; Feng, C. Analysis of energy-related CO2 emissions in China’s mining industry: Evidence and policy implications. Resou. Policy 2017, 53, 77–87. [Google Scholar] [CrossRef]
  48. Lin, B.Q.; Tan, R.P. Sustainable development of China’s energy intensive industries: From theaspect of carbon dioxide emissions reduction. Renew. Sust. Energ. Rev. 2017, 77, 386–394. [Google Scholar] [CrossRef]
  49. Lin, B.Q.; Ouyang, X.L. Analysis of energy-related CO2 (carbon dioxide) emissionsand reduction potential in the Chinese non-metallic mineral products industry. Energy 2014, 68, 688–697. [Google Scholar] [CrossRef]
  50. IPCC (Intergovernmental Panel on Climate Change). IPCC Guidelines for National Greenhouse Gas Inventories; United Kingdom Meteorological Office: Bracknell, UK, 2006. [Google Scholar]
  51. Zhang, Y.J.; Da, Y.B. The decomposition of energy-related carbon emission and its decoupling with economic growth in China. Renew. Sust. Energ. Rev. 2015, 41, 1255–1266. [Google Scholar] [CrossRef]
  52. Ang, B.W. The LMDI approach to decomposition analysis: A practical guide. Energy Policy 2005, 33, 867–871. [Google Scholar] [CrossRef]
  53. Bureau of Statistics of Henan Province. Henan Statistical Yearbook 2002–2016; China Statistics Press: Beijing, China, 2016.
  54. National Bureau of Statistics of China. China Energy Statistical Yearbook 2015; China Statistics Press: Beijing, China, 2015.
  55. Wang, C.; Chen, J.; Zou, J. Decomposition of energy-related CO2 emission in China: 1957-2000. Energy 2005, 30, 73–83. [Google Scholar] [CrossRef]
  56. Wang, M.; Feng, C. Decomposition of energy-related CO2 emissions in China: An empiricalanalysis based on provincial panel data of three sectors. Appl. Energy 2017, 190, 772–787. [Google Scholar] [CrossRef]
  57. Liu, L.C.; Fan, Y.; Wu, G.; Wei, Y.M. Using LMDI method to analyze the change of China’s industrial CO2 emissions from final fuel use: An empirical analysis. Energy Policy 2007, 35, 5892–5900. [Google Scholar] [CrossRef]
  58. Xu, S.C.; He, Z.X.; Long, R.Y.; Chen, H.; Han, H.M.; Zhang, W.W. Comparative analysis of the regional contributions to carbon emissions in China. J. Clean. Prod. 2016, 127, 406–417. [Google Scholar] [CrossRef]
  59. Wang, S.S.; Zhou, D.Q.; Zhou, P.; Wang, Q.W. CO2 emissions, energy consumption and economic growth in China: A panel data analysis. Energy Policy 2011, 39, 4870–4875. [Google Scholar] [CrossRef]
  60. Ren, S.G.; Fu, X.; Chen, X.H. Regional variation of energy-related industrial CO2 emissions mitigation in China. China Econ. Rev. 2012, 23, 1134–1145. [Google Scholar] [CrossRef]
  61. Chen, S.Y. The abatement of carbon dioxide intensity in China: Factors decomposition and policy implications. World Econ. 2011, 34, 1148–1167. [Google Scholar] [CrossRef]
  62. Fisher-Vanden, K.; Jefferson, G.H.; Ma, J.; Xu, J. Technology development and energy productivity in China. Energy Econ. 2006, 28, 690–705. [Google Scholar] [CrossRef]
  63. Chiu, T.Y.; Lo, S.L.; Tsai, Y.Y. Establishing an integration-energy-practice model for improving energy performance indicators in ISO 50001 energy management systems. Energies 2012, 5, 5324–5339. [Google Scholar] [CrossRef]
  64. Feng, T.; Sun, L.; Zhang, Y. The relationship between energy consumption structure, economic structure and energy intensity in China. Energy Policy 2009, 37, 5475–5483. [Google Scholar] [CrossRef]
  65. Xu, F.; Xiang, N.; Nijkamp, P.; Higano, Y. Dynamic simulation of China’s carbon intensity and energy intensity evaluation focusing on industry and energy structure adjustments by 2020. Environ. Eng. Manag. J. 2013, 12, 1897–1901. [Google Scholar] [CrossRef]
  66. Yi, B.W.; Xu, J.H.; Fan, Y. Determining factors and diverse scenarios of CO2 emission intensity reduction to achieve the 40-45% target by 2020 in China—A historical and prospective analysis for the period 2005-2020. J. Clean. Prod. 2016, 122, 87–101. [Google Scholar] [CrossRef]
  67. IEA (International Energy Agency). CO2 Emissions from Fuel Combustion Highlights; IEA: Paris, France, 2016. [Google Scholar]
  68. Liu, Z.; Guan, D.; Crawford-Brown, D.; Zhang, Q.; He, K.; Liu, J. Energy policy: A low-carbon road map for China. Nature 2013, 500, 143–145. [Google Scholar] [CrossRef] [PubMed]
  69. Mi, Z.F.; Zhang, Y.K.; Guan, D.B.; Shan, Y.L.; Liu, Z.; Cong, R.G.; Yuan, X.C.; Wei, Y.M. Consumption-based emission accounting for Chinese cities. Appl. Energy 2016, 184, 1073–1081. [Google Scholar] [CrossRef]
  70. Mi, Z.F.; Meng, J.; Guan, D.B.; Shan, Y.L.; Liu, Z.; Wang, Y.T.; Feng, K.H.; Wei, Y.M. Pattern changes in determinants of Chinese emissions. Environ. Res. Lett. 2017, 12, 074003. [Google Scholar] [CrossRef]
Figure 1. The research framework.
Sustainability 11 01176 g001
Figure 2. Location for Henan Province of China.
Sustainability 11 01176 g002
Figure 3. Trends of economic, energy consumption and CO2 emissions of Henan Province during 2001–2015: (a) GDP as a function of the economic sector and (b) sectoral energy consumption and entire energy-related CO2 emissions.
Sustainability 11 01176 g003
Figure 4. Growth trend of industrial energy-related CO2 emissions from 2001 to 2015.
Sustainability 11 01176 g004
Figure 5. Trend of annual and accumulated changes in CO2 emissions from LMDI decomposition results.
Sustainability 11 01176 g005
Figure 6. Decomposition results for three industrial sub-sectors during the three FYP periods (10th (2001–2005), 11th (2006–2010), 12th (2011–2015) FYPs), and the entire period. (Note: ΔECY, ΔECES, ΔECIS, ΔECII, ΔECRI, ΔECRE, and ΔECEI are the CO2 emission changes of economic output, energy structure, industrial internal structure, investment intensity, R&D intensity, R&D efficiency, and energy intensity, respectively.).
Sustainability 11 01176 g006
Figure 7. Decomposition results of various driving force effects on CO2 emission changes in the three FYP periods and the entire period: (a) 2001–2005; (b) 2006–2010; (c) 2011–2015; and (d) 2001–2015.
Sustainability 11 01176 g007
Figure 8. Industrial energy-related CO2 emissions and mitigation potential: (a) Historical and future CO2 emission trends over 2001–2030 under five scenarios and (b) CO2 mitigation potentials over 2015–2030 under four scenarios.
Sustainability 11 01176 g008
Table 1. Definition of variables in Equations (1) and (2).
VariablesDescription and DefinitionUnit
Equation (1)
iSector ith of the industrial sector
jFuel jth of the energy consumption
ECTotal CO2 emissions of industrial sectorMt
ECijCO2 emissions of sector ith of fuel jthMt
EijEnergy consumption of sector ith of fuel jthMtce
NCVjAverage net calorific value of fuel jthTJ/Mtce
CCjCarbon content of fuel jtht-C/TJ
OjCarbon oxidation factor of fuel jth%
44/12Ratio of molecular weights of CO2 and C
Equation (2)
EiEnergy consumption of sector ithMtce
YiAdded value of sector ith109 RMB
RiR&D expenditure of sector ith109 RMB
IiFixed asset investment of sector ith109 RMB
YTotal added value of industrial sector109 RMB
EFijCO2 emission per unit of fuel jth in sector itht/tce
ESijShare of the fuel jth in final energy consumption of sector ithMtce/Mtce
EIiEnergy intensity of sector ithtce/103 RMB
REiAdded value per unit of R&D expenditure in sector ithadded value, 109 RMB/R&D expenditure, 109 RMB
RIiShare of R&D expenditure in fixed asset investment of sector ithR&D expenditure, 109 RMB/fixed asset investment, 109 RMB
IIiShare of fixed asset investment in added value of sector ithfixed asset investment, 109 RMB/added value, 109 RMB
ISiShare of added value of sector ith in total added valueadded value, 109 RMB/added value, 109 RMB
Table 2. Classification of industrial sub-sectors studied in Henan Province.
SymbolIndustrial Sub-SectorSymbolIndustrial Sub-Sector
Mining and QuarryingS20Manufacture of medicines
S1Mining and washing of coalS21Manufacture of chemical fibers
S2Extraction of petroleum and natural gasS22Manufacture of rubber and plastics
S3Mining and processing of ferrous metal oresS23Manufacture of non-metallic mineral products
S4Mining and processing of non-ferrous metal oresS24Smelting and pressing of ferrous metals
S5Mining and processing of non-metal oresS25Smelting and pressing of non-ferrous metals
ManufacturingS26Manufacture of metal products
S6Processing of food from agricultural productsS27Manufacture of general purpose machinery
S7Manufacture of foodsS28Manufacture of special purpose machinery
S8Manufacture of wine, beverage and refined teaS29Manufacture of transport equipment
S9Manufacture of tobaccoS30Manufacture of electrical machinery and equipment
S10Manufacture of textileS31Manufacture of communication equipment, computers, and other electronic equipment
S11Manufacture of textile wearing apparel, footwear, and capsS32Manufacture of measuring instruments and machinery for cultural activity and office work
S12Manufacture of leather, fur, feather, and related productsS33Manufacture of other manufacturing
S13Processing of timber; manufacture of wood, bamboo, rattan, palm, and straw productsS34Recycling and disposal of waste
S14Manufacture of furnitureProduction and Supply of Electric Power, Gas and Water
S15Manufacture of paper and paper productsS35Production and supply of electric power and heat power
S16Printing, reproduction of recording mediaS36Production and supply of gas
S17Manufacture of articles for culture, education, and sportS37Production and supply of water
S18Processing of petroleum, coking, processing of nuclear fuelOther Industries
S19Manufacture of raw chemical materials and chemical productsS38Support activities for mining, Mining of other ores, and Repairing services of metal products, machinery and equipment
Table 3. CO2 emission changes in various factors and the contribution of each factor to the total industrial energy-related CO2 emission changes over 2001–2015.
CO2 Emission Changes (104 t)Contribution (%)
Economic OutputInternal StructureEnergy StructureEnergy IntensityR&D IntensityR&D EfficiencyInvestment IntensityTotal ChangesηYηISηESηEIηRIηREηII
(ΔECY)(ΔECIS)(ΔECES)(ΔECEI)(ΔECRI)(ΔECRE)(ΔECII)(ΔECtot )
2001–200226121182−928−1162114964−3397175014970−53−664855−194
2002–200343254616−7145743−1,45048855376711510−19152−385235
2003–20046150417180409−3,5996308832918716686636−50243459
2004–20057096−1704148−1048−816−830892414609154−373−23−18−180200
2005–20068553−800145−14411723−125569047825109−102−2150−16012
2006–200710375−158139−24061125−357724636438161−251−3717−5638
2007–20088905−290152−37825118−47−50732272392−1282−166225−2−223
2008–20097167−1423−58−2524−4693−772212,4213168226−45−2−80−148−244392
2009–201010627−403224−26344,1169−27,189−13,9813984267−1011−661033−683−351
2010–201111747−3940−168−48259610−3603−60112810418−140−6−172342−128−214
2011–201211823−9729−24−43776204−1626−4724−2453482−397−1−178253−66−193
2012–20138991−5180−36−1613−12491897−6562153418−241−2−75−5888−30
2013–20147326−4786−44−387910961−1640−9326−1387528−345−3−280790−118−672
2014–20156005−565374−4439−5475−14406920−4007150−1412−111−137−36173
2001–2015111,702 −4,1148 350 −32,903 31,802 −62,263 30,553 38,094 293−1081−86 83 −163 80
Note: ηY, ηIS, ηES, ηEI, ηRI, ηRE, and ηII are the contribution ratios of economic output, industrial internal structure, energy structure, energy intensity, R&D intensity, R&D efficiency, and investment intensity, respectively. Negative numbers denote the positive contribution of reducing CO2 emissions.
Table 4. CO2 emission changes and increasing rate for subsectors and industries over 2001–2005.
Subsector2001 (Mt)2015 (Mt)2001–2015 (Mt)Increasing Rate (%)
Manufacturing86205119 (764–645) *138
S25: Smelting and Pressing of Non-Ferrous Metals74235 (58–23) *500
S19: Manufacture of Raw Chemical Materials and Chemical Products164529 (111–82) *181
Mining and Quarrying39193154 (594–440) *395
S1: Mining and Washing of Coal35187152 (197–45) *434
Production and Supply of Electric Power, Gas and Water76182106 (604–498) *139
S35: Production and Supply of Electric Power and Heat Power76181105 (438–333) *138
Summary201580379189
* Number inside the parenthesis refers to positive and negative CO2 emission changes.
Table 5. Trends of contributions of various factors at three development stages.
Decomposition FactorFYP TrendAnnual Average Contribution (%)
10th11th12th
Economic Output+++19.6
Industrial Internal Structure−7.2
Energy Structure++0.1
Energy Intensity−5.8
R&D Intensity++5.6
R&D Efficiency−10.9
Investment Intensity+5.4
Note: The sequence of trends is the 10th (2001–2005), 11th (2006–2010), and 12th (2011–2015) FYP; + and − stand for positive effect (increasing CO2 emission) and negative effect (decreasing CO2 emission) on industrial CO2 emission changes, respectively. Annual average contribution refers to the contribution rate per year of each factor to the total emission changes.
Table 6. Hypothetical annual growth percentage (%).
FactorsHistorical TrendYearScenario
BAUEISORDCP
Efficiency Improvement Factors
Energy Intensity (EI)
θ
−8.916–20−8.9−10−8.9−10.5−10.5
21–25−8.9−11−8.9−11.5−11.5
26–30−8.9−12−8.9−12.5−12.5
R&D Intensity (RI)
ν
−5.316–20−5.3−4−5.3−3−3
21–25−5.3−3−5.3−2−2
26–30−5.3−2−5.3−1−1
R&D Efficiency (RE)
μ
−316–20−3−4−3−5−5
21–25−3−5−3−6−6
26–30−3−6−3−7−7
Investment Intensity (II)
φ
17.616–2017.61817.61818
21–2517.61917.61919
26–3017.62017.62020
Structure Adjustment Factors
Industrial Internal Structure (IS)
γ
−2.316–20−2.3−2.3−3−2.3−3
21–25−2.3−2.3−4.5−2.3−4.5
26–30−2.3−2.3−5.5−2.3−5.5
Energy Structure (ES)
δ
0.316–200.30.700.30
21–250.30.7−0.50.3−0.5
26–300.30.7−10.3−1
Note: we assume that the future growth rates of the carbon emissions coefficient remain unchanged (α = 0). The annual growth rates of economic output (β) were 10%, 9%, and 8% at the 13th, 14th and 15th FYP periods, respectively.
Table 7. Carbon intensity trend under different scenarios.
ScenarioCarbon Intensity
(t-CO2/104 RMB)
Achieved 2020 Reduction Target or Not (40–45%)Achieved 2030 Reduction Target or Not (60–65%)
200520202030
BAU14.243.562.47YesYes
EI14.243.472.18YesYes
SO14.243.391.60YesYes
RD14.243.371.99YesYes
CP14.243.201.29YesYes
Table 8. Sensitivity analysis of variable parameters on CO2 emissions under the CP scenario.
ParameterChange Range *CO2 Emission Uncertainty under CP Scenario, %
β
Economic output (Y)
10% lower−12
10% higher13
γ
Industrial internal structure (IS)
10% lower−7
10% higher7
δ
Energy structure (ES)
10% lower−1
10% higher1
θ
Energy intensity (EI)
10% lower−18
10% higher21
ν
R&D intensity (RI)
10% lower3
10% higher−3
μ
R&D Efficiency (RE)
10% lower−9
10% higher10
φ
Investment intensity (II)
10% lower27
10% higher−22
* For each of the seven parameters, % change refers to comparing with the original value.

