Knowledge Analysis of the Prospective Secondary School Teacher on a Key Concept in Sustainability: Waste

 ,
, 
Abstract
:1. Introduction
2. Materials and Methods
2.1. Objectives
- Specific Objective 1 (SO1): To elaborate and validate a knowledge test on waste. For this purpose, the categories obtained in the analysis of the Secondary Education curriculum regarding the concept of waste have been taken as a reference [50].
- Specific Objective 2 (SO2): To analyse the amount of knowledge of the future secondary school teacher on the concept of waste in each of the categories established in the measuring instrument on the basis of different variables such as gender or the scientific-technological area of the teachers.
2.2. Study Hypothesis
2.3. Sample
2.4. Design of the Measuring Instrument
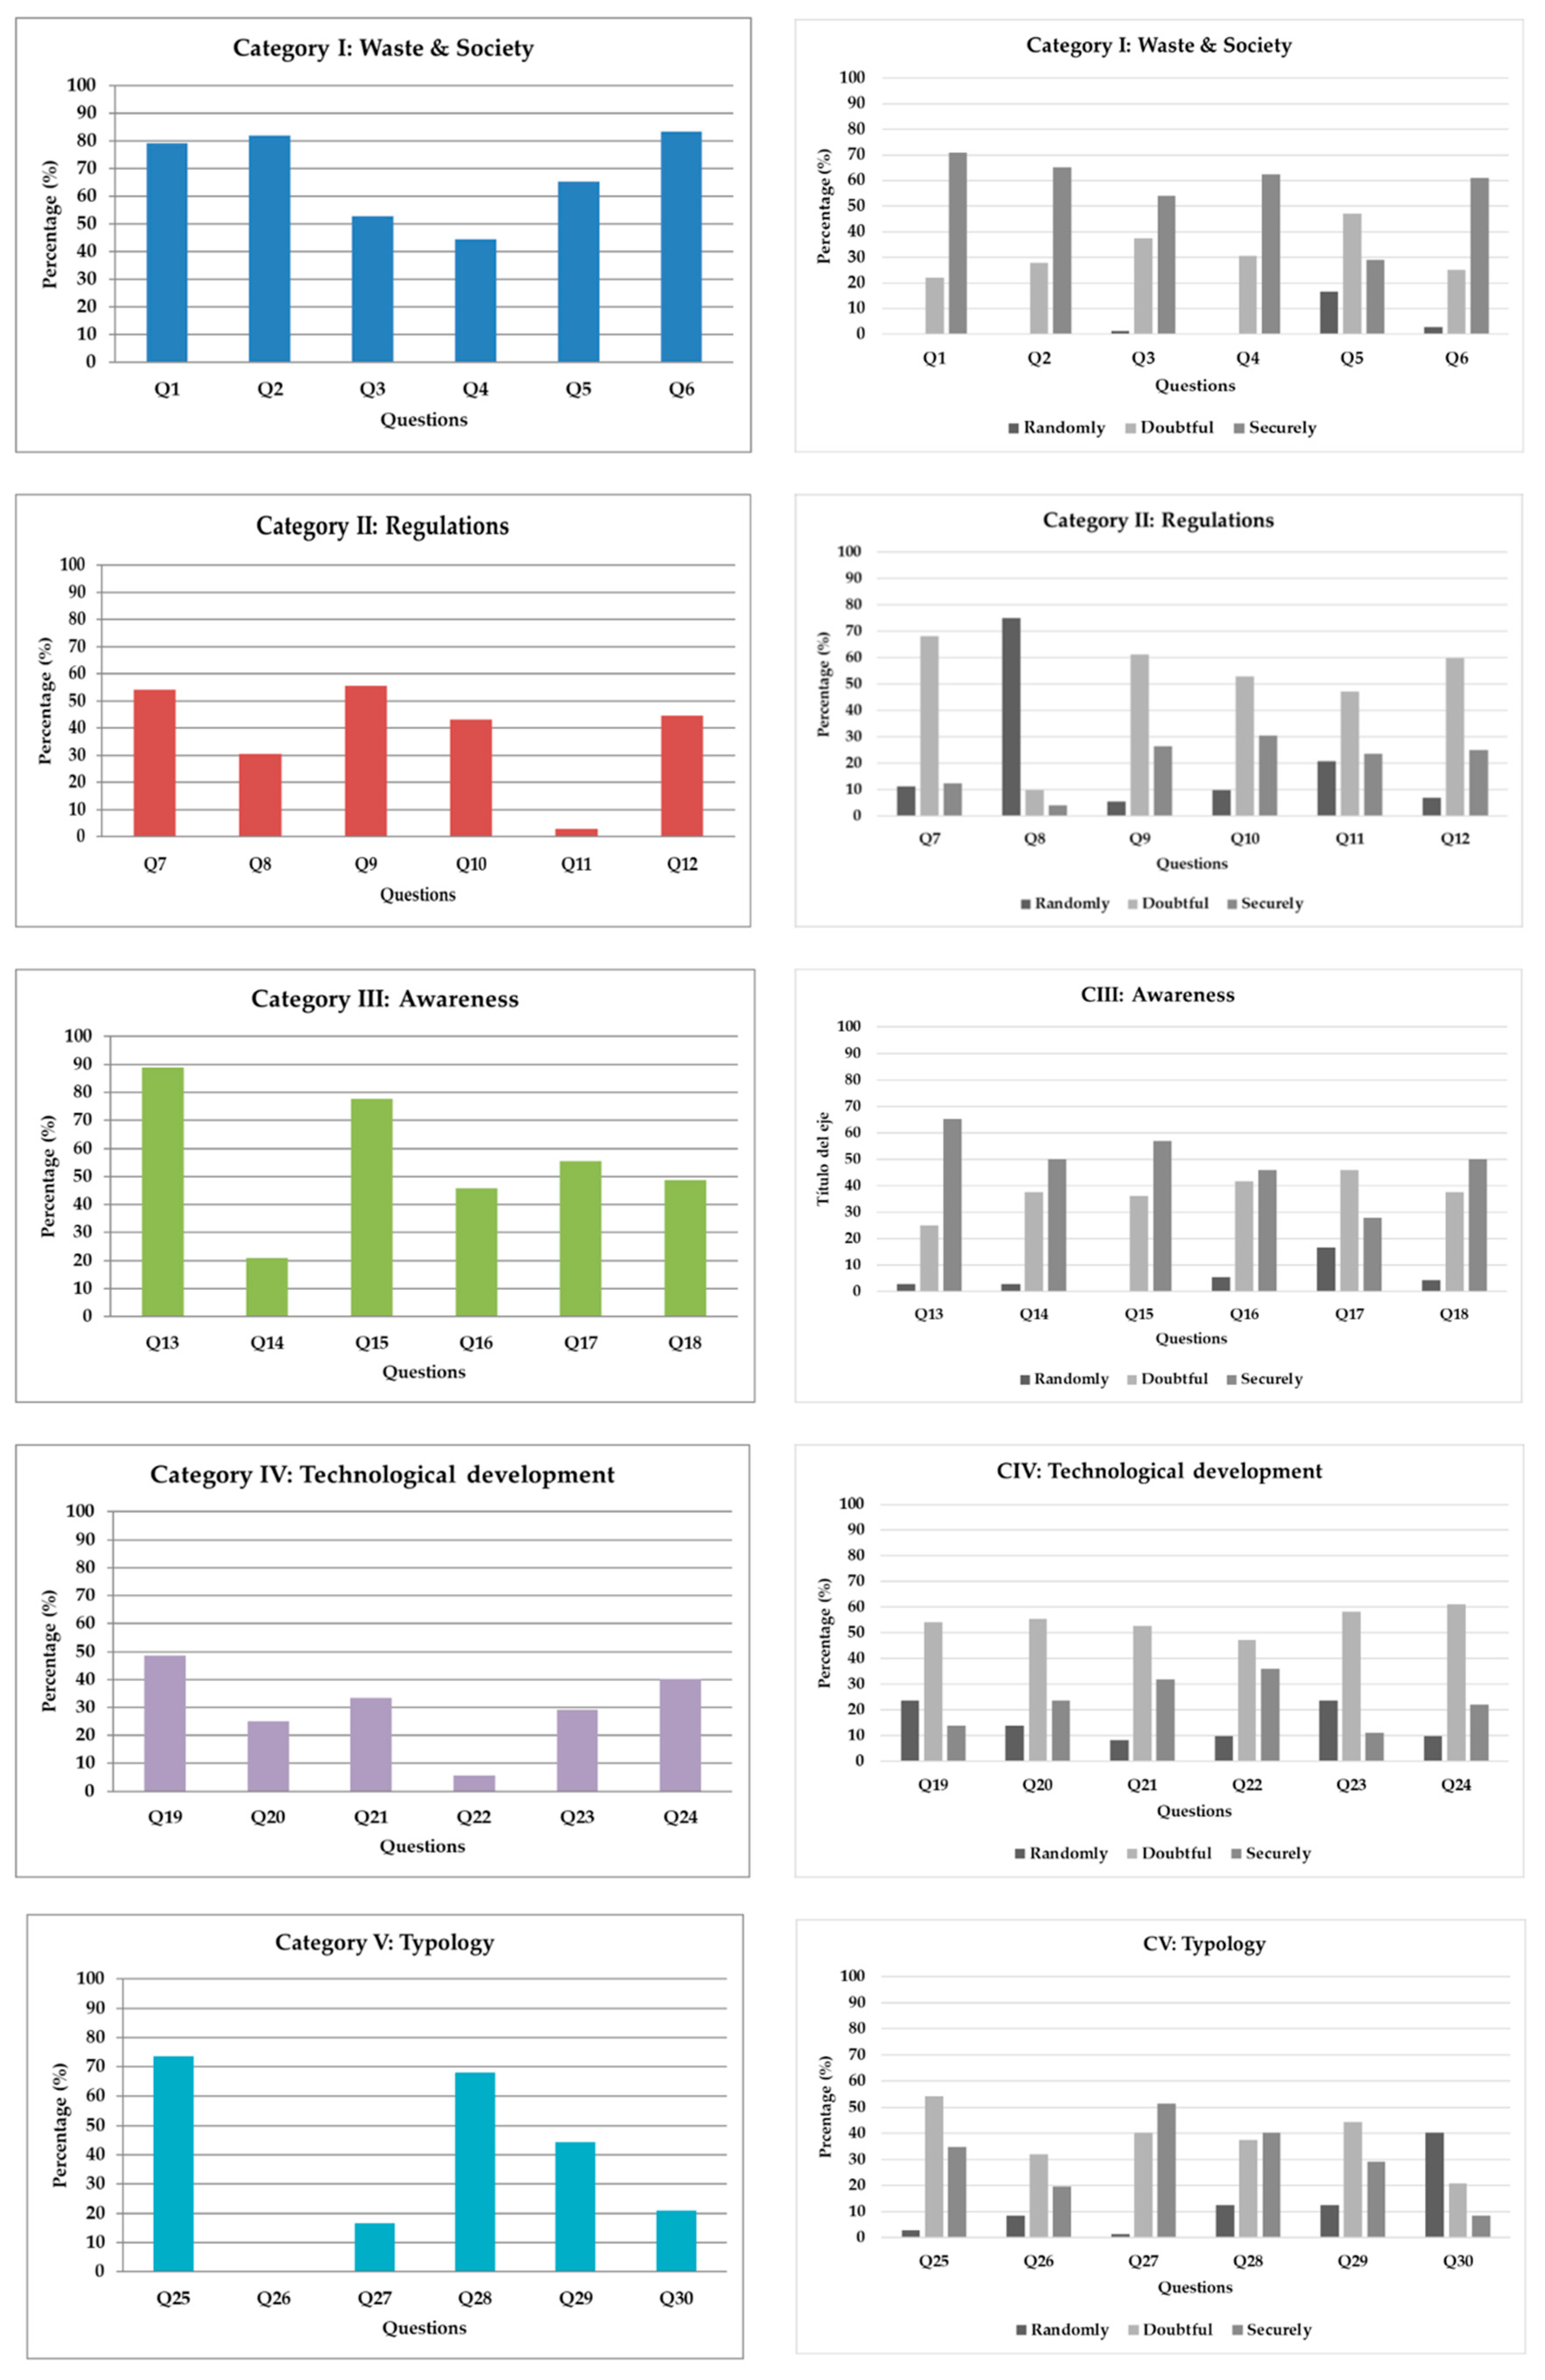
- Category I (Items 1 to 6)—Waste and Society (WS): This category includes references to environmental or social problems in which the waste is linked.
- Category II (Items 7 to 12)—Regulations and Economy (RE): This category includes references related to waste regulations, as well as those affecting economic activities.
- Category III (Items 13 to 18)—Awareness (AW): This category includes references to the concept of waste from the perspective of ethics and awareness of the environmental problems that may arise.
- Category IV (Items 19 to 24)—Technological Development (TD): This category includes references that contribute to technological development or the achievement of the proper management of problems related to waste.
- Category V (Items 25 to 30)—Typology (TY): This category includes references related to the type and origin of the waste.
- Of the thirty items designed, twenty-nine have only one correct answer and three incorrect ones called distractors, while one has multiple answers (it was a multiple-choice question where the respondent had to choose several items without any predetermined distractor).
- Among the three distractors, the “best distractor” (the most expected incorrect response by the population) was selected [54].
- The distractors have been developed based on the analysis of the concept of waste in the curriculum.
- A first draft test was prepared and submitted to eight researchers in the field of teaching of experimental sciences for validation.
- Based on the corrections made, the first test on waste concepts is prepared.
- The reliability and discriminatory power of the test are evaluated, and a statistical process is established.
2.5. Validation of the Evaluation Instrument: Calibration Indices
3. Results
3.1. Test of Hypothesis 1: Students’ Knowledge Regarding Waste
3.2. Test of Hypotheses 2 and 3: Students’ Knowledge and their Confidence in their Answering within Individual Topic Regarding Waste
3.3. Test of Hypothesis 4: Amount of Knowledge by Academic Area
3.4. Test of Hypothesis 5: Gender Variable
4. Discussion and Conclusions
Author Contributions
Funding
Conflicts of Interest
Appendix A. Complete Questionnaire
- a)
- On our way of life.
- b)
- On the appearance of new materials (basically plastics).
- c)
- On economic growth.
- d)
- All of the above are correct.
- a)
- The emergence of companies oriented towards waste management.
- b)
- To reduce the payment of the waste treatment fee on the basis of the % recycled per subscriber to the waste collection service.
- c)
- The two above are correct.
- d)
- Waste does not have any impact on our society, which is why it does not influence its economy.

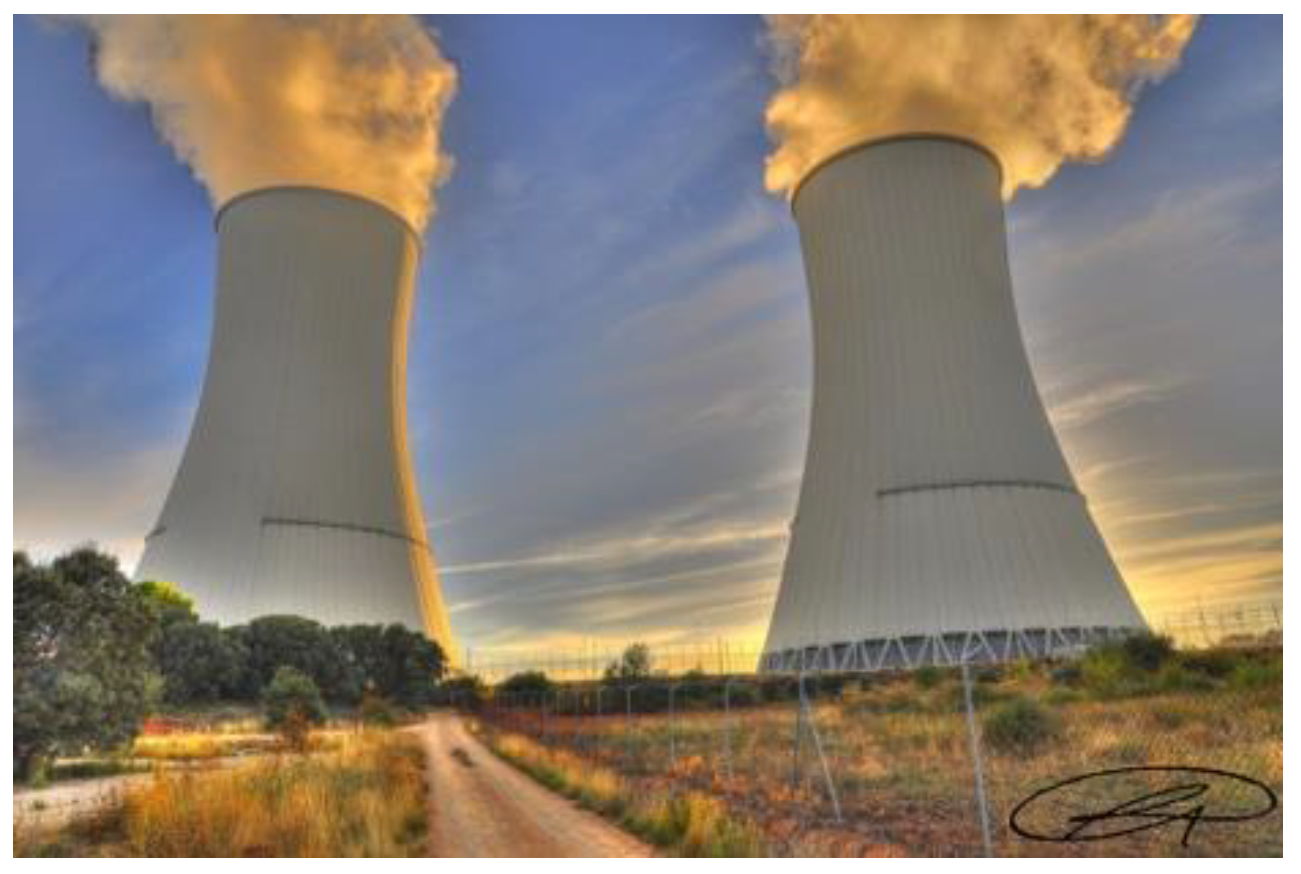
- a)
- A nuclear power plant releasing polluting gas into the atmosphere.
- b)
- A nuclear power plant releasing non-polluting gas into the atmosphere.
- c)
- A nuclear power plant releasing polluting and non-polluting gases into the atmosphere.
- d)
- A fire at a nuclear power plant.
- a)
- Yes, always.
- b)
- No.
- c)
- They are only dangerous for the quality of the air when the central is in load.
- d)
- Yes, but only if the emitted gases have the color of those that appear in the picture.
- a)
- Null.
- b)
- Very low.
- c)
- High.
- d)
- Madrid has a generation of radioactive waste much higher than Extremadura.
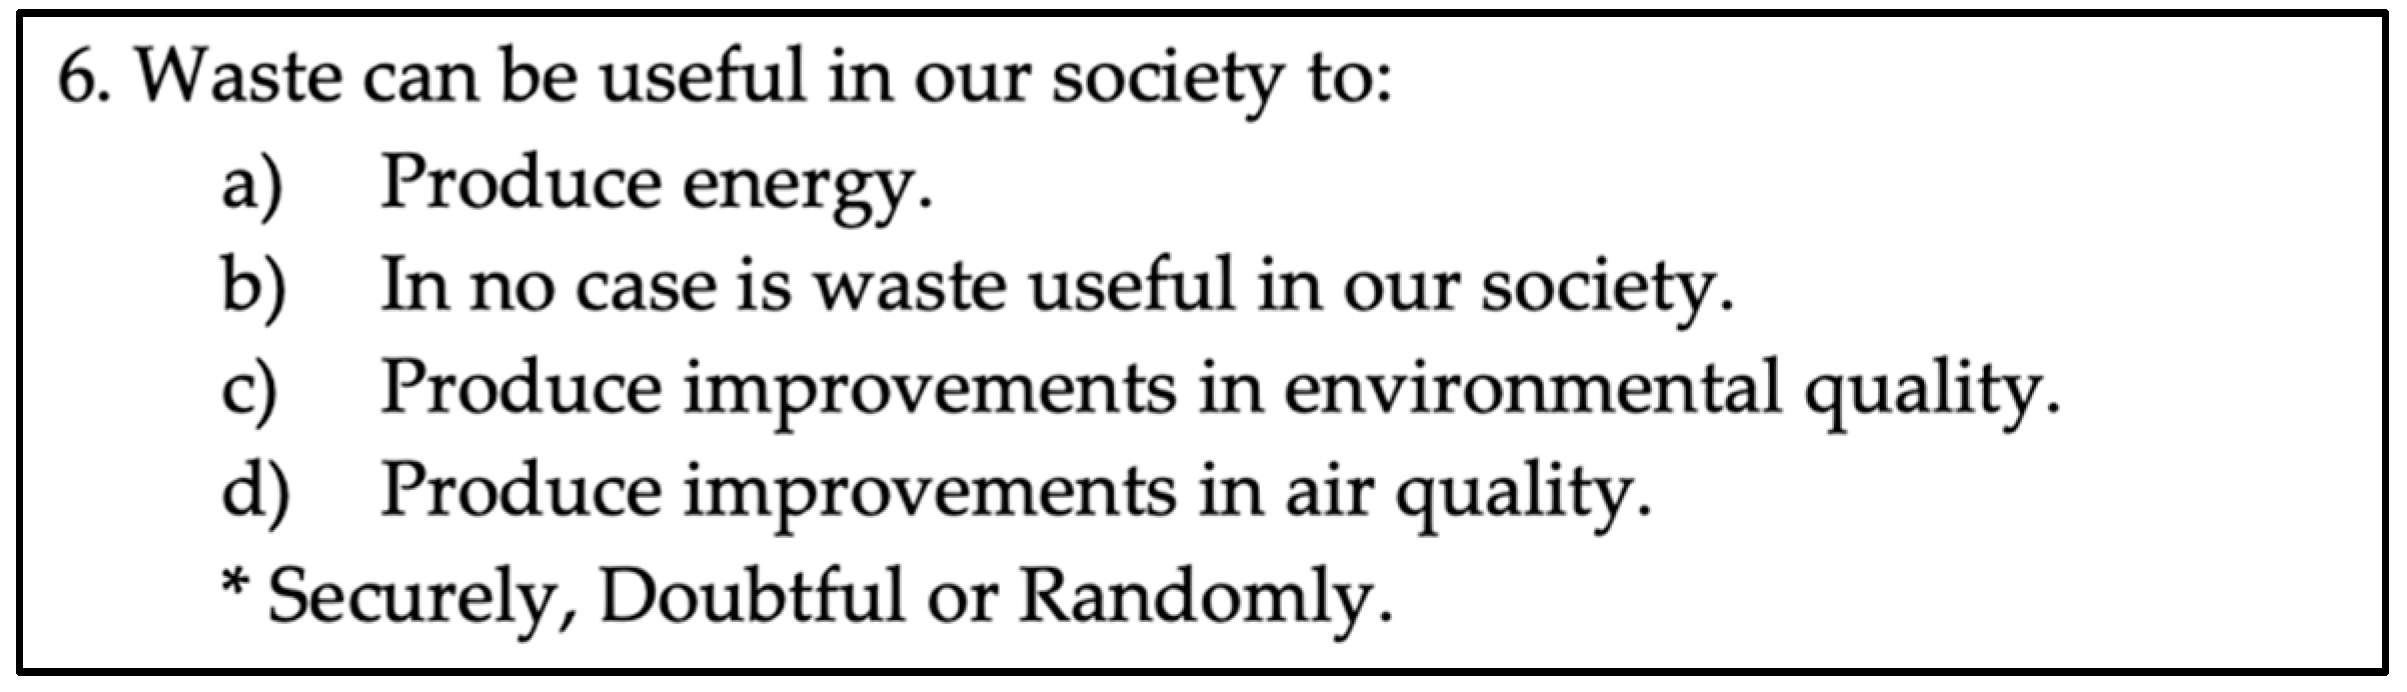
- a)
- Produce energy.
- b)
- In no case is waste useful in our society.
- c)
- Produce improvements in environmental quality.
- d)
- Produce improvements in air quality.
- a)
- It is that hazardous waste, which undergoes significant physical, chemical or biological transformations, is not soluble or combustible, does not react physically or chemically, is not biodegradable and does not negatively affect other substances in which it comes into contact.
- b)
- It is that hazardous or non-hazardous waste, which undergoes significant physical, chemical or biological transformations, is not soluble or combustible, does not react physically or chemically, is not biodegradable and does not negatively affect other substances in which it comes into contact.
- c)
- It is that non-hazardous waste that does not undergo significant physical, chemical or biological transformations, is not soluble or combustible, does not react physically or chemically, is not biodegradable and does not negatively affect other substances in which it comes into contact.
- d)
- None of the above, as there is no such thing as inert waste.
- a)
- Act 22/2011.
- b)
- Act 22/2012.
- c)
- Act 23/2011.
- d)
- Act 25/2011.
- a)
- An inert waste.
- b)
- A hazardous waste.
- c)
- A radioactive waste.
- d)
- Not considered a waste.
- a)
- Any retailer who sells tires.
- b)
- The retailer where he bought the new tires.
- c)
- No one is required to collect them.
- d)
- Any repair shop.
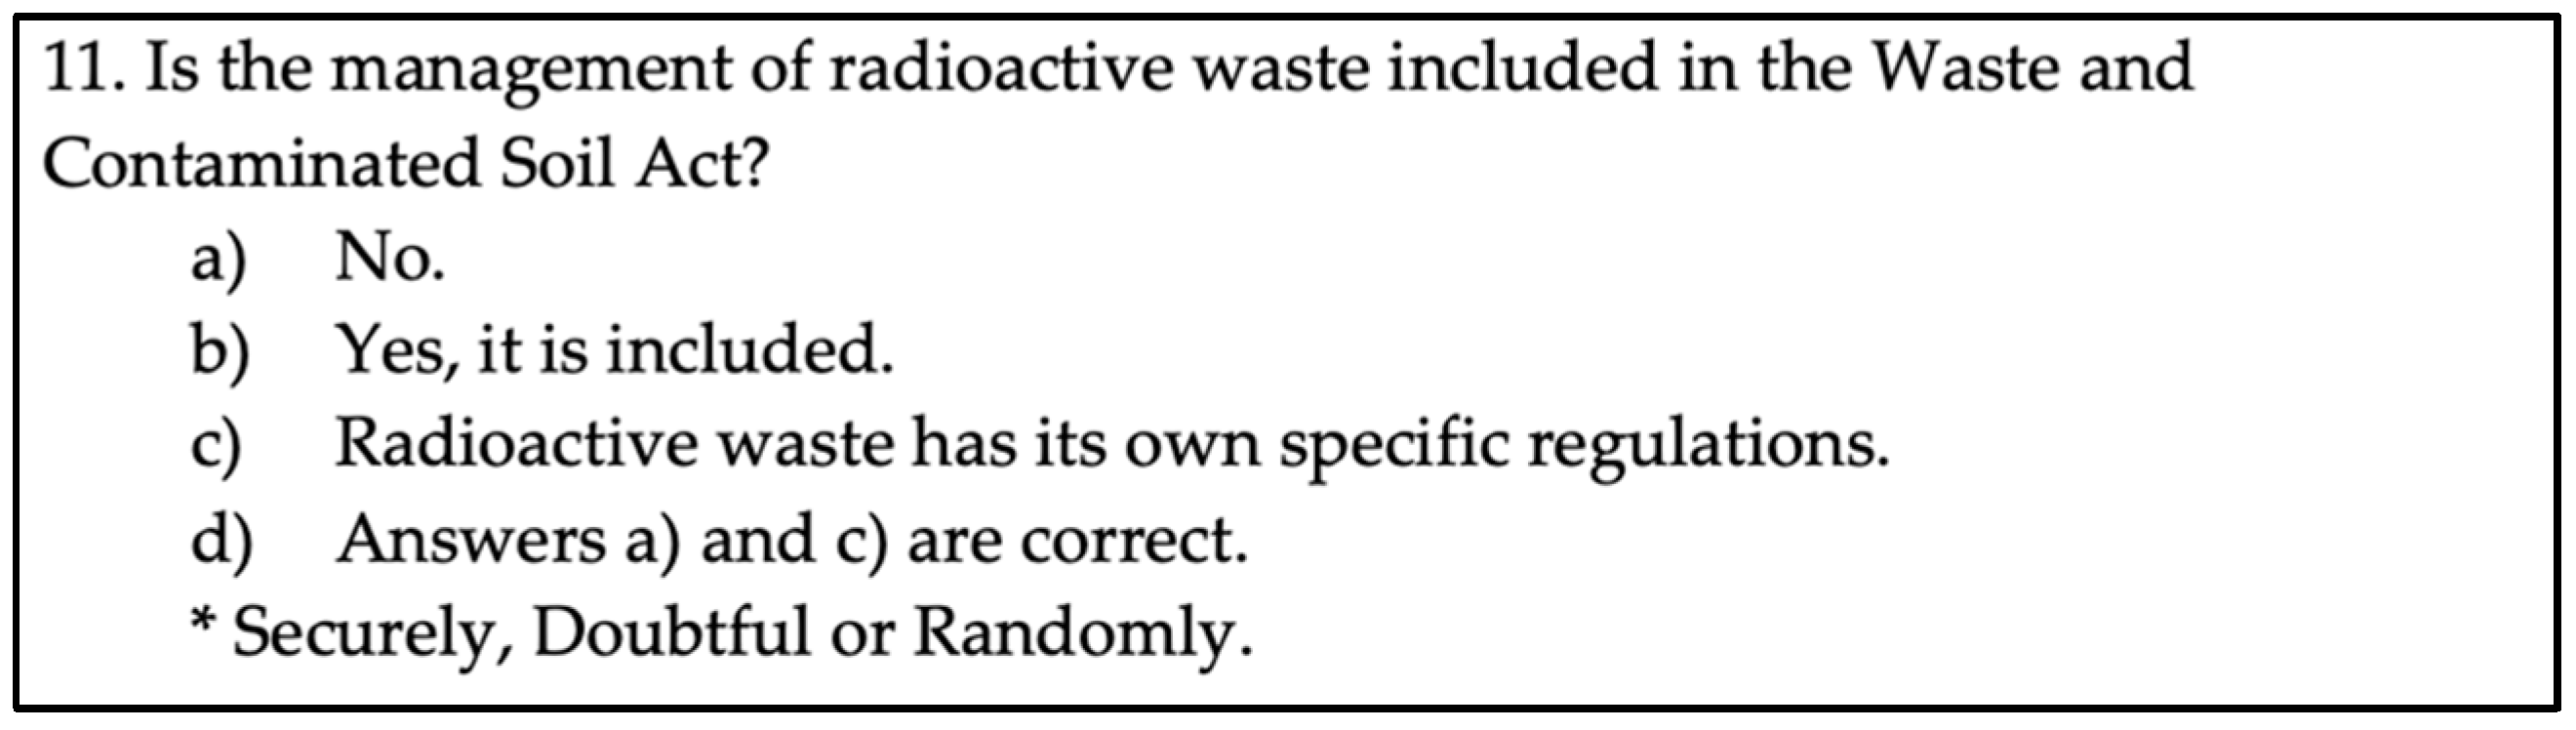
- a)
- No.
- b)
- Yes, it is included.
- c)
- Radioactive waste has its own specific regulations.
- d)
- Answers a) and c) are correct.
- a)
- Yes.
- b)
- No, since it is considered hazardous waste.
- c)
- No, since it is considered toxic waste.
- d)
- No, since it is considered inert waste.
- a)
- Reduce, Reuse, Recycle and Recover.
- b)
- Revalue, Reject, Retake and Recycle.
- c)
- Reduce, Repeat, Recycle, and Retake.
- d)
- There is no such thing as the 4Rs.
- a)
- The useful life of the product.
- b)
- Natural resources.
- c)
- The productive process of the product.
- d)
- Answers a) and b) are correct.
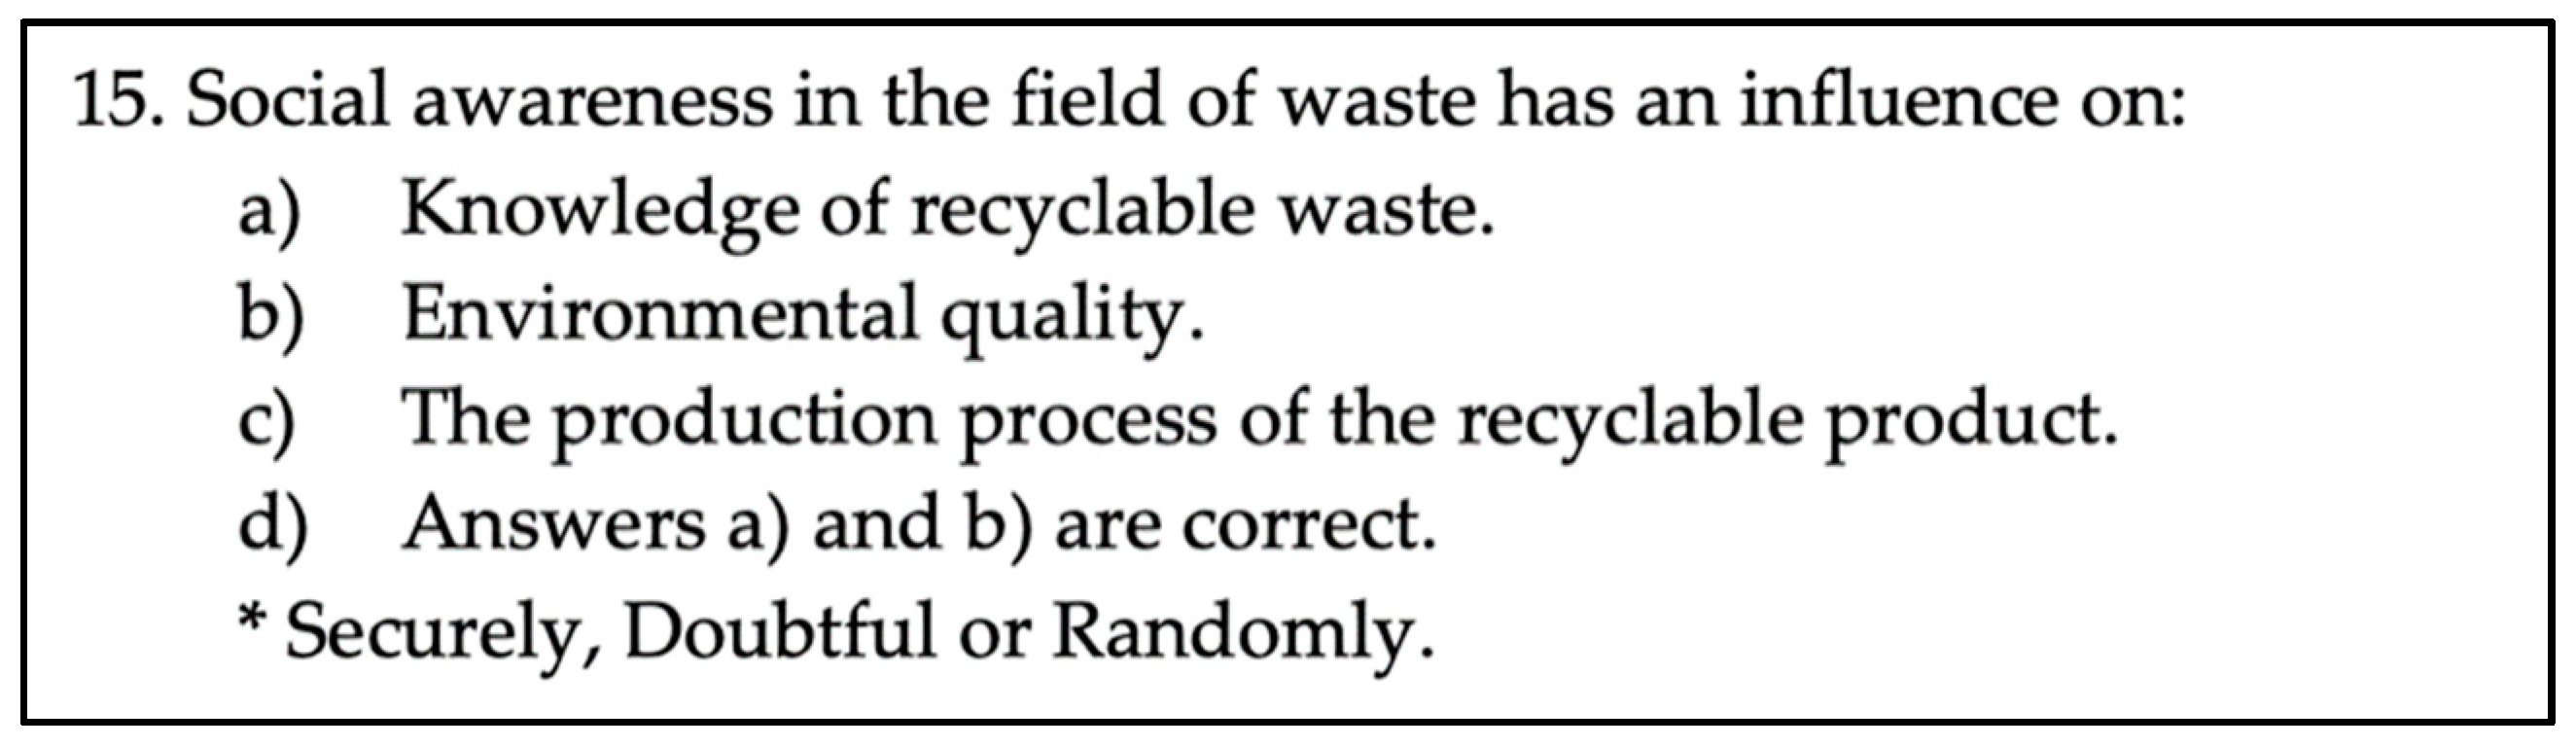
- a)
- Knowledge of recyclable waste.
- b)
- Environmental quality.
- c)
- The production process of the recyclable product.
- d)
- Answers a) and b) are correct.
- a)
- To avoid the purchase of products that are not necessary and that in a short period of time will be a waste.
- b)
- Make a selective selection of the waste generated by ourselves.
- c)
- Give a second use to those products that no longer serve their original purpose.
- d)
- All of the above answers refer to the term Reduce.
- a)
- Industrial processes.
- b)
- Household consumption.
- c)
- Livestock consumption.
- d)
- Livestock and household consumption.

- a)
- In the green container.
- b)
- In the blue container.
- c)
- In the yellow container.
- d)
- The waste depicted in the picture cannot be disposed of in any of the above three containers.
- a)
- The valorization of waste is an activity guaranteed by the European Union.
- b)
- Waste valorization is an activity that takes place after recycling and before final elimination.
- c)
- The two previous answers are correct.
- d)
- The valorization of waste is an activity guaranteed by the Spanish Government and the Autonomous Communities.
- a)
- The design process.
- b)
- The regulations established in the Law on the recovery of products.
- c)
- The toxicity of the product.
- d)
- None of the above.
- a)
- When the fire is off.
- b)
- When the fire starts to ignite.
- c)
- In the middle, when the fire burns with a great flame.
- d)
- In all cases they have the same energy.
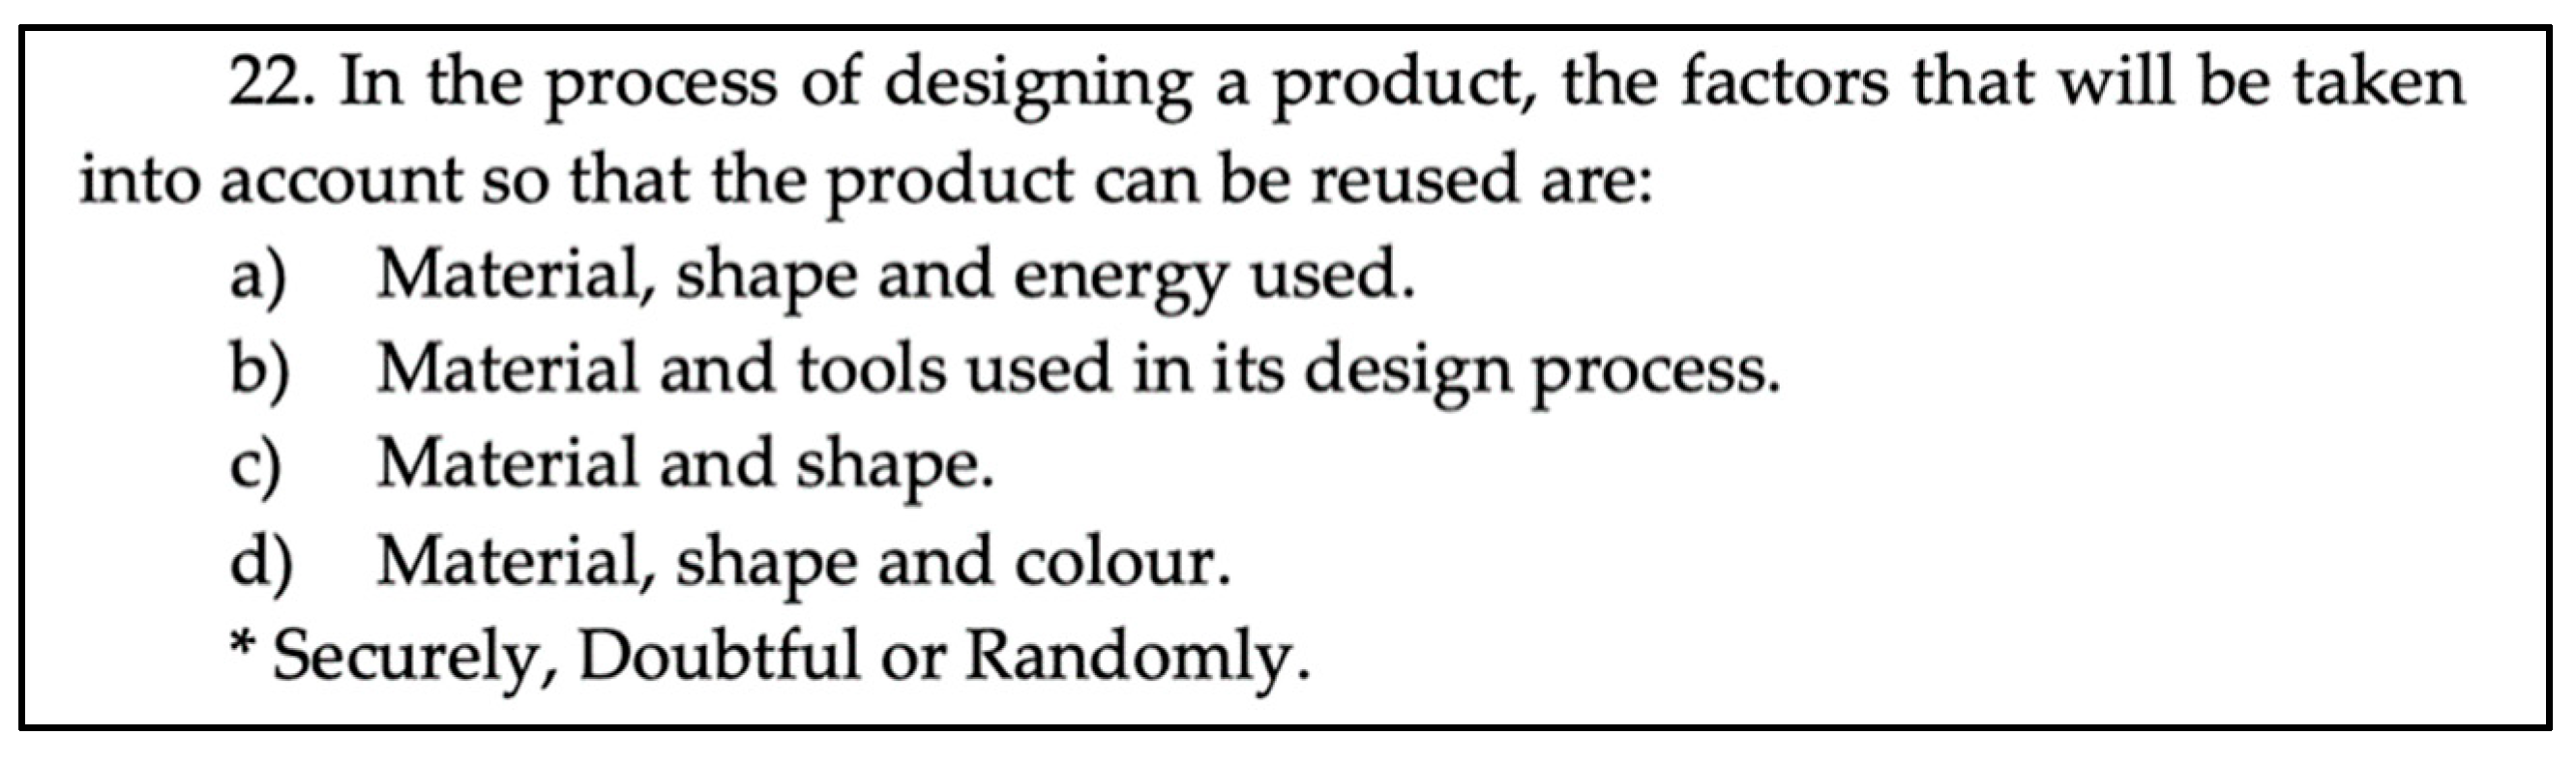
- a)
- Material, shape and energy used.
- b)
- Material and tools used in its design process.
- c)
- Material and shape.
- d)
- Material, shape and colour.
- a)
- A process of recovery of plastics and metals.
- b)
- A process of rejection of plastics and metals.
- c)
- A process of recycling plastics and metals.
- d)
- All of the above are correct.
- a)
- The colour of the recycled glass to be introduced as a raw material in the production proces.
- b)
- The size of the recycled glass to be introduced as a raw material in the production process.
- c)
- The shape of the recycled glass to be introduced as a raw material in the production process.
- d)
- All of the above are correct.
- a)
- Are considered hazardous waste.
- b)
- The refrigerator is a hazardous waste, but the fluorescent light is not.
- c)
- The refrigerator is not a hazardous waste, but the fluorescent light is.
- d)
- Under no circumstances are refrigerators and fluorescent lights hazardous waste.
- a)
- A pencil
- b)
- A TV set
- c)
- A washing machine
- d)
- A book
- e)
- A calculator
- f)
- A can opener
- g)
- A winding watch
- h)
- A table
- i)
- A gas heater
- j)
- An hourglass
- k)
- A candle
- l)
- A weather vane
- m)
- A tree
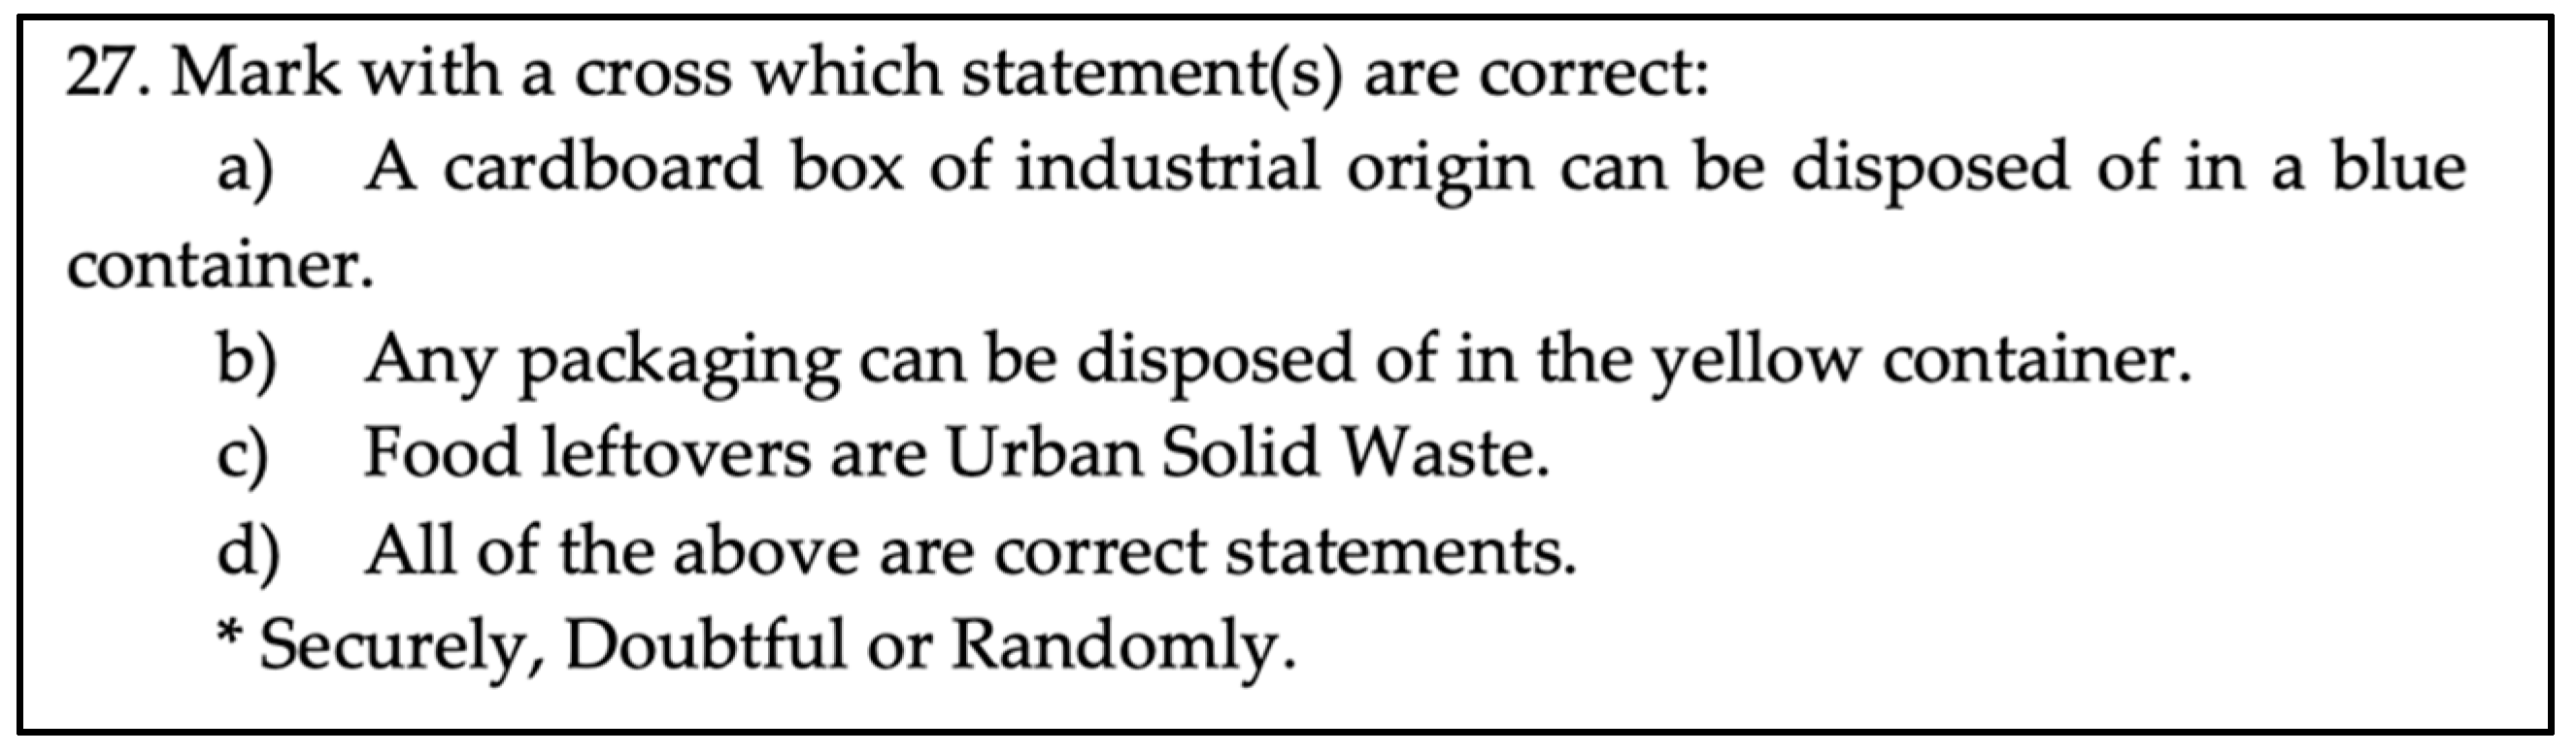
- a)
- A cardboard box of industrial origin can be disposed of in a blue container.
- b)
- Any packaging can be disposed of in the yellow container.
- c)
- Food leftovers are Urban Solid Waste.
- d)
- All of the above are correct statements.
- a)
- Only A is recyclable and can be disposed of in the yellow container.
- b)
- Only B is recyclable and can be disposed of in the yellow container.
- c)
- In both cases A and B are recyclable, but only A can be disposed of in the yellow container.
- d)
- None of the elements can be disposed of in the yellow container.
- a)
- Toxic, very toxic and neutral.
- b)
- Neutral and toxic.
- c)
- Inert, toxic and radioactive.
- d)
- Neutral, toxic and radioactive.
- a)
- Neutral.
- b)
- Inert.
- c)
- Radiactive.
- d)
- Toxic.
References
- Leff, E. Saber ambiental. In Sustentabilidad, Racionalidad, Complejidad, Poder, 3rd ed.; Siglo XXI Editores-PNUMA: Mexico City, México, 2002; ISBN 9682324025. [Google Scholar]
- García-Díaz, E. Educación Ambiental, Constructivismo y Complejidad; Diada Editora: Sevilla, España, 2004; ISBN 9788487118098. [Google Scholar]
- Yeheyis, M.; Hewage, K.; Alam, M.S.; Eskicioglu, C.; Sadiq, R. An overview of construction and demolition waste management in Canada: A lifecycle analysis approach to sustainability. Clean Technol. Environ. Policy 2013, 15, 81–91. [Google Scholar] [CrossRef]
- Pushchak, R.; Rocha, C. Failing to site hazardous waste facilities voluntarily: Implications for the production of sustainable goods. J. Environ. Plan. Manag. 1998, 41, 25–44. [Google Scholar] [CrossRef]
- Chung, S.S.; Lo, C.W. Evaluating sustainability in waste management: The case of construction and demolition, chemical and clinical wastes in Hong Kong. Resour. Conserv. Recycl. 2003, 37, 119–145. [Google Scholar] [CrossRef]
- Felder, M.; Petrell, R.; Duff, S. A solid waste audit and directions for waste reduction at the University of British Columbia, Canada. Waste Manag. Res. 2001, 19, 354–365. [Google Scholar] [CrossRef] [PubMed]
- Mason, I.; Brooking, A.; Oberender, A.; Harford, J.; Horsley, P. Implementation of a zero waste program at a university campus. Resour. Conserv. Recycl. 2003, 38, 257–269. [Google Scholar] [CrossRef]
- Dahlen, L.; Vukicevic, S.; Meijer, J.; Lagerkvist, A. Comparison of different collection systems for sorted household waste in Sweden. Waste Manag. 2007, 27, 1298–1305. [Google Scholar] [CrossRef] [PubMed]
- Moon, J. The contribution of corporate social responsibility to sustainable development. Sustain. Dev. 2007, 15, 296–306. [Google Scholar] [CrossRef]
- Grodzinska-Jurczak, M.; Bartosiewicz, A.; Twardowska, A.; Ballantyne, R. Evaluating the impact of a school waste education programme upon students’, parents’ and teachers’ environmental knowledge, attitudes and behaviour. Int. Res. Geogr. Environ. Educ. 2003, 12, 106–122. [Google Scholar] [CrossRef]
- Ballew, M.T.; Omoto, A.M.; Winter, P.L. Using Web 2.0 and social media technologies to foster proenvironmental action. Sustainability 2015, 7, 10620–10648. [Google Scholar] [CrossRef]
- Whitmarsh, L.; Lorenzoni, I.; O’Neill, S. Engaging the Public with Climate Change: Behaviour Change and Communication; Earthscan: London, UK, 2012; ISBN 9781844079285. [Google Scholar]
- Zelenika, I.; Moreau, T.; Lane, O.; Zhao, J. Sustainability education in a botanical garden promotes environmental knowledge, attitudes and willingness to act. Environ. Educ. Res. 2018, 1–16. [Google Scholar] [CrossRef]
- United Nation. Resolution Adopted by the General Assembly 57/254. United Nations Decade of Education for Sustainable Development. Available online: http://www.un-documents.net/a57r254.htm (accessed on 21 February 2019).
- UNESCO. Conferencia Mundial Sobre Educación Para el Desarrollo Sostenible: El Decenio de la Naciones Unidas de la Educación para un Desarrollo Durable; UNESCO: Paris, France, 2009. [Google Scholar]
- DiGiacomo, A.; Wu, D.W.L.; Lenkic, P.; Fraser, B.; Zhao, J.; Kingstone, A. Convenience improves composting and recycling rates in high-density residential buildings. J. Environ. Plan. Manag. 2018, 61, 309–331. [Google Scholar] [CrossRef]
- Darnton, A. GSR Behaviour Change Knowledge Review Reference Report: An Overview of Behaviour Change Models and Their Uses; Government Social Research Unit: London, UK, 2008.
- UNECE. Learning for the Future: Competences in Education for Sustainable Development; UNECE: Geneva, Switzerland, 2012; Available online: http://www.unece.org/fileadmin/DAM/env/esd/ESD_Publications/Competences_Publication.pdf (accessed on 12 December 2018).
- UNESCO. Education for Sustainable Development Goals: Learning Objectives; UNESCO: Paris, France, 2017; ISBN 978-92-3-100209-0. Available online: http://unesdoc.unesco.org/images/0024/002474/247444e.pdf (accessed on 30 November 2018).
- OECD. Green at Fifteen? How 15-year-olds Perform in Environmental Science and Geoscience in PISA 2006; OECD: Paris, France, 2009. [Google Scholar]
- National Centre for Social Research. Education and Attitudes towards the Environment; Background Paper for the Education for All Global Monitoring Report; National Centre for Social Research: London, UK, 2013. [Google Scholar]
- Penagos, W.M.M. Educación ambiental y educación para el desarrollo sostenible ante la crisis planetaria: Demandas a los procesos formativos del profesorado. TED 2009, 7–35. [Google Scholar] [CrossRef]
- Jóhannesson, I.Á.; Norðdahl, K.; Óskarsdóttir, G.; Pálsdóttir, A.; Pétursdóttir, B. Curriculum analysis and education for sustainable development in Iceland. Environ. Educ. Res. 2011, 17, 375–391. [Google Scholar] [CrossRef]
- Sureda-Negre, J.; Catalán-Fernández, A.; Álvarez-García, O.; Comas-Forgas, R. El concepto de “desarrollo sostenible” en la regulación del currículum de la Educación Secundaria Obligatoria en España. Estud. Pedagóg. 2013, 39, 253–267. [Google Scholar] [CrossRef]
- Grodzinska-Jurczak, M. Management of industrial and municipal solid wastes in Poland. Resour. Conserv. Recycl. 2001, 32, 85–103. [Google Scholar] [CrossRef]
- Biasutti, M.; Frate, S. A validity and reliability study of the Attitudes toward Sustainable Development scale. Environ. Educ. Res. 2017, 23, 214–230. [Google Scholar] [CrossRef]
- Membiela, P. Una revision del movimiento CTS en la enseñanza de las ciencias. In Enseñanza de las ciencias desde la perspectiva Ciencia-Tecnología-Sociedad. Formación científica para la ciudadanía; Membiela, P., Ed.; Narcea: Madrid, Spain, 2001; pp. 91–104. [Google Scholar]
- Marco, B. La alfabetización científica. In Didáctica de las ciencias Experimentales; Perales, F., Cañal, P., Eds.; Marfil: Alcoi, Spain, 2000; pp. 141–164. [Google Scholar]
- Caamaño, A. Presencia de CTS en el currículo escolar español. In Enseñanza de las Ciencias desde la Perspectiva Ciencia-Tecnología-Sociedad. Formación Científica para la Ciudadanía; Membiela, P., Ed.; Narcea: Madrid, Spain, 2001; pp. 121–133. [Google Scholar]
- Manassero, M.A.; Vázquez, A. Actitudes y creencias de los estudiantes relacionadas con CTS. In Enseñanza de las Ciencias desde la Perspectiva Ciencia-Tecnología-Sociedad. Formación Científica para la Ciudadanía; Membiela, P., Ed.; Narcea: Madrid, Spain, 2001; pp. 162–169. [Google Scholar]
- Chawla, L. Research methods to investigate significant life experiences: Review and recommendations. Environ. Educ. Res. 2006, 4, 359–374. [Google Scholar] [CrossRef]
- Wells, N.M. At Home with Nature: Effects of “Greenness” on Children’s Cognitive Functioning. Environ. Behav. 2000, 32, 775–795. [Google Scholar] [CrossRef]
- Wells, N.M.; Lekies, K.S. Nature and the Life Course: Pathways from Childhood Nature Experiences to Adult Environmentalism. Child. Youth Environ. 2006, 16, 1–24. [Google Scholar] [CrossRef]
- Evans, B.; Joas, M.; Sundback, S.; Theobald, K. Governing local sustainability. J. Environ. Plan. Manag. 2007, 49, 849–867. [Google Scholar] [CrossRef]
- García-Ruíz, A.; Castro-Guío, M. Aplicación Del Enfoque CIENCIA, Tecnología, Sociedad Y Ambiente Ante Problemas Reales: Vertidos Incontrolados De Residuos. Available online: https://core.ac.uk/download/pdf/13301652.pdf (accessed on 30 November 2018).
- Aznar, P.; Ull, M.A.; Piñero, A.; Martínez-Agut, M.P. La sostenibilidad en la formación universitaria: Desafíos y oportunidades1 (sustainability in higher education: Challenges and opportunities). Educación XX1 2014, 17, 133. [Google Scholar] [CrossRef]
- Biasutti, M.; De Baz, T.; Alshawa, H. Assessing the Infusion of Sustainability Principles into University Curricula. J. Teach. Educ. Sustain. 2016, 18, 21–40. [Google Scholar] [CrossRef]
- Biasutti, M.; Makrakis, V.; Concina, E.; Frate, S. Educating academic staff to reorient curricula in ESD. Int. J. Sustain. High. Educ. 2018, 19, 179–196. [Google Scholar] [CrossRef]
- Assaraf, O.B.Z.; Damri, S. University science graduates’ environmental perceptions regarding industry. J. Sci. Educ. Technol. 2009, 18, 367–381. [Google Scholar] [CrossRef]
- Ernst, J.; Theimer, S. Evaluating the Effects of Environmental Education Programming on Connectedness to Nature. Environ. Educ. Res. 2011, 17, 577–598. [Google Scholar] [CrossRef]
- Gifford, R.; Sussman, R. Environmental Attitudes. In The Oxford Handbook of Environmental and Conservation Psychology; Clayton, S.D., Ed.; Oxford University Press: Oxford, UK, 2012; pp. 65–80. [Google Scholar]
- Pajares, M.F. Teachers’ Beliefs and Educational Research: Cleaning Up a Messy Construct. Rev. Educ. Res. 1992, 62, 307–332. [Google Scholar] [CrossRef]
- Mellado, V. The classroom practice of pre-service teachers and their conceptions ofteaching and learning science. Sci. Educ. 1998, 82, 197–214. [Google Scholar] [CrossRef]
- Hewson, P.W.; Tabachnik, R.; Zeichner, K.M.; Blomker, K.; Meyer, H.; Lemberger, J.; Park, M.; Toolin, R. Educating Prospective Teachers of Biology: Introduction and Research Methods. Sci. Educ. 1999, 83, 247–273. [Google Scholar] [CrossRef]
- Porlán, R.; Martín del Pozo, R. ¿Cómo progresa el profesorado al investigar problemas prácticos relacionados con la enseñanza de la ciencia? Alambique Didáctica Cienc. Exp. 2006, 48, 92–99. [Google Scholar]
- Porlán, R.; Martín del Pozo, R.; Rivero, A.; Harres, J.; Azcárate, P.; Pizzato, M. El cambio del profesorado de ciencias I: Marco teórico y formativo. Enseñanza Ciencias 2010, 28, 31–46. [Google Scholar]
- Biasutti, M. An intensive programme on education for sustainable development: The participants’ experience. Environ. Educ. Res. 2015, 21, 734–752. [Google Scholar] [CrossRef]
- Leal Filho, W. La Educación Para La Sostenibilidad: Iniciativas Internacionales. Available online: http://www.revistaeducacion.mec.es/re2009/re2009_12.pdf (accessed on 30 November 2018).
- Grodzinska-Jurczak, M.; Tarabua, M.; Read, A. Apromotional and educational campaign towards sustainable municipal solid waste in Jaslo City, (Poland)—A pilot phase. In Proceedings of the 17th International Conference on SolidWaste Technology and Management, Philadelphia, PA, USA, 21–24 October 2001; pp. 801–806. [Google Scholar]
- Martínez, G.; Maestre, J.; Naranjo, F.L. The Concept of Waste within the Framework of Sustainable Development through the Analysis of the Secondary Education Curriculum. Eurasia J. Math. Sci. Technol. Educ. 2018, 14, 255–264. [Google Scholar] [CrossRef]
- Glažar, S.A.; Vrtačnik, M.; Bacnik, A. Primary school children’s understanding of municipal waste processing. Environ. Educ. Res. 1998, 4, 299–307. [Google Scholar] [CrossRef]
- Real Decreto 1105/2014, de 26 de diciembre, por el que se establece el currículo básico de la Educación Secundaria Obligatoria y del Bachillerato. Available online: https://www.boe.es/boe/dias/2015/01/03/pdfs/BOE-A-2015-37.pdf (accessed on 30 November 2018).
- Decreto 98/2016, de 5 de julio, por el que se establecen la ordenación y el currículo de la Educación Secundaria Obligatoria y del Bachillerato para la Comunidad Autónoma de Extremadura. Available online: http://doe.gobex.es/pdfs/doe/2016/1290o/16040111.pdf (accessed on 30 November 2018).
- Su, W.M.; Osisek, P.J.; Montgomery, C.; Pellar, S. Designing multiple-choice test items at higher cognitive levels. Nurs. Educ. 2009, 34, 223–227. [Google Scholar] [CrossRef] [PubMed]
- Ding, L.; Chabay, R.; Sherwood, B.; Beichner, R. Evaluating an electricity and magnetism assessment tool: Brief electricity and magnetism assessment. Phys. Rev. Phys. Educ. Res. 2006, 2, 1–7. [Google Scholar] [CrossRef]
- McColgan, M.W.; Finn, R.A.; Broder, D.L.; Hassel, G.E. Assessing students’ conceptual knowledge of electricity and magnetism. Phys. Rev. Phys. Educ. Res. 2017, 13, 1–19. [Google Scholar] [CrossRef]
- Barbosa, L.H. Construcción, validación y calibración de un instrumento de medida del aprendizaje: Test de Ley de Bernoulli. Rev. Educ. Ing. 2013, 8, 24–37. [Google Scholar] [CrossRef]
- Barniol, P.; Zavala, G. Test of understanding of vectors: A reliable multiple-choice vector concept test. Phys. Rev. Phys. Educ. Res. 2014, 10, 1–14. [Google Scholar] [CrossRef]
- Ferguson, G.A. On the theory of test discrimination. Psychometrika 1949, 14, 61–68. [Google Scholar] [CrossRef] [PubMed]
- Dawson, C. Upper primary boys’ and girls’ interests in science: Have they changed since 1980? Int. J. Sci. Educ. 2000, 22, 557–570. [Google Scholar] [CrossRef]
- Guimond, S.; Roussel, L. Bragging about one’s school grades: Gender stereotyping and students’ perception of their abilities in science, mathematics, and language. Soc. Psychol. Educ. 2001, 4, 275–293. [Google Scholar] [CrossRef]
- Ricoy, M.C.; Sánchez-Martínez, C. Preferencias académicas y laborales en la adolescencia: Una perspectiva de género. Estud. Pedagóg. 2016, 42, 299–313. [Google Scholar] [CrossRef]
- Dietz, T.; Dan, A.; Shwom, R. Support for Climate Change Policy: Social Psychological and Social Structural Influences. Rural Sociol. 2007, 72, 185–214. [Google Scholar] [CrossRef]
- Theodori, G.L.; Luloff, A.E. Position on Environmental Issues and Engagement in Proenvironmental Behaviors. Soc. Nat. Resour. 2002, 15, 471–482. [Google Scholar] [CrossRef]
- Xiao, C.; McCright, A.M. Explaining Gender Differences in Concern about Environmental Problems in the United States. Soc. Nat. Resour. 2012, 25, 1067–1084. [Google Scholar] [CrossRef]
- Buccheri, G.; Gürber, N.A.; Brühwiler, C. The impact of gender on interest in science topics and the choice of scientific and technical vocations. Int. J. Sci. Educ. 2011, 33, 159–178. [Google Scholar] [CrossRef]
- Camacho-González, J.P. Concepciones sobre ciencia y género en el profesorado de química: Aproximaciones desde un estudio colectivo de casos. Ciênc. Educ. 2013, 19, 323–338. [Google Scholar] [CrossRef]
- Leibham, M.B.; Alexander, J.M.; Johnson, K.E. Science interests in preschool boys and girls: Relations to later self-concept and science achievement. Sci. Educ. 2013, 97, 574–593. [Google Scholar] [CrossRef]
- Yarime, M.; Trencher, G.; Mino, T.; Scholz, R.W.; Olsson, L.; Ness, B.; Frantzeskaki, N.; Rotmans, J. Establishing sustainability science in higher education institutions: Towards an integration of academic development, institutionalization, and stakeholder collaborations. Sustain. Sci. 2012, 7, 101–113. [Google Scholar] [CrossRef]
- Sabariego, J.; Manzanares, M. Alfabetizacion cientifica. In Proceedings of the I Congreso Iberoamericano de Ciencia, Tecnología, Sociedad e Innovación CTS+I, Mexico City, México, 19–23 June 2006. [Google Scholar]
- Powell, R.R.; Robinson, M.G.; Pankratius, W. Toward a global understanding of nuclear energy and radioactive waste management. Int. J. Sci. Educ. 1994, 16, 253–263. [Google Scholar] [CrossRef]
- Tomažič, I.; Vidic, T. Assessing primary school pupils’ knowledge of and behaviour concerning waste management. Acta Biol. Slov. 2011, 54, 77–90. [Google Scholar]
- Glavič, P. Sustainability engineering education. Clean Tech. Environ. Pol. 2006, 8, 24–30. [Google Scholar] [CrossRef]
- Bradley, C.J.; Waliczek, T.M.; Zajicek, J.M. Relationship between environmental knowledge and environmental attitude of high school students. J. Environ. Educ. 1999, 30, 17–21. [Google Scholar] [CrossRef]
- Eagles, P.F.J.; Demare, R. Factors influencing children’s environmental attitudes. J. Environ. Educ. 1999, 30, 33–37. [Google Scholar] [CrossRef]
- Smyth, D.P.; Fredeen, A.L.; Booth, A.L. Reducing solid waste in higher education: The first step towards ‘greening’a university campus. Resour. Conserv. Recy. 2010, 54, 1007–1016. [Google Scholar] [CrossRef]
- Simmons, D.A.; Widmar, R. Participation in household solid waste reduction activities: The need for public education. J. Environ. Syst. 1989, 19, 323–330. [Google Scholar] [CrossRef]
- Ballantyne, R.; Fien, J.; Packer, J. School environmental education programme impacts upon student and family learning: A case study analysis. Environ. Educ. Res. 2001, 7, 23–37. [Google Scholar] [CrossRef]
- Ballantyne, R.; Fien, J.; Packer, J. Programme effectiveness in facilitating intergenerational influence in environmental education: Lessons fromthe field. J. Environ. Educ. 2001, 33, 8–15. [Google Scholar] [CrossRef]
- Gallagher, J.; Wheeler, C.; McDonough, M.; Namfa, B. Sustainable environmental education for a sustainable environment: Lessons from Thailand for other nations. Water Air Soil Pollut. 2000, 123, 489–503. [Google Scholar] [CrossRef]
- Ballantyne, R.; Fien, J.; Packer, J. Intergenerational influence in environmental education: A quantitative analysis. Aust. J. Environ. Educ. 2001, 17, 1–7. [Google Scholar] [CrossRef]
- Palmer, J.A.; Suggate, J.; Robottom, I.; Hart, P. Significant life experiences and formative influences on the development of adults’ environmental awareness in the UK, Australia and Canada. Environ. Educ. Res. 1999, 5, 181–200. [Google Scholar] [CrossRef]


| Variable | Frequency | Percentage | |
|---|---|---|---|
| Gender | Men | 34 | 47.3% |
| Women | 38 | 52.7% | |
| Age | 22–29 | 43 | 59.7% |
| 30–39 | 23 | 31.9% | |
| >39 | 6 | 8.4% | |
| Area | Technology | 29 | 40.2% |
| Physics & Chemistry | 18 | 25.1% | |
| Biology & Geology | 25 | 34.7% | |
| Degree | Bachelor’s Degree in Biology and related fields | 23 | 31.9% |
| Bachelor’s Degree in Physics and related fields | 4 | 5.5% | |
| Bachelor’s Degree in Chemistry and related fields | 5 | 6.9% | |
| Architecture/Engineering and related fields | 40 | 55.7% | |
| Coefficient | Obtained Value | Recommended Value [55,56,57] |
|---|---|---|
| Mean Difficulty Index (P) | 0.46 | [0.30–0.90] |
| Mean Discrimination Index 1 (D1) | 0.35 | ≥0.30 |
| Mean Discrimination Index 2 (D2) | 0.61 | ≥0.50 |
| Mean point biserial coefficient (rpb) | 0.22 | ≥0.20 |
| Ferguson’s delta (δ) | 0.95 | ≥0.90 |
| Mean | Std. Error of the Mean | Std. Deviation | |
|---|---|---|---|
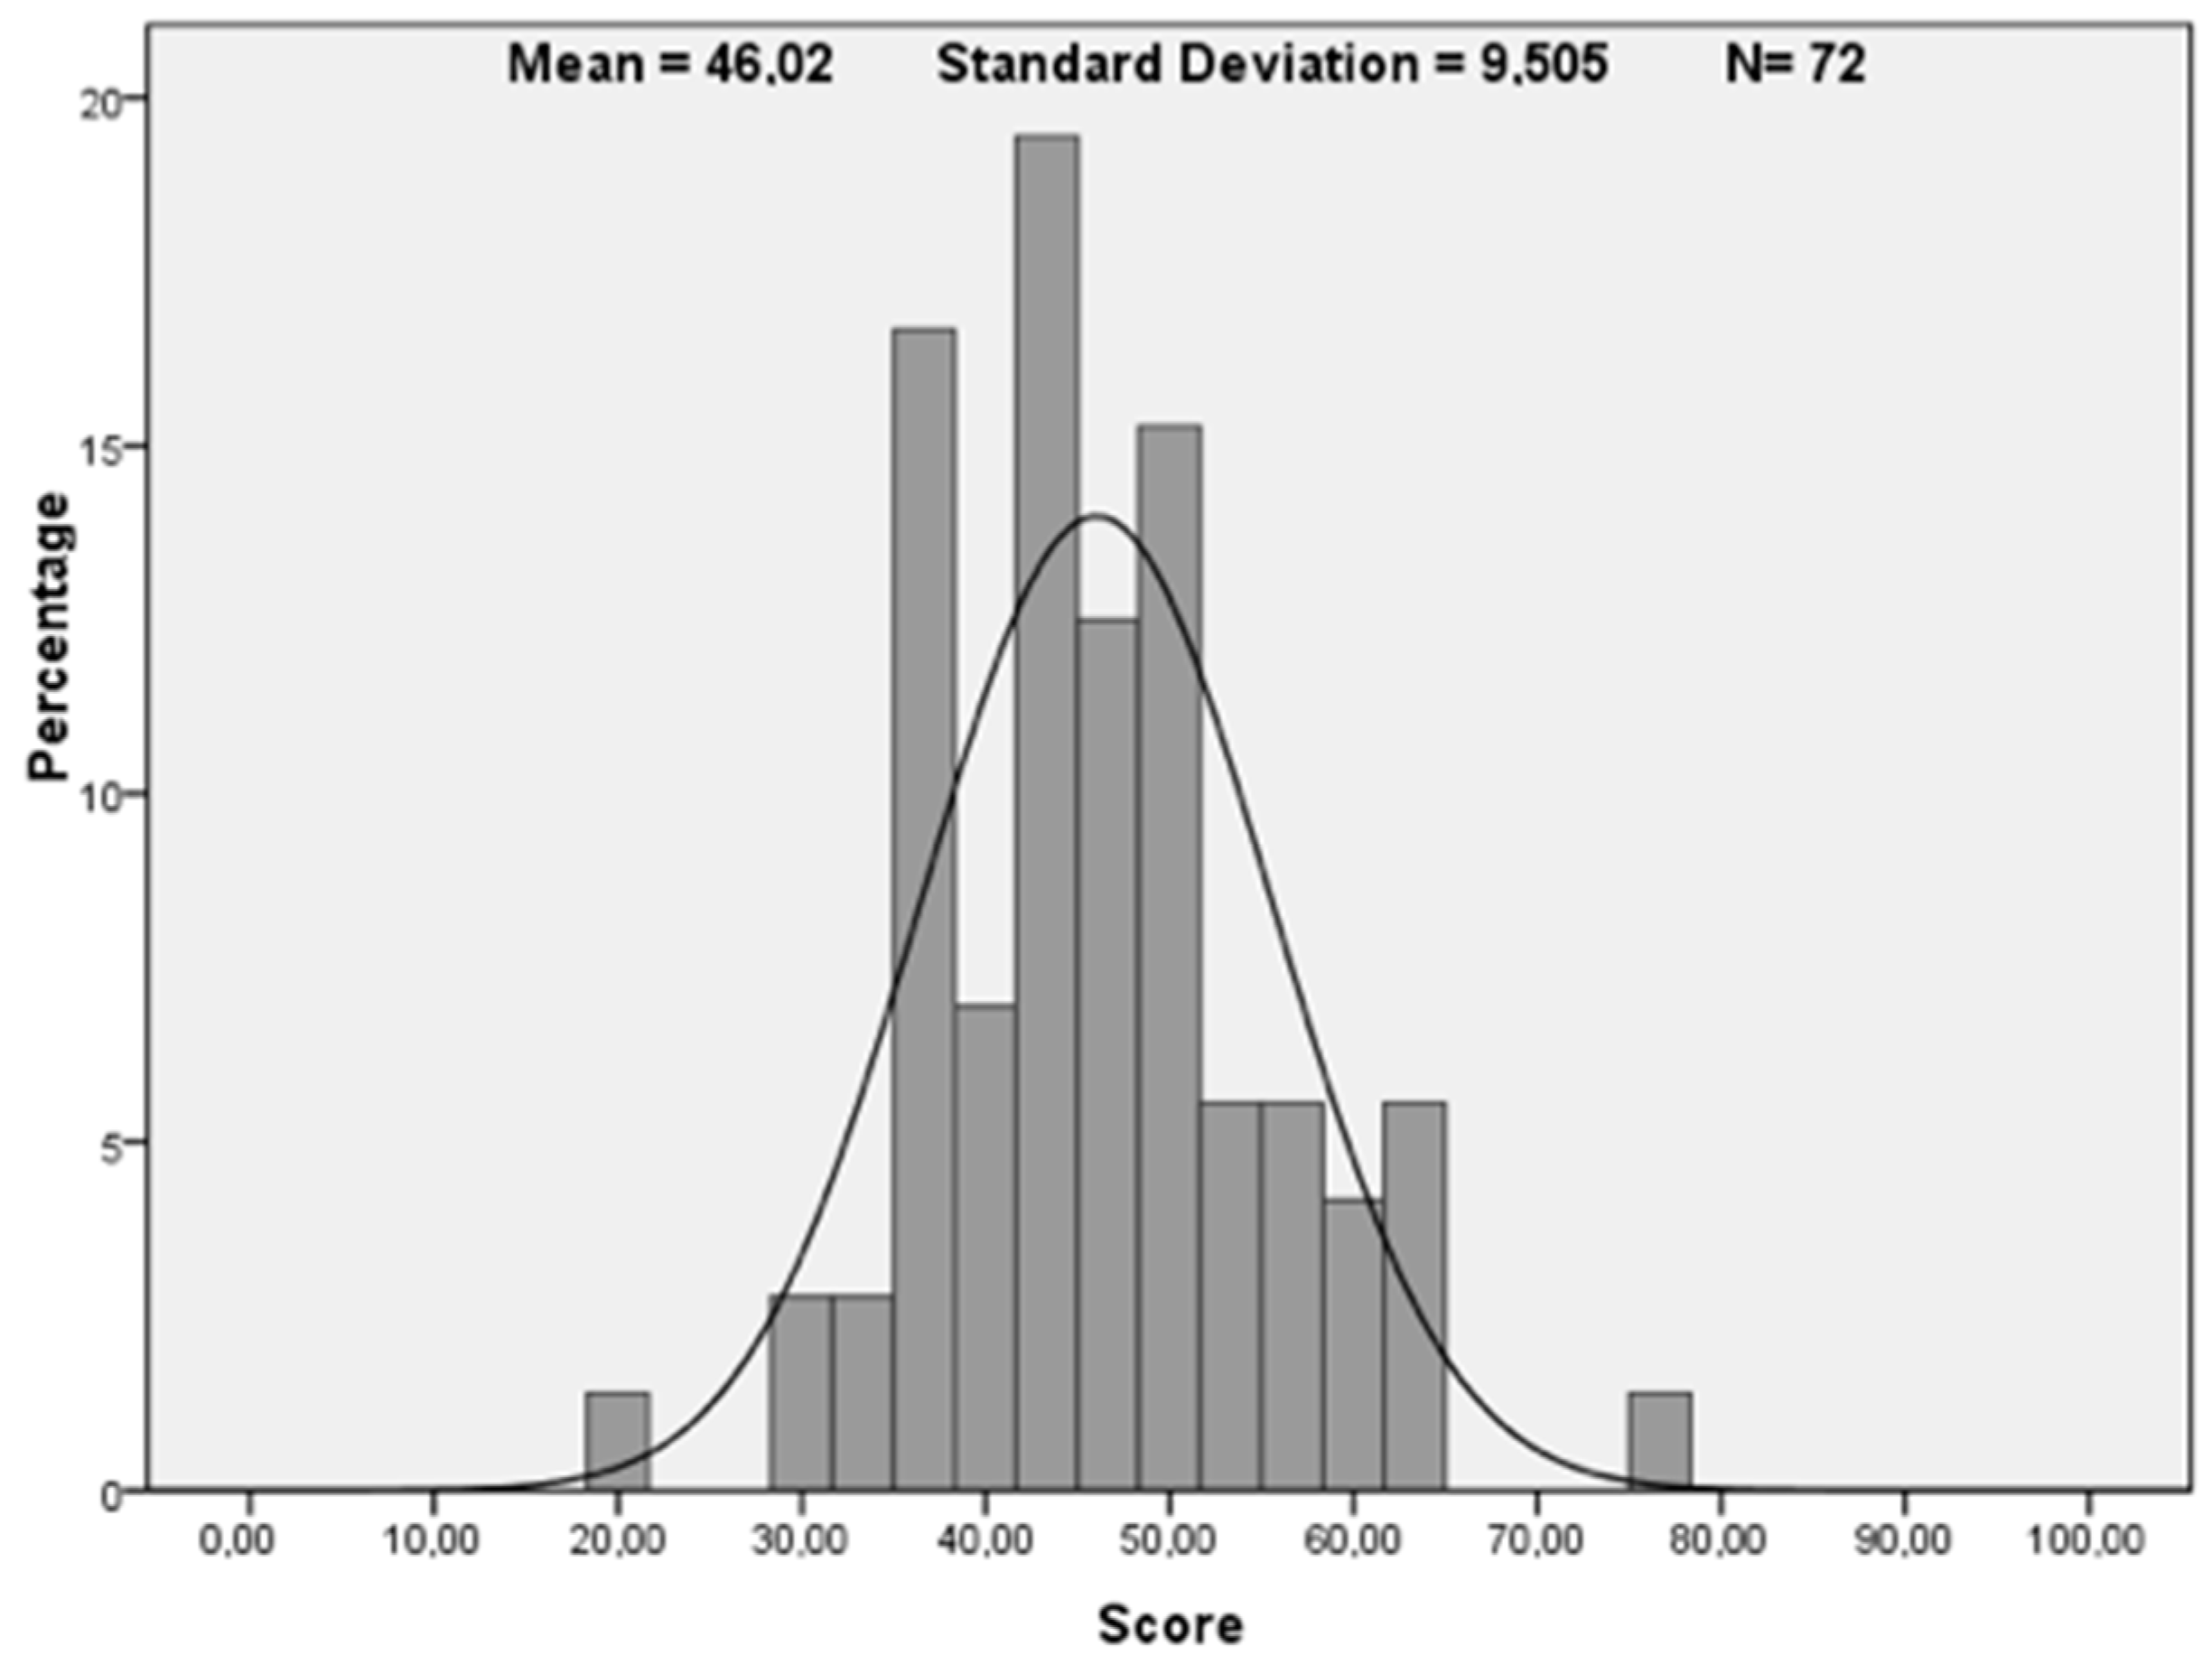
| Percentage of correct answers | 46.018 | 1.120 | 9.504 |
| Mean | Std. Error of the Mean | Std. Deviation | |
|---|---|---|---|
| Waste and Society | 6.8 | 0.3 | 2.2 |
| Regulation and Economics | 3.9 | 0.2 | 1.9 |
| Awareness | 5.6 | 0.2 | 1.9 |
| Technological Development | 3.1 | 0.2 | 1.7 |
| Typology | 3.8 | 0.2 | 1.6 |
| (I) Category | (J) Category | Mean Difference (I-J) | Std. Error | Sig. | 95% Confidence Interval | |
|---|---|---|---|---|---|---|
| Lower Bound | Upper Bound | |||||
| I | II | 0.384 * | 0.031 | 0.000 | 0.198 | 0.371 |
| III | 0.114 * | 0.031 | 0.003 | 0.028 | 0.200 | |
| IV | 0.372 * | 0.031 | 0.000 | 0.286 | 0.459 | |
| V | 0.301 * | 0.031 | 0.000 | 0.215 | 0.387 | |
| II | III | −0.170 * | 0.031 | 0.000 | −0.256 | −0.084 |
| IV | 0.087 * | 0.031 | 0.044 | 0.001 | 0.174 | |
| V | 0.016 | 0.031 | 0.985 | −0.069 | 0.102 | |
| III | IV | 0.258 * | 0.031 | 0.000 | 0.172 | 0.344 |
| V | 0.187 * | 0.031 | 0.000 | 0.100 | 0.273 | |
| IV | V | −0.071 | 0.031 | 0.159 | −0.157 | 0.015 |
| n | Mean | Std. Error of the Mean | Std. Deviation | |
|---|---|---|---|---|
| Technology | 29 | 47.1 | 1.7 | 9.3 |
| Biology & Geology | 25 | 42.3 | 1.8 | 9.1 |
| Physics & Chemistry | 18 | 49.4 | 2.1 | 9.0 |
| Normality (Kolmogorov-Smirnov) | Randomness | |
|---|---|---|
| Technology | 0.200 * | 0.480 * |
| Biology & Geology | 0.154 * | 0.650 * |
| Physics & Chemistry | 0.061 * | 1.000 * |
| Sum of Squares | df | Mean of Squares | F | Sig. | ||
|---|---|---|---|---|---|---|
| Percentage of correct answers | Between groups | 598.772 | 2 | 299.386 | 3.552 | 0.034 * |
| Within groups | 5815.425 | 69 | 84.282 | |||
| Total | 6414.198 | 71 | ||||
| Sum of Squares | df | Mean of Squares | F | Sig. | ||
|---|---|---|---|---|---|---|
| Q3 | Between groups | 1.832 | 2 | 0.916 | 3.923 | 0.024 * |
| Within groups | 16.112 | 69 | 0.234 | |||
| Total | 17.944 | 71 | ||||
| Q4 | Between groups | 1.976 | 2 | 0.988 | 4.315 | 0.017 * |
| Within groups | 15.801 | 69 | 0.229 | |||
| Total | 17.778 | 71 | ||||
| Q11 | Between groups | 0.167 | 2 | 0.083 | 3.234 | 0.045 * |
| Within groups | 1.778 | 69 | 0.026 | |||
| Total | 1.944 | 71 | ||||
| Q15 | Between groups | 1.312 | 2 | 0.656 | 4.067 | 0.021 * |
| Within groups | 11.132 | 69 | 0.161 | |||
| Total | 12.444 | 71 | ||||
| Q21 | Between groups | 4.751 | 2 | 2.375 | 14.571 | 0.000 * |
| Within groups | 11.249 | 69 | 0.163 | |||
| Total | 16.000 | 71 | ||||
| Q24 | Between groups | 3.157 | 2 | 1.578 | 7.689 | 0.001 * |
| Within groups | 14.163 | 69 | 0.205 | |||
| Total | 17.319 | 71 | ||||
| Dependent Variable | (I) Group | (J) Group | Mean Difference (I-J) | Std. Error | Sig. | 95% Confidence Interval | |
|---|---|---|---|---|---|---|---|
| Lower Bound | Upper Bound | ||||||
| Q3 | B & G | P & C | −0.417 * | 0.149 | 0.018 * | −0.775 | −0.060 |
| Q4 | B & G | P & C | −0.426 * | 0.147 | 0.014 * | −0.781 | −0.072 |
| Q15 | T | P & C | −0.323 * | 0.120 | 0.024 * | −0.6124 | −0.0351 |
| Q21 | T | P & C | −0.605 * | 0.121 | 0.000 * | −0.8956 | −0.3152 |
| B & G | P & C | −0.577 * | 0.124 | 0.000 * | −0.8767 | −0.2788 | |
| Q24 | T | B & G | 0.455 * | 0.123 | 0.001 * | 0.1590 | 0.7513 |
| T | P & C | 0.377 * | 0.135 | 0.019 * | 0.0518 | 0.7030 | |
| Gender | n | Mean | Standard Deviation | Mean Std. Error | |
|---|---|---|---|---|---|
| Percentage of correct answers | Women | 38 | 45.8 | 9.6 | 1.6 |
| Men | 34 | 46.3 | 9.5 | 1.6 |
| Levene’s Test for Equality of Variances | t-Test for Equality of Means | ||||||||
|---|---|---|---|---|---|---|---|---|---|
| F | Sig. | t | df | Sig. (2-tailed) | Mean Difference | Std. Error Difference | 95% Confidence Interval of the Difference | ||
| Lower | Lower | ||||||||
| Percentage of correct answers | 0.076 | 0.783 | −0.215 | 70 | 0.831 | −0.485 | 2.258 | −4.9905 | 4.020 |
| Hypothesis | Accepted | Rejected |
|---|---|---|
| Hypothesis 1 (H1): Teachers in training in secondary education have a low amount of knowledge in the field of waste. | X | |
| Hypothesis 2 (H2): The initial amount of knowledge of the future secondary school teacher in the field of waste is different depending on the categories established. | X | |
| Hypothesis 3 (H3): The level of confidence with which the secondary school teacher in training answers is different depending on the established categories. | X | |
| Hypothesis 4 (H4): There are statistically significant differences in the amount of knowledge about waste among the teachers in training of the different academic areas. | Partially | |
| Hypothesis 5 (H5): There are no statistically significant differences in the amount of knowledge about waste in relation to the gender variable. | X |
© 2019 by the authors. Licensee MDPI, Basel, Switzerland. This article is an open access article distributed under the terms and conditions of the Creative Commons Attribution (CC BY) license (http://creativecommons.org/licenses/by/4.0/).
Share and Cite
Martínez-Borreguero, G.; Maestre-Jiménez, J.; Mateos-Núñez, M.; Naranjo-Correa, F.L. Knowledge Analysis of the Prospective Secondary School Teacher on a Key Concept in Sustainability: Waste. Sustainability 2019, 11, 1173. https://doi.org/10.3390/su11041173
Martínez-Borreguero G, Maestre-Jiménez J, Mateos-Núñez M, Naranjo-Correa FL. Knowledge Analysis of the Prospective Secondary School Teacher on a Key Concept in Sustainability: Waste. Sustainability. 2019; 11(4):1173. https://doi.org/10.3390/su11041173
Chicago/Turabian StyleMartínez-Borreguero, Guadalupe, Jesús Maestre-Jiménez, Milagros Mateos-Núñez, and Francisco Luis Naranjo-Correa. 2019. "Knowledge Analysis of the Prospective Secondary School Teacher on a Key Concept in Sustainability: Waste" Sustainability 11, no. 4: 1173. https://doi.org/10.3390/su11041173
APA StyleMartínez-Borreguero, G., Maestre-Jiménez, J., Mateos-Núñez, M., & Naranjo-Correa, F. L. (2019). Knowledge Analysis of the Prospective Secondary School Teacher on a Key Concept in Sustainability: Waste. Sustainability, 11(4), 1173. https://doi.org/10.3390/su11041173