Article

Integrating Analytical Frameworks to Investigate Land-Cover Regime Shifts in Dynamic Landscapes

1
Department of Biological Sciences, National University of Singapore, Singapore 117543, Singapore
2
Department of Geography and Environment, University of Hawai’i at Mānoa, Honolulu, HI 96822, USA
3
Wildlife Conservation Society Myanmar, Kamayut Township, Yangon 11041, Myanmar
4
Forest Research Institute, Yezin, Zeyathiri Township, Nay Pyi Taw P.O. Box 05282, Myanmar
*
Authors to whom correspondence should be addressed.
Sustainability 2019, 11(4), 1139; https://doi.org/10.3390/su11041139
Submission received: 31 January 2019 / Revised: 16 February 2019 / Accepted: 18 February 2019 / Published: 21 February 2019

Abstract

:
Regime shifts—rapid long-term transitions between stable states—are well documented in ecology but remain controversial and understudied in land use and land cover change (LUCC). In particular, uncertainty surrounds the prevalence and causes of regime shifts at the landscape level. We studied LUCC dynamics in the Tanintharyi Region (Myanmar), which contains one of the last remaining significant contiguous forest areas in Southeast Asia but was heavily deforested between 1992–2015. By combining remote sensing methods and a literature review of historical processes leading to LUCC, we identified a regime shift from a forest-oriented state to an agricultural-oriented state between 1997–2004. The regime shift was triggered by a confluence of complex political and economic conditions within Myanmar, notably the ceasefires between various ethnic groups and the military government, coupled with its enhanced business relations with Thailand and China. Government policies and foreign direct investment enabling the establishment of large-scale agro-industrial concessions reinforced the new agriculture-oriented regime and prevented reversion to the original forest-dominated regime. Our approach of integrating complementary analytical frameworks to identify and understand land-cover regime shifts can help policymakers to preempt future regime shifts in Tanintharyi, and can be applied to the study of land change in other regions.

Graphical Abstract

1. Introduction

Escalating human domination of Earth’s ecosystems over the course of the Anthropocene has led to adverse global environmental impacts through changes in climate, biogeochemical cycles, ecosystem functions, and biodiversity [1,2,3]. Human land-use activities have transformed natural landscapes through agricultural expansion and intensification, tropical deforestation, and urban sprawl [2,4].
Transformations in land systems—the terrestrial component of earth systems that comprise all the processes, activities, and socioeconomic outcomes of the human use of land—have profound consequences for local environments and human well-being and are among the most important drivers of global environmental change [5,6]. Although land systems can change gradually, the changes may also occur abruptly between two stable states in the system. This process is referred to as a regime shift [4,7,8,9], a concept used in ecology to describe rapid transitions between different stable states of ecological systems (e.g., forest to savannah [10,11,12]).
Reorganisation of land systems may occur during brief periods of abrupt, non-linear change driven by exogenous events that are difficult to anticipate [8,13,14]. The period of rapid change between two stable states of land systems (or land-system regimes) is a ‘land-system regime shift.’ Regime shifts may be catalysed by reaching a threshold after cumulative pressure with associated feedbacks (a ‘tipping point’) or by influential events (a ‘punctuation’) applied to the land system [8,14]. Recognition of land-system regime shifts as significant components of land-system change has emerged only recently through local-scale studies with long temporal scales of land use and land cover data (e.g., 27–32 years [8,15]) that have focused on the implications of rapid land-system changes on long-term socio-ecological interactions and human well-being [8,16].
At broader scales (thousands of km2), however, studies of rapid land transformations remain challenging and have been limited by the availability of long-term land use and land cover datasets. Limits to the temporal resolution and land-cover class differentiation of available land cover data products have precluded studies that could potentially detect and investigate regime shifts at broad scales. For example, the CORINE Land Cover products, developed by the European Environment Agency [17], have been widely used for land cover change assessments in Europe [18], but its coarse time-intervals (i.e., ≥6 years) limit its applicability for detecting rapid changes. Moreover, although dense time-series historical satellite data are now beginning to provide comprehensive quantified records of global-scale land-change dynamics [19], to date there has been no direct, quantitative evidence of broad-scale (e.g., at the landscape or regional level) regime shifts. Insights into whether broad-scale regime shifts occur, and under what conditions, can inform national-level environmental policy and enhance dialogue on the drivers of widespread land change.
Data requirements for landscape-level investigation of regime shifts mirror those that are recognised at the local scale [15]. First, spatial data need to be available on a near-continuous timeline in order to unambiguously identify the occurrence of a regime shift. Second, complete information on land cover transitions is necessary to produce insights into the drivers of a regime shift. Ramankutty and Coomes [14], for example, identified the main underlying factors and triggers resulting in the shifts in the production of soybean and shrimp, but were unable to elucidate whether soybean or shrimp farms expanded at the expense of natural habitats or other categories of cultivated land. Müller et al. [8] showed net changes in land use/cover and could only infer the drivers based on presumed relationships among the land use/cover categories. Hence, while previous research may have identified regime shifts, and even the net changes across sites, they did not have the deep dataset required to understand the transitions, and therefore, the drivers of the regime shift. Moreover, quantitative analysis must be supported by a deep understanding of the context of the landscape(s) in question. While village-level participatory mapping is a feasible means to gather historical and contextual information at local scales, it is not so at the scale of thousands of square kilometers. Literature reviews, national-level interviews, and expert opinion must therefore form the basis for interpreting the outputs generated from quantitative analysis. Therefore, a complete and holistic analysis of landscape-level regime shifts should be broad-scale, based on high quality satellite-based land cover data over frequent time intervals with sufficient categorical resolution for transitions and their drivers to be evaluated, and accompanied by in-depth historical/contextual analysis that links land change patterns to the underlying processes driving them.
Here, we identified and investigated a land-cover regime shift across a ~43,300 km2 landscape of southern Myanmar. We focused on regime shift in land cover, as opposed to a land-system regime shift, given the limitations on land use data at various scales (such as land use intensity and land management, which are largely unavailable in Myanmar) that complements the land cover data to fully characterise the entire land system. Our approach, nevertheless, allowed us to describe the macro-level drivers that influenced broad scale changes and patterns of land use and land cover. We accomplished this through the integration of two complementary analytical frameworks to identify, characterise, and explain the presence and drivers of the regime shift. Through these frameworks, we (1) identified the presence of a regime shift over a specific time period; (2) quantified the land cover transitions during the regime shift versus during stable land-cover regimes; and (3) described the preconditions, triggers, and self-reinforcing processes that facilitated the regime shift.

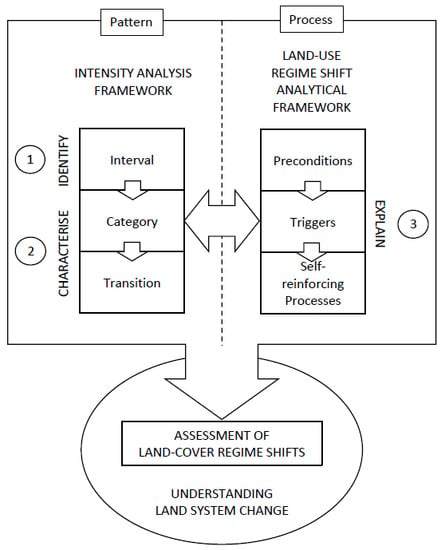
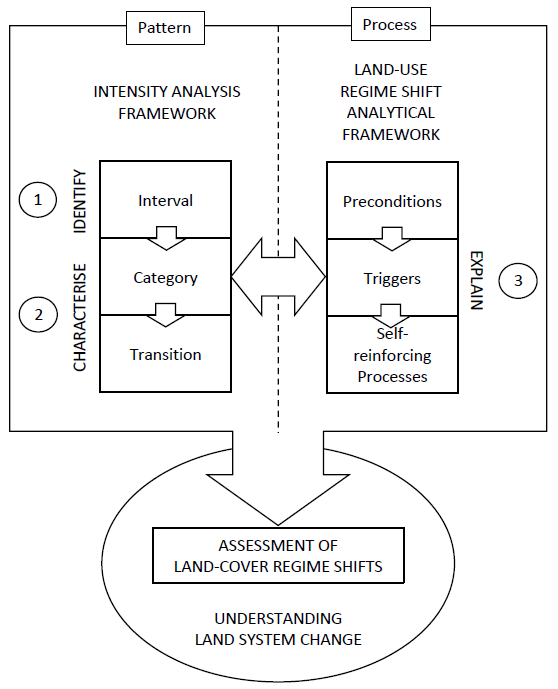
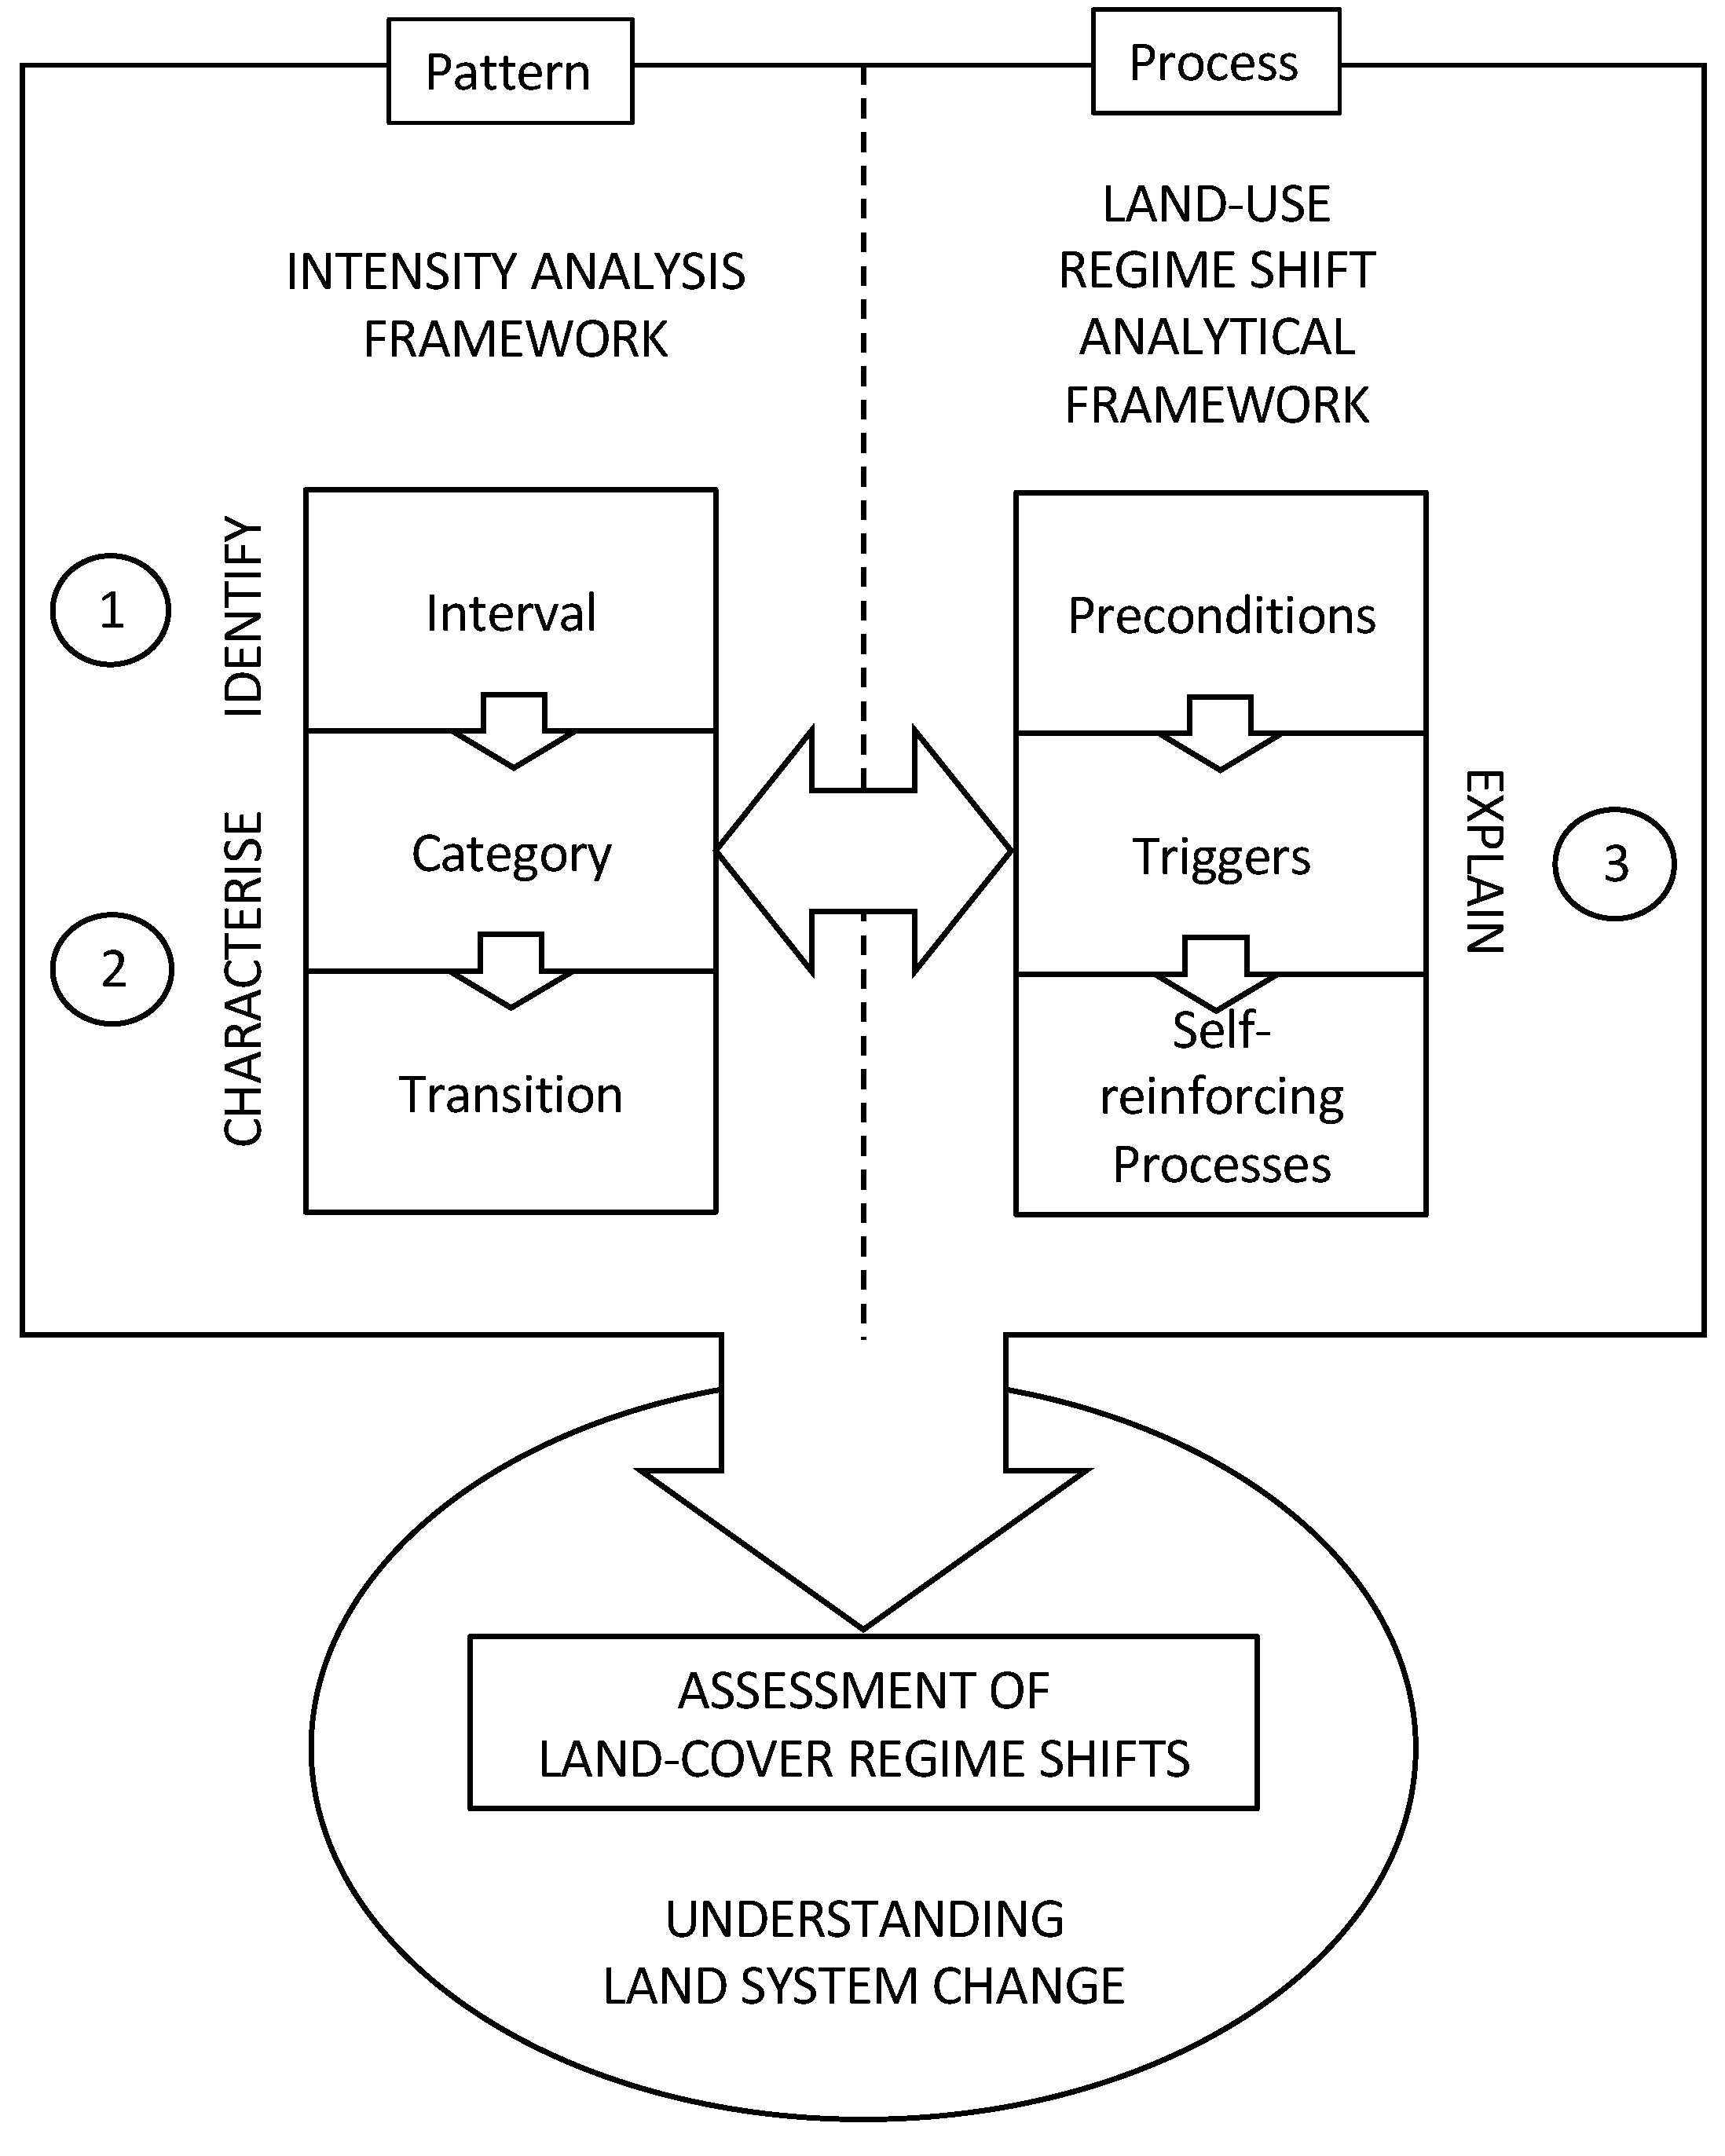
2. Conceptual/Methodological Framework

The methodological flow consisted of three distinct steps: (1) identifying the occurrence of a land-cover regime shift; (2) characterising the dynamics of the land cover transitions; and (3) explaining the causes and drivers that facilitated the land-cover regime shift (Figure 1). We used multiple methods to identify and characterise the patterns and dynamics of the regime shift, all of which relied on a validated quantification of land cover transitions. This included complex time-series analyses of land cover transitions such as Sankey diagramming and Intensity Analysis [20], the latter of which extracted information at multiple levels (see Section 3.3, Data Analysis). We explained the processes driving the regime shift by adopting the land-use regime shift analytical framework from Ramankutty and Coomes [14], which enabled us to develop structured narratives by identifying the role of preconditions, triggers, and self-reinforcing processes governing the regime shift. Through this systematic process, we linked the complementary information generated from the two analytical frameworks to holistically and robustly investigate a land-cover regime shift.

3. Materials and Methods
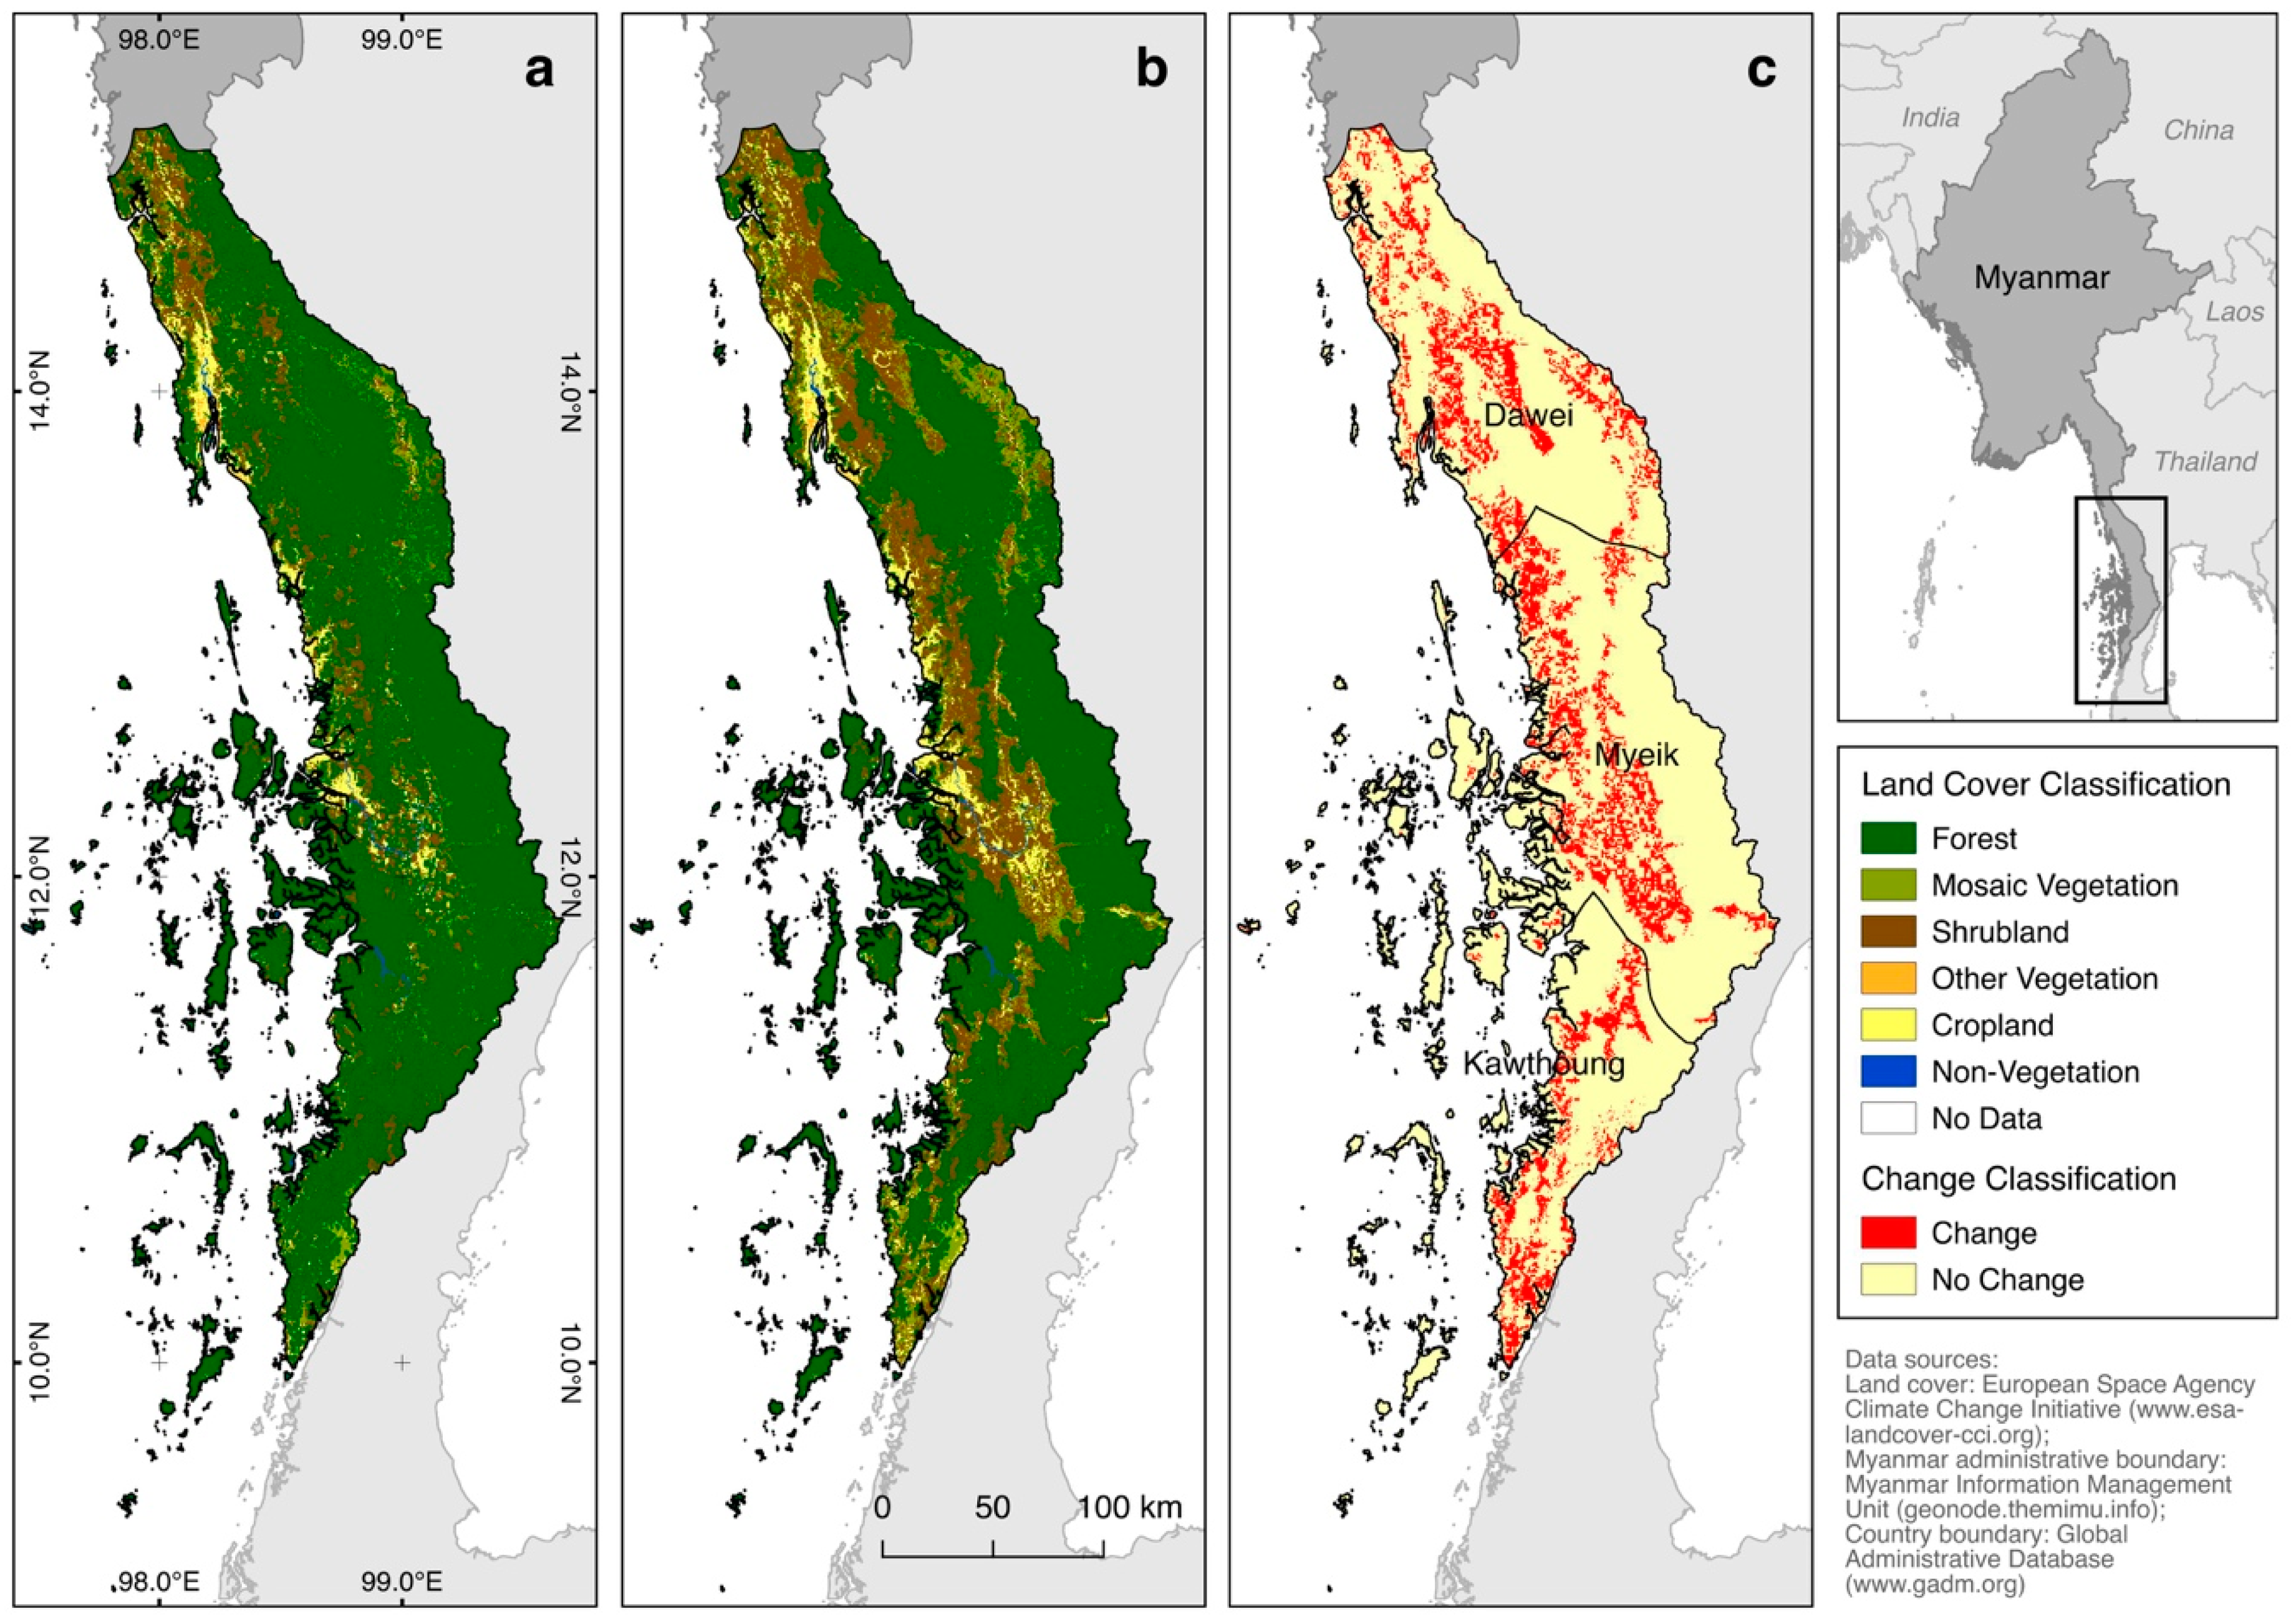
3.1. Study Area

Our study area was the Tanintharyi Region (hereafter “Tanintharyi”) of southern Myanmar (43,345 km2; Figure 2), a landscape situated in the biologically rich transition zone of the Indochinese and Sundaic regions of Southeast Asia. Tanintharyi supports tropical evergreen broadleaf forests, mixed deciduous forests in the north and northeast parts, and mangrove forests in the coastal intertidal zone [21,22]. Various globally important threatened species, such as tiger (Panthera tigris), Sunda pangolin (Manis javanica), Asian elephant (Elephas maximus), and Malayan tapir (Tapirus indicus) inhabit this landscape [23]. Tanintharyi is also an important economic region for trade in natural resources, and specifically, large-scale agricultural businesses promoted as a dual economic development and poverty alleviation strategy under Myanmar’s 30-year Agricultural Master Plan [24,25].
These conditions have, in turn, resulted in Tanintharyi becoming a tropical biodiversity hotspot undergoing extensive forest conversion and land change for agricultural plantation development [26]. A complex array of pressures to convert its biologically diverse forests [27] is expected to intensify over at least the next decade [28,29,30], as Myanmar transitions towards a more democratic and capitalist economy. Evidence indicates extensive conversion of forests to agricultural plantations (oil palm, rubber) occurred in Tanintharyi between 1990 to 2015 [31,32,33]. Those previous studies, however, only quantified land cover changes between two time-points with available 30-m spatial resolution satellite data (1990–2000 for Leimgruber et al. [33]; 2002–2014 for Bhagwat et al. [31]; 1995–2015 for De Alban et al. [32]), leaving the characterisation of land cover dynamics with better temporal frequencies largely uninvestigated within these periods.

3.2. Data Preparation

The main spatial data source for this investigation was the 24-year annual time-series global land cover product (1992–2015) developed by the European Space Agency Climate Change Initiative (ESA CCI; [34]). These globally consistent land cover maps, delivered at 300-m spatial resolution, were interpreted from a suite of satellite data acquired by various sensors (i.e., MERIS, SPOT-VGT, AVHRR, PROBA-V) using the standardised hierarchical Land Cover Classification System developed by the Food and Agriculture Organisation of the United Nations [35]. We used these land cover maps to quantify annual land cover transitions as a follow-up to a previous study that evaluated land cover change across two time-points between 1995 and 2015 [32], with the initial intention of (1) quantifying annual dynamics of land cover transitions, and (2) generating input data for a predictive land cover change model. However, after discovering a land-cover regime shift (see Section 4, Results), the objectives of this study shifted towards the investigation of landscape-level land-cover regime shifts.
To prepare the time-series land cover maps for analysis, we developed a script using Google Earth Engine [36,37] (see Supplementary Materials). We defined the geographic areas of interest, particularly Tanintharyi (and its districts Dawei, Myeik, and Kawthoung), using the Global Administrative Database [38]. We aggregated the 23 detailed land cover categories present in Tanintharyi into six broad classes, namely, Forest, Mosaic Vegetation, Shrubland, Cropland, Other Vegetation, and Non-Vegetation (Table 1; see Supplementary Materials), to show broad patterns for analysing land cover transitions, and to keep the analysis from becoming unwieldy due to too much detail. After reclassification, we then masked out the pixels outside each specific area of interest (e.g., whole region, each district) prior to exporting the land cover maps for further data processing.

3.3. Data Analysis

We generated stacked area plots, Sankey diagrams, and conducted Intensity Analysis [20] to identify and characterise the patterns and dynamics of the land-cover regime shift. Thereafter, we used the land-use regime shift analytical framework [14] to explain the processes driving the regime shift.
We calculated the area of each land cover category per year using the Semi-Automatic Classification Plugin in QGIS v.2.18 [39,40], and used the calculated outputs to generate stacked area plots using R v.3.4 [41,42]. The plots tracked the proportion of total map area comprising each land cover category over the 24-year period (cf. land-use transitions in [8,15]). We then generated transition (or cross-tabulation) matrices by calculating the annual area of change for all land cover transitions in QGIS.
We then used the transition matrices (see Supplementary Materials) to conduct Intensity Analysis, a quantitative method to analyse land cover change over time for an area of interest to summarise the change within time intervals whilst allowing the user to determine whether the changes observed in the maps are due to real transitions or map errors [20,43]. We conducted Intensity Analysis (hereafter “IA”) using a Microsoft Excel Macro developed by Aldwaik and Pontius [20,44]. We extracted information at three levels of analysis: interval, category, and transition, progressing from general analysis to more detailed, respectively. For the identification step, we conducted an interval-level IA, in which we calculated the total landscape change (percentage of all map pixels changing category) for each time interval, from which we identified time intervals with either faster or slower rates of change than the interval-level uniform intensity. We then examined how the overall annual rates of change varied across time intervals to determine whether a regime shift occurred. We defined a regime shift as the period during which the overall annual rate of landscape change exceeded the uniform intensity for the entire interval range.
Next, we characterised the land cover transitions during the regime shift and the (stable) land-cover regimes. We used output transition matrices to produce Sankey diagrams, which illustrated the flows and patterns of gross land cover transitions in three time periods: pre-regime shift, during the regime shift, and post-regime shift. We generated the Sankey diagrams using an online generator developed by Csala [45]. Additionally, category-level IA quantified the size (area) and intensity (proportion of all transitioning pixels) of gross losses and gross gains for each land cover category per interval, from which we identified active or dormant land cover categories, defined as being greater than or less than, respectively, the category-level uniform intensity. For example, for each category, a loss intensity above the uniform represents a gross loss higher than the average change observed across all categories in an interval, meaning that such categories are “actively” losing for that interval. Conversely, a loss intensity below the uniform represents a gross loss lower than the average change observed across all categories in an interval, meaning that these categories are “dormantly” losing in that interval. This concept of active and dormant categories is similarly applied to the gross gains, providing information on whether a category is actively or dormantly gaining. Therefore, at the category-level IA, land cover categories can be characterised into four trends: (1) active losers—active gainers (AL/AG), which describes categories experiencing active losses and gains; (2) active losers—dormant gainers (AL/DG), which describes categories experiencing active losses yet dormant gains; (3) dormant losers—active gainers (DL/AG), which describes categories experiencing dormant losses yet active gains; and (4) dormant losers—dormant gainers (DL/DG), which describes categories experiencing dormant losses and gains.
Category-level IA revealed that forest actively lost area over the period of the regime shift (see Section 4, Results). We therefore conducted a transition-level IA to quantify the size, intensity, and specific destination land cover categories for forest losses during each interval. From these transitions, we determined systematic transitions based on (1) reciprocity, defined as whether the loss from category A and the gain to category B matched, and (2) an evaluation of hypothesised commission and omission errors. “Systematic transitions” were those that deviated from a hypothesised transition-level uniform intensity [20,46,47]. As an example, if losses from category A were intensively targeted by category B, and the gains of category B intensively targeted category A, then we would conclude that there was a systematic transition from A to B [43,46]. We applied this concept to forest losses (i.e., deforestation) to determine whether forest was systematically transitioning into another land cover category. This was a critical component in identifying systematic land cover transitions, and by extension the drivers, of forest conversion. We visualised IA outputs using the tidyverse package in R [48].
We adopted Ramankutty and Coomes’ [14] analytical framework for understanding land-use regime shifts to develop a structured complementary narrative that identified and explained the preconditions, triggers, and self-reinforcing processes governing the regime shift. Preconditions are defined as the necessary conditions that set the stage for a regime shift to occur. Triggers are specific events that are the immediate cause of the regime shift. Self-reinforcing processes maintain the new land-cover regime in a stable state, resisting a shift back to the previous regime. To develop the narrative, we identified relevant key events taken from the literature as either preconditions, triggers, or self-reinforcing processes based on the timing and relationships of the events. In addition to literature review, the narrative was informed by the first-hand extensive research and observational expertise of the authors (especially KMW) with land issues in Tanintharyi. Narrative perspective is appropriate for understanding regime shifts, and land-system change in general, since it adopts long time horizons, focuses on critical events and abrupt transitions, and seeks depth of understanding through historical detail and interpretation to tell the story of land change for a particular area [49]. Narrative storylines also form the basis of scenarios that are designed for developing projections of future land changes [50]. We summarised the narrative by constructing a ball-and-valley diagram adopted from Müller et al. [8] using Sketch v.51.2 [51].
We subsequently conducted a land cover assessment through visual interpretation of available high-resolution satellite imagery between 2000–2017 using 150 random sample points for each of the major forest transitions (see Supplementary Materials) to validate the connection between the land cover change results and the proximate causes of deforestation identified in the narratives (see Section 4.2 and Section 4.3). We used the Open Foris Collect Earth [52], an integrated tool that enables systematic land cover data collection through augmented visual interpretation of historical time-series high-resolution satellite imagery.

4. Results

4.1. Identifying the Occurrence of the Land-Cover Regime Shift

Examination of the stacked area plots revealed that land cover change between 1992–2015 in Tanintharyi consisted of two periods of relatively low rates of land cover change (1992–1997, 2004–2015), which bookended a period of drastic change (1997–2004) characterised by a relatively rapid decrease in Forest (76.58% to 60.20%) coupled with large increases in Shrubland (12.51% to 23.06%) and Mosaic Vegetation (4.94% to 9.16%) (Figure 3). Interval-level IA confirmed that the fastest annual rates of landscape change occurred between 1997–2004 (1.18% to 3.25%, notwithstanding the aberrant 2002–2003 interval at 0.37%), which were more than twice the uniform intensity over the 24-year period in Tanintharyi, compared to the slower rates of change that occurred during the 1992–1997 and 2004–2015 intervals that were below the uniform intensity (Figure 4). These characteristics confirmed the occurrence of a land-cover regime shift during the 1997–2004 period. Similarly, the highest annual rates of change occurred between 1997–2004 across the three Tanintharyi districts, albeit with varying intensities and minor differences specific to some districts (see Supplementary Materials). The annual rates of change in each district ranged from 1.60% to 4.57% for Dawei (except 2002–2003 at 0.20%); 1.27% to 2.83% for Myeik (except 2002–2003 at 0.21%); and 0.97% to 3.58% for Kawthoung (except 1998–1999 at 0.31%). In summary, both a broader analysis of net changes (stacked area plots) and a detailed analysis of total landscape change (interval-level IA) revealed the existence of a land-cover regime shift in Tanintharyi.

4.2. Characterising the Dynamics of the Land-Cover Regime Shift

Sankey diagramming of land cover transitions revealed that during the regime shift (1997–2004), Forest was primarily converted into Shrubland (4216 km2; 9.90%) and Mosaic Vegetation (1424 km2; 3.34%), and to a lesser extent Cropland (330 km2; 0.78%) (Figure 5). Indeed, transitions between different land cover categories occurred during the “quiescent” periods of 1992–1997 and 2004–2015, but the changes were not as extensive as those observed during the regime shift.
The narratives, as seen in the next section (see Section 4.3, Results), showed that the regime shift resulted in rapid and extensive deforestation from 1997–2004, from a predominantly Forest landscape to Shrubland, Mosaic Vegetation, and Cropland. The land cover assessment using visual interpretation of high-resolution imagery showed that the three major transitions from Forest to Shrubland, Forest to Mosaic Vegetation, and Forest to Cropland during the regime shift were predominantly conversion of forest to oil palm and rubber plantations, mixed vegetation, and rice paddies, and then to a smaller extent to logged/cleared areas and bare ground. The approximate land cover composition (based on the % of assessed random samples) of each of the forest transitions are elaborated as follows. First, samples that indicated a transition from Forest to Mosaic Vegetation consisted of mixed vegetation (41%), plantations (33%), rice paddy (10%), and forest (10%) with the remaining identified as logged areas, built-up area, or bare ground (6%). Second, the samples that indicated a transition from Forest to Shrubland consisted of plantations (43%), mixed vegetation (33%), and forest (20%) with the remaining identified as rice paddy, logged areas, or bare ground (4%). Third, the samples that indicated a transition from Forest to Cropland consisted of plantations (49%), rice paddy (24%), mixed vegetation (17%), and forest (4%) with the remaining identified as logged areas, bare ground, or built-up area (6%). Hence, the result of the visual assessment of land cover helped to establish the connection between the land cover change results and the proximate causes of deforestation identified in the narratives.
Category-level IA revealed the four trends of gross losses and gross gains among land cover categories in Tanintharyi, namely, (1) active loser—active gainer; (2) active loser—dormant gainer; (3) dormant loser—active gainer; and (4) dormant loser—dormant gainer. Characterisation of these trends corresponded to the three periods identified in the interval-level IA, namely, 1992–1997, 1997–2004, and 2004–2015. During the regime shift, Forest was consistently an active loser—dormant gainer whereas Mosaic Vegetation and Shrubland were consistently dormant losers—active gainers at both the regional and district levels. Cropland was also a dormant loser—active gainer, consistently in Kawthoung, and across some intervals in Myeik and the entire Tanintharyi Region. Outside the regime shift, trends varied across intervals at both the regional and district levels. Forest was an active loser—dormant gainer in general (with the exception of some intervals) at both the regional and district levels. Categories that were dormant losers—active gainers were Mosaic Vegetation across most intervals in Tanintharyi and its three districts; followed by Shrubland, Cropland, and Other Vegetation (only intermittently) at varying intervals at both the regional and district levels. Other Vegetation and Non-Vegetation were dormant losers—dormant gainers across most intervals during and outside the regime shift at both the regional and district levels. Finally, active loser—active gainer categories, the dynamic trend that indicates swapping or almost equivalent gross losses and gross gains in an interval [47], was the least observed trend in the region, mostly observed in Kawthoung and Myeik, and consisting of Shrubland, Mosaic Vegetation, Cropland, and Other Vegetation (Figure 6; see Supplementary Materials).
Transition-level IA determined the systematic transitions from Forest to other categories, which were the actively losing and gaining categories, respectively, as identified in the category-level IA (see Supplementary Materials). Characterisation of the systematic transitions corresponded to the three periods identified in the interval-level IA, namely 1992–1997, 1997–2004, and 2004–2015. Of the 115 transitions from Forest to other categories, 33 transitions were truly systematic (Table 2). For example, in 1995–1996, Forest loss was intensively targeted by Mosaic Vegetation, and the gain of Mosaic Vegetation intensively targeted Forest, hence this transition was systematic. We concluded that the conversion from Forest to Mosaic Vegetation in 1995–1996 was truly systematic after both testing for reciprocity and comparing the hypothesised commission errors involved in this transition. In summary, five systematic transitions were determined prior to the regime shift, of which three categories systematically targeted Forest, and one category systematically avoided Forest. Seven systematic transitions were determined during the land-cover regime shift, of which two categories systematically targeted Forest, and three categories systematically avoided Forest. After the regime shift, 21 systematic transitions were determined, of which two categories systematically targeted Forest, two categories systematically avoided Forest, and one category either targeted or avoided Forest in different intervals.

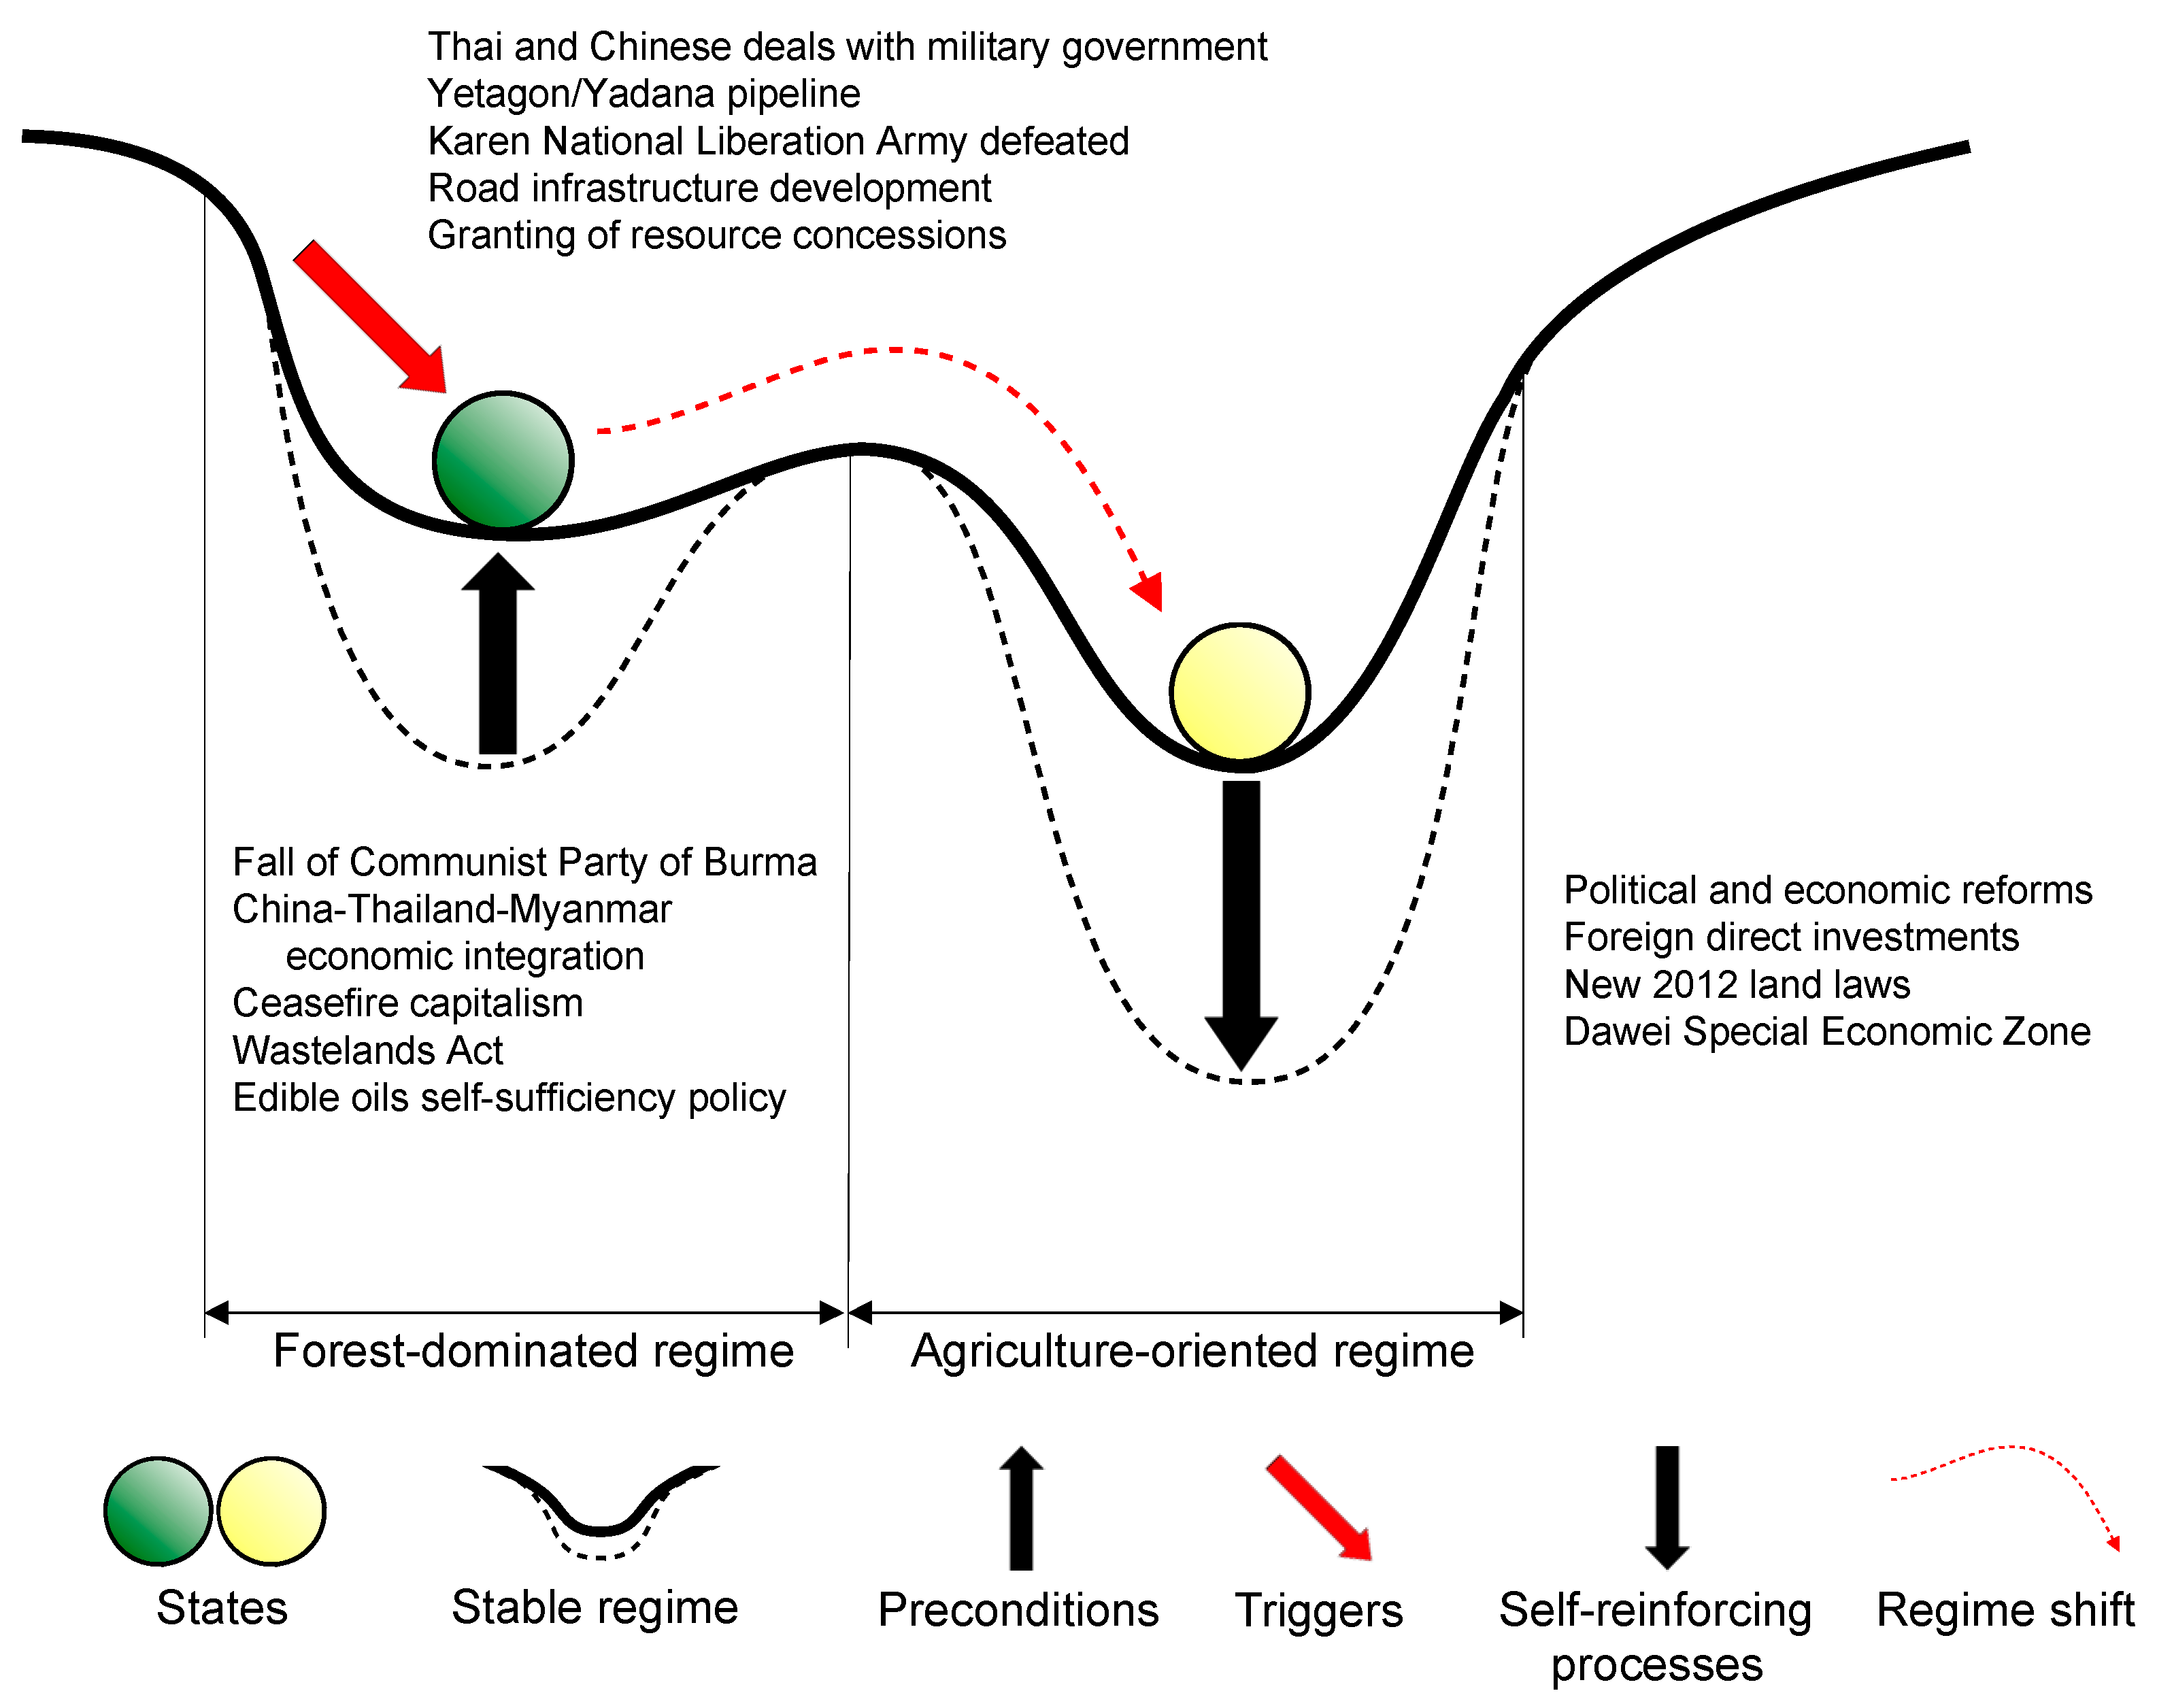
4.3. Explaining the Preconditions, Triggers, and Self-Reinforcing Processes of the Land-Cover Regime Shift

The analysis of the land-cover regime shift (Figure 7; see Supplementary Materials for timeline of key events) focuses on the landscape level (Tanintharyi Region) where the literature made sufficient references to country/region/state dynamics while references to district levels were largely unavailable.

4.3.1. Preconditions

The transformed political landscape of Myanmar in the 1990s after the end of the Cold War and socialism led to corresponding economic reforms that set the stage for a land-cover regime shift in Tanintharyi. The disintegration of the Communist Party of Burma in 1989 brought a series of ceasefire deals with ethno-nationalist armed organisations along the northern border with China [53,54]. As a result, Myanmar’s Union Armed Forces, the Tatmadaw, dedicated more troops along the southeast border with Thailand [55] where the Karen National Union (KNU) and their armed wing the Karen National Liberation Army (KNLA) continued their armed political struggle against the military government despite the ceasefire agreements in the north. The KNU, as the country’s longest-standing rebel group who took up arms in the early 1950s in response to ethnic-based exclusions from the post-colonial state, controlled much of southeastern Myanmar’s borderland forests. KNU and KNLA authorities governed over Karen (Kayin) villages in Karen State, extending to the southern Tanintharyi Region along the Thai border (in addition to other regions where Karen populations resided). During the Cold War, the KNU was viewed by governments in Thailand and the United States as a buffer against possible incursions from the Burmese communists or the Burmese military [56]. The KNU’s refusal to join a ceasefire against the Tatmadaw after the end of the Cold War sparked a series of military offensives against KNLA hotspot posts, eventually leading to the overthrow of their rebel capital, Manerplaw on the Thai border in 1995 [55]. Throughout the 1990s the KNU and its KNLA battalions grew weaker with more tenuous control over its Karen territory. Morale suffered and corruption rose among KNU leaders as a result, especially in the KNU 4th Brigade in Tanintharyi.
Coincidentally, regional state governments in China, Myanmar, and Thailand worked to enhance economic integration across borders. For example, the Yunnan government in China saw the Wa and Kokang rebel groups of Myanmar as useful borderland agents to advance China’s business and security interests in the region [57,58]. However, as business relations among the national governments warmed, China and Thailand’s diplomacy found the rebel groups along Myanmar’s borderlands, from southern Tanintharyi Region to Kachin State, less useful to their political and security interests than in decades past [59,60]. Meanwhile, Myanmar’s military government responded to burgeoning street protests in Yangon and other cities calling for better economic conditions and democracy by reforming their impoverished socialist economy and selectively privatising a few lucrative economic sectors, in particular logging and mining. As a result, a nascent military-backed crony capitalist class was formed. The conditions for “ceasefire capitalism” had thereby solidified in Myanmar’s resource-rich borderlands [61], and this, along with Thailand’s “battlefields to marketplaces” [62] and China’s “Beijing Consensus” [63], came to define Myanmar’s eastern borderlands in the 1990s and into the 2000s, setting the preconditions for a land-cover regime shift by the turn of the century.

4.3.2. Triggers

The preconditions established in the 1990s—in particular policies of turning battlefields into marketplaces—set the stage for a series of events that triggered the land-cover regime shift in Tanintharyi. The importance of China and Thailand as Myanmar’s trading partners increased when the United States and European Union imposed economic sanctions on Myanmar in response to the human rights abuses of the military government [64,65]. Immediately after Myanmar’s military signed a series of bilateral resource trade and infrastructure deals with China in 1988, the Commander in Chief of the Thai Armed Forces became the first foreign dignitary to visit Myanmar since the military gunned down hundreds of pro-democracy student activists earlier that same year (the 8888 Uprisings). The meeting resulted in 35 Thai companies receiving 47 logging concessions in border areas claimed by Karen villagers and the KNU [66]. Within a few months of signing the logging deals, the Thai government passed a domestic logging ban (ostensibly in response to landslides caused by logging and flooding) that furthered Thai logging interests with its neighbors [67], resulting in an explosion of demand for logs from Myanmar [66], and facilitating deals by KNU leaders, Thai businessmen and state officials, and Burmese commanders and government officials for timber from KNU-controlled territory along the Thai border. The logging business further weakened KNU security by increasing opportunities for corruption, which facilitated yet more resource deals. The Tatmadaw also used the logging roads to move troops closer towards the Thai border, setting up military units in these borderlands for the first time.
Timber was not the only resource extracted by Thai companies in Tanintharyi, however. In the early 1990s, a consortium of foreign oil companies signed a deal with the Burmese military to allow an oil/gas pipeline to run overland across the northern portion of Tanintharyi to Thailand. To prepare for construction and the security of what became the Yetagon/Yadana pipeline, the Tatmadaw led a military offensive against the KNU who had territorial control over some of the pipeline area [68,69], forcibly displacing villagers from a wide swath around the pipeline route. International civil society groups pressured the oil/gas consortium to establish the Tanintharyi Nature Reserve in the forests that immediately bordered the pipeline to the southeast [70]. In fact, the creation of the park curtailed local forest use and customary management practices of the Karen, while also adding a further security buffer between the pipeline and Karen villagers and KNU members.
At the height of the logging boom along the Thai borderlands in the 1990s, and as the military was negotiating with the KNU to sign a ceasefire, the Tatmadaw initiated a large military offensive in the northern stretches of the KNU 4th Brigade. The Tatmadaw pushed down from the pipeline area where they had secured their first territorial inroads into the region, forcing KNLA troops to the Thai border. Karen villagers fled into forests as internally displaced persons and across the Thai border as refugees. Remaining Karen villagers resettled (some forced, some voluntarily) into “model villages” along the government-controlled Union Road that ran north-south along the western edge of Tanintharyi.
As a result of the ceasefire agreements between 1989–1995, direct warfare was replaced with “ceasefire capitalism” whereby land concessions were strategically allocated in previously contested areas to extract rent and make the territory legible to the state, leading to deforestation and the displacement of local communities [61]. The military setbacks that greatly weakened the KNU during the mid-1990s led to a contraction of area under their control, thus reducing their revenue from the cross-border trade, and the displacement of thousands of Karen people along the border with Thailand [71]. Hence, after agreeing to ceasefires, the increase in Tatmadaw-controlled areas enabled greater infrastructure development (e.g., roads) and led to an increase in logging concessions awarded during the early part of the land-cover regime shift, particularly along the Thailand-Myanmar border [67,72]. The timber sector became a lucrative area for informal foreign investment, for example, for Thai logging companies that received concessions from both the military government and ethnic armed groups in ethnic regions along the Thai border (Karen, Kayah, and Shan States, and the Tanintharyi Region) where the most intensive logging had occurred [73,74].
At the turn of the century, the military encouraged domestic companies to help industrialise the agricultural sector, which aligned with its experimentation of crony capitalism [75]. By 1999, Myanmar’s military government launched the first oil palm development programme, with the top military leader proclaiming Tanintharyi as the future “edible oil palm big pot of the nation”. By the time the second oil palm development programme concluded in 2013, the government claimed that a total of nearly 360,000 acres (~1457 km2) had been planted out of the 1.9 M acres (~7689 km2) awarded [76]. The 1.9 M acres of oil palm concessions represented nearly 20% of the total land area of Tanintharyi, making it the highest concentration of land allocated for the purpose of agribusiness in the country, and representing more than one-third of the total area of Myanmar’s agribusiness estates. While the Tatmadaw’s most significant military offensives occurred in the north of Tanintharyi, oil palm concessions were allocated primarily in the southern and eastern areas [76].
Oil palm concessions were allocated mostly throughout the 2000s in forested areas of Tanintharyi that had little previous state military presence, as they were located within forest reserves demarcated by the state or the KNU (which has its own forest department). The forests provided cover for KNLA soldiers still engaged in guerrilla fighting. In some cases, the oil palm concessionaires, especially those crony companies that also operated logging company subsidiaries, cleared forests inside their oil palm concessions, although usually they never substantially planted oil palm [77]. In addition to “conversion timber” coming off oil palm estates, the military government also allocated numerous logging concessions in forest reserves to the same cronies who received oil palm concessions. The official annual log volume quota for Tanintharyi was 30,000 cubic tons, one of the highest for any state or region in the country [76]. In addition to oil palm, regional businessmen expanded tens of thousands of acres of rubber plantations into northern Tanintharyi from the mid-2000s, oftentimes backed by the Tatmadaw or the Mon rebel group [78].
The process of reallocating land from individual smallholders to crony companies was legally enabled by the passage of the 1991 Wastelands Act, which allowed land to be reallocated for the production of agricultural commodities for domestic self-sufficiency or foreign exchange earnings [76]. Together with the edible oils self-sufficiency policy, these policies enabled the development of oil palm concessions that led to widespread deforestation and internal displacement with a 900% increase in planted area between 2000–2010 [76], coinciding with the latter part of the land-cover regime shift. For example, the Yuzana company owned by Htay Myint, a well-connected crony, was awarded an oil palm concession in the Pachan reserve forest (Yuzana 1 plantation), while Karen villagers near Lenya were evicted from the Yuzana 2 plantation [79].

4.3.3. Self-Reinforcing Processes

Throughout the early to mid-2000s, the triggering events that created a new agricultural production-oriented regime began to stabilize, which continued to be reinforced by the industrial agricultural system, village roadside settlements, state militarised perimeters, infrastructure development, and migrant agricultural labor migrations. By the 2000s, many Karen villages located in KNU territories had been forcibly emptied. For the larger oil palm concessions in operation, companies had built roads into these areas for the first time. Migrant laborers arrived to work the plantations, living in company villages inside the concession boundaries. Other landless migrants arrived to this opened land frontier in search of new opportunities.
In 2011, Myanmar underwent another significant political transition with a quasi-democratically elected government put in place [30]. The new government administration quickly passed a series of policies and laws that sought to open their state economy to foreign investors, particularly in agribusiness and natural resources. Tanintharyi, in particular, received ample attention from foreign investors, especially neighboring Thailand, for its strategic ocean access and trade routes to Thailand. The economic interests of large-scale agricultural businesses were entrenched, at the expense of smallholders, by the Farmland Law and the Vacant, Fallow, and Virgin Land Management Law in 2012 [73,80]. The latter, in particular, allowed areas of up to 50,000 acres (~202 km2) outside the Permanent Forest Estate, including forested land and land occupied by farmers unable to get formal tenure recognition, to be leased for agricultural concessions for 30 years [76]. The new 2012 land laws also legally supported the previous allocation of the oil palm concessions to private companies, allowing the concessionaires in most cases to retain concession rights. Foreign investors interested in palm oil processing (and rubber latex) started to make deals with the government and local companies in Tanintharyi. Regional governments (Thailand, China, Japan) drew up plans for the Dawei Special Economic Zone, which would be Southeast Asia’s largest if fully developed [81].
In addition to these various development initiatives since 2010 that helped to self-reinforce Tanintharyi’s new agriculture-oriented regime, thereby preventing deforested areas from reverting back to forests, renewed international conservation efforts in Tanintharyi are working to maintain existing forest cover [79]. International support to the government’s and KNU’s forest departments hopes to achieve better conservation outcomes for Tanintharyi’s state and rebel forest reserves, with at least one to be upgraded to a national park. Forest-based communities in areas targeted by international conservation efforts will come under increasing scrutiny with the need to better conform to more forest-friendly management practices. These conservation efforts, matched by other global environmental mechanisms (REDD+, FLEGT), will additionally self-reinforce the agriculture-oriented regime currently in place.

5. Discussion

Our study is the first to identify a regional-scale land-cover regime shift, which could indicate that a regime shift in the overall land system may be occurring at a previously unrecognised scale. Previous documentation of land-system regime shifts have been local in scale (e.g., community-level for Müller et al. [8]; 14–72 km2 for Zaehringer et al. [15]; and 6,348 km2 for Trincsi [82]). Our study demonstrates that identification of a landscape-level land-cover regime shift highlights areas of particular interest: where land cover change was most rapid, corresponding changes in the land use patterns at various spatial and temporal scales have most likely occurred, thereby indicating where investigations into the preconditions, triggers, and self-reinforcing processes of the potential regime shift in the land system should be done.

5.1. Systematic Investigation of Land-Cover Regime Shifts using Complementary Analytical Frameworks

We investigated the complex dynamics of land-cover regime shifts through a novel integration of complementary analytical frameworks. Through the spatially-explicit quantitative Intensity Analysis framework [20], we identified the temporal occurrence of a land-cover regime shift in the Tanintharyi Region, Myanmar, and further characterised its land cover transitions. Analysis of land change intensities at the interval, category, and transition levels quantified the spatial and temporal extent of the regime shift, which we then contextualised through a structured narrative of the explanatory preconditions, triggers, and self-reinforcing processes driving it [14]. The two analytical frameworks we integrated had previously never been applied together to study land-cover regime shifts, which remain a poorly understood phenomenon of land change globally. While the analytical framework developed by Ramankutty and Coomes [14] was designed to direct the attention of scientists and researchers to the study of the processes governing land-use regime shifts, the Intensity Analysis framework developed by Aldwaik and Pontius [20] has been applied in the study of the patterns of land cover change, which then guides the articulation of the processes driving these changes to gain insights on the dynamics of land change. Our study, therefore, provides the first example that integrates these two complementary frameworks, applied to the investigation of land-cover regime shifts through a systematic process. As a result, the spatially explicit, mixed-methods approach we present here represents a benchmark for future studies investigating regime shifts, and also presents an opportunity to accelerate our knowledge of regime shifts in other geographic areas through the application of the approach.
Moreover, the approach is scalable for the same study area of interest, thereby permitting analyses at multiple spatial domains or scales. Previous studies have identified the occurrence of regime shifts at the village level [8] or the national level [14], but no study has ever been multi-scale over the same study area of interest. Here, we showed that the occurrence of the regime shift was detected at both the regional (Tanintharyi) and district (i.e., Dawei, Myeik, Kawthoung) levels. Moreover, these results provide empirical evidence that land-cover regime shifts occur at multiple spatial scales. Although we did not carry out an analysis at the township or village levels, evidence of the regime shift in two villages in Dawei District has been documented [15], further confirming the scale independence in the detection of regime shifts [14]. Our analysis also showed that while there were similar broad land change dynamics at the regional and district levels, nuanced and spatially heterogenous land cover transitions were also detected between the three Tanintharyi districts; thereby highlighting areas that could be the subject of more detailed investigation at local levels.

5.2. Resolution is Crucial but Is a Double-Edged Sword

Sufficient resolution in two aspects is critical when investigating the dynamics of land-cover regime shifts. First is temporal resolution; specifically, land cover maps need to be available at a frequency that will allow the identification of the regime shift (see also [15]). The present study emerged from a previous analysis of land cover change in the Tanintharyi Region [32], which used two time-points (i.e., 1995 and 2015); as a result, the regime shift remained undetected due to the low temporal resolution. It was only when an annual analysis of land cover change was conducted on the ESA CCI data that the regime shift became detectable. It is therefore plausible that other studies on land cover change, in particular, deforestation, which use low temporal resolution (i.e., large time intervals) did not detect important high-resolution dynamics such as regime shifts. Indeed, the dearth of annual land cover datasets (or the capacity to develop annual datasets efficiently) has constrained the temporal resolution of previous studies. The availability of annual land cover datasets offers new opportunities to discover previously unrecognised regime shifts.
Second, the analysis of land-cover regime shifts requires sufficient resolution of land cover categories that will permit the characterisation of land cover transitions (and therefore the drivers). Although a global forest change dataset (e.g., [83]) may be used to identify regime shifts in forest cover from 2000 onwards given its annual temporal resolution, and may have finer scale detection of regime shifts than our study (30-m versus 300-m pixel size, respectively), a binary forest/non-forest classification does not permit the characterisation of land cover transitions compared to the characterisation that is possible with a land cover product containing detailed land cover categories. Low land-cover class resolution studies remain severely constrained in terms of both determining systematic land cover transitions and the drivers of a regime shift.
Despite the more sophisticated land cover analysis possible with greater land cover category resolution, our dataset exhibited constraints that required additional analysis. In this study, in order to identify timber extraction by logging concessions and the expansion of agro-industrial plantations (primarily oil palm and rubber) as proximate causes of deforestation during the early and latter stages of the 1997–2004 regime shift, a subsequent visual land cover assessment was required to further differentiate sub-classes of Mosaic Vegetation, Shrubland, and Cropland. Thus, the current ESA CCI global land cover map product is constrained in detecting very specific land cover (such as oil palm and rubber, in our case) given that its spatial, spectral, and temporal resolution necessitates the broad generalisation of land cover categories applicable across the globe. Future land cover map products with high spatial, temporal, and categorical resolutions will enable more efficient discovery and interpretation of land-cover regime shifts, and will greatly facilitate improved land change research.
Previous research on land-system regime shifts used long historical timelines (e.g., [8,14,84]). Time-series spatial data derived from remote sensing are limited historically, so our research, in reality, is limited to recent land-cover regime shifts, and potentially future ones as data become available. In fact, time-series land cover data have only become available very recently (e.g., the 24-year ESA CCI 24-year annual land cover product was released to the public in April 2017; [34]), hence, potentially opening the opportunity to revisit well-known cases of land change, and investigate the prevalence and significance of regime shifts in global land change [14].
High resolution data allowed us to very precisely identify and characterise the land-cover regime shift and its dynamics. However, the systematic transitions were challenging to link with the processes driving them simply because these transitions varied from year to year, making their interpretation difficult. It is possible that systematic transitions in other regions of the world may be more consistent, at which point the drivers of forest loss, for example, would be more consistent as well. In our case, the variability of systematic transitions showed us that forest transitioned into a range of land cover categories that varied over time. We recognise that attempting to explain annual processes with a narrative is infeasible due to varying systematic transitions year on year, which is even further constrained by the limited literature available at sub-regional to local levels. While we used a narrative perspective in this study, participatory approaches carried out at the local scales (e.g., village, household) such as those employed in other studies on land-system regime shifts [8,15,82] provide an agent-based perspective that is focused on understanding how the agency of actors involved in and excluded from land use decision-making shapes both short- and long-term land-system transformations [85]. The integration of perspectives is therefore essential in understanding land-system change since each perspective deals with specific organisational levels and temporal scales of coupled human-environment systems [49]. Hence, for example, combining these perspectives could provide information to relate probable causes for the exceptionally slower rate of change during the 2002–2003 interval within the regime shift, which could not be explained with an extensive review of the literature. Complementing the quantitative landscape-scale approach we presented in this study with qualitative local level methods can lend to an integration of these different perspectives that allows us to maximise the detailed information afforded by high resolution.

5.3. Historical and Possible Future Drivers of Land-Cover Regime Shifts in Tanintharyi

Our systematic approach for investigating a land-cover regime shift through the integration of complementary analytical frameworks afforded a deeper appreciation of the underlying processes that determined the patterns of land change in Tanintharyi. Previous studies that have detected land-system regime shifts were constrained since the land use transition curves only showed net changes, and hence failed to reveal the total gross landscape change and gross inter-category transitions constituting the most systematic landscape changes, and may likely have underappreciated the complex underlying processes driving the changes. In contrast, our systematic approach enabled the linkage of patterns to processes: we detected the principal signals of the land-cover regime shift in Tanintharyi, where forest transitioned into different land cover categories that varied over time, by first identifying the spatial and temporal extent of the regime shift, and then characterising the gross inter-category transitions, which then finally directed our focus to the possible underlying drivers that explained the regime shift. As land change is spatially and temporally heterogeneous, driven by dynamic forces and their interactions that arise from specific environmental, social, economic, political, and historical contexts [86,87], our approach therefore allowed us to understand the dynamics of feedback mechanisms that linked the patterns of land cover change with the processes of land use change.
Müller et al. [8] identified two distinct pathways that can induce land-system regime shifts (but may also be a combination of both): a “tipping point” pathway wherein subtle perturbations from underlying drivers accrue and eventually tip over a critical threshold that then results in a systemic shift to a new land-system regime; or a “punctuation” pathway wherein influential external events punctuate the period of equilibrium of an existing land-system regime that then results in a drastic change to a new stable land-system regime. In Tanintharyi, our results showed that the land-cover regime shift was induced by a punctuation pathway wherein the equilibrium was punctuated by decisive political events—armed conflict ceasefires, bilateral trade deals, road infrastructure development, granting of resource concessions, and enabling policies on land allocation and edible oils production—thereby transforming the formerly forest-dominated landscape into a new agricultural production-oriented landscape. Moreover, evidence indicated that the regime shift is irreversible given several prominent developments: increasing foreign investment following the initiation of democratic and capitalist transitions [75]; the subsequent lifting of Western sanctions to remove obstacles for foreign companies to invest in Myanmar [65,73]; and the 2012 Foreign Investment Law that included very significant liberalisation measures to encourage foreign direct investment in the natural resources extraction and agribusiness production sectors [80]; thus causing the agricultural production-oriented landscape to persist.
Beyond providing a historical contextual analysis to explain a robust quantitative land cover change analysis, our study also suggests that another regime shift could be on the horizon for Tanintharyi. In Myanmar, the interplay of underlying factors, particularly of armed conflict in ethnic borderland regions, weak land tenure, and economic interests, has situated the role of formal land concessions (e.g., logging, agribusiness) in deforestation [27]. While nearly 20% of the region had been allocated to oil palm concessions by the end of 2013, and at present self-reinforcing processes appear to have stabilised land change since 2004, less than 20% of the oil palm concessions had actually been planted [76]. Full development of these concessions represent a new trigger that would further accelerate a transition to a potentially new agriculture-dominated landscape, causing more widespread deforestation (including in existing or proposed protected areas, see [26]) and internal displacement. Also, full development of the Dawei Special Economic Zone, although stalled since 2008, could catalyse further infrastructure development in the region, particularly along the forested Thailand-Myanmar border, and thus lead to further deforestation. A simulation study, for example, along the “Road to Dawei” demonstrated this possibility wherein a conventional approach to road construction was likely to have positive economic impacts in the region, especially in the short-term, but also negative consequences for the integrity of the ecosystem, which in turn might also negatively impact the investment itself and its economic outcomes in the medium and longer term [88].

6. Conclusions and Recommendations

Land-system regime shifts have been recognised as globally significant, albeit they are still poorly understood land change phenomena. In this study, we investigated the complex dynamics of land-cover regime shifts by integrating complementary analytical frameworks, and then applied this to the dynamic and rapidly transitioning landscape of the Tanintharyi Region in southern Myanmar.
We found that the land-cover regime shift resulted in rapid and extensive deforestation from 1997–2004, which was due to timber extraction by logging concessions as well as the expansion of agro-industrial plantations during the early and latter stages of the regime shift, respectively. Therefore, our study provides the first direct, quantitative evidence of a broad-scale regime shift, emphasising that the land cover changes were non-linear, which had not been detected by previous studies that have already reported the extensive land cover changes in the region. Also, our study detected the occurrence of the regime shift at both the regional and district levels, providing evidence that regime shifts occur at multiple spatial scales as well as confirming scale independence in the detection of regime shifts.
The political and economic conditions that developed internally within Myanmar and its neighboring countries, primarily Thailand and China, as well as the socio-economic-political interactions between Myanmar and these two countries, set the stage to trigger the land-cover regime shift. Government policies that facilitated the establishment of large-scale agro-industrial concessions, which emerged through state-mediated capitalism and politico-business complexes and the influx of foreign direct investments, reinforced the new agricultural production-oriented regime, and prevented it from reverting back to the previous forest-dominated regime. These social, economic, and political complexities necessitated a deeper investigation and treatment of the narratives regarding the preconditions, triggers, and self-reinforcing processes that explained the regime shift, which allowed us to connect the spatial patterns with the processes driving land cover change.
Our study provides a template for future studies investigating land-cover regime shifts using a spatially explicit, scalable, and quantifiable approach through the integration of complementary analytical frameworks, and directs further attention to uncovering the dynamics of a potential regime shift in the overall land system. The future work that we envision includes understanding land-cover regime shifts, and land change more broadly, in terms of the dynamics and variations of spatial determinants [87,89] and landscape patterns [86,90] across space and time that could lead to resolving some of the challenges for developing model projections of future land change, as well as exploring approaches that further characterise landscape changes and their driving processes [91,92,93]. Next, integration of the telecoupling framework [94] for analysing regime shifts is important to further explore cases such as the Tanintharyi Region, where regional-global external forces (e.g., markets, policies) have influenced local land use and land cover change. Finally, our approach offers new opportunities to study previously unrecognised regime shifts in other geographic areas, thereby advancing our understanding of land-system dynamics that drive global environmental change.

Supplementary Materials

The following are available online at https://www.mdpi.com/2071-1050/11/4/1139/s1. Supplementary materials include: (1) aggregation of detailed land cover categories into the six broad categories used in the study; (2) mathematical notations and equations for Intensity Analysis (IA); (3) results of Interval-level IA for the three districts of Tanintharyi Region; (4) results of Category-level IA for Tanintharyi Region and its three districts; (5) results of Transition-level IA for Tanintharyi Region; (6) Timeline summary of relevant key events based on literature review; (7) Land cover assessment using visual interpretation; (8) Spreadsheet of the test for systematic transitions from the Transition-level IA; (9) Scripts including Google Earth Engine script for preparing the ESA CCI annual time-series global land cover product, R scripts for generating visualisation plots, and script for generating the Sankey diagram using an online generator; and (10) Output Microsoft Excel workbooks of IA.

Author Contributions

J.D.T.D.A. conceived the study, developed the methodological framework, and curated the data; J.J. and J.D.T.D.A. analysed land cover change and implemented Intensity Analysis; J.D.T.D.A. and J.J. developed scripts and visualisation figures (with contributions from G.W.P., C.L.L., and E.L.W.); K.M.W., G.W.P., and J.D.T.D.A. developed and wrote the narratives; K.T.L., A.C.M., and C.L.L. reviewed, validated, and provided additional references for the narratives; E.L.W. secured funding, supervised the study, and guided the writing process; J.D.T.D.A., G.W.P., K.M.W., J.J., and E.L.W. wrote the paper. All authors contributed to the discussion of the methods and results, and reviewed and commented on the manuscript.

Funding

This research was supported by Academic Research Grant Tier 2 MOE2015-T2-1-131 from the Ministry of Education, Singapore.

Acknowledgments

We thank four anonymous reviewers for providing helpful comments to improve the earlier versions of this manuscript.

Conflicts of Interest

The authors declare no conflict of interest.

References

  1. Crutzen, P.J. Geology of mankind. Nature 2002, 415, 23. [Google Scholar] [CrossRef] [PubMed]
  2. Foley, J.A.; DeFries, R.; Asner, G.P.; Barford, C.; Bonan, G.; Carpenter, S.R.; Chapin, F.S.; Coe, M.T.; Daily, G.C.; Gibbs, H.K.; et al. Global consequences of land use. Science 2005, 309, 570–574. [Google Scholar] [CrossRef] [PubMed]
  3. Vitousek, P.M.; Mooney, H.A.; Lubchenco, J.; Melillo, J.M. Human domination of Earth’s ecosystems. Science 1997, 277, 494–499. [Google Scholar] [CrossRef]
  4. DeFries, R.S.; Foley, J.A.; Asner, G.P. Land-use choices: Balancing human needs and ecosystem function. Front. Ecol. Environ. 2004, 2, 249–257. [Google Scholar] [CrossRef]
  5. Verburg, P.H.; Crossman, N.; Ellis, E.C.; Heinimann, A.; Hostert, P.; Mertz, O.; Nagendra, H.; Sikor, T.; Erb, K.-H.; Golubiewski, N.; et al. Land system science and sustainable development of the earth system: A global land project perspective. Anthropocene 2015, 12, 29–41. [Google Scholar] [CrossRef] [Green Version]
  6. Verburg, P.H.; Erb, K.-H.; Mertz, O.; Espindola, G. Land System Science: Between global challenges and local realities. Curr. Opin. Environ. Sustain. 2013, 5, 433–437. [Google Scholar] [CrossRef] [PubMed]
  7. Dearing, J.; Braimoh, A.; Reenberg, A.; Turner, B.; van der Leeuw, S. Complex land systems: The need for long time perspectives to assess their future. Ecol. Soc. 2010, 15, 21. [Google Scholar] [CrossRef]
  8. Müller, D.; Sun, Z.; Vongvisouk, T.; Pflugmacher, D.; Xu, J.; Mertz, O. Regime shifts limit the predictability of land-system change. Glob. Environ. Chang. 2014, 28, 75–83. [Google Scholar] [CrossRef]
  9. Veldkamp, A.; Lambin, E.F. Predicting land-use change. Agric. Ecosyst. Environ. 2001, 85, 1–6. [Google Scholar] [CrossRef]
  10. Biggs, R.; Carpenter, S.R.; Brock, W.A. Turning back from the brink: Detecting an impending regime shift in time to avert it. Proc. Natl. Acad. Sci. USA 2009, 106, 826–831. [Google Scholar] [CrossRef] [Green Version]
  11. Scheffer, M. Critical Transitions in Nature and Society; Princeton University Press: Princeton, NJ, USA, 2009; ISBN 978-0-691-12204-5. [Google Scholar]
  12. Scheffer, M.; Carpenter, S.; Foley, J.A.; Folke, C.; Walker, B. Catastrophic shifts in ecosystems. Nature 2001, 413, 591–596. [Google Scholar] [CrossRef] [PubMed]
  13. Lambin, E.F.; Meyfroidt, P. Land use transitions: Socio-ecological feedback versus socio-economic change. Land Use Policy 2010, 27, 108–118. [Google Scholar] [CrossRef]
  14. Ramankutty, N.; Coomes, O. Land-use regime shifts: An analytical framework and agenda for future land-use research. Ecol. Soc. 2016, 21. [Google Scholar] [CrossRef]
  15. Zaehringer, J.G.; Llopis, J.C.; Latthachack, P.; Thein, T.T.; Heinimann, A. A novel participatory and remote-sensing-based approach to mapping annual land use change on forest frontiers in Laos, Myanmar, and Madagascar. J. Land Use Sci. 2018, 13, 16–31. [Google Scholar] [CrossRef]
  16. Sun, Z.; Müller, D. Understanding regime shift in land systems with system dynamics. In Proceedings of the International Congress on Environmental Modelling and Software; Ames, D.P., Quinn, N.W.T., Rizzoli, A.E., Eds.; San Diego, CA, USA, 2014. Available online: https://scholarsarchive.byu.edu/iemssconference/2014/Stream-H/83/ (accessed on 21 February 2019).
  17. European Environment Agency CORINE Land Cover. Available online: https://www.eea.europa.eu/publications/COR0-landcover (accessed on 20 February 2019).
  18. Feranec, J.; Jaffrain, G.; Soukup, T.; Hazeu, G. Determining changes and flows in European landscapes 1990–2000 using CORINE land cover data. Appl. Geogr. 2010, 30, 19–35. [Google Scholar] [CrossRef]
  19. Song, X.-P.; Hansen, M.C.; Stehman, S.V.; Potapov, P.V.; Tyukavina, A.; Vermote, E.F.; Townshend, J.R. Global land change from 1982 to 2016. Nature 2018, 560, 639. [Google Scholar] [CrossRef] [PubMed]
  20. Aldwaik, S.Z.; Pontius, R.G. Intensity analysis to unify measurements of size and stationarity of land changes by interval, category, and transition. Landsc. Urban Plan. 2012, 106, 103–114. [Google Scholar] [CrossRef]
  21. Connette, G.; Oswald, P.; Songer, M.; Leimgruber, P. Mapping distinct forest types improves overall forest identification based on multi-spectral Landsat imagery for Myanmar’s Tanintharyi Region. Remote Sens. 2016, 8, 882. [Google Scholar] [CrossRef]
  22. Rao, M.; Htun, S.; Platt, S.G.; Tizard, R.; Poole, C.; Myint, T.; Watson, J.E.M. Biodiversity conservation in a changing climate: A review of threats and implications for conservation planning in Myanmar. Ambio 2013, 42, 789–804. [Google Scholar] [CrossRef]
  23. Aung, S.S.; Shwe, N.M.; Frechette, J.; Grindley, M.; Connette, G. Surveys in southern Myanmar indicate global importance for tigers and biodiversity. Oryx 2017, 51, 13. [Google Scholar] [CrossRef]
  24. NESAC. From Rice Bowl to Food Basket: Three Pillars for Modernising Myanmar’s Agricultural and Food Sector; National Economic and Social Advisory Council: Yangon, Myanmar, 2016; p. 41. [Google Scholar]
  25. Scurrah, N.; Hirsch, P.; Woods, K. The Political Economy of Land Governance in Myanmar; Mekong Region Land Governance and University of Sydney: Vientiane, Lao People’s Democratic Republic, 2015; p. 27. [Google Scholar]
  26. Donald, P.F.; Round, P.D.; Dai We Aung, T.; Grindley, M.; Steinmetz, R.; Shwe, N.M.; Buchanan, G.M. Social reform and a growing crisis for southern Myanmar’s unique forests. Conserv. Biol. 2015, 29, 1485–1488. [Google Scholar] [CrossRef] [PubMed]
  27. Lim, C.L.; Prescott, G.W.; De Alban, J.D.T.; Ziegler, A.D.; Webb, E.L. Untangling the proximate causes and underlying drivers of deforestation and forest degradation in Myanmar. Conserv. Biol. 2017, 31, 1362–1372. [Google Scholar] [CrossRef] [PubMed] [Green Version]
  28. Prescott, G.W.; Sutherland, W.J.; Aguirre, D.; Baird, M.; Bowman, V.; Brunner, J.; Connette, G.M.; Cosier, M.; Dapice, D.; De Alban, J.D.T.; et al. Political transition and emergent forest-conservation issues in Myanmar. Conserv. Biol. 2017, 31, 1257–1270. [Google Scholar] [CrossRef] [PubMed] [Green Version]
  29. Webb, E.L.; Jachowski, N.R.A.; Phelps, J.; Friess, D.A.; Than, M.M.; Ziegler, A.D. Deforestation in the Ayeyarwady Delta and the conservation implications of an internationally-engaged Myanmar. Glob. Environ. Chang. 2014, 24, 321–333. [Google Scholar] [CrossRef]
  30. Webb, E.L.; Phelps, J.; Friess, D.A.; Rao, M.V.; Ziegler, A.D. Environment-friendly reform in Myanmar. Science 2012, 336, 295. [Google Scholar] [CrossRef] [PubMed]
  31. Bhagwat, T.; Hess, A.; Horning, N.; Khaing, T.; Thein, Z.M.; Aung, K.M.; Aung, K.H.; Phyo, P.; Tun, Y.L.; Oo, A.H.; et al. Losing a jewel—Rapid declines in Myanmar’s intact forests from 2002–2014. PLoS ONE 2017, 12, e0176364. [Google Scholar] [CrossRef] [PubMed]
  32. De Alban, J.D.T.; Connette, G.M.; Oswald, P.; Webb, E.L. Combined Landsat and L-Band SAR data improves land cover classification and change detection in dynamic tropical landscapes. Remote Sens. 2018, 10, 306. [Google Scholar] [CrossRef]
  33. Leimgruber, P.; Kelly, D.S.; Steininger, M.K.; Brunner, J.; Müller, T.; Songer, M. Forest cover change patterns in Myanmar (Burma) 1990–2000. Environ. Conserv. 2005, 32, 356–364. [Google Scholar] [CrossRef] [Green Version]
  34. ESA CCI 300 m Annual Global Land Cover Time Series from 1992 to 2015. Available online: https://www.esa-landcover-cci.org/?q=node/175 (accessed on 25 June 2018).
  35. UCL Geomatics. Land Cover CCI: Product User Guide, Version 2.0; European Space Agency: Louvain la Neuve, Belgium, 2017; p. 105. [Google Scholar]
  36. Gorelick, N.; Hancher, M.; Dixon, M.; Ilyushchenko, S.; Thau, D.; Moore, R. Google Earth Engine: Planetary-scale geospatial analysis for everyone. Remote Sens. Environ. 2017, 202, 18–27. [Google Scholar] [CrossRef]
  37. Google Google Earth Engine. Available online: https://earthengine.google.com (accessed on 15 September 2016).
  38. GADM Global Administrative Database. Available online: https://gadm.org/ (accessed on 10 August 2018).
  39. Congedo, L. Semi-Automatic Classification Plugin Documentation. Available online: http://semiautomaticclassificationmanual-v5.readthedocs.io/en/latest/index.html (accessed on 15 February 2017).
  40. QGIS Development Team QGIS Geographic Information System. Available online: https://qgis.org/en/site/ (accessed on 10 August 2018).
  41. R Core Team. R: A Language and Environment for Statistical Computing; R Foundation for Statistical Computing: Vienna, Austria, 2016; p. 34. [Google Scholar]
  42. The R Foundation R: The R Project for Statistical Computing. Available online: https://www.r-project.org/ (accessed on 10 August 2018).
  43. Aldwaik, S.Z.; Pontius, R.G. Map errors that could account for deviations from a uniform intensity of land change. Int. J. Geogr. Inf. Sci. 2013, 27, 1717–1739. [Google Scholar] [CrossRef]
  44. Aldwaik, S.Z.; Pontius, R.G. Intensity Analysis. Available online: https://sites.google.com/site/intensityanalysis/home (accessed on 10 August 2018).
  45. Csala, D. Sankey Diagram Generator. Available online: https://sankey.csaladen.es (accessed on 10 August 2018).
  46. Alo, C.A.; Pontius, R.G. Identifying systematic land-cover transitions using remote sensing and GIS: The fate of forests inside and outside protected areas of southwestern Ghana. Environ. Plan. B Plan. Des. 2008, 35, 280–295. [Google Scholar] [CrossRef]
  47. Pontius, R.G.; Shusas, E.; McEachern, M. Detecting important categorical land changes while accounting for persistence. Agric. Ecosyst. Environ. 2004, 101, 251–268. [Google Scholar] [CrossRef]
  48. Wickham, H. Tidyverse: Easily Install and Load the “Tidyverse”. R Package Vers. 2017, 1, 51. [Google Scholar]
  49. Lambin, E.F.; Geist, H.J.; Lepers, E. Dynamics of land-use and land-cover change in tropical regions. Annu. Rev. Environ. Resour. 2003, 28, 205–241. [Google Scholar] [CrossRef]
  50. Rotmans, J.; van Asselt, M.; Anastasi, C.; Greeuw, S.; Mellors, J.; Peters, S.; Rothman, D.; Rijkens, N. Visions for a sustainable Europe. Futures 2000, 32, 809–831. [Google Scholar] [CrossRef]
  51. Bohemian, B.V. Sketch: The Digital Design Toolkit. Available online: https://www.sketchapp.com (accessed on 15 August 2018).
  52. FAO. Collect Earth: Open Foris. Available online: http://www.openforis.org/tools/collect-earth.html (accessed on 12 August 2017).
  53. Kramer, T. Neither War nor Peace: The Future of Ceasefire Agreements in Burma; Transnational Institute: Amsterdam, The Netherlands, 2009; p. 44. [Google Scholar]
  54. Lintner, B. The Rise and Fall of the Communist Party of Burma, 1st ed.; Cornell University Press: Ithaca, NY, USA, 1990; ISBN 978-0-87727-123-9. [Google Scholar]
  55. Smith, M. Burma: Insurgency and the Politics of Ethnicity, 2nd ed.; Zed Books: London, UK, 1999; ISBN 978-1-85649-660-5. [Google Scholar]
  56. Warner, R. Shooting at the Moon: The Story of America’s Clandestine War in Laos, 1st ed.; Steerforth: South Royalton, VT, USA, 1996; ISBN 978-1-883642-36-5. [Google Scholar]
  57. Chin, K.; Zhang, S.X. The Chinese Connection: Cross-border Drug Trafficking between Myanmar and China; National Institute of Justice: Washington, DC, USA, 2007; ISBN 1-296-04650-8. [Google Scholar]
  58. Gibson, R.M.; Chen, W.H. The Secret Army: Chiang Kai-shek and the Drug Warlords of the Golden Triangle, 1st ed.; John Wiley & Sons, Inc.: Singapore, 2011; ISBN 978-0-470-83018-5. [Google Scholar]
  59. Battersby, P. Border politics and the broader politics of Thailand’s international relations in the 1990s: From communism to capitalism. Pac. Aff. 1998, 71, 473–488. [Google Scholar] [CrossRef]
  60. Buszynski, L. Thailand and Myanmar: the perils of ‘constructive engagement’. Pac. Rev. 1998, 11, 290–305. [Google Scholar] [CrossRef]
  61. Woods, K. Ceasefire capitalism: Military–private partnerships, resource concessions and military–state building in the Burma–China borderlands. J. Peasant Stud. 2011, 38, 747–770. [Google Scholar] [CrossRef]
  62. Innes-Brown, M.; Valencia, M.J. Thailand’s resource diplomacy in Indochina and Myanmar. Contemp. Southeast Asia 1993, 14, 332–351. [Google Scholar] [CrossRef]
  63. Dittmer, L.; Yu, G.T. China, the Developing World, and the New Global Dynamic; Dittmer, L., Yu, G.T., Eds.; Lynne Rienner Publishers: Boulder, Colorado, 2010; ISBN 978-1-58826-726-9. [Google Scholar]
  64. Findlay, R.; Park, C.-Y.; Verbiest, J.-P.A. Myanmar: Building economic foundations. Asian-Pac. Econ. Lit. 2016, 30, 42–64. [Google Scholar] [CrossRef]
  65. Talbott, K.; Akimoto, Y.; Cuskelly, K. Myanmar’s Ceasefire Regime: Two Decades of Unaccountable Natural Resource Exploitation. In Governance, Natural Resources and Post-Conflict Peacebuilding; Bruch, C., Muffett, C., Nichols, S.S., Eds.; Earthscan from Routledge: Abingdon, Oxon, UK; New York, NY, USA, 2016; pp. 327–361. ISBN 978-1-84971-235-4. [Google Scholar]
  66. Global Witness. A Conflict of Interests: The Uncertain Future of Burma’s Forests; Global Witness: London, UK, 2003; p. 128. [Google Scholar]
  67. McKinnon, J. The Forests of Thailand: Strike Up the Ban? In Development or Domestication?: Indigenous Peoples of Southeast Asia; McCaskill, D., Kampe, K., Eds.; Silkworm Books: Chiang Mai, Thailand, 1997; pp. 117–131. ISBN 978-974-7100-33-4. [Google Scholar]
  68. EarthRights International. Total Impact: The Human Rights, Environmental, and Financial Impacts of Total and Chevron’s Yadana Gas Project in Military-Ruled Burma (Myanmar); EarthRights International: Washington, DC, USA, 2009; p. 107. [Google Scholar]
  69. EarthRights International. Total Denial Continues: Earth Rights Abuses Along the Yadana and Yetagun Pipelines in Burma; EarthRights International: Washington, DC, USA, 2000; p. 183. [Google Scholar]
  70. Pollard, E.H.B.; Hlaing, S.W.; Pilgrim, J.D. Review of the Tanintharyi Nature Reserve Project as a Conservation Model in Myanmar; The Biodiversity Consultancy: Yangon, Myanmar, 2014; p. 49. [Google Scholar]
  71. Sheppard, A.-M. The Karen Revolution in Burma: A Political Question. In Development or Domestication?: Indigenous Peoples of Southeast Asia; McCaskill, D., Kampe, K., Eds.; Silkworm Books: Chiang Mai, Thailand, 1997; pp. 568–602. ISBN 978-974-7100-33-4. [Google Scholar]
  72. Brunner, J.; Talbott, K.; Elkin, C. Logging Burma’s Frontier Forests: Resources and the Regime; World Resources Institute: Washington, DC, USA, 1998; ISBN 978-1-56973-266-3. [Google Scholar]
  73. Buchanan, J.; Kramer, T.; Woods, K. Developing Disparity: Regional Investment in Burma’s Borderlands; Transnational Institute: Amsterdam, The Netherlands, 2013; p. 56. [Google Scholar]
  74. Burma Environment Working Group Burma’s Environment: People, Problems, Policies; Wanida Press: Chiang Mai, Thailand, 2011; ISBN 978-974-350-515-7.
  75. Jones, L. The political economy of Myanmar’s transition. J. Contemp. Asia 2014, 44, 144–170. [Google Scholar] [CrossRef]
  76. Woods, K. Commercial Agriculture Expansion in Myanmar: Links to Deforestation, Conversion Timber, and Land Conflicts; Forest Trends and UKAID: Washington, DC, USA, 2015; p. 78. [Google Scholar]
  77. Tarkapaw; TRIP NET; Southern Youth; Candle Light; Khaing Myae Thitsar; Myeik Lawyer Network. Green Desert: Communities in Tanintharyi Renounce the MSPP Oil Palm Concession; Dawei Development Association: Yangon, Myanmar, 2016; p. 58. Available online: https://progressivevoicemyanmar.org/2017/01/12/green-desert-communities-in-tanintharyi-renounce-themspp-oil-palm-concession/ (accessed on 21 February 2019).
  78. Woods, K. ‘Conflict Rubber’ and Land Rights Insecurity in a Ceasefire Context in Southeastern Myanmar; Forest Trends: Washington, DC, USA, 2018. [Google Scholar]
  79. Conservation Alliance of Tanawtharyi. Our Forest, Our Life: Protected Areas in Tanintharyi Region Must Respect the Rights of Indigenous Peoples; Conservation Alliance of Tanawtharyi: Dawei, Tanintharyi, Myanmar, 2018; p. 38. [Google Scholar]
  80. Woods, K. The Politics of the Emerging Agro-Industrial Complex in Asia’s ‘Final Frontier’; Transnational Institute: Amsterdam, The Netherlands, 2013; p. 56. [Google Scholar]
  81. Dawei Development Association. Voices from the Ground: Concerns over the Dawei Special Economic Zone and Related Projects; Dawei Development Association: Dawei, Tanintharyi, Myanmar, 2014; p. 90. [Google Scholar]
  82. Trincsi, K. Land System Resilience: Linking Land use Change, State Policy and Ethnic Minority Resource Management in Northern Upland Vietnam. MSc Thesis, McGill University, Montreal, Canada, 2017. [Google Scholar]
  83. Hansen, M.C.; Potapov, P.V.; Moore, R.; Hancher, M.; Turubanova, S.A.; Tyukavina, A.; Thau, D.; Stehman, S.V.; Goetz, S.J.; Loveland, T.R.; et al. High-resolution global maps of 21st-century forest cover change. Science 2013, 342, 850–853. [Google Scholar] [CrossRef] [PubMed]
  84. Li, L.; Fassnacht, F.E.; Storch, I.; Bürgi, M. Land-use regime shift triggered the recent degradation of alpine pastures in Nyanpo Yutse of the eastern Qinghai-Tibetan Plateau. Landsc. Ecol. 2017, 1–17. [Google Scholar] [CrossRef]
  85. Lundsgaard-Hansen, L.; Schneider, F.; Zaehringer, J.; Oberlack, C.; Myint, W.; Messerli, P.; Lundsgaard-Hansen, L.M.; Schneider, F.; Zaehringer, J.G.; Oberlack, C.; et al. Whose agency counts in land use decision-making in Myanmar? A comparative analysis of three cases in Tanintharyi Region. Sustainability 2018, 10, 3823. [Google Scholar] [CrossRef]
  86. Nagendra, H.; Munroe, D.K.; Southworth, J. From pattern to process: landscape fragmentation and the analysis of land use/land cover change. Agric. Ecosyst. Environ. 2004, 101, 111–115. [Google Scholar] [CrossRef]
  87. Verburg, P.H.; van Eck, J.R.R.; de Nijs, T.C.M.; Dijst, M.J.; Schot, P. Determinants of land-use change patterns in the Netherlands. Environ. Plan. B Plan. Des. 2004, 31, 125–150. [Google Scholar] [CrossRef]
  88. Bassi, A.M.; Gallagher, L.A.; Helsingen, H. Green economy modelling of ecosystem services along the “Road to Dawei”. Environments 2016, 3, 19. [Google Scholar] [CrossRef]
  89. Lambin, E.F.; Turner, B.L.; Geist, H.J.; Agbola, S.B.; Angelsen, A.; Bruce, J.W.; Coomes, O.T.; Dirzo, R.; Fischer, G.; Folke, C.; et al. The causes of land-use and land-cover change: Moving beyond the myths. Glob. Environ. Chang. 2001, 11, 261–269. [Google Scholar] [CrossRef]
  90. Frazier, A.E.; Kedron, P. Landscape metrics: Past progress and future directions. Curr. Landsc. Ecol. Rep. 2017, 2, 63–72. [Google Scholar] [CrossRef]
  91. Schellnhuber, H.-J.; Block, A.; Cassel-Gintz, M.; Kropp, J.; Lammel, G.; Lass, W.; Lienenkamp, R.; Loose, C.; Lüdeke, M.K.B.; Moldenhauer, O.; et al. Syndromes of global change. GAIA Ecol. Perspect. Sci. Soc. 1997, 6, 19–34. [Google Scholar] [CrossRef]
  92. Bürgi, M.; Hersperger, A.M.; Schneeberger, N. Driving forces of landscape change—current and new directions. Landsc. Ecol. 2004, 19, 857–868. [Google Scholar] [CrossRef]
  93. Krajewski, P.; Solecka, I.; Mrozik, K. Forest landscape change and preliminary study on its driving forces in Ślęża Landscape Park (Southwestern Poland) in 1883–2013. Sustainability 2018, 10, 4526. [Google Scholar] [CrossRef]
  94. Friis, C.; Nielsen, J.Ø.; Otero, I.; Haberl, H.; Niewöhner, J.; Hostert, P. From teleconnection to telecoupling: Taking stock of an emerging framework in land system science. J. Land Use Sci. 2016, 11, 131–153. [Google Scholar] [CrossRef]
Figure 1. Conceptual diagram of the systematic process for investigating land-cover regime shifts using combined analytical frameworks.
Sustainability 11 01139 g001
Figure 2. (a) Land cover in 1992, (b) Land cover in 2015, and (c) Changes in land cover 1992–2015 in the Tanintharyi Region, Myanmar, which covers 43,345 km2.
Sustainability 11 01139 g002
Figure 3. Annual net land cover change in the Tanintharyi Region, Myanmar from 1992 to 2015.
Sustainability 11 01139 g003
Figure 4. Interval-level Intensity Analysis. Rate of annual landscape change in Tanintharyi, Myanmar. The time interval plot shows the land-cover regime shift occurred between 1997 and 2004.
Sustainability 11 01139 g004
Figure 5. Gross land cover transitions during the periods of stable land-cover regimes (1992–1997 and 2004–2015) and the land-cover regime shift (1997–2004). Land cover categories include: FOR, Forest; MOS, Mosaic Vegetation; SHB, Shrubland; OTH, Other Vegetation; CRP, Cropland; NON, Non-Vegetation.
Sustainability 11 01139 g005
Figure 6. Category-level Intensity Analysis. Summary of trends of the gross losses and gross gains among land cover categories within (a) Tanintharyi Region; (b) Dawei District; (c) Myeik District; and (d) Kawthoung District during the three periods, namely pre-regime shift (1992–1997), during the regime shift (1997–2004), and post-regime shift (2004–2015). Trends are denoted as concentric circles starting from the inner circle outwards, namely: AL/AG, actively losing and actively gaining; AL/DG, actively losing and dormantly gaining; DL/AG, dormantly losing and actively gaining; DL/DG, dormantly losing and dormantly gaining. “Active” or “dormant” refer to gross gains or losses that are greater or less than, respectively, the uniform intensity across all categories for that interval. Each circle sector represents one annual time interval and progresses clockwise from 1992 to 2015. Red lines comprising several circle sectors (annual intervals) indicate the period of the regime shift.
Sustainability 11 01139 g006
Figure 7. Land-cover regime shift in Tanintharyi Region, Myanmar depicted as a ball-and-valley diagram (adopted from Müller et al. [8]). Balls represent the state of land systems. Upward-pointing arrow indicates enabling preconditions; red arrow indicates the trigger events that punctuate the stable equilibrium of the former forest-dominated regime resulting in a shift to a new agriculture-oriented regime. Downward-pointing arrow indicates self-reinforcing processes.
Sustainability 11 01139 g007
Table 1. Description of aggregated land cover categories.
Aggregated CategoryDescription
ForestTree cover (broadleaved or needleleaved; evergreen or deciduous; closed to open canopy; flooded saline water or flooded fresh/brackish water)
Mosaic VegetationMosaic configuration of cultivated and managed terrestrial areas; natural and semi-natural terrestrial vegetation; and closed to open vegetation (trees, shrubs, herbaceous vegetation)
ShrublandBroadleaved closed to open shrubland (thicket)
CroplandRainfed and irrigated crops (trees, shrubs, and herbaceous vegetation)
Other VegetationIncludes grassland, sparse vegetation (trees, shrubs, and herbaceous cover)
Non-VegetationIncludes urban areas and water bodies
Table 2. Transition-level Intensity Analysis. Summary of systematic transitions from Forest to other land cover categories (Shrubland, Mosaic Vegetation, Cropland, Other Vegetation, Non-Vegetation) during the pre-regime shift (1992–1997), regime shift (1997–2004), and post-regime shift (2004–2015). “Targeted Forest” refers to categories that gained from Forest at an intensity greater than the uniform intensity for all Forest transitions in that interval. “Avoided Forest” refers to categories that gained from forest at an intensity less than the uniform intensity for all Forest transitions in that interval.
Systematic Transition
PeriodIntervalTargeted ForestAvoided Forest
Pre-regime shift1995–1996Mosaic Vegetation
Cropland
1996–1997Cropland
Other Vegetation
Non-Vegetation
Land-cover regime shift2000–2001Mosaic VegetationCropland
Other Vegetation
2001–2002ShrublandNon-Vegetation
2002–2003 Non-Vegetation
2003–2004Shrubland
Post-regime shift2004–2005Mosaic VegetationNon-Vegetation
2005–2006 Non-Vegetation
2006–2007Shrubland
Mosaic Vegetation
Other Vegetation
Cropland
Non-Vegetation
2007–2008 Cropland
Other Vegetation
Non-Vegetation
2008–2009Mosaic VegetationNon-Vegetation
2009–2010Mosaic VegetationNon-Vegetation
2010–2011Other VegetationNon-Vegetation
2011–2012Mosaic VegetationCropland
Non-Vegetation
2013–2014Shrubland

