Article

A Pick-Up Points Recommendation System for Ridesourcing Service

1
Jiangsu Key Laboratory of Urban ITS, Southeast University, Nanjing 210096, China
2
School of Transportation, Southeast University, Nanjing 210096, China
3
Didi Chuxing Company, Beijing 100000, China
*
Author to whom correspondence should be addressed.
Sustainability 2019, 11(4), 1097; https://doi.org/10.3390/su11041097
Submission received: 4 January 2019 / Revised: 27 January 2019 / Accepted: 16 February 2019 / Published: 19 February 2019

Abstract

:
In the ridesourcing industry, drivers are often unable to quickly and accurately locate the waiting position of riders, but patrol or wait on the road, which will seriously affect the management of the road traffic order. It may be a good idea to provide an online virtual site for the taxi to facilitate convergence of the rider and driver. The concept of recommended pick-up point is presented in this paper. At present, ridesourcing service platforms on the market have similar functions, but they do not take into account whether the setting of the pick-up point is compatible with the actual traffic environment, resulting in some problems. We have invented a method to select the recommended pick-up point by integrating various traffic influencing factors, so as to ensure that the setting of the pick-up point is compatible with the actual traffic situation, which consists of three steps. Firstly, we studied the rider’s maximum tolerable waiting time and defined an attractive walking range for riders based on the huge amount of data. In the second step, we analyzed spatial distribution characteristics of the taxi demand hotspot and determined candidate pick-up locations. Lastly, the fuzzy analytic hierarchy method was used to select the recommended pick-up point that is most conducive to traffic management from multiple candidate points. A case study was conducted to validate the proposed approach and experimental evidence showed that recommended results based on the approach are in line with the actual situation of the road, and conducive to road traffic management. This recommendation method is based on real ridesourcing orders data.

1. Introduction

Along with the proliferation of smartphones and the rapid development of wireless communication technologies, ridesourcing apps have emerged in recent years to global popularity. The convenient and instantaneous information exchange facilitated by ridesourcing apps greatly mitigates the previous information barriers caused by spatial deviation between customers and taxi drivers, so therefore it is widely believed to be a powerful instrument for improving the taxi market efficiency. In China, for example, nearly 300 million users in more than 400 cities are using DiDi Chuxing [1], the largest ridesourcing service platform. However, some problems are gradually emerging in the operation of the ridesourcing platform. A common problem is the difficulty of docking riders and drivers due to factors such as noisy GPS data, fluctuating weather, and complexity of the road environment. Drivers always have to communicate with the rider many times before eventually determining the pick-up location. In another scenario, it would take a while for riders to come down from the office building, making drivers stop and wait in forbidden streets with a high risk of being driven away or fined by traffic police. The low efficiency of docking will not only occupy valuable road resources, but also hinder the management of road traffic.
Providing riders an accurate and convenient location is an effective way to ensure that riders take taxis quickly. DiDi Chuxing [1] tried to solve the problem by introducing a function called recommended pick-up point. When applying the function, the rider selects one of the recommended pick-up points as the meeting point, and the driver only has to wait for the rider at the appointed place without multiple communications and confirmations. The realization of this function is mainly based on the result of the cluster analysis of the actual historical pick-up points. Yet the selection of the pick-up point is a multi-dimensional problem; it is necessary to consider a variety of factors for comprehensive evaluation. Previous methods were mostly based on the shortest distance from riders without considering the actual traffic situation. For example, a taxi order is placed on a congested road and the accompanying recommended pick-up point is often located on the road because it is the closest. This is clearly not conducive to a quick meeting between riders and the driver. Attracting drivers to congested roads can also exacerbate congestion.
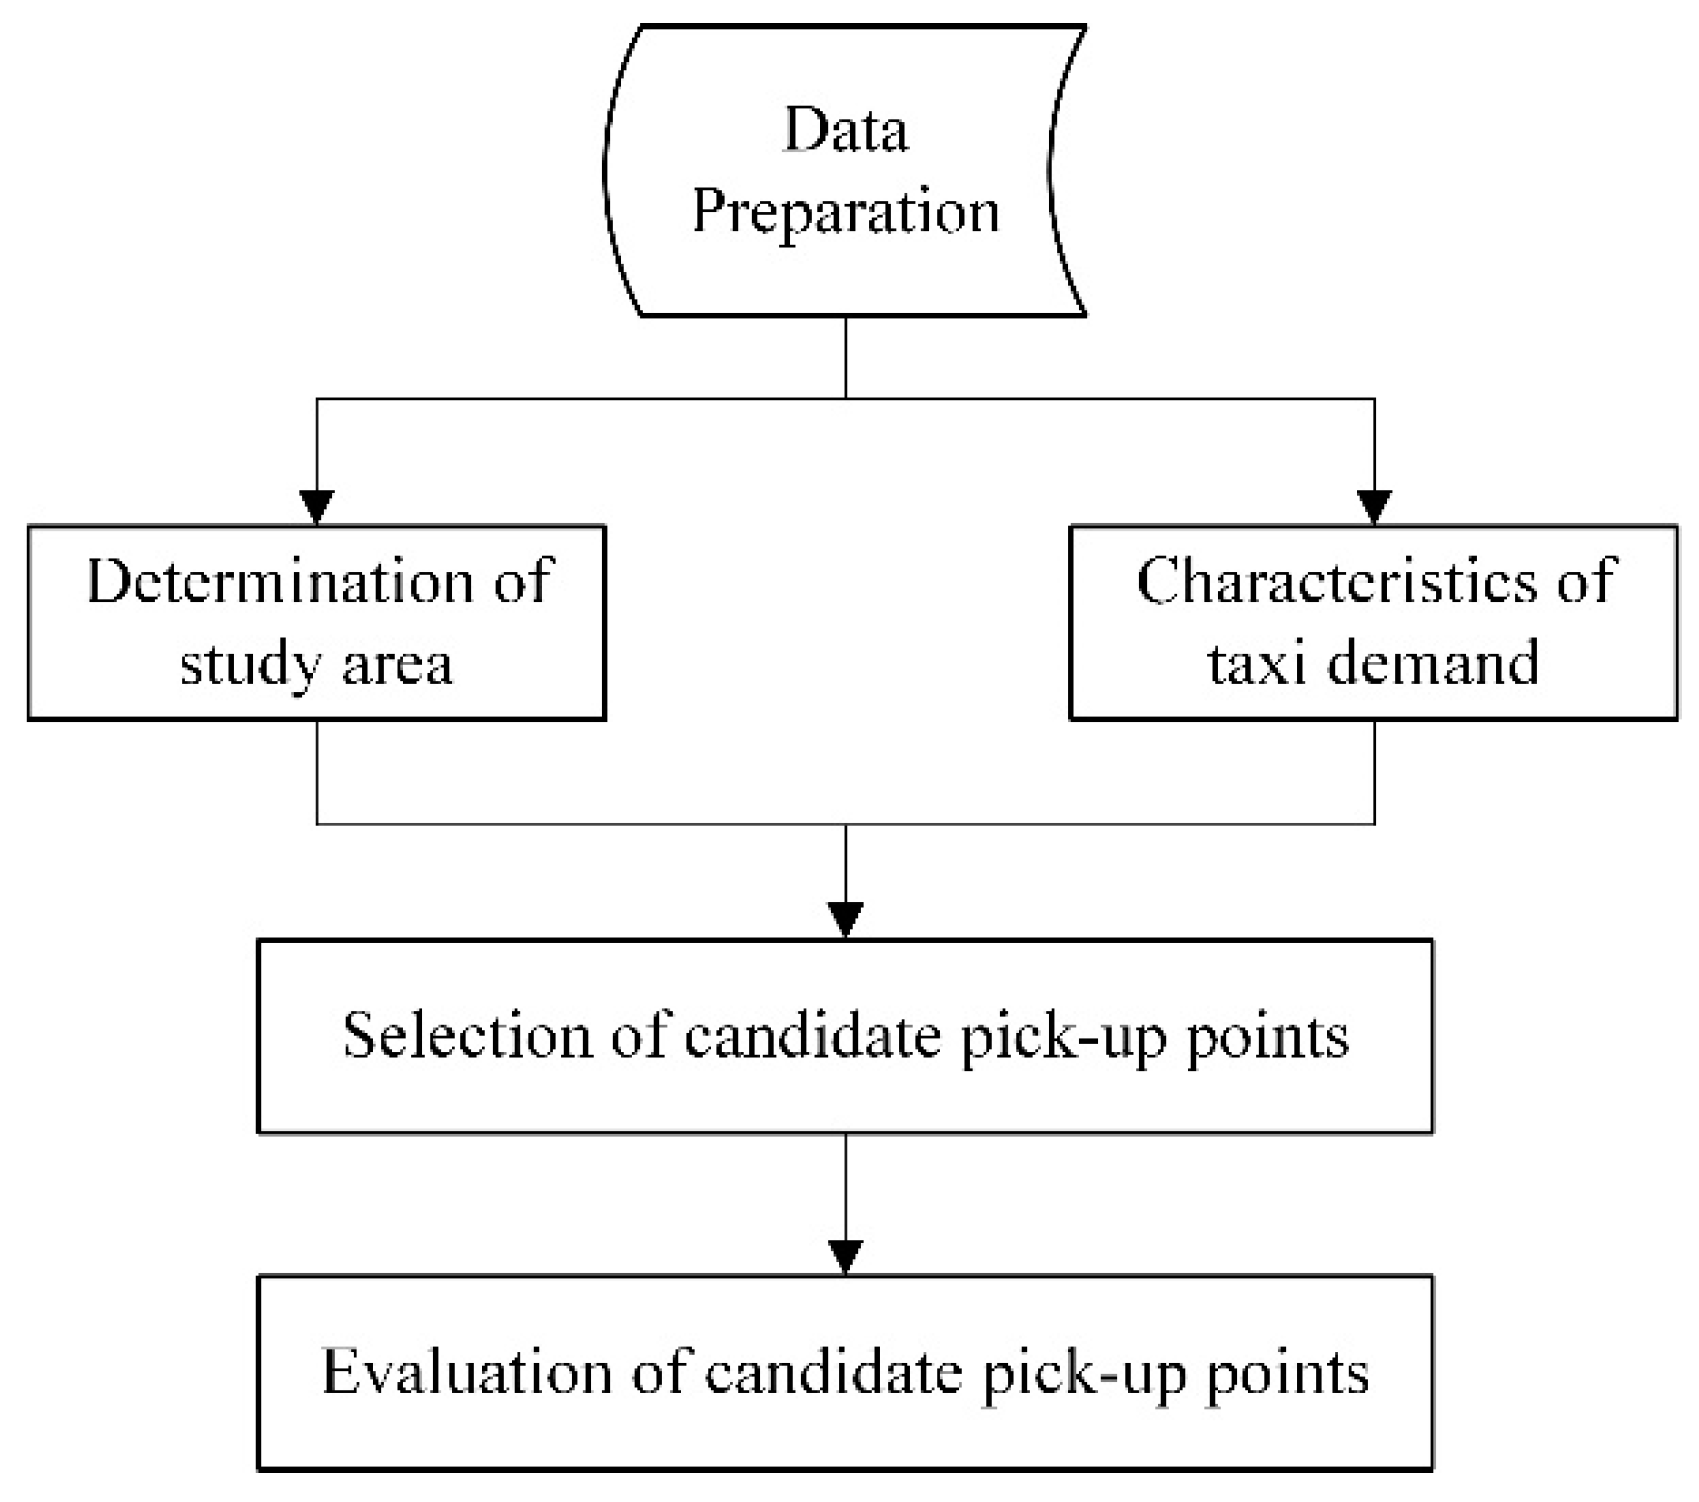
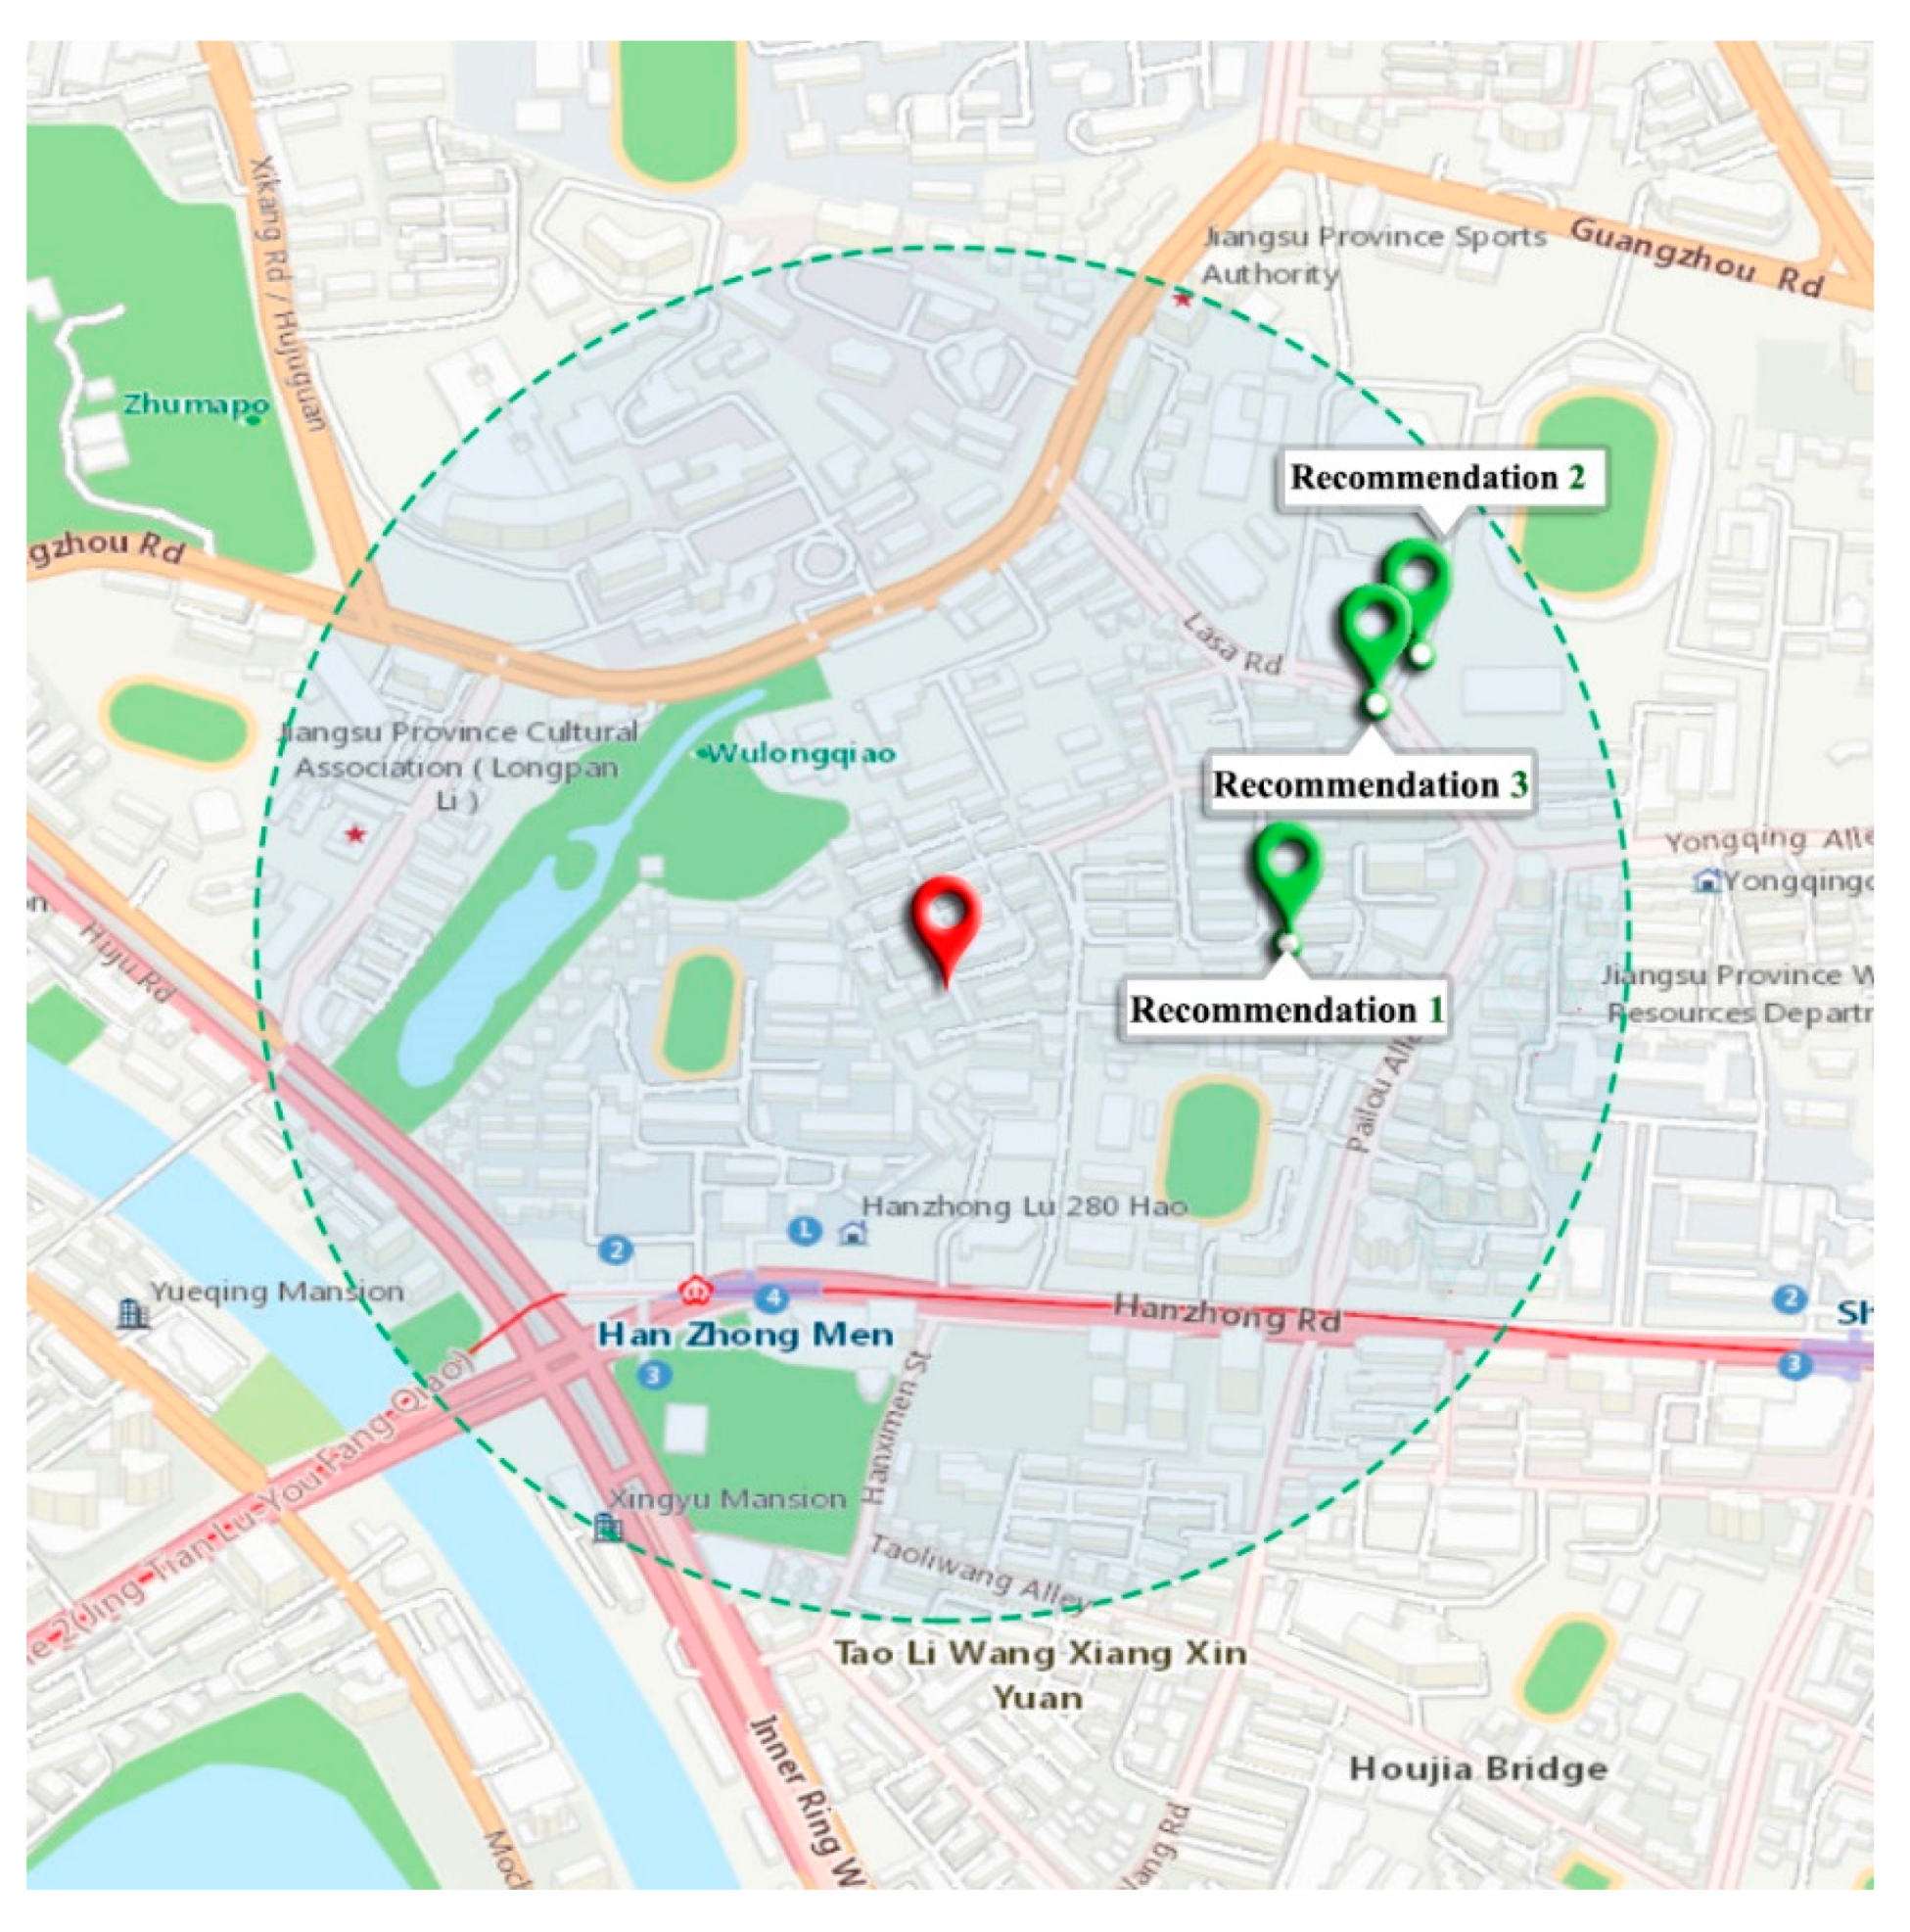
From the perspective of traffic management, we try to propose a new method to determine the recommended pick-up point. We hope to develop a pick-up point recommendation system for ridesourcing services that takes various road traffic factors into account such as road environment, road parking management, traffic flow status, and so on. The system can improve the docking efficiency of ridesourcing service and reduce the impact on traffic order.
To achieve the above goals, we must solve some important problems:
1. 
What are people’s taxi habits (where and when people like to call a taxi)?
2. 
How do we determine the candidate pick-up points?
3. 
How far can the recommended pick-up point be from the rider (maximum walking distance that riders can tolerate)?
4. 
How do we ensure that the recommended pick-up point is compatible with actual traffic conditions?
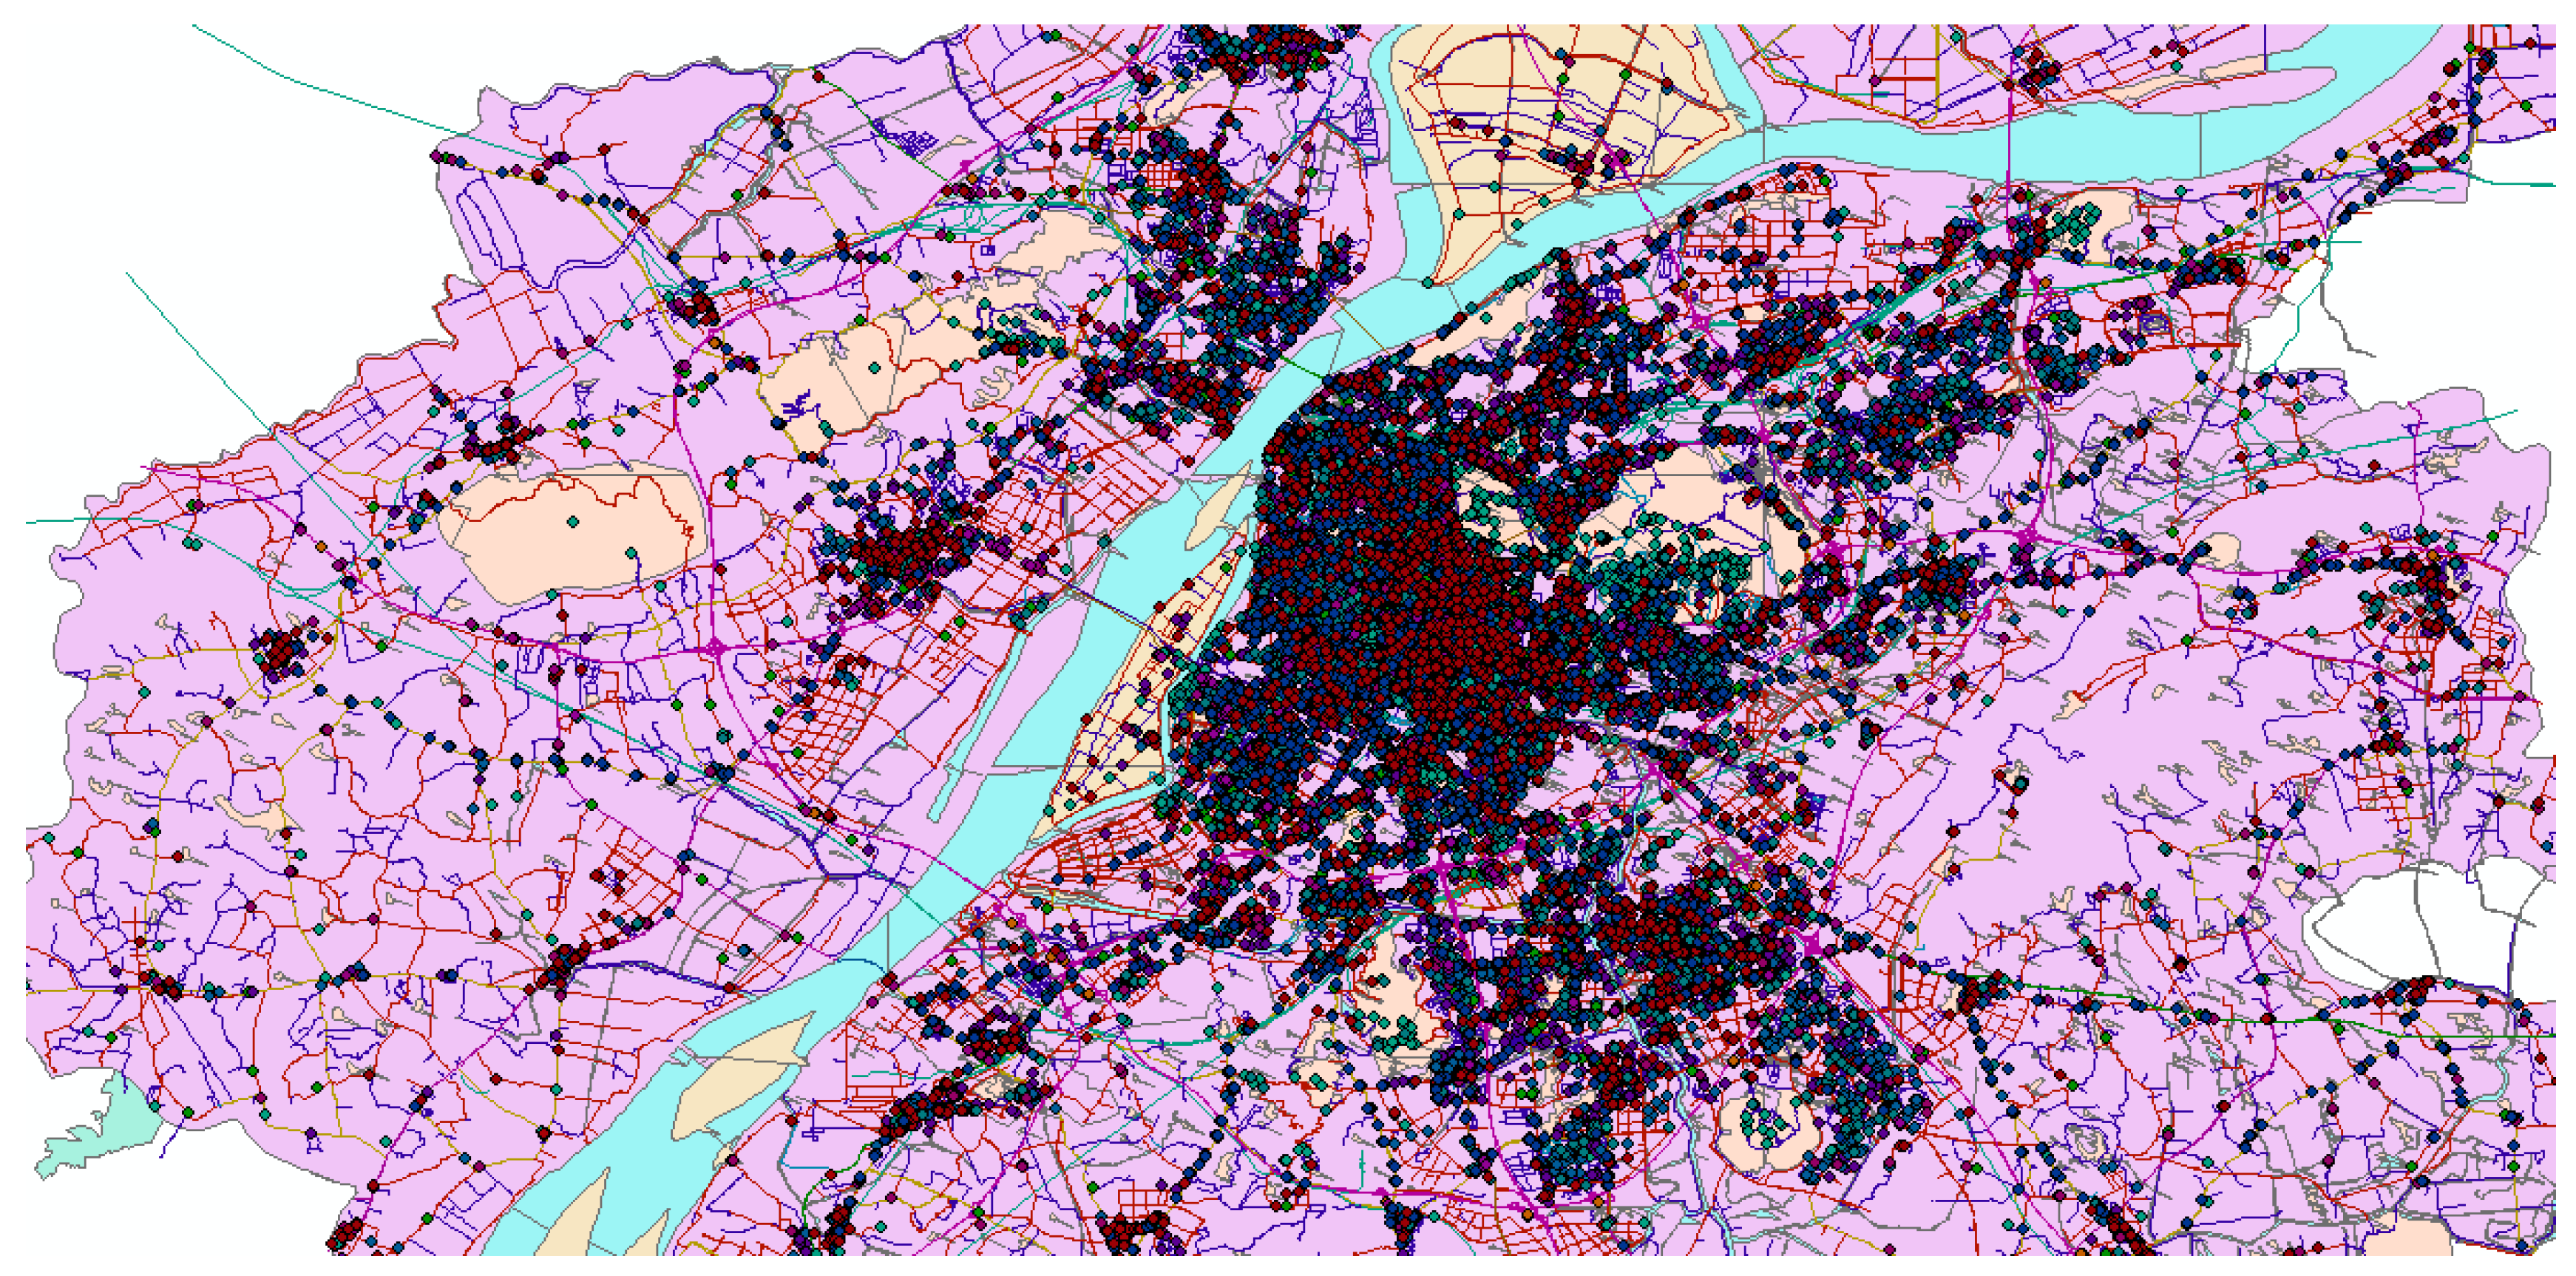
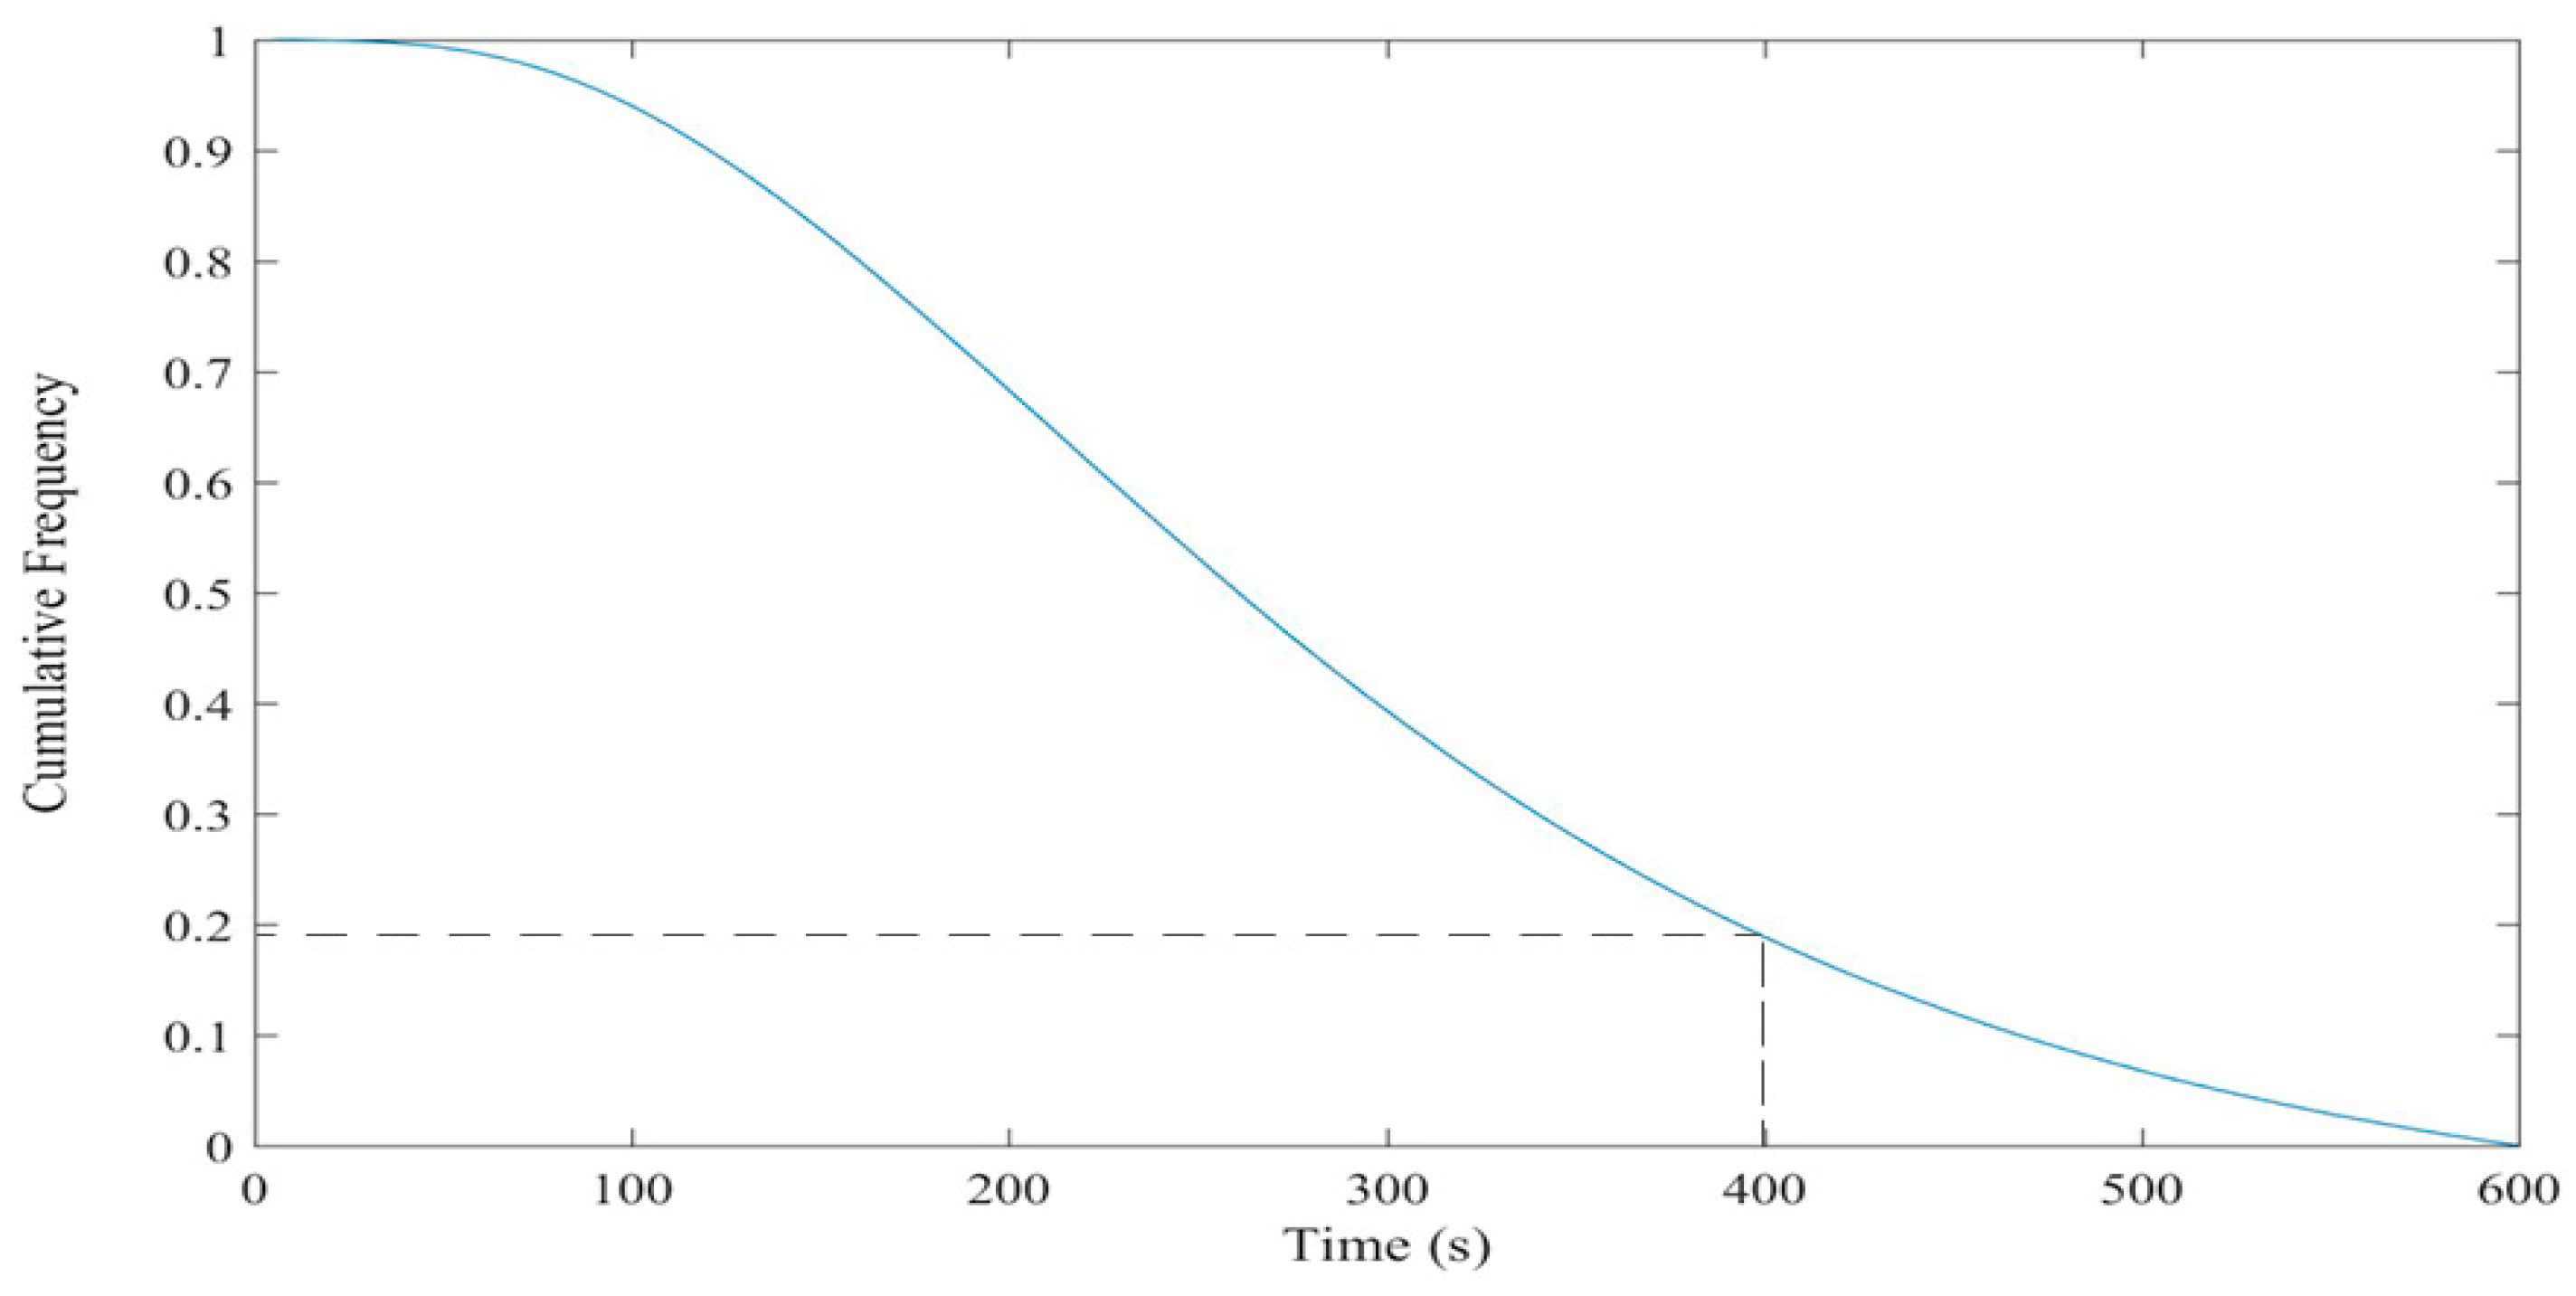
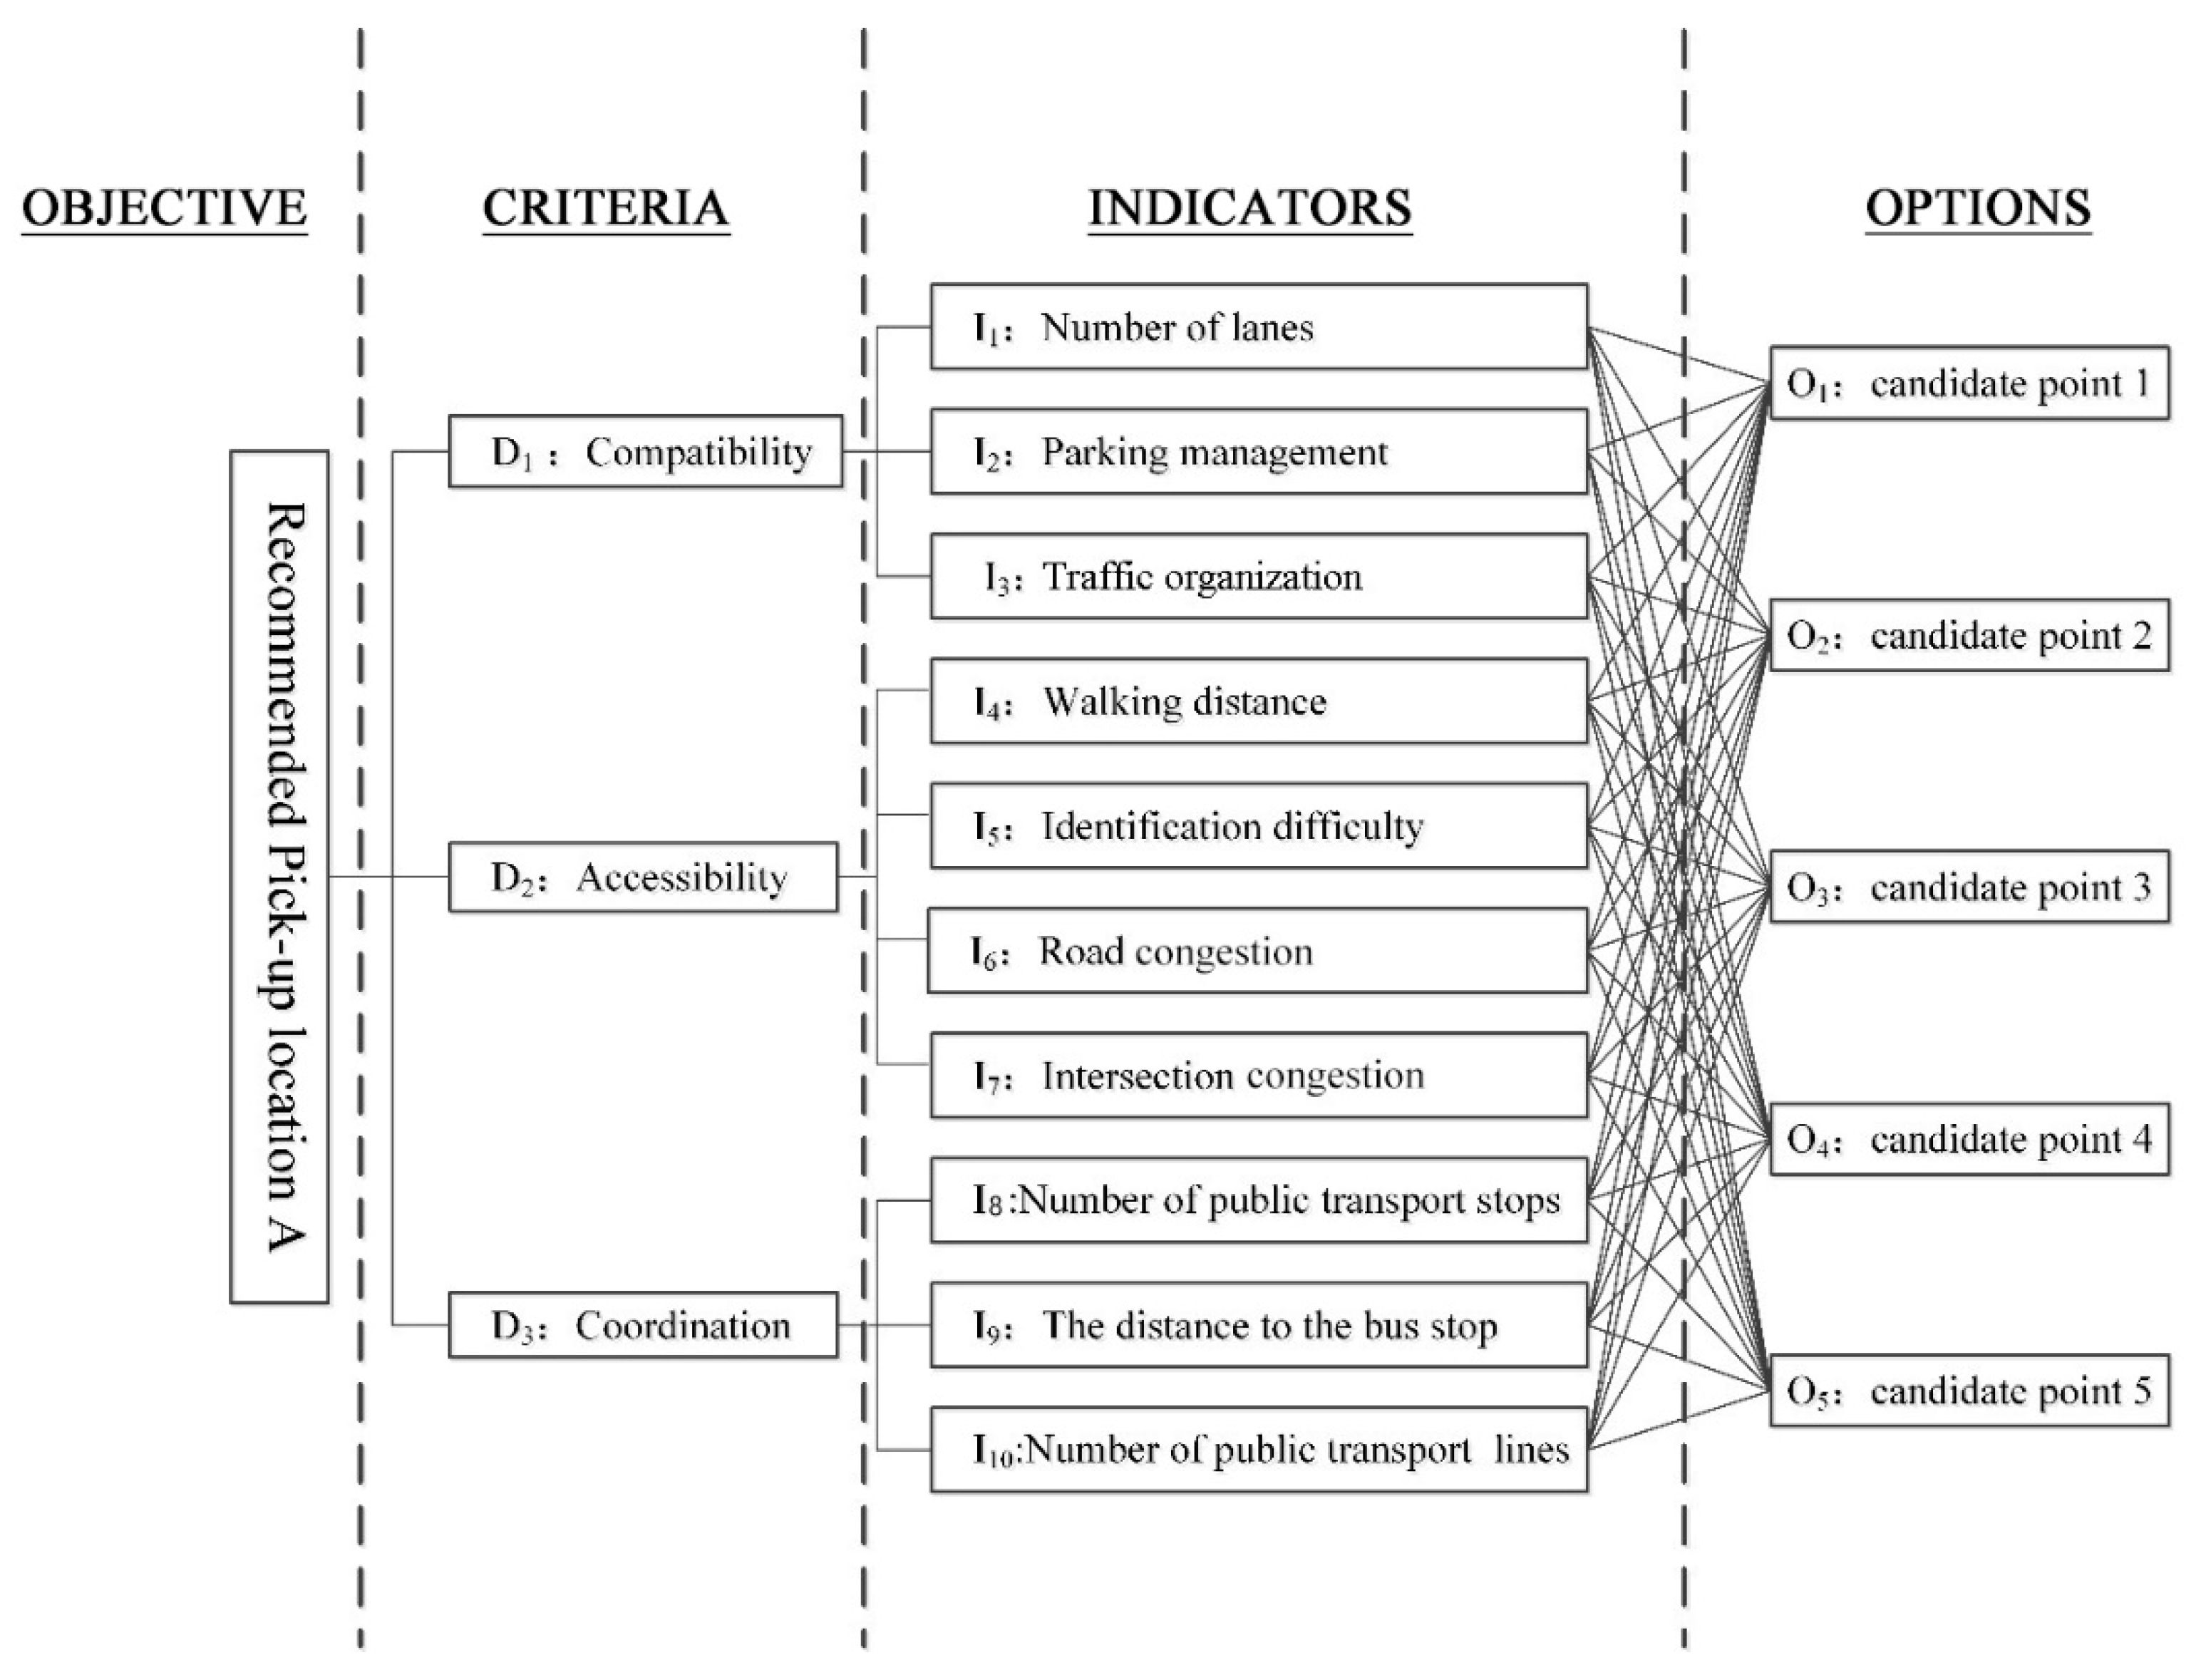
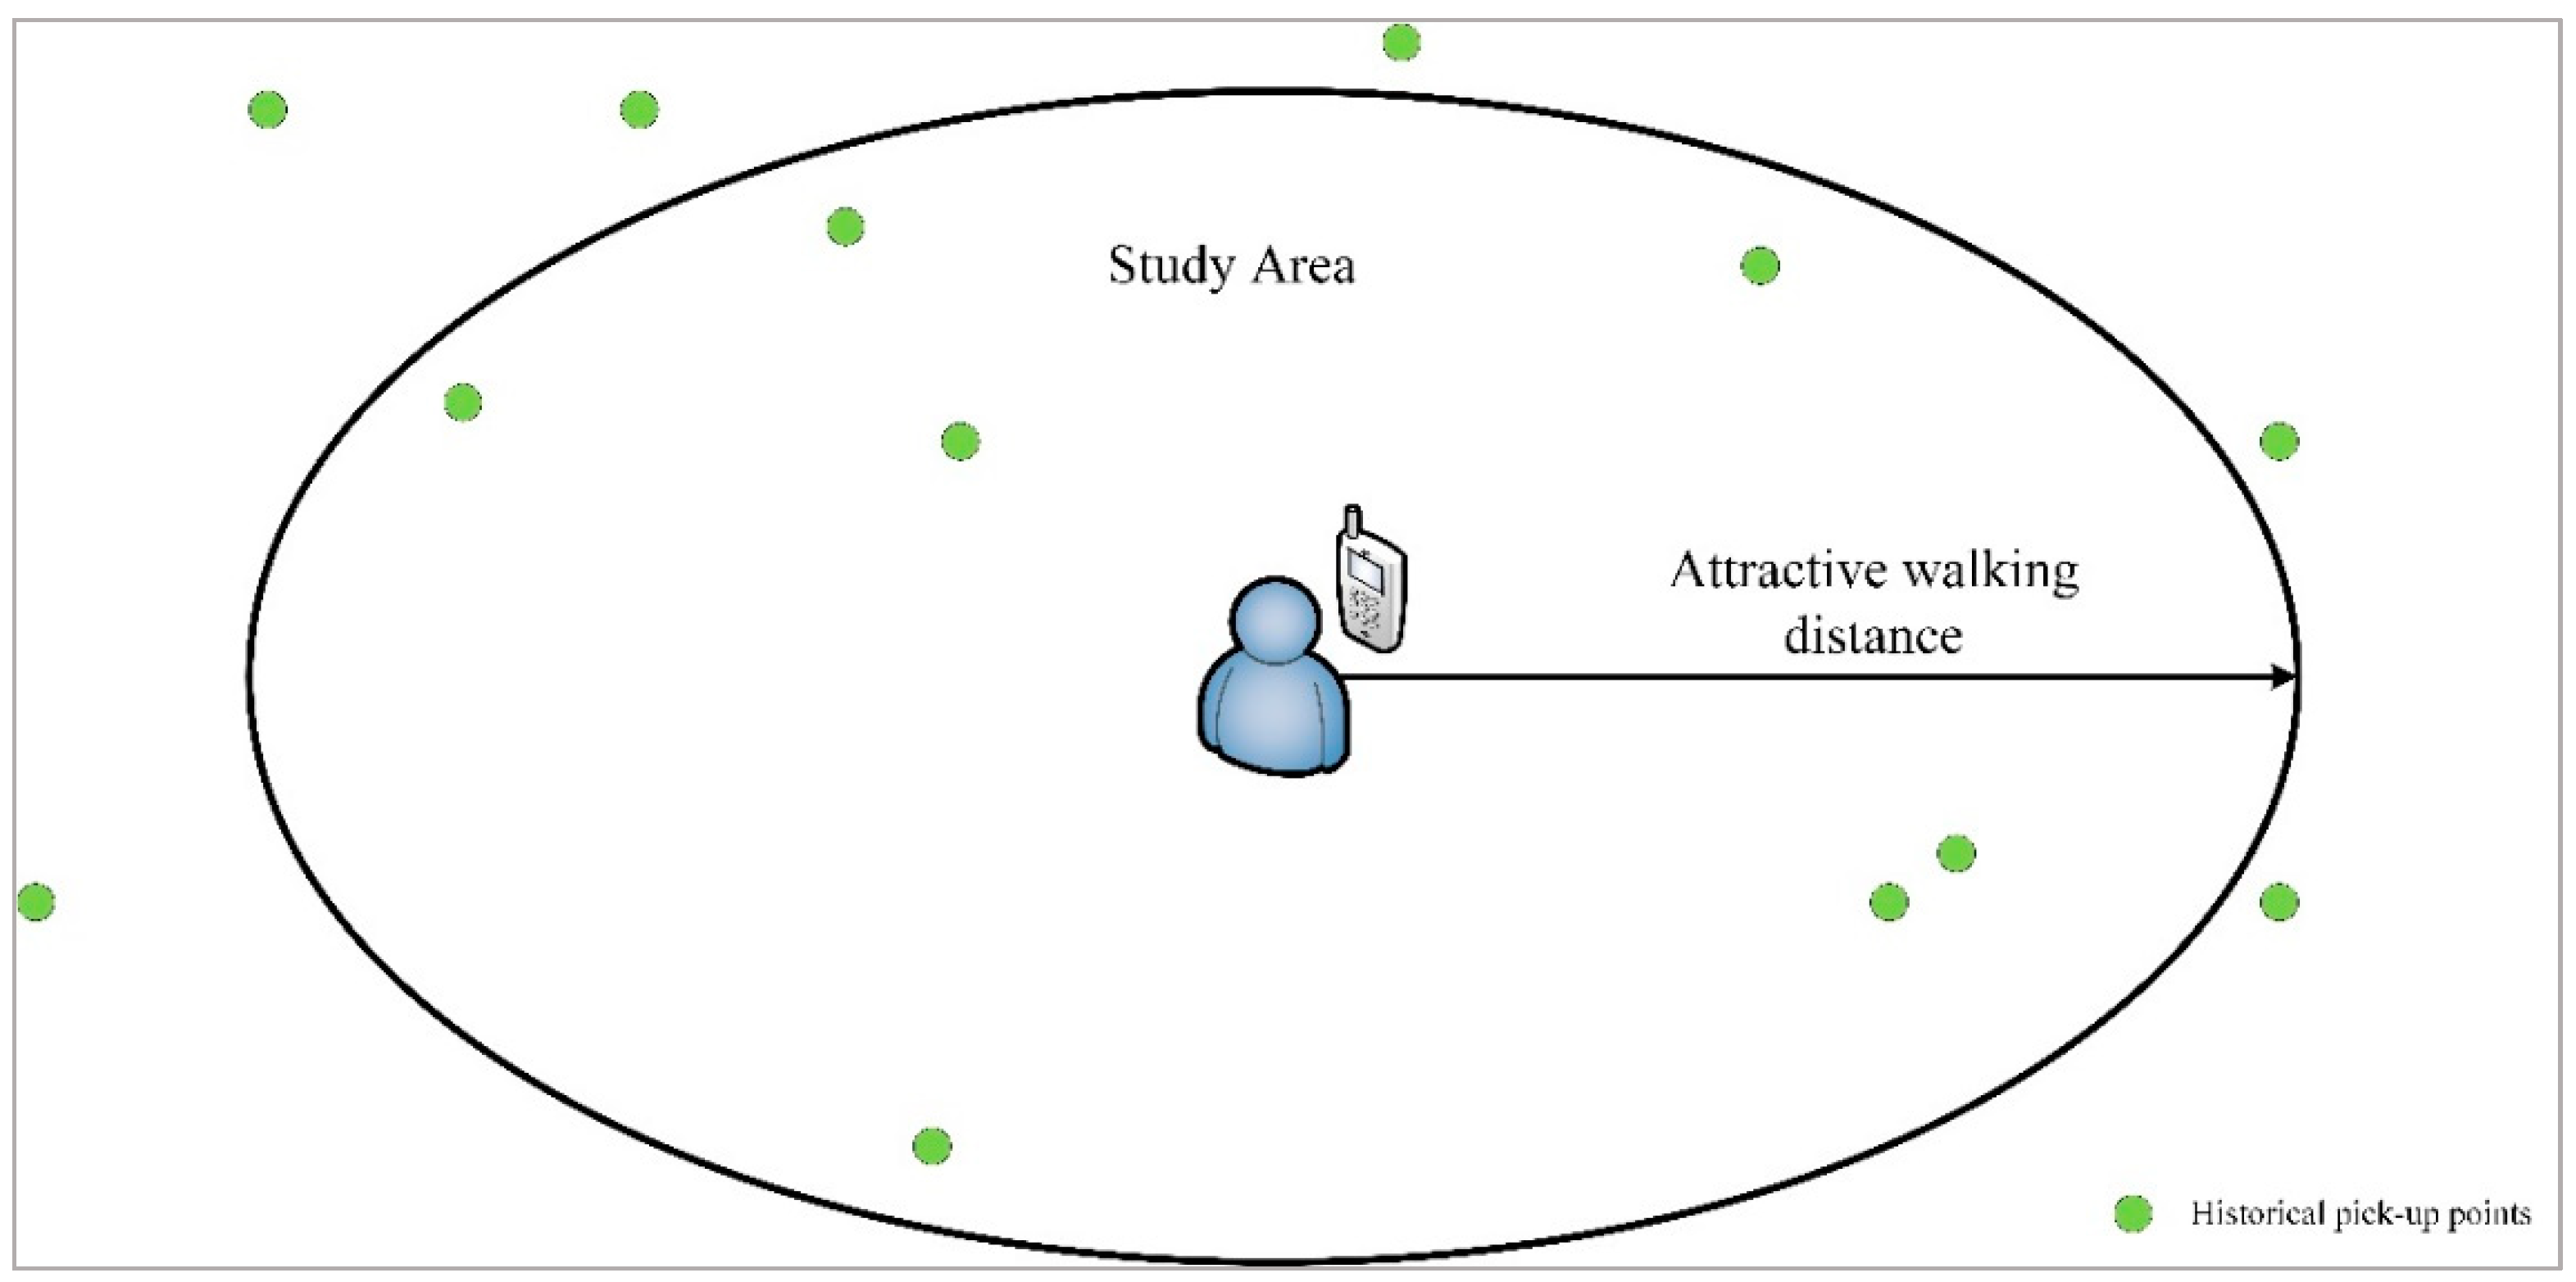
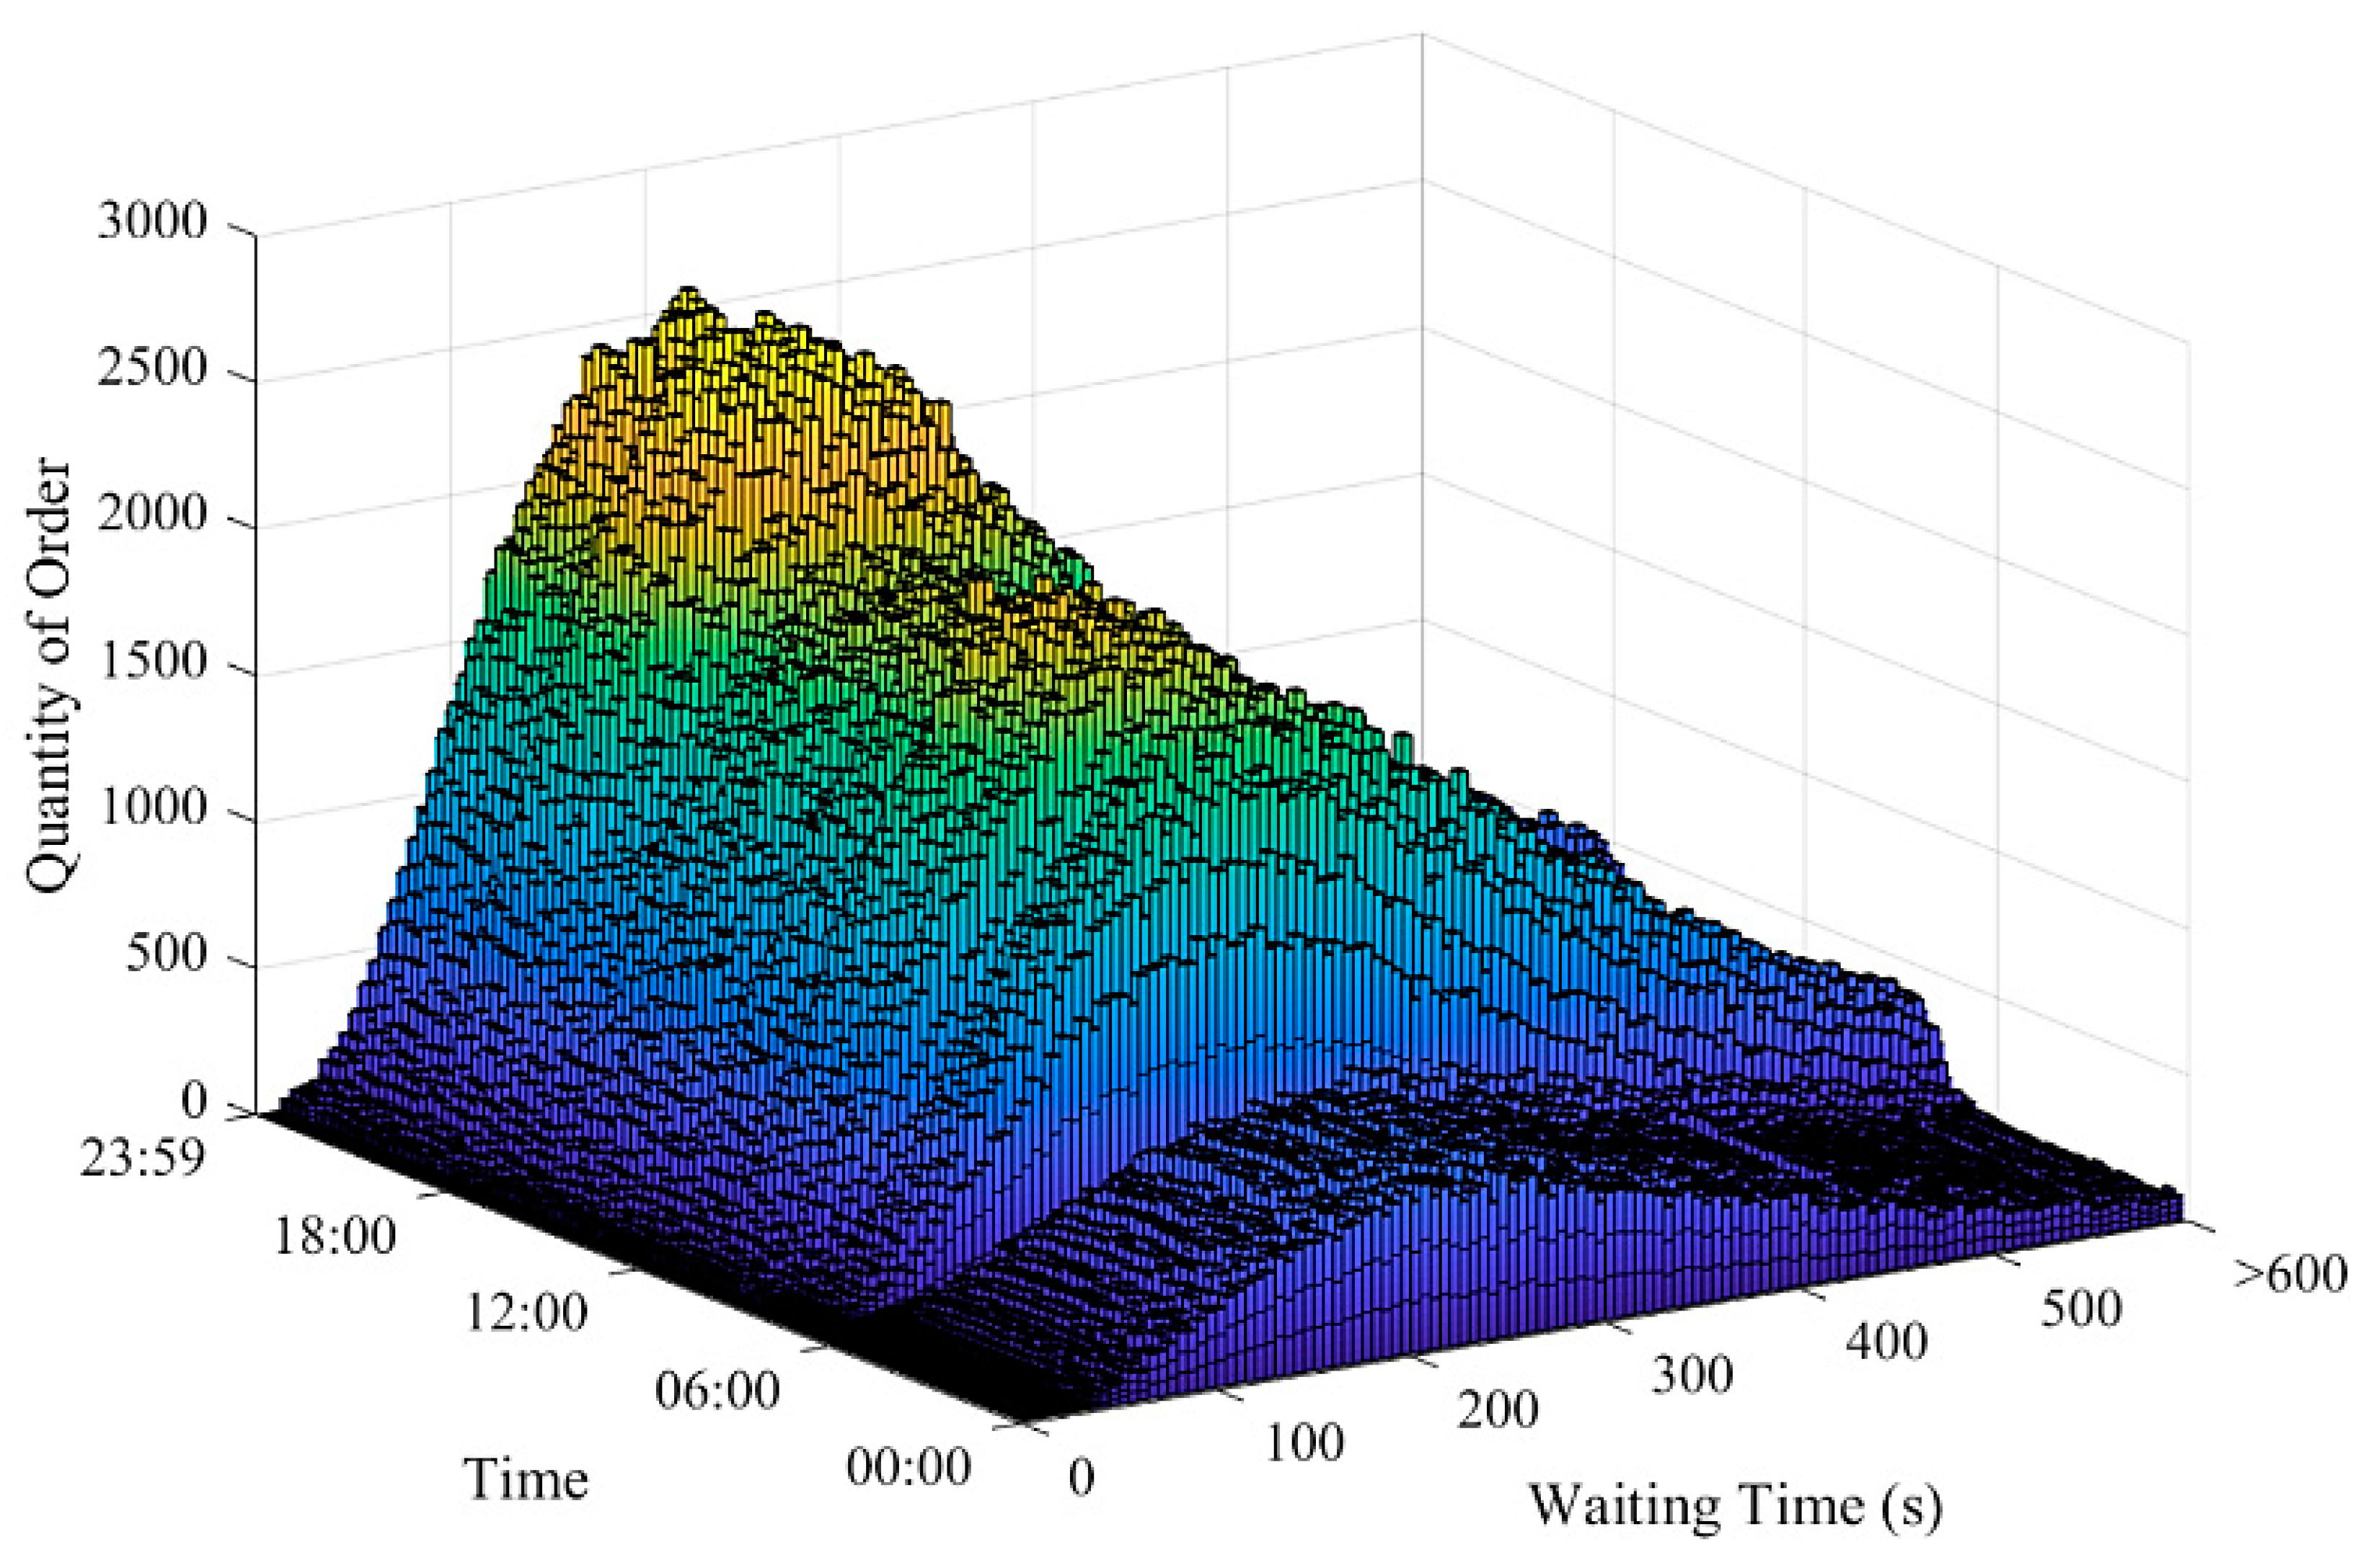
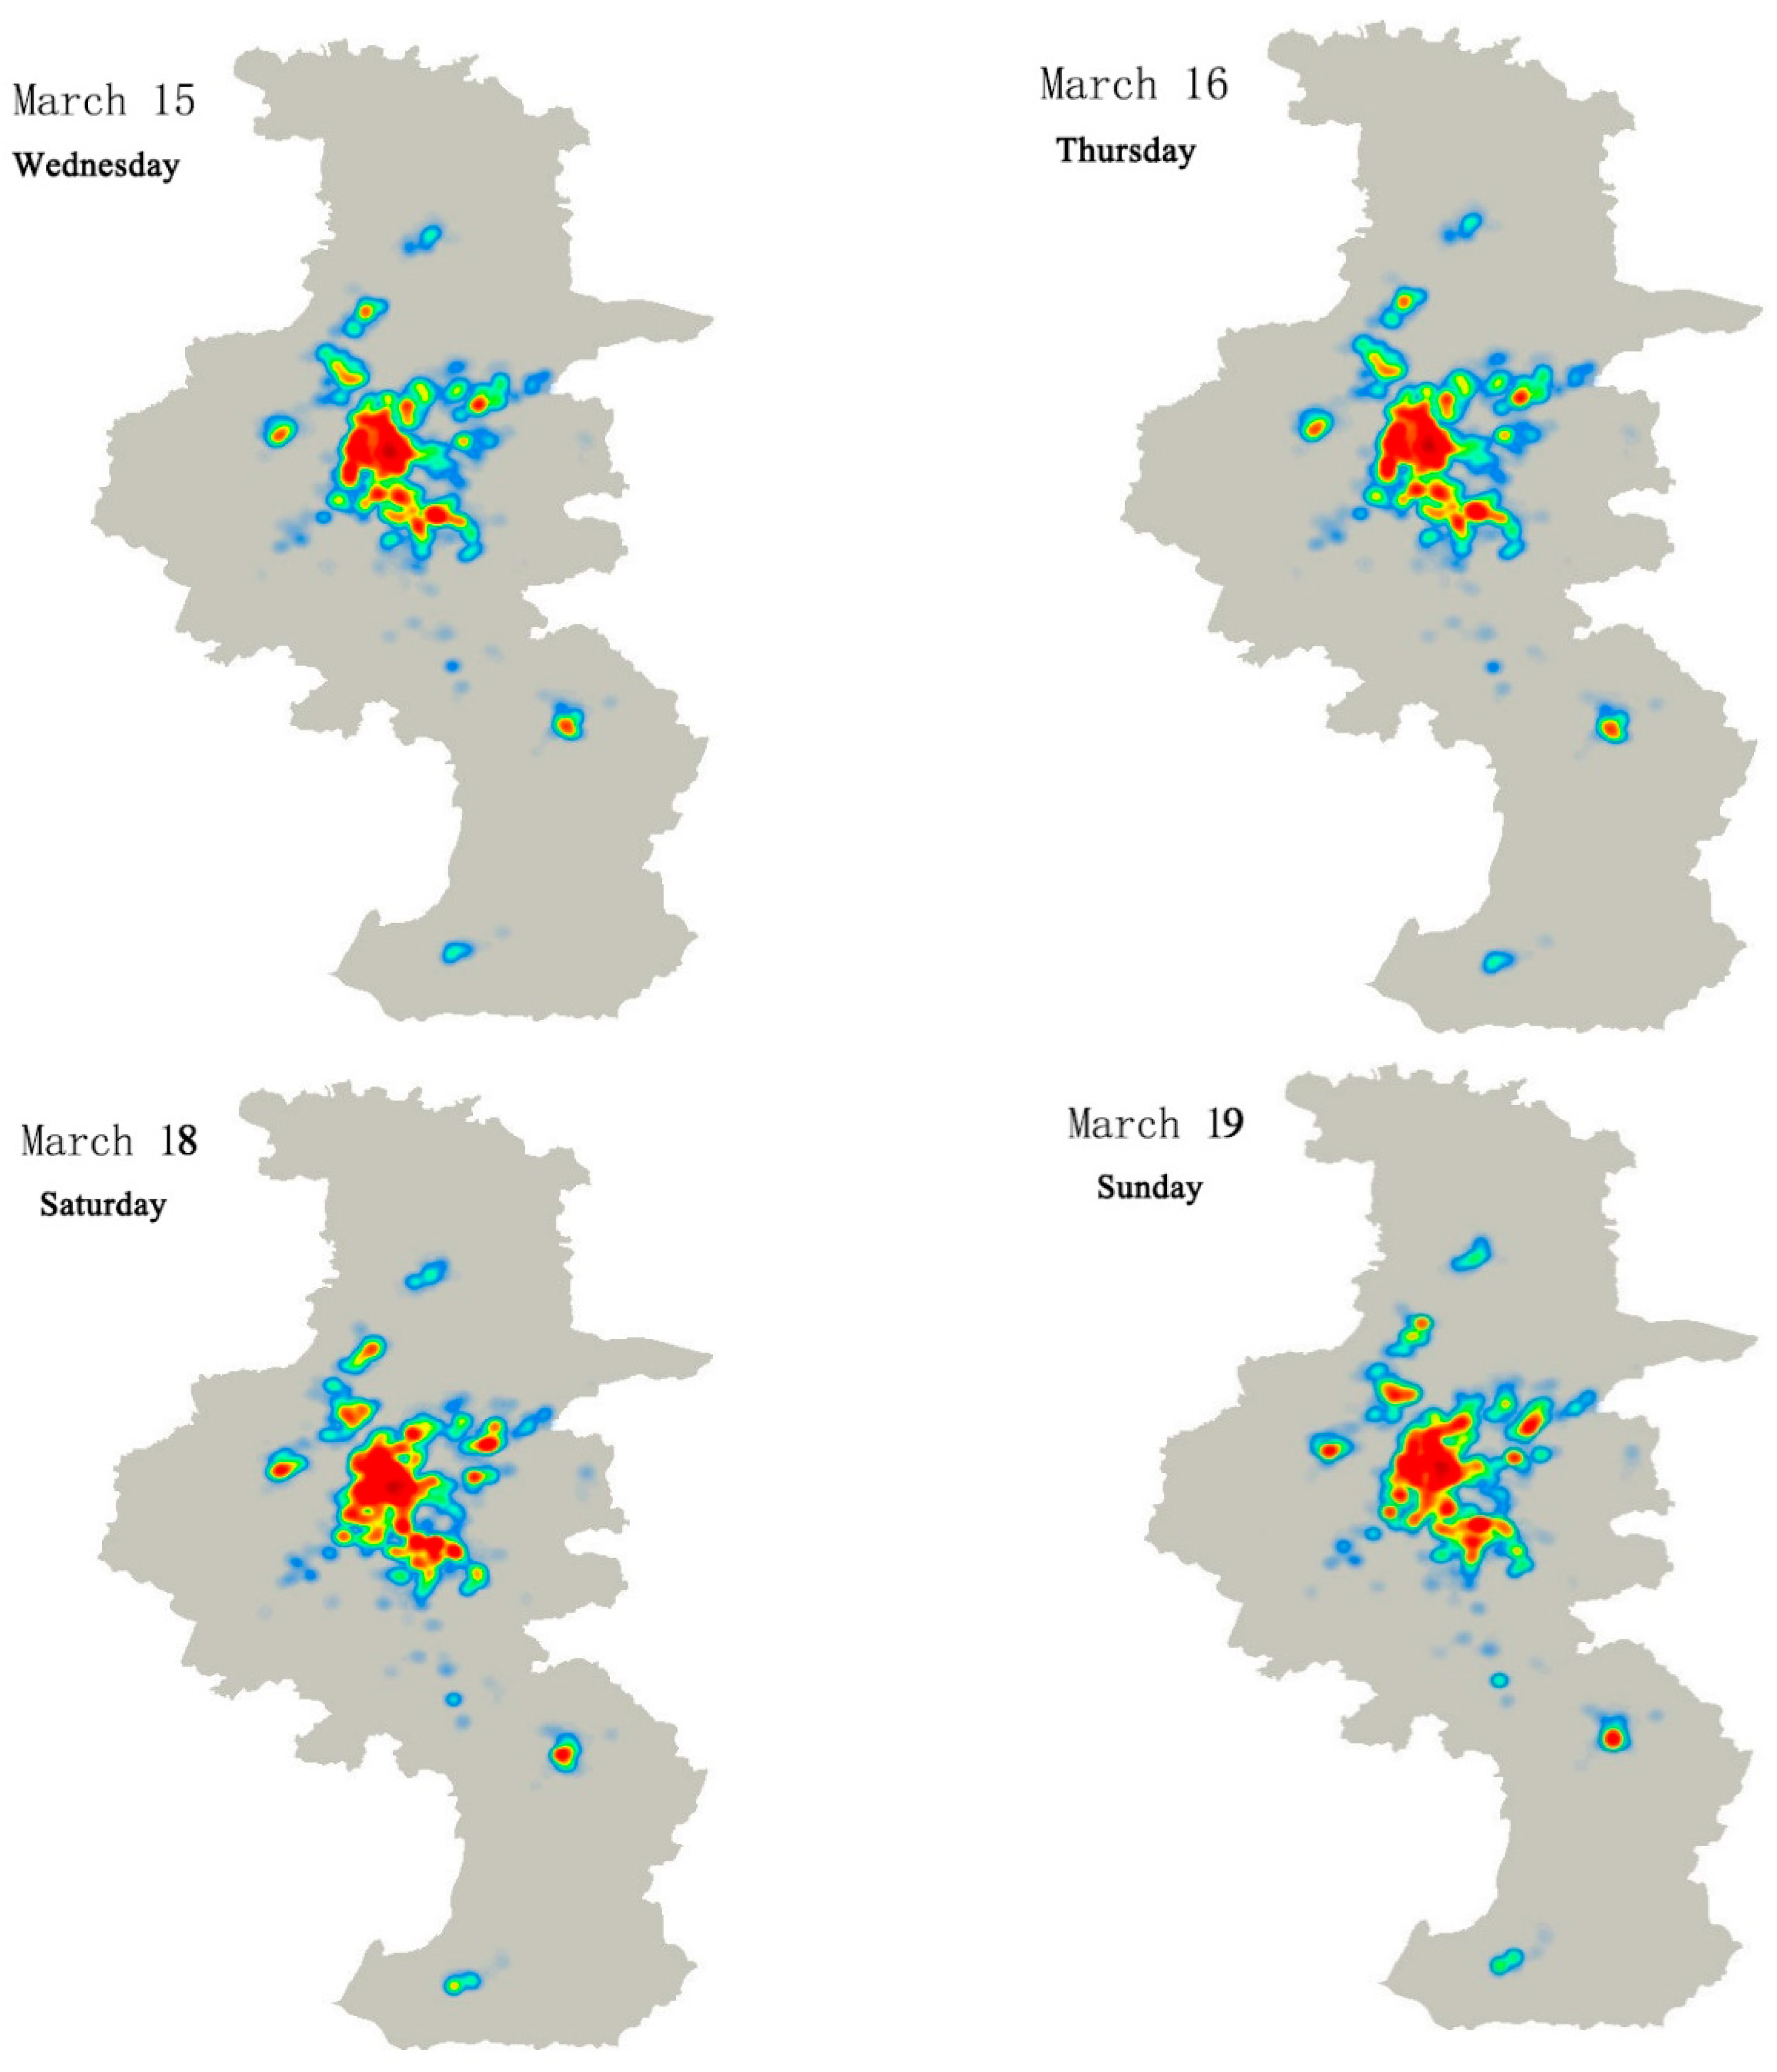
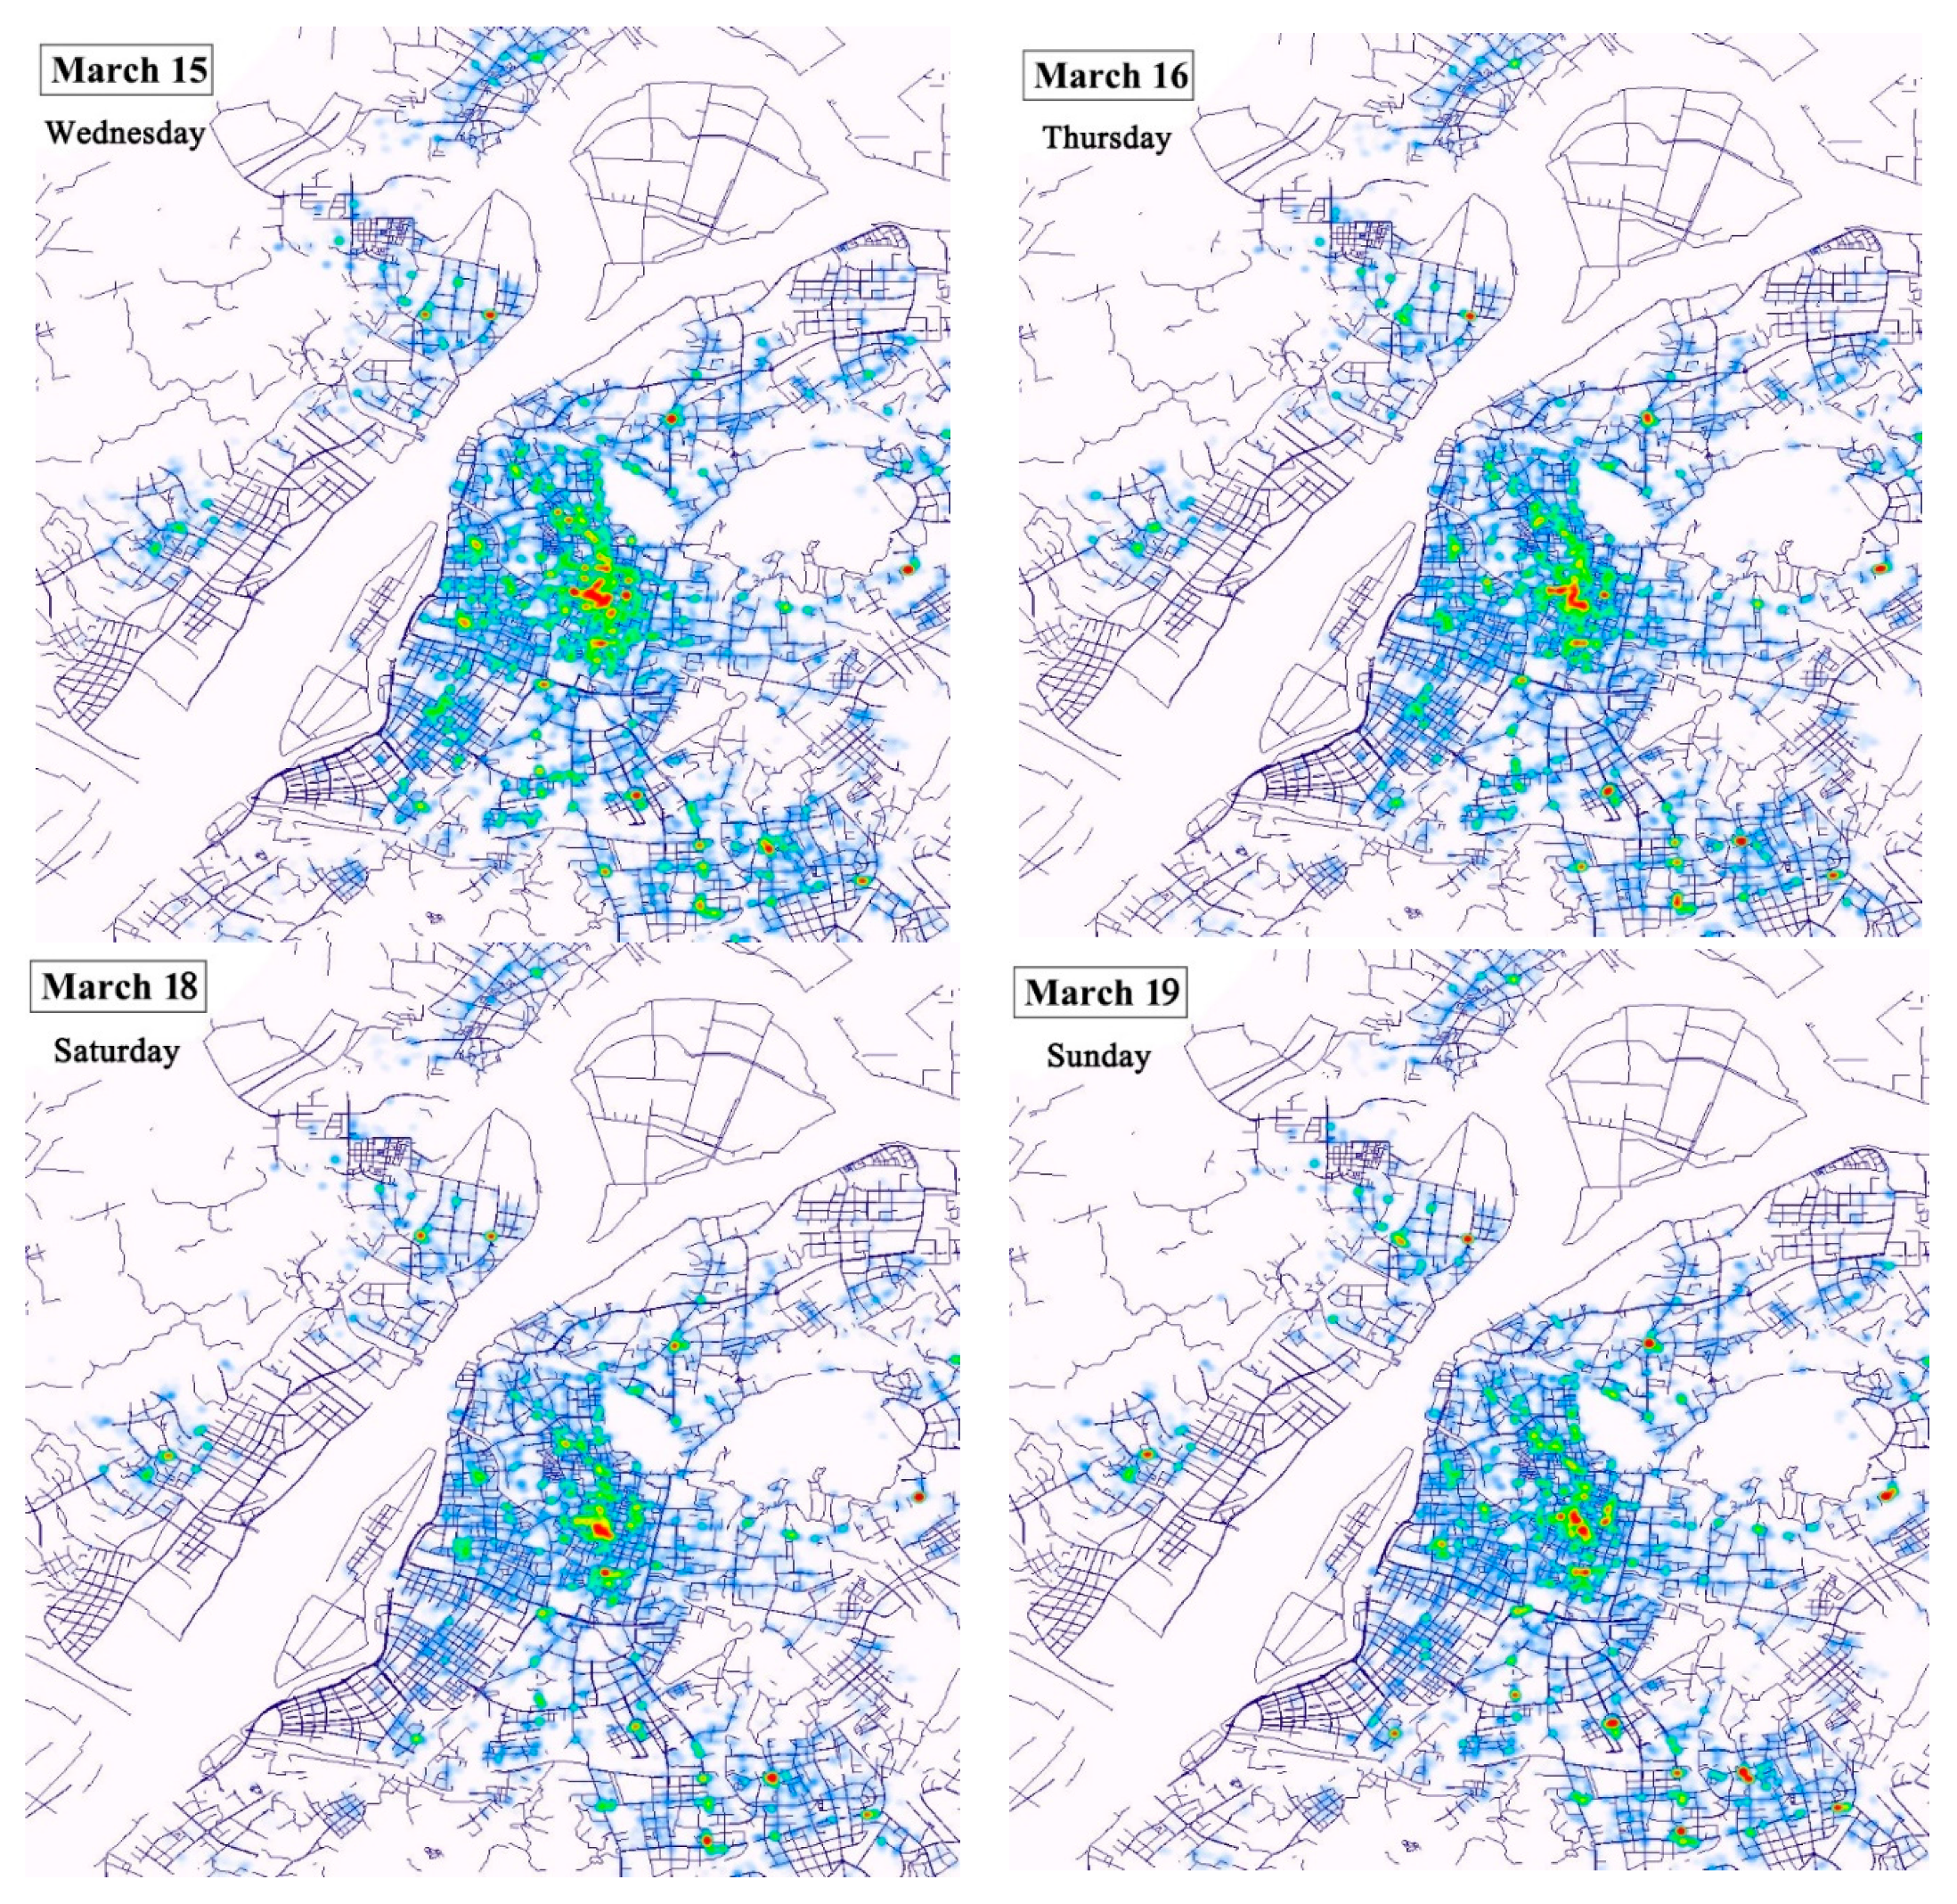
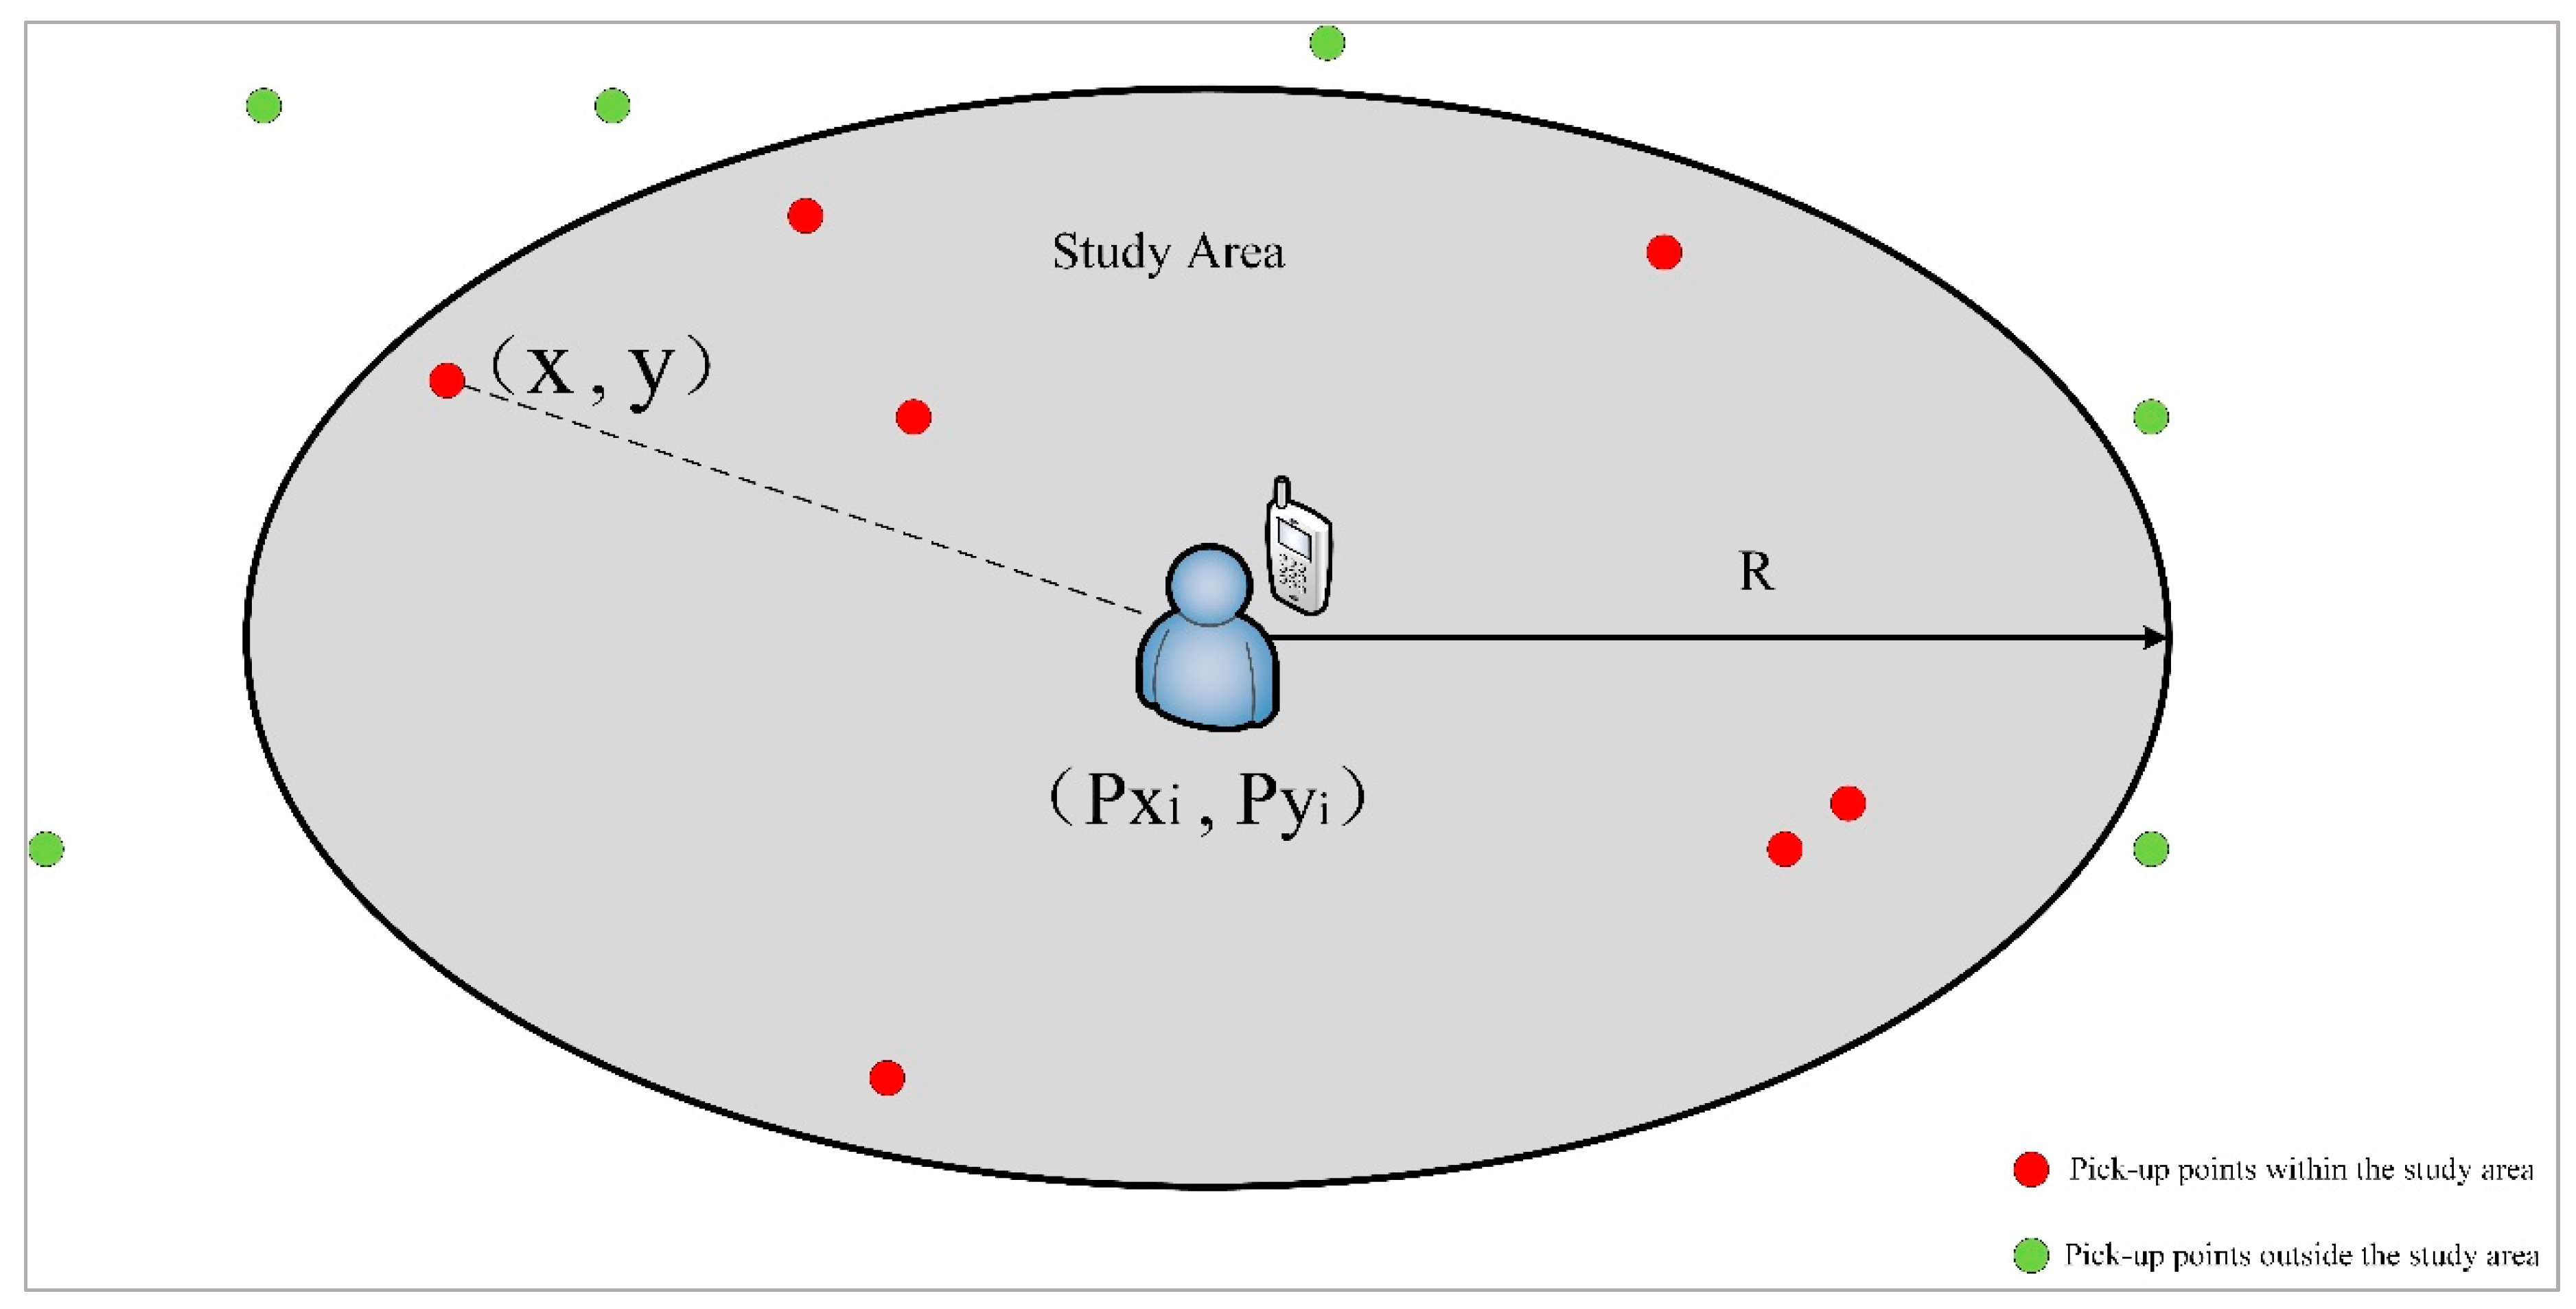
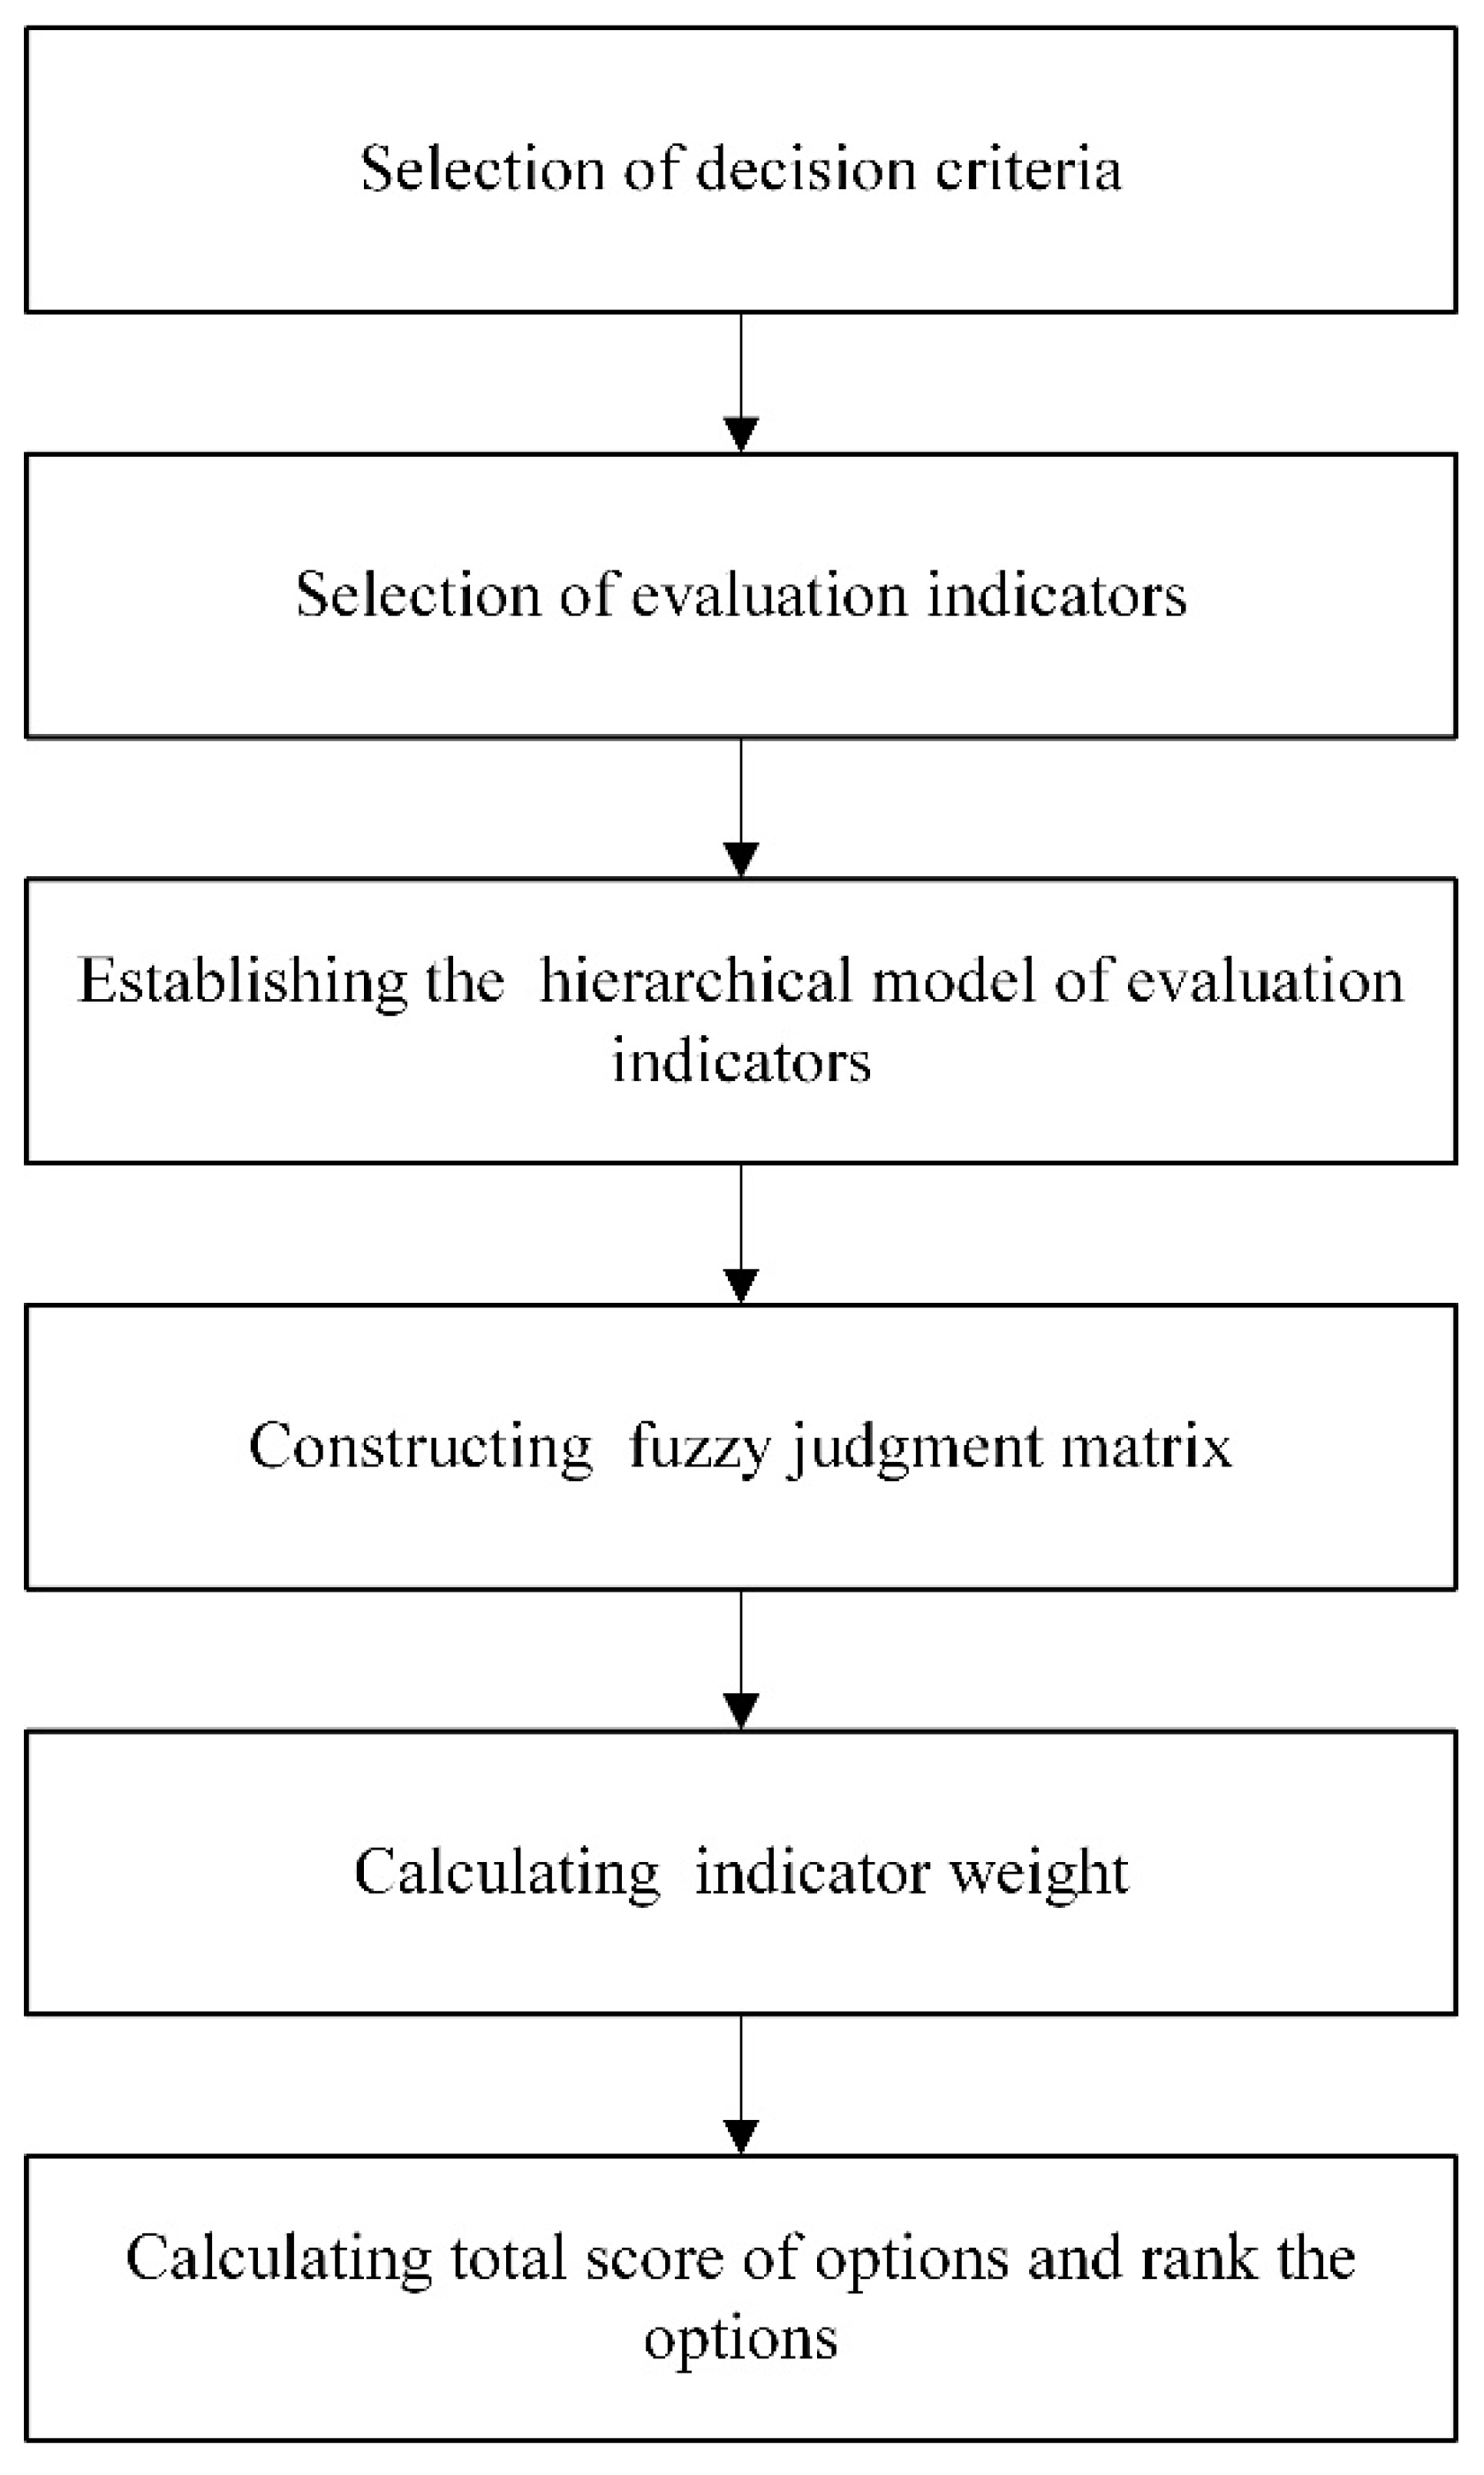
By using data mining tools such as ArcGIS, through the analysis and mining of taxi data, we can obtain hot spots for taxi rides, so as to provide solutions for the first two problems. For the third question, we try to study the waiting time that riders can tolerate as the upper limit of their walking time. Consequently, the research scope of recommended pick-up point is determined. The fourth question can be split into two questions: which traffic conditions will affect the location setting of pick-up points, and how do we choose the best pick-up point under multiple criteria? Evaluation under multiple criteria needs to be implemented by means of multi-criteria decision making methods.
Multi-criteria decision making (MCDM) is concerned with structuring and solving decision and planning problems involving multiple criteria. It can be implemented by various techniques such as weighted sum method (WSM), weighted product method (WPM), analytical hierarchy process (AHP), preference ranking organization method for enrichment evaluation (PROMETEE), elimination and choice expressing reality (ELECTRE), technique for order preference by similarity to ideal solutions (TOPSIS), compromise programming (CP), and muti-attribute utility theory (MAUT) [2]. Among these methods above, AHP, originally developed by Saaty, is the most popular method and the most widely-used multi-criteria tool [3]. The basic idea of AHP is to construct a pairwise comparison matrix to determine the weight of each criterion. Because AHP is theoretically complete, structurally rigorous, and simple in solving problems, it has been widely used in various industries. However, the biggest problem with AHP is its inability to adequately handle the inherent uncertainty and imprecision associated with the mapping of the decision-maker’s perception to exact numbers [4]. In some cases, when experts consult, experts often give some amount of ambiguity (such as three-value judgment: the lowest possible value, the most likely value, the highest possible value). So the fuzzy number was introduced to improve AHP, and the fuzzy analytic hierarchy method (F-AHP) is proposed [5]. The significant advantage of F-AHP is that it combines the advantages of fuzzy and AHP to improve the reliability of decision making. It can also greatly reduce the number of iterations, increase the convergence speed, and meet the calculation accuracy requirements. In the literature, several approaches to fuzzy analytical hierarchy process (F-AHP) have been proposed by various authors. Van Laarhoven and Pedrycz proposed a method in which elements in the reciprocal matrix were expressed by triangular fuzzy [6]. Chang used triangular fuzzy numbers for the pairwise comparison scale of fuzzy AHP and extent analysis for the synthetic extent values of pairwise comparisons [7]. Mikhailov proposed a new Fuzzy Programming Method, based on a geometrical representation of the prioritization process [5]. Li changed the reciprocal judgment matrix to the fuzzy consistency judgment matrix. The improved method does not need to carry out the consistency test, but also can greatly reduce the number of iterations and improve the convergence speed [8]. Actually, F-AHP has been widely used in multiple criteria evaluation and group decision making processes [9]. Kulak and Kahraman dealt with a multi-attribute transportation company selection for effective supply chain using both fuzzy multi-attribute axiomatic design and F-AHP [10]. Hu et al. developed a sustainability evaluation framework for PSS with application of fuzzy Delphi and F-AHP method to settle the consistency of criteria and determine relative weights of the selected criteria [11]. Onden [12] focused on a multi-stage methodology that combines the F-AHP, spatial statistics and analysis approaches to evaluate the suitability degrees of the logistics centers in the study area. To cover the shortages of existing research, this paper proposes a novel approach to selecting recommended pick-up points. The setting of this virtual online taxi station will facilitate the meeting between rider and driver. More importantly, previous studies have neglected the impact of actual traffic conditions on the setting of pick-up points. Our approach ensures that the recommended pick-up point is compatible with the traffic environment. The study objectives are:
1. 
To analyze the characteristics of ridesourcing demand utilizing GIS and Big Data Analysis Technology.
2. 
To do some research on ridesourcing users’ attractive walking distance in order to delimit the research area of the “recommended pick-up point”.
3. 
To apply the F-AHP method to comprehensively consider various types of traffic conditions to select the recommended pick-up point that best matches the actual traffic environment.
Section 2 describes the spatial data collected and proposes a method and procedure for determining the recommended pick-up point, while Section 3 discusses the experimental results of our approach and verifies the effectiveness and operability of the method this paper adopted. Major conclusions and future work are then discussed in Section 4 and Section 5.

2. Data and Methods

The research idea of this paper is to analyze the characteristics of accessing distance that people can bear according to a large number of travel data, and to identify the taxi pick-up hotspot area in this range as candidate pick-up points. Then, based on the multi-standard decision-making method, the candidate points were evaluated by comprehensively considering various road traffic factors, and the ranking results of the candidate pick-up points were determined. The overall step flow chart is shown in Figure 1.

2.1. Data Preparation

For the purposes of this research, we obtained the data from DiDi Chuxing [1] of Nanjing. The dataset was collected between 1 March 2017 and 31 March 2017 with approximately 250 thousand records per day. The data include:
1. 
A dataset of pick-up location and pick-up time
2. 
A time dataset for order generation and cancellation
3. 
Points of interest and road network information of Nanjing
The raw dataset includes many fields, such as ID, DATE, TIME, LON, LAT. The details on every taxi trip are shown in Table 1. “ID” refers to the number of each order. “DATE1” and “TIME1” refer to the time when the rider gets on the taxi. “LON1” and “LAT1” refer to the latitude and longitude of pick-up points. “DATE2” and “TIME2” refer to the time when the rider arrives at their destination. “LON2” and “LAT2” refer to the latitude and longitude of destination. According to this dataset, we can get the location of taxi pick-up points in Nanjing in March 2017.
In addition, we obtained order generation and cancellation data from DiDi Chuxing [1], as shown in Table 2. “DATE1” and “TIME1” refer to the time when the rider places a taxi order. “DATE2” and “TIME2” refer to the time when the order ends. “DATE3” and “TIME3” refer to the time when the order starts to be billed. In “DATE3” column, there are some outliers such as 0000-00-00, and the corresponding value in “TIME3” is 0:00:00. This means that the order did not take effect and was cancelled. According to this dataset, we can get the time distribution of the rider waiting for the driver.
We also obtained a detailed map of Nanjing and a huge number of points of interest (POI), as shown in Figure 2 and Figure 3. The types of POI include bus stations, commercial buildings, residential quarters, etc. The electronic map also contains information on Nanjing’s basic road network, including subways, urban roads, and township roads.

2.2. Determination of Study Area

If we want to attract a rider to a designated pick up location, the position should not exceed a certain distance from the rider’s current position. In this paper, we did some research on the attractive walking distance to help us determine the scope of the study area. Figure 4 shows how to determine the scope of the study based on the walking distance threshold.

2.2.1. Characteristics of Rider’s Waiting Time

By processing data of connection time (time intervals from placing the order to the rider be picked up), we get the distribution characteristics of riders’ waiting times per session, per day.
As Figure 5 shows, although the quantity of orders varies, the distribution of waiting time is roughly the same, and the peaks are all concentrated around 200 to 300 s for each period of the day. The number of orders has decreased significantly after 400 s.

2.2.2. Tolerable Waiting Time Distribution

By processing data of the time interval for order cancellation, we get the distribution of waiting time that riders can tolerate, as shown in Figure 6.
Because more than 80% of drivers canceled their orders after waiting for 400 s, we use 400s as a waiting time threshold that riders can tolerate considering the amount of data is sufficient.
Assuming that rider and driver arrive at the recommended pick-up point at the same time, the time taken by the rider from the current position to the pick-up point should not be greater than the threshold value obtained above. The walking speed of adults is generally 4–5 km/h [13], which is 4.5 km/h in this paper, and the time threshold “400 s” can be converted to a walking distance threshold of 400 × 4.5/3.6 = 500 m.
Therefore, for the recommended pick-up point in this study, the research radius is 500 m.

2.3. Characteristics of Taxi Demand

In the monthly taxi records, we randomly selected the taxi records of two working days and two weekends for comparison. We found that the distribution of hot spots has certain regularity.
As can be seen from Figure 7 and Figure 8, ridesourcing demands have spatially aggregated characteristics and their distribution is relatively fixed. Travelers within the hot region have maintained a much higher demand than those in non-hot areas. Therefore, it is a priority to set up recommended pick-up points in the hot spots of ridesourcing in order to meet travel needs to a maximum degree.

2.4. Selection of Candidate Pick-Up Points

Based on the above-mentioned walking attraction radius, hot spot analysis is performed within this distance range. Assume that the longitude and latitude of the user’s current location is ( P x i , P y i ) , and use it as the center of the circle, according to the distance calculation method between the latitude and longitude coordinates, the study area can be expressed as:
R e a r t h arccos ( sin y sin P y i cos ( x P x i ) + cos y cos P y i ) 180 π R
R e a r t h   = 6371 km (earth radius)
x = the longitude of the historical pick-up point
y   = the latitude of the historical pick-up point
P x i   = the longitude of the rider’s current location
P y i   = the latitude of the rider’s current location
R   = the radius of the study area (study area is considered to be a circle centered on the rider’s current point).
The formula acts as a filter. If the distance between a historical pick-up point and the rider is greater than R, the point will be excluded, leaving only the historical points that are less than R from the rider. Figure 9 shows how this formula works.
After screening out the pick-up points in the area, we conducted hotspot analysis on all historical points in this range, and obtained the historical pick-up hotspots within the range that riders are willing to walk. According to the data observations in Section 2.3, the location where the taxi demand is most concentrated is considered as the most convenient place to get on. Select one point in each cluster as a potential pick-up point.

2.5. Evaluation of Candidate Pick-Up Points

A F-AHP [8] method is utilized to integrate various traffic factors to evaluate candidate pick-up points. As shown in Figure 10, the method includes six basic steps.

2.5.1. Selection of Decision Criteria

In order to minimize the impact on traffic management caused by the inefficient joint mode of ridesourcing services, the following criteria should be addressed when selecting a site. First, locations recommended to the users must be compatible with the surrounding road conditions. In other words, do road conditions permit the setting of recommended pick-up points? Second, accessibility of site location directly affects the willingness of riders and drivers to go to the recommended site. Is it convenient for riders and drivers to get here? Additionally, ridesourcing service must be coordinated with other modes of transportation. In our opinion, more recommended pick-up points should be set up in places where buses and rail transit are not convenient. Therefore, (1) Compatibility (2) Accessibility (3) Coordination are selected as the decision criteria of this system.

2.5.2. Selection of Evaluation Indicators

According to the above decision criteria, we selected 10 evaluation indicators for analysis. Each of them is related to the decision criteria. In our opinion, factors such as the lane setting of the road, whether the road is conducive to parking, whether the road is congested, and whether there is a significant sign at the agreed location, all have a lot to do with the setting of the recommended pick-up point. In addition, we also considered the coordination between ridesourcing services and public transportation. The specific indicators are shown in Table 3, the impact mechanism of each indicator factor on the location selection of recommended pick-up point is explained in the Interpretation column.

2.5.3. Establishment of Hierarchical Model

Based on the factor analysis above, four layers of the structure were established, including the objective layer (A), criteria layer (D), indicators layer (I) and options layer (O). The objective layer represents the main goal of the decision system, which is the optimal location of recommended pick-up point. The criteria layer represents the three main criteria, which emphasize Compatibility ( D 1 ), Accessibility ( D 2 ) and Coordination ( D 3 ). The indicator layer includes the 10 indicators ( I 1 ~ I 10 ). Figure 11 displays the hierarchy system of the selected indicators to evaluate recommendation options.

2.5.4. Construction of Fuzzy Judgment Matrix

To rate the indicators, a set of fuzzy judgment matrix (n × n) was constructed for each of the lower levels with one matrix for each element in the level immediately above it. The fuzzy judgment matrix of complementary model F = ( f i j ) n × n is established by means of three-scale method [8] (Table 4):
f i j = { 0.5 ,   s ( i ) = s ( j ) 1 ,   s ( i ) > s ( j ) 0 ,   s ( i ) < s ( j )
where, s ( i ) and s ( j ) respectively represent the relative importance of each two factors.
For the criteria ( D 1 , D 2 , D 3 ) and indicators ( I 1 ~ I 10 ), the relative levels of importance were analyzed using expert scoring method. We invited eight professors from Southeast University and two management personnel of Didi Chuxing [1] who have in-depth research in this field to determine the relative importance of each indicator. The pairwise comparison matrix for all the indicators is shown in Table 5.

2.5.5. Calculation of Indicator Weight

According to the F-AHP method provided by Li [8], with aid of software for statistics and data science (STATA), the weight values of the indexes are calculated as shown in Table 6.

2.5.6. Calculation of Total Score

The weight of each option O j for indicator I i is w j i . Total weights of the indicators and the total score of the options were determined as following steps:
(a)
Calculate the total weight of I i :
w i = w I i × w D i
(b)
Calculate the total score of O j :
w j = i = 1 10 w i × w j i

3. Case Study

Suppose a rider places an order at 11 a. m, hoping to get the recommended pick-up point.
Step 1. Determine the study area and identify candidate points
According to the introduction in Section 2.2.2, the circular area with a radius of 500 m and the rider’s position as the center of the circle was selected as the research area. As Figure 12 shows, we use the historical taxi data to find the hotspots in the region and select the maximum density points as candidate pick up points.
Step 2. Comparison of different options using selected indicators
We surveyed six candidate points based on the ten selected evaluation indicators. The situation of each candidate point is shown in Table 7. We can see that the roads where O 1 and O 2 are located are the widest. The parking policy on the road where O 2 is located is the most demanding. All roads are two-way. O 5 is closest to the rider and O 3 is the farthest away, but the gap is not particularly large. O 3 is the easiest to be recognized by passengers, while O 4 and O 6 are less recognizable. In terms of road congestion, the roads where O 3 , O 4 and O 5 are smoother. The public transportation of the roads where O 1 , O 2 , , O 3 and O 4 are located are relatively more powerful.
Step 3. Determine the option layer weight and calculate the total score
List all levels of fuzzy judgment matrices, detailed matrices are all attached in Appendix A. Calculate the weight of each indicator based on the listed judgment matrix using the weight calculation method introduced in 2.5.6. The single weights of the option layer are shown in Table 8. The final weight values for each indicator calculated according to Equations (3) and (4) are shown in Table 9.
Step 4. Analysis of the experiment result
The final recommendation order of the experiment as shown in Figure 13 is: O 5 > O 3 > O 4 > O 6 > O 1 > O 2 . It can be seen from the results that although O 1 and O 2 are closer to the rider than O 3 and O 4 , the road where O 1 and O 2 are located is too crowded to facilitate parking and therefore are not recommended as a priority. The experimental result shows that, from the point of view of traffic management, the method designed in this paper can obtain the ideal recommended pick-up point sorting result.

4. Discussion

At present, there are still some problems with the research. The determination of the walking distance threshold still requires further optimization. When calculating the walking distance threshold, we rely on a large amount of data to get the value 500m. But obviously 500 m is a bit too far away in many cases. The orography of the terrain, the non-linear coefficient of the road network, and the weather all greatly influence the selection of the walking distance threshold. Imagine that on rainy and sunny days, the places people are willing to wait for are definitely different, and the time people are willing to wait will change. These all suggest to us that this online recommended pick-up point can actually change according to the dynamic changes of traffic and environmental conditions. That is, the recommended settings for the pick-up point can be more maneuverable and more flexible. In the future, we will focus on using more advanced and batch methods to improve this function. It should also be noted that this article does not consider the impact of riders’ destinations on the choice of pick-up point, which will be one of our future research contents. In addition, the collaborative filtering algorithm can also achieve the goal of recommending the pick-up point, but its method and concept are not exactly the same as this article. Whether the final recommendation results of these two methods are similar or not needs further study.

5. Conclusions

When using a ridesourcing service, a common problem is that drivers and riders cannot meet quickly. At present, most cities in China do not allocate stations for ridesourcing services, which makes people not sure where to find their taxis quickly. The construction of a taxi stop also requires funds and space. To save riders’ travel time, DiDi and other travel solution proposed a new way of ridesourcing based on advising riders to meet drivers at recommended pick-up point, an on-line designated joint point. The setting of the recommended pick-up point can greatly improve the efficiency of the meeting between the rider and the driver. It is a very meaningful way of transportation service. However, the current recommendation methods are based only on cluster analysis of historical pick-up data, while ignoring the match with actual traffic conditions. There are often cases where the recommended pick-up point is located on a road that is congested, single-line or no-parking, causing trouble for the confluence of riders and drivers, and is not conducive to the management of traffic order in the city.
This decision process developed in this study aims to find the recommended pick-up point in a novel manner to improve the shortcomings of current methods. In order to delineate the research area of the recommended pick-up point, we conducted a research on the user’s attractive walking distance and obtained a threshold value of 500 m. We conducted hotspot analysis on the historical pick-up points within the study area, and then obtained several candidate pick-up points. In addition to hotspot analysis of historical taxi data, this paper comprehensively considers a variety of traffic factors that affect the location selection of the virtual sites. We fully considered the influence of pick up behaviors on the road traffic and proposed a process to specify the recommended pick-up point from the perspective of facilitating traffic management, which is based on a large number of DiDi data. F-AHP method, a kind of multi-criteria decision making method, was utilized to combine multiple traffic factors to evaluate and rank the candidate points. In this way, once the recommended pick-up point is put into use, the impact on road traffic will be minimized.
The important contribution of this paper is that we proposed a process for selecting the recommended pick-up point, which can act as an online virtual station. More importantly, compared with the existing methods, our method pays more attention to making the pick-up point settings compatible with actual traffic conditions. To the best of our knowledge, there are few papers on improving ridesourcing service from the perspective of traffic management, and our study fills that gap.

Author Contributions

Conceptualization, W.Z.; methodology, W.Z.; resources, Y.Y.; writing—original draft preparation, W.Z.; writing—review and editing, J.L. and Y.L.; visualization, W.Z. and Y.L.; supervision, J.L.

Funding

This work was supported by the National Natural Science Foundation of China (No. 51478110). Science and technology program of Jiangsu province (No.BY2016076-05). Guangxi key research and development program (Grant No. GuiKe AB16380280). National Natural Science Foundation of China (No. 51478112).

Conflicts of Interest

The authors declare no conflict of interest.

Appendix A

Fuzzy judgment matrices of option layer elements (O1 ~ O6) for each element in the level immediately above it (I1 ~ I10).
I1O1O2O3O4O5O6
O10.50.510.510.5
O20.50.510.510.5
O3000.5010
O40.50.510.510.5
O500000.50
O60.50.510.510.5
I2O1O2O3O4O5O6
O10.5100.500.5
O200.50000
O3110.5101
O40.5100.500.5
O511110.51
O60.5100.500.5
I3O1O2O3O4O5O6
O10.50.50.50.510.5
O20.50.50.50.510.5
O30.50.50.50.510.5
O40.50.50.50.510.5
O500000.50
O60.50.50.50.510.5
I4O1O2O3O4O5O6
O10.510101
O200.51001
O3000.5000
O40110.501
O511110.51
O6001000.5
I5O1O2O3O4O5O6
O10.50.50.5111
O20.50.50.5111
O30.50.50.5111
O40000.510.5
O500000.50
O60000.510.5
I6O1O2O3O4O5O6
O10.50.50000
O20.50.50000
O3110.50.50.51
O4110.50.50.51
O5110.50.50.51
O6110000.5
I7O1O2O3O4O5O6
O10.50.50000
O20.50.50000
O3110.50.50.51
O4110.50.50.51
O5110.50.50.51
O6110000.5
I8O1O2O3O4O5O6
O10.50.51101
O20.50.51101
O3000.50.501
O4000.50.501
O511110.51
O6000000.5
I9O1O2O3O4O5O6
O10.500000
O210.50000
O3110.5100
O41100.500
O511110.51
O6111100.5
I10O1O2O3O4O5O6
O10.50.50000
O20.50.50000
O3110.50.500.5
O4110.50.500.5
O511110.51
O6110.50.500.5

References

  1. DiDi. Available online: https://www.didiglobal.com/ (accessed on 2 February 2019).
  2. Pohekar, S.D.; Ramachandran, M. Application of multi-criteria decision making to sustainable energy planning—A review. Renew. Sustain. Energy Rev. 2004, 8, 365–381. [Google Scholar] [CrossRef]
  3. Saaty, T.L. How to make a decision: the analytic hierarchy process. Eur. J. Oper. Res. 1990, 48, 9–26. [Google Scholar] [CrossRef]
  4. Tiryaki, F.; Ahlatcioglu, B. Fuzzy portfolio selection using fuzzy analytic hierarchy process. Inform. Sci. 2009, 179, 53–69. [Google Scholar] [CrossRef]
  5. Mikhailov, L.; Tsvetinov, P. Evaluation of services using a fuzzy analytic hierarchy process. Appl. Soft Comput. 2004, 5, 23–33. [Google Scholar] [CrossRef]
  6. Van Laarhoven, P.J.M.; Pedrycz, W. A fuzzy extension of Saaty’s priority theory. Fuzzy Sets Syst. 1983, 11, 199–227. [Google Scholar] [CrossRef]
  7. Chang, D.Y. Applications of the extent analysis method on fuzzy AHP. Eur. J. Oper. Res. 1996, 95, 649–655. [Google Scholar] [CrossRef]
  8. Li, Y.; Hu, X.H.; Qiao, J. An improved fuzzy AHP method. J. Northwest Univer. (Natural Science Edition) 2005, 35, 11–12. [Google Scholar]
  9. Qu, M.; Yu, S.; Yu, M. An improved approach to evaluate car sharing options. Ecol. Indic. 2017, 72, 686–702. [Google Scholar] [CrossRef]
  10. Kulak, O.; Kahraman, C. Fuzzy multi-attribute selection among transportation companies using axiomatic design and analytic hierarchy process. Inform. Sci. 2005, 170, 191–210. [Google Scholar] [CrossRef]
  11. Hu, H.A.; Chen, S.H.; Hsu, C.W.; Wang, C.; Wu, C.L. Development of sustainability evaluation model for implementing product service systems. Int. J. Environ. Sci. Technol. 2012, 9, 343–354. [Google Scholar]
  12. Önden, İ.; Acar, A.Z.; Eldemir, F. Evaluation of the logistics center locations using a multi-criteria spatial approach. Transport 2018, 1–13. [Google Scholar] [CrossRef]
  13. Rose, J.; Ralson, H.J.; Gamble, J.G. Energetics of walking. In Human Walking; Rose, J., Gamble, J.G., Baltimore, M.D., Eds.; Williams & Wilkins: Philadelphia, PA, USA, 1994; pp. 45–72. [Google Scholar]
Figure 1. Flow chart of method steps.
Sustainability 11 01097 g001
Figure 2. Electronic map of Nanjing.
Sustainability 11 01097 g002
Figure 3. Detail electronic map of Nanjing.
Sustainability 11 01097 g003
Figure 4. Schematic diagram of walking distance threshold.
Sustainability 11 01097 g004
Figure 5. Distribution of waiting time.
Sustainability 11 01097 g005
Figure 6. Decay curve of waiting time.
Sustainability 11 01097 g006
Figure 7. Global hotspot map.
Sustainability 11 01097 g007
Figure 8. Regional hotspot map.
Sustainability 11 01097 g008
Figure 9. Schematic diagram of screening the pick-up points in the study area.
Sustainability 11 01097 g009
Figure 10. Basic steps of the fuzzy analytic hierarchy method.
Sustainability 11 01097 g010
Figure 11. The hierarchical structure of site selection.
Sustainability 11 01097 g011
Figure 12. Candidate pick-up points.
Sustainability 11 01097 g012
Figure 13. Final recommendation results.
Sustainability 11 01097 g013
Table 1. The dataset of pick-up location and pick-up time.
IDDATE1TIME1LON1LAT1DATE2TIME2LON2LAT2
5662544773172252017/3/10:08:45118.75597332.083462017/3/10:32:42118.756232.08319
5679500771011512017/3/10:05:41118.86833731.318912017/3/10:10:11118.868231.31847
5649940351007292017/3/10:09:38118.77457632.061952017/3/10:17:35118.774632.06184
5679499905665152017/3/10:09:51118.78886832.058072017/3/10:41:13118.78932.05816
5638653203005452017/3/10:09:12118.74763932.222552017/3/10:13:40118.747432.22249
Table 2. The time dataset for order generation and cancellation.
DATE1TIME1DATE2TIME2DATE3TIME3
2017/3/10:13:492017/3/10:42:002017/3/10:17:23
2017/3/10:13:502017/3/10:14:240000-00-000:00:00
2017/3/10:13:302017/3/10:33:572017/3/10:26:07
2017/3/10:13:482017/3/10:13:550000-00-000:00:00
2017/3/10:13:302017/3/10:25:122017/3/10:16:42
2017/3/10:14:262017/3/10:40:292017/3/10:27:25
2017/3/10:13:582017/3/10:37:472017/3/10:24:53
2017/3/10:14:192017/3/10:31:102017/3/10:20:47
2017/3/10:14:512017/3/10:16:040000-00-000:00:00
2017/3/10:16:072017/3/10:16:300000-00-000:00:00
Table 3. Selected indicators for evaluation.
Decision CriteriaIndicatorInterpretation
Compatibility I 1 : Number of lanesThe number of lanes affects the temporary traffic pressure caused by parking
I 2 : Parking managementThe more relaxed the parking management policy, the more favorable it is for the driver to stop
I 3 : Traffic organizationIt is not recommended to set “recommended pick-up point” on a one-way street
Accessibility I 4 : Walking distanceThe distance from the rider to the designated pick-up point has a significant impact on the choice of pick-up point.
I 5 : Identification difficultyIt is best to have visible signs (bus stops, community entrance, landmarks) near the designated rendezvous point
I 6 : Road congestionDrivers are not advised to pick up riders on a crowded road
I 7 : Intersection congestionDrivers are not advised to pick up riders on a place near congested intersection
Coordination I 8 : Public transport stopsSince ridesourcing is a supplementary form of public transportation in China, in order not to compete for the development of public transportation, we believe that if public transportation is convenient somewhere, it is recommended not to set up a “recommended pick-up point”.
I 9 : The distance to the station
I 10 : Number of public transport lines
Table 4. Fuzzy judgment values for the fuzzy analytic hierarchy method.
Relative importanceDefinition
0Less importance
0.5Equal importance
1More importance
Table 5. Fuzzy judgment matrices for all indicators.
A D 1 D 2 D 3 D 1 I 1 I 2 I 3
D 1 0.511 I 1 0.500
D 2 00.51 I 2 10.51
D 3 000.5 I 3 100.5
D 2 I 4 I 5 I 6 I 7 D 3 I 8 I 9 I 10
I 4 0.510.51 I 8 0.500.5
I 5 00.500 I 9 10.51
I 6 0.510.51 I 10 0.500.5
I 7 0100.5
Table 6. Weights of all indicators.
Objective LayerCriterion Layer Single   Weight   ( w D i ) Indicator Layer Single   Weight   ( w I i )
A D 1 0.595 I 1 0.128
I 2 0.595
I 3 0.276
D 2 0.276 I 4 0.374
I 5 0.090
I 6 0.374
I 7 0.163
D 3 0.128 I 8 0.200
I 9 0.600
I 10 0.200
Table 7. Indicators for details.
INDICATOR O 1 O 2 O 3 O 4 O 5 O 6
I 1 6624no lane markings4
I 2 Temporary parkingStop for unloading onlyon-street parkingTemporary parkingNo controlTemporary parking
I 3 two-waytwo-waytwo-waytwo-wayno lane markingstwo-way
I 4 400480500450360490
I 5 easyeasyeasydifficulteasydifficult
I 6 congestioncongestionunobstructedunobstructedunobstructeddrive slowly
I 7 congestioncongestionunobstructedunobstructedunobstructeddrive slowly
I 8 112203
I 9 050170120360230
I 10 14141111010
Table 8. The option layer weight.
INDICATOR O 1 O 2 O 3 O 4 O 5 O 6
I 1 0.2140.2140.0870.2140.0570.214
I 2 0.1130.0500.2370.1130.3750.113
I 3 0.1880.1880.1880.1880.0630.188
I 4 0.1710.1190.0530.1710.4040.082
I 5 0.2490.2490.2490.0990.0540.099
I 6 0.0670.0670.2490.2490.2490.119
I 7 0.0670.0670.2490.2490.2490.119
I 8 0.1940.1940.0930.0930.3760.049
I 9 0.0480.0750.1590.1100.3730.234
I 10 0.0640.0640.1650.1650.3760.165
Table 9. The total score.
INDICATOR O 1 O 2 O 3 O 4 O 5 O 6
I 1 0.0160.0160.0070.0160.0040.016
I 2 0.0400.0180.0840.0400.1330.040
I 3 0.0310.0310.0310.0310.0100.031
I 4 0.0180.0120.0060.0180.0420.008
I 5 0.0060.0060.0060.0020.0010.002
I 6 0.0070.0070.0260.0260.0260.012
I 7 0.0030.0030.0110.0110.0110.005
I 8 0.0050.0050.0020.0020.0100.001
I 9 0.0040.0060.0120.0080.0290.018
I 10 0.0020.0020.0040.0040.0100.004
I a 13.13%10.56%18.88%15.93%27.57%13.92%

