Article

Framework for Assessing Public Transportation Sustainability in Planning and Policy-Making

by
Linda E. Karjalainen
* and
Sirkku Juhola
Ecosystems and Environment Research Programme, Faculty of Biological and Environmental Sciences, University of Helsinki and Helsinki Institute of Sustainability Science (HELSUS), University of Helsinki, Viikinkaari 1, P.O. Box 65, 00014 Helsinki, Finland
*
Author to whom correspondence should be addressed.
Sustainability 2019, 11(4), 1028; https://doi.org/10.3390/su11041028
Submission received: 18 January 2019 / Revised: 8 February 2019 / Accepted: 12 February 2019 / Published: 16 February 2019
(This article belongs to the Special Issue Sustainable Mobility and Transportation)

Abstract

:
Transportation plays a key role in urban sustainability planning and urban greenhouse gas emission reductions. Globally, cities have established sustainability agendas and policies to guide the shift from traditional private automobile dependent transportation systems towards an increased use of public transportation, cycling, and walking. While the surrounding physical urban form and governance structures condition public transportation services, there are also many other factors to consider when discussing sustainability. As such, comprehensive planning and policy-oriented assessment frameworks that are independent of local conditions are still largely missing in literature. This paper presents a Public Transportation Sustainability Indicator List (PTSIL) that provides a platform for an integrated assessment of environmental, economic, and social dimensions of sustainability through an indicator-based approach. To demonstrate its use, the PTSIL is applied to analyze the policy documents of public transportation agencies in Helsinki, Finland, and Toronto, Canada. The results show that while both cities achieve relatively high scores in all dimensions, there is still high variability among individual indicators. The PTSIL presents a missed stepping stone between descriptive definitions of transportation sustainability and case specific sustainability performance assessments, offering an opportunity within the planning and policy-making sectors to review, assess, and develop public transportation services comprehensively.

1. Introduction

In an increasingly urbanizing world [1], sustainable transportation has emerged as a policy goal that cities and transportation authorities have globally committed to [2]. Transportation plays a key role in urban sustainability planning and greenhouse gas (GHG) emission reductions, as public modes of transportation, alongside walking and cycling, are encouraged due to their lower production of negative externalities compared to private modes of motorized transportation [3,4,5,6,7].
The three main dimensions of sustainability, i.e., social, economic, and environmental [8], are routinely viewed as the basis of transportation sustainability, in both policies and scientific literature [2]. For example, the oft quoted European Union Council of Transport Ministers’ statement, borrowing from the Canadian Centre for Sustainable Transportation, holistically stresses the importance of access, affordability, efficiency, and lowered environmental impacts as cornerstones of sustainable transportation [9]. The United Nations (UN) has also established guidelines for sustainable transportation, and raises similar concerns over accessibility, affordability, emissions, safety, and equity, alongside increased congestion and travel times in urban areas [4]. However, these definitions do not provide concrete directions regarding how to actually implement the described desired system [10,11].
Politically binding and publicly supported strategies are required to address the desired shift from car-dominant transportation systems towards more sustainable ones revolving around public transportation services, cycling, and walking [3,12]. Despite a global boost in urban transportation sustainability policies [2], comprehensive and integrated methodologies to assess and characterize the sustainability of transportation systems, and furthermore, public transportation services, are still largely missing in literature, as also recognized by Marsden et al. [13], Miller et al. [14], De Gruyter et al. [15], and Litman [16]. Data limitations and case specific contexts limit holistic sustainability assessments and the use of diverse indicators (e.g., Reference [15,16]), and a need for comprehensive and applicable assessment frameworks and tools that aid the planning and decision-making processes is identified in literature (e.g., Reference [13,17]).
This study presents a Public Transportation Sustainability Indicator List (PTSIL), which develops the concept of public transportation sustainability in more detail through representative indicators, and enables assessments within the planning and policy sectors in an integrated manner, incorporating environmental, social, and economic dimensions, and considering influential aspects related to governance and urban form. The PTSIL produces a novel assessment technique for transportation policies and plans that is both comprehensive and accessible to the planning and policy-making fields outside its application and cases here. Furthermore, we focus the discussion of transferable sustainability assessment frameworks and techniques, called for in planning and policy-making processes, on public transportation services. The construction of the indicator list is based on an extensive literature review to identify diverse transportation sustainability attributes that are applicable to public transportation services specifically. The identified attributes presented together in the PTSIL provide an inclusive view of public transportation sustainability, independent of data and local context related restrictions. Here, we apply the indicator list demonstratively to the policies of the Helsinki Region Transport (Helsingin Seudun Liikenne, HSL) in Helsinki, Finland, and the Toronto Transit Commission (TTC) in Toronto, Canada.
First, we discuss the relevant literature and previous sustainability assessment techniques with a focus on public transportation services, planning, and policy-making. We also integrate aspects of urban form and governance into the analytical framework, as suggested in the literature (Section 2). We then present a number of sustainability indicators that allow us to examine the public transportation policies of Helsinki and Toronto through a sustainability lens (Section 3). The policy comparison is conducted through a qualitative content analysis of official policy documents. Our findings indicate that public transportation sustainability is addressed in a diverse manner, yet environmental indicators are prominent in policies partially because they are often easier to measure and target. However, our results also highlight an increased inclusion of social and socio-economic measures, while high variability in the inclusion of individual sustainability attributes in policies persists, as recognized by Jeon and Amekudzi [2] (Section 4). The assessment method developed here, alongside the growing need to assess sustainability comprehensively within the public transportation sector, are further discussed in Section 5.

2. Assessing Public Transportation Sustainability

2.1. Previous Assessments in Literature

Assessments within the broader transportation sector have traditionally utilized transportation ridership and traffic measurements to analyze transportation systems, but they alone do not provide extensive detail about the overall sustainability [6]. Comprehensive methodologies to assess the sustainability of public transportation services and systems have been sparse [14,15], although recent studies have aimed to integrate environmental, social, and economic attributes more widely [14]. However, issues with data availability often restrict the use of all available metrics, particularly those related to the social dimension [13,15].
Performance indices (including Composite Sustainability Indices, CSIs), modelling, and simulations have been widely applied to assess various public transportation infrastructure projects or other service-related initiatives (e.g., [18,19,20,21]). Recently, Miller et al. [14,21] have presented reviews of public transportation sustainability concepts and techniques used to measure sustainability, with a focus on advancing holistic CSI studies. Some indicators presented and applied by Miller et al. [21] to study public transportation system performance have also been utilized in an international comparative performance assessment by De Gruyter et al. [15].
Studies focusing on policy analysis and planning processes remain limited, especially regarding detailed frameworks and assessment tools that are independent of the original case study settings and data. Moreover, policy-oriented research tends to focus on urban transportation planning and policy as a whole, and not solely on public transportation. In Sweden, a sustainability assessment tool was co-created in close collaboration between local practitioners and researchers [17]. The needs of the planners were identified in interviews and the tool was adjusted to match the national transport policy goals, while additionally, qualitative aspects, such as passenger perceptions of the transportation system, were included [17]. Marsden et al. [13] base their initial indicator selection process on reviewed literature, yet the final indicator set is selected through expert panel discussions and in relation to national policy targets in the UK. Ramani et al. [22] take on a similar approach amongst transportation agencies in the US, presenting a framework for implementing sustainability objectives and performance measures into agency practices.
Marsden et al. [13] (p. 189) express the fact that ‘’although sustainability exists as a concept, it is poorly defined. This definition deficit has serious implications for the types of strategies tested. First, information on some aspects of sustainability is not produced and so these aspects are marginalized.’’ It has been shown through transport initiative and practice reviews that in the absence of a universally accepted definition of transportation sustainability, the transportation authorities and actors are left to determine what their views, focus, and emphasis regarding sustainability are [2,22]. The three dimensions of sustainability tend to be unequally addressed, and transportation sustainability in strategic initiatives is mostly characterized and measured based on environmental impacts and system effectiveness, while overlooking social and economic aspects [2]. De Gruyter et al. [15], in accordance with Litman [16], furthermore discuss the existing economic and efficiency related preferences within transportation performance assessments as well, and how restrictions created by available data lead to exclusion of some aspects of sustainability in research and thus also in decision-making processes. Overall, transportation sustainability assessments group and apply indicators differently, depending on the approach (system v. sub-system), local contexts and data restrictions, which in turn lead to differently operationalized sustainability dimensions. While complex social issues related to access and equity [23,24] are harder to include in assessments, further inclusion of social aspects is highly essential, as addressing passenger needs’ links to service attractiveness and ridership [25,26]. A need for assessment tools that aid the planning and decision-making processes towards a more comprehensive understanding of sustainability thus exists.

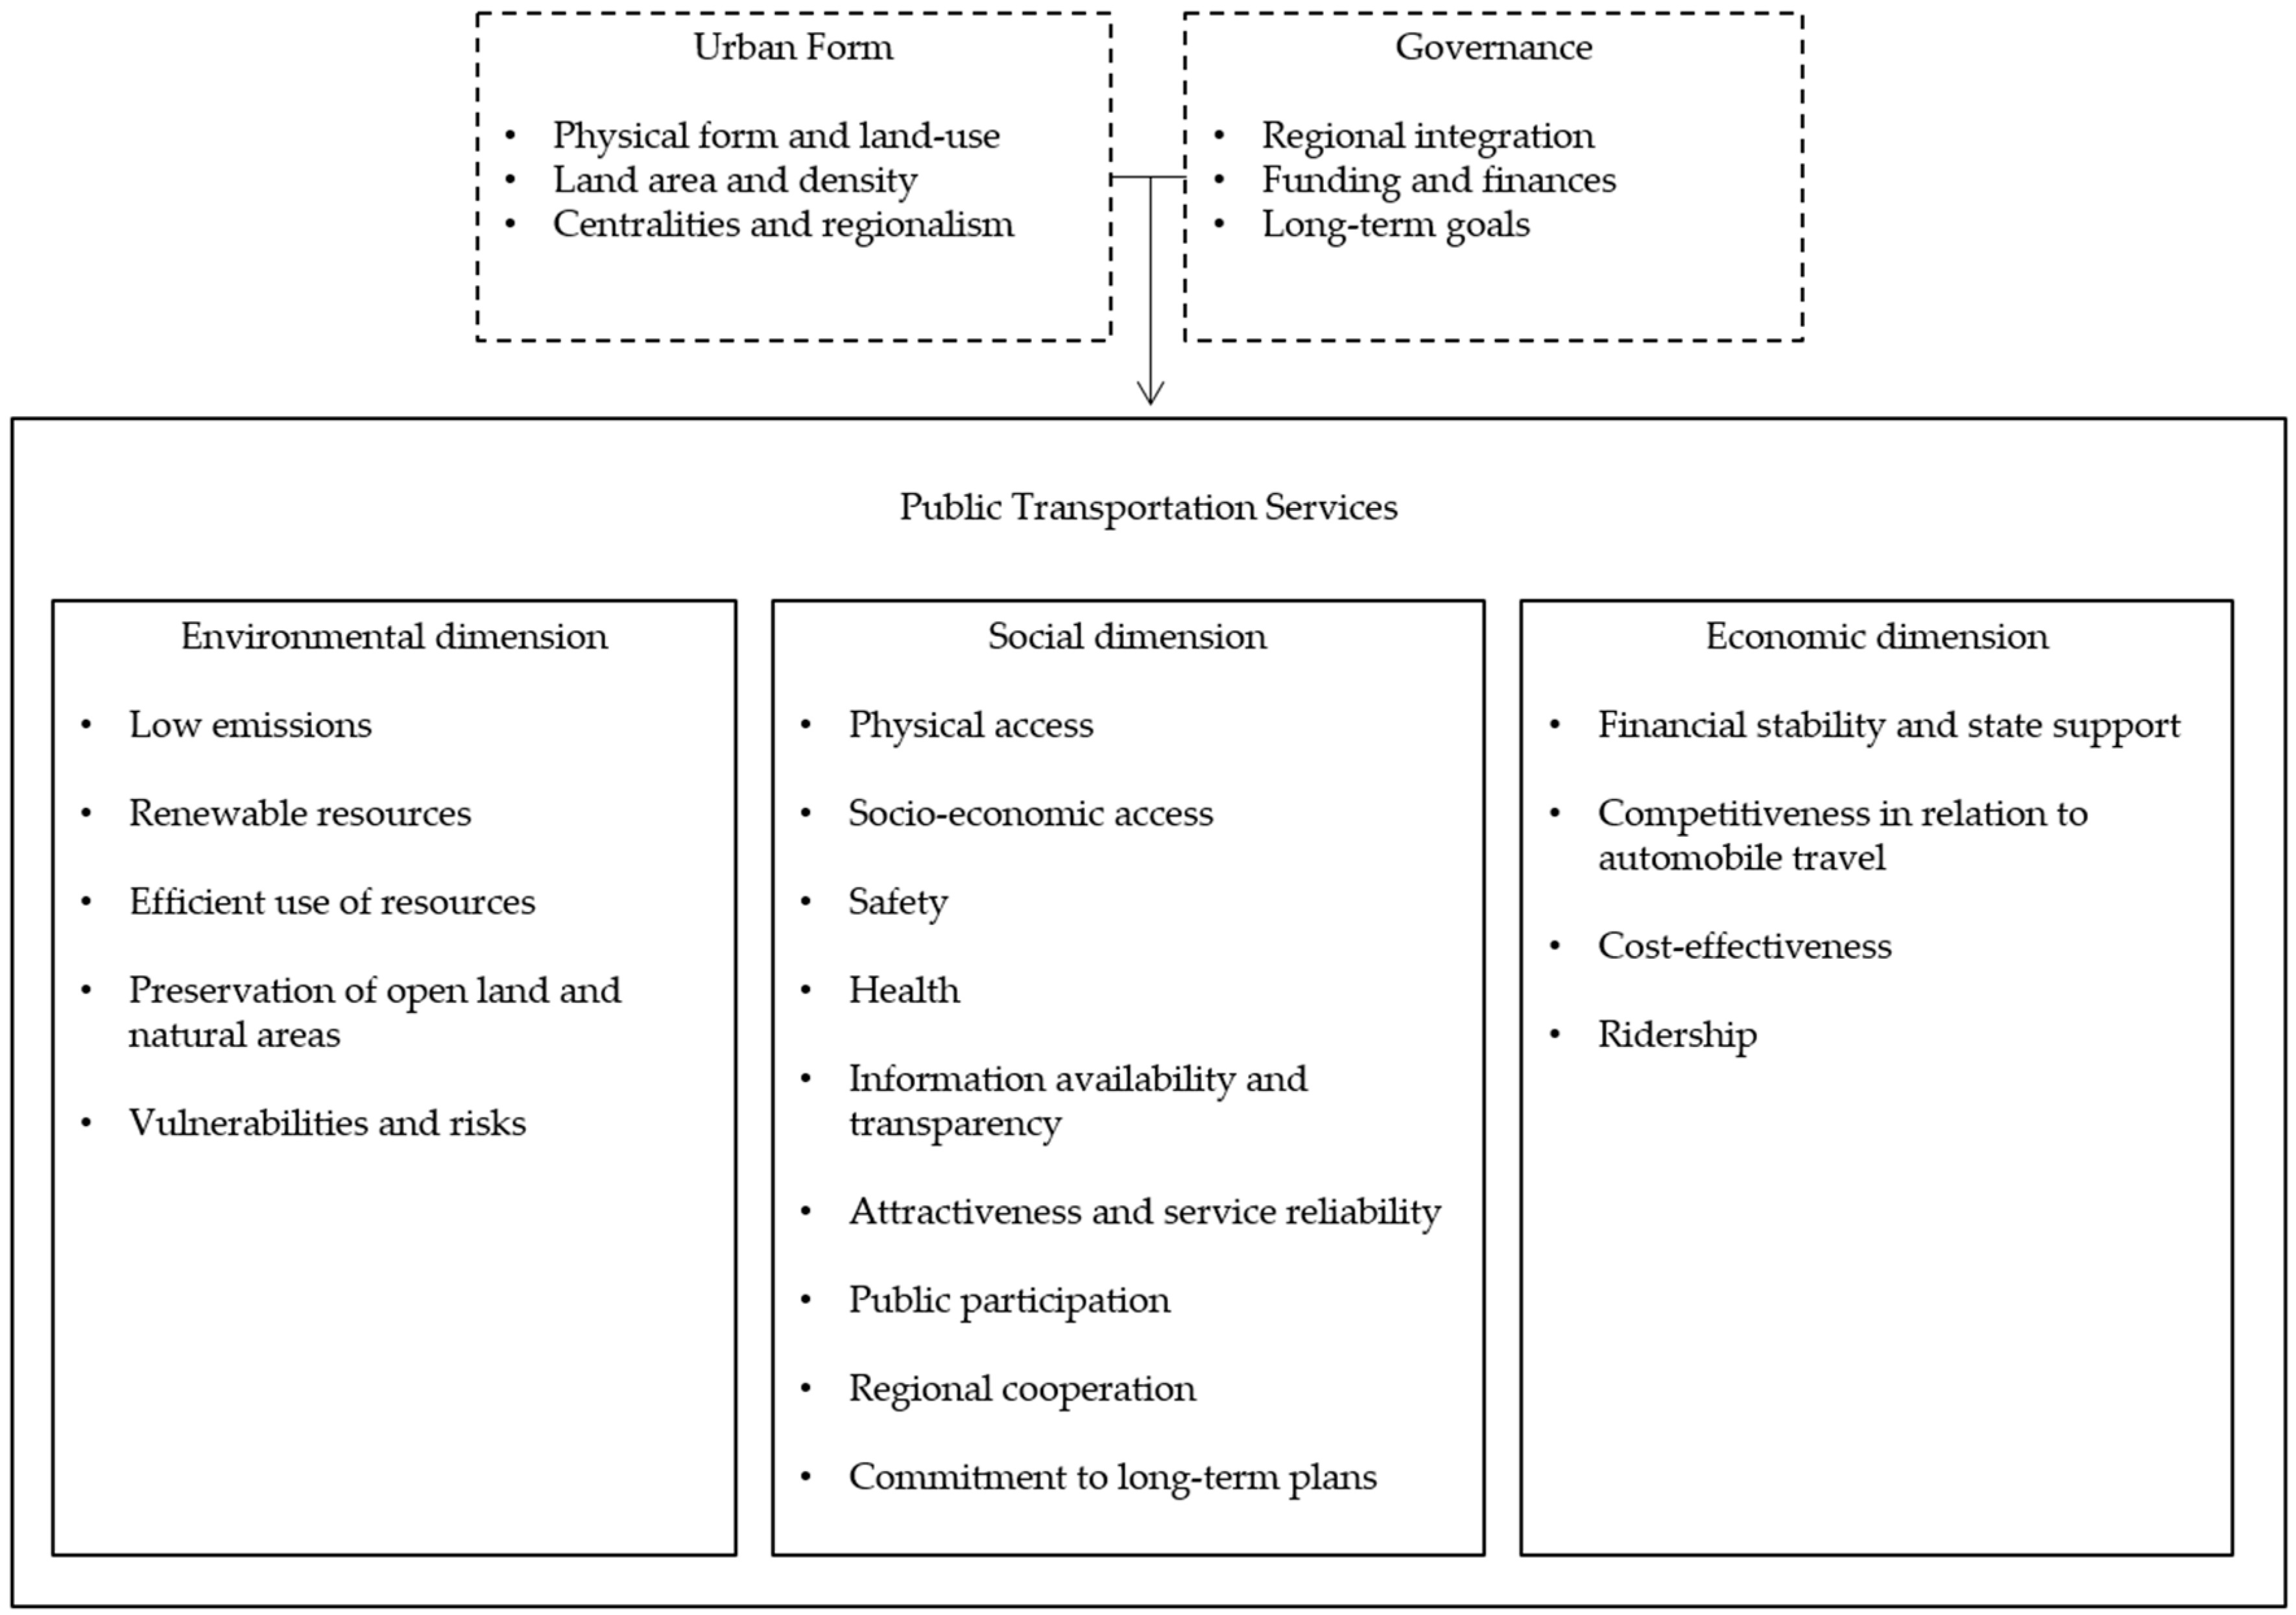
2.2. Analytical Framework

In addition to the environmental, social, and economic dimensions of sustainability (adopted from Brundtland et al. [8]), we also include aspects of urban form and governance as conditioning factors for sustainable public transportation in our analytical framework. Thus, urban form and governance intertwined with sustainable public transportation services are briefly discussed below and incorporated into the tri-dimensional approach of the PTSIL.
Compact urban form and higher densities, with a focus on the spatial distribution of densities rather than overall urban density (e.g., [27]), are seen as beneficial for public transportation services. These developments positively correlate with open space and ecosystem preservation, improved accessibility, decreased use of private cars and traffic, and thus lower levels of pollution and emissions. Containing urban sprawl through regional coordination is additionally essential for sustainable urban transportation patterns [4,5,6,12,24,27,28,29,30].
Regarding governance, there is no efficient universal remedy for the urban transportation challenges [31]. To increase sustainability, current transportation systems do not necessarily need to undergo major physical and technical changes, but they can rather be managed more effectively and comprehensively [5,7]. Long-term commitment to plans, strong political will and stable funding, holistic approach, and regional coordination are seen to contribute to sustainable development within the urban transportation sector. Through governance, system, and service related efficiency, reliability, quality, and equity can be improved, thus attracting new users [5,6,11,28,29,31,32].
Figure 1 sets out the analytical framework of the study that brings together existing literature with a focus on public transportation. The framework places the three dimensions of sustainability at its core, alongside urban form and governance that create the conditions for the public transportation services themselves (presented with dashed line). While the analytical framework, and the indicator list that embodies it, propose a generally applicable view of public transportation sustainability, we do not aim to dismiss the importance of local context. The created policies, plans, and chosen sustainability measures and actions ought to reflect the local conditions and needs, to ensure the best and most efficient results [33,34]. However, the PTSIL helps identify overlooked and weakly addressed sustainability aspects in policies and planning, and furthermore supports a comprehensive understanding of sustainability.

2.2.1. Environmental Sustainability

Environmental sustainability is largely focused on eliminating negative outputs of public transportation services, including reductions in GHG emissions, air pollution (i.e., NOx, PM, SOx, O3), noise pollution, and waste. Also, encouraged use of renewable resources, and efficiency in material and energy use, for example, need be addressed [3,4,5,11,33,35,36]. In addition, emissions per passenger ought to be applied as an indicator, allowing for just understanding of emissions in relation to passenger volumes [35,37].
Related to reductions in emissions, technological innovations and improvements are seen as an effective option to increase sustainability through the use of renewable resources, establishment of emission standards, and development of ‘eco-vehicles’, for example [3,38]. Furthermore, technological improvements can advance the energy intensity and efficiency in fuel and resource consumption. [5,33,34,38]. Vulnerabilities and possible environmental risks, especially regarding climate change, are to be noted through risk assessments and contingency planning [3,29,39]. Additionally, preservation of open and natural areas, environmental health, and reduction of ecological disturbances are recognized [3,5,36,38].

2.2.2. Social Sustainability

Social sustainability is described as the most complex and challenging dimension to measure [40] and thus include in transportation planning and policy [23]. The social and economic dimensions also tend to overlap. Here, social sustainability consists of elements and indicators regarding access, safety, health, information availability, attractiveness, commitment to plans, and coordinated management, thus also including aspects of governance.
Accessibility is understood as equitable transportation that provides access to opportunities, reduces exclusion, and aims to increase the quality of life. Accessibility can be measured either spatially or on the basis of individual socio-economic traits, meaning that access and accessibility refer to physical proximity to transportation services, as well as the ability to access them based on, for example, physical disabilities or affordability issues. Special attention is to be paid to vulnerable groups, i.e., the elderly, the disabled, the young, and people with low income [16,23,38]. Elements of safety, health, equity, and social cohesion, passenger perception, as well as livable communities are part of socially sustainable public transportation [4,5,11,33,34,36,41].
Social equity in transportation planning can be divided into three main categories, consisting of spatial allocation of routes and services, levels of service (regarding frequency, for example), and money passengers spend to access the said services [41]. The phenomenon of social exclusion, equity, and accessibility can be linked to the wider discussion of environmental injustice in urban settings, where services and opportunities are not distributed consistently [42]. Central parts of the city tend to enjoy higher levels of service than outer neighborhoods, yet these differences are rarely reflected on fare levels [23,33,43,44,45].
As for the specific measures and indicators of social sustainability, for example, physical access can be measured by examining distances between residential areas and public transportation stops. Affordability can be studied through the share of income used to access transportation services (e.g., References [24,35,46]). Central findings of a public transportation satisfaction survey conducted in Europe suggest that safety and security, system reliability, accessibility, comfort, and staff behavior are the key elements affecting public transportation use, alongside real time and accessible information [47]. Accurate timetables and personal journey planners are beneficial to the attractiveness of public transportation [29]. Multi-modality and intermodality are additionally recognized as aspects of service quality [5]. Public participation and transparency are additionally called for, in order to bring the planning process closer to the users and to those in need, thus making services more attractive while enhancing social cohesion [12,26,38,46,48]. Efficient route planning, service frequency, and innovative and flexible ways to provide transportation services are also identified as beneficial [24].

2.2.3. Economic Sustainability

Essential elements of economic sustainability are volume of transportation, ridership, costs to service provider, fare revenue, and financial stability, as well as infrastructure capacity and operational efficiency. For example, the United States Environmental Protection Agency refers to average ridership and revenue as indicators of economic sustainability [35]. Infrastructure and services are to have sufficient capacity and cost-effective implementation and routing, while accounting for future growth [5,29].
The costs for service providers, more specifically, include total expenditure, costs per passenger, subsidies, revenue, and investments [38]. Operational cost-efficiency is to be paired with a good level of service [5,11], while fare levels should reflect the costs related to service provision, as well as the quality of the service received by the user. Revenue should be boosted, while simultaneously promoting equity and aiming to attract new users [49]. Local and regional transportation authorities need strong support from higher levels of government, regarding both technical and financial measures, as subsidies are usually required to cover financial gaps in public transportation service provision [29,49]. A stable funding from above allows for more equitable transportation service provision within the city, as independent service providers need not choose maximized revenue over levels of service [11]. Focusing solely on economic revenue is problematic and discouraged, as it negatively affects other aspects of sustainability, such as ridership and socio-economic accessibility [49]. Without the required level of users, public transportation is environmentally, socially, and economically unsustainable [26].

3. Materials and Methods

The Public Transportation Sustainability Indicator List (PTSIL) consists of diverse and inclusive sustainability aspects relevant to public transportation services, and it operationalizes the findings in literature through an indicator-based assessment tool. Within the three dimensions, the indicators have additionally been grouped into thematically cohesive sub-sets, reflecting broader aspects of sustainability that can be utilized to generate larger scale scores. To demonstrate the use and potential of the PTSIL, we undertake a qualitative content analysis to assess policy documents of the public transportation authorities in Helsinki and Toronto. The obtained scores reflect how comprehensively and ambitiously the different aspects of sustainability, represented through the indicators of the PTSIL, are addressed in the analyzed content. We want to emphasize that the PTSIL does not thus aim to assess system performance, but instead provides a novel platform for policy assessments in the public transportation sector.

3.1. Indicator Selection Criteria

The indicator selection process was based on the literature review, where we identified diverse sustainability attributes and measures applicable to public transportation services. For constructing the detailed indicator list, we applied criteria set by Haghshenas and Vaziri [50] (p. 117), see Table 1. As we do not rely on primary data and apply an ordinal scale scoring scheme (see Section 3.3), standardization of indicators was unnecessary in our analysis. To avoid double counting of some variables, merging and regrouping of indicators was essential and accomplished based on the adopted criteria. As our objective was to provide an inclusive and comprehensive view of public transportation sustainability without requirements set by limited data or local conditions, all identified indicators of sustainability fulfilling the criteria were included in the PTSIL. With the increased volume of indicators, the weight of a single indicator is simultaneously decreased [12], while depth and detail are added to the assessment framework.

3.2. Public Transportation Sustainability Indicator List (PTSIL)

The PTSIL is presented in Table 2. Environmental dimension is characterized through 12 indicators, social sustainability through 21 indicators, and economic through seven, totaling 40 indicators. The desired direction, reflecting increased overall sustainability for each indicator, is presented through arrows facing up (increase) or down (decrease). The indicators are organized inside the dimensions on the basis of cohesive sustainability aspects, and grouped under thematic sub-sets with respective numbering (e.g., SO3 Safety entails two indicators, SO3-1 Traffic accidents and injuries, and SO3-2 Feeling of safety). The thematic sub-set categories structure the indicator list and additionally provide a layer of analysis between the broad dimensions and individual indicators.
Environmental indicators consist of reduced emissions and outputs, increased efficiency and use of renewable resources, and preservation of open and natural areas, as well as vulnerabilities and risks. Social sustainability is defined by physical and socio-economic access, safety and health, information availability, transparency and public participation, attractiveness, and commitment to plans and regional coordination. Economic sustainability is characterized through elements dealing with stable funding and subsidies, revenue, economic viability, competitiveness and sufficient capacity, ridership, and cost-efficiency. Some aspects of sustainability overlap, particularly between the social and economic dimensions, while others deal with system functions (e.g., multi-modality and intermodality). Since we wanted to maintain the tri-dimensional approach for clarity, some indicator redistribution was necessary.

3.3. Applying Qualitative Content Analysis as a Method

To identify how the HSL and the TTC address different aspects of sustainability (presented in Table 2, as identified from literature) in their current policies, we apply qualitative content analysis as a method to examine their publicly available policy documents. The case setting is discussed in detail below, alongside the selected documents for analysis in Table 3.
Content analysis is a form of documentary analysis, where a body of text is transformed into codes. Coding reveals the frequencies or trends, themes, and intent in terminology, information which may be used for further analysis. Unlike quantitative content analysis that relies on recording frequencies of chosen search words, qualitative content analysis focuses on the use of the chosen keywords, thus obtaining information about the context itself [51,52]. As our objective here is to assess how the PTSIL indicators are embedded in policy documents of the case cities, we apply a qualitative content analysis. The PTSIL indicators and sub-sets represent aspects and themes of sustainability that are applied as keywords in our review of the documents. This is a methodological prerequisite to deconstruct and operationalize the studied phenomenon into variables [51,52]. To assess how ambitiously the indicators and their representative sustainability themes are addressed in the content, a scoring method must be applied to establish growing levels of inclusion. Here, the chosen scoring method is additionally applied as a numerical coding method for findings in the content.
To overcome comparability issues of potentially very different data presentations in the cross-national context, we apply an ordinal scale scoring method that allows for comparisons between various types of sources and additionally supports the application of the PTSIL outside our research design in the future. An ordinal scale does not specify how much something increases between different values, but rather establishes that increase of the studied attribute takes place when moving along the scale [53]. A similar approach has been presented in previous sustainability assessment literature by Shen et al. [40]. Thus, the scoring and coding scheme we apply here identifies the level of inclusion of different sustainability attributes in the analyzed documents. The documents were scanned for the sustainability themes, represented by the indicators in the PTSIL. All documents were individually coded and scored with references to content recorded. See supplementary material (Table S1, Table S2) for HSL and TTC codebooks with references to analyzed content. The final PTSIL scores present the highest score an indicator scored in all analyzed documents.
From here on, indicator as a term is used interchangeably with the thematic representation it carries. If information is not available, i.e., the indicator and its representative theme is not addressed in the content, the score is 0. If the indicator is referenced similarly or statically without the desired direction, the score is 1. When the indicator is addressed with desired direction, the score is 2, and if accompanying the desired direction, a specific target or action is set or being carried out, the obtained score is 3. An example of the scoring method for EN1-1 GHG emissions could be:
  • 0 = (Not included)
  • 1 = Public transportation produces GHG emissions.
  • 2 = GHG emissions will be reduced.
  • 3 = GHG emissions will be reduced by 50% by 2020 (from 1990 level).

3.4. Case Approach

The PTSIL is applied to two cases, the HSL and the TTC. Physically, the public transportation services in both Helsinki and Toronto consist of rather minimalistic subway lines supported by tram service in the downtown core and strong bus connections elsewhere. Both cities additionally have local rail services, that have been integrated into the public transportation fare system in Helsinki, whereas in Toronto the local rail belongs to the regional transportation system and is thus not embedded in the TTC fare structure [54,55]. The physical service provision is thus very similar in both cases, but the governance structures vary, which particularly affects regional cooperation, funding, and service integration, as described below. By selecting cases that share a physically similar system yet differ in governance structures, the use and applicability of the PTSIL assessment framework in ranging local conditions could be demonstrated and the discussion further focused on the policy, planning, and management contexts.

3.4.1. Helsinki and the HSL

Helsinki is strongly linked to its surrounding region through public transportation services. The HSL is a coalition between the regional municipalities, and public transportation services are provided according to a joint tax-based funding structure. Regional cooperation is thus supported, and financial stability and sufficient funding are ensured with a contract between the municipalities, requiring them to provide subsidies to cover for possible budget deficits that cannot be compensated with fare revenue, initial subsidies, and state funding, or other alternative sources of funding [56,57].
Helsinki has committed to transit-oriented development (TOD), and aims to coordinate densification along transit corridors. New light rail transit (LRT), tram routes, and a subway extension are being implemented to advance the amount of rail transportation and system capacity [58,59]. In Helsinki, more trips are made by public transportation than with private cars [60]. The already unified and cohesive regional fare structure will go through changes as the municipal borders will be blurred and a zone-based fare system is created [61]. Additionally, “Mobility as a Service” thinking is gaining attention in Helsinki, as applications combining all available modes of transportation together for a better user experience are being introduced [62,63]. Despite enjoying high satisfaction rates, the growing Helsinki Metropolitan Area is starting to experience issues related to the capacity of existing infrastructure, and the efficiency of the public transportation system [64,65].

3.4.2. Toronto and the TTC

The governance structures are more complex and fragmented in Toronto than in Helsinki. TTC is the primary public transportation authority within the city limits of Toronto, and it is owned by the city [66]. However, GO transit, Viva, Züm, MiWay, and Durham Region Transit also provide services in Toronto. GO transit is managed by the regional umbrella authority, Metrolinx, connecting the surrounding region to the core of Toronto, whereas the other authorities merely operate small loops inside the city, linking it to individual surrounding municipalities [55]. Metrolinx collaborates tightly with the local public transportation authorities to further connect the municipalities and passenger pools of the Greater Toronto Area (GTA), while also addressing capacity and infrastructure issues [67]. The city aims to boost viable centers, increase TOD through the establishment of transit corridors, and introduce new LRT and subway lines [68], much like Helsinki.
TTC has been suffering from financial constraints, recognizing the need for additional funding from upper levels of government. Lack of commitment to plans and shifting focus are moreover identified as major issues by the authority itself [69]. Toronto has expanded at such a rate that the transportation system has been unable to match the growth over the past decades. An increase in congestion and travel times, combined with accessibility issues, and challenges in coordinated planning and governance are described as a reality in the GTA today [33,70,71,72]. The regional transportation patterns present challenges to city specific public transportation authorities, such as the TTC, as increasingly unified service provision alongside long-term commitment to plans and funding are called for [33,71].

3.5. Data

The data comprises of publicly available policy and planning documents of the HSL (n = 11) and the TTC (n = 10), selected through systematic scanning of the public transportation authorities’ websites (www.hsl.fi; www.ttc.ca) during November 2016, see Table 3. The objective was to find major strategies, planning objectives, annual reports, customer satisfaction surveys, and other relevant sustainability documents that together embody their current practices and policies (To prevent the content analysis from transforming into an analysis of miscellaneous online content, only officially published documents in either .pdf or .doc form were included in the data sets. Additionally, since the focus of this study is on the sustainability of the provided services and the transportation system itself, internal office and employee related regulations are excluded from the analysis.).

3.6. Coding Reliability and Methodological Limitations
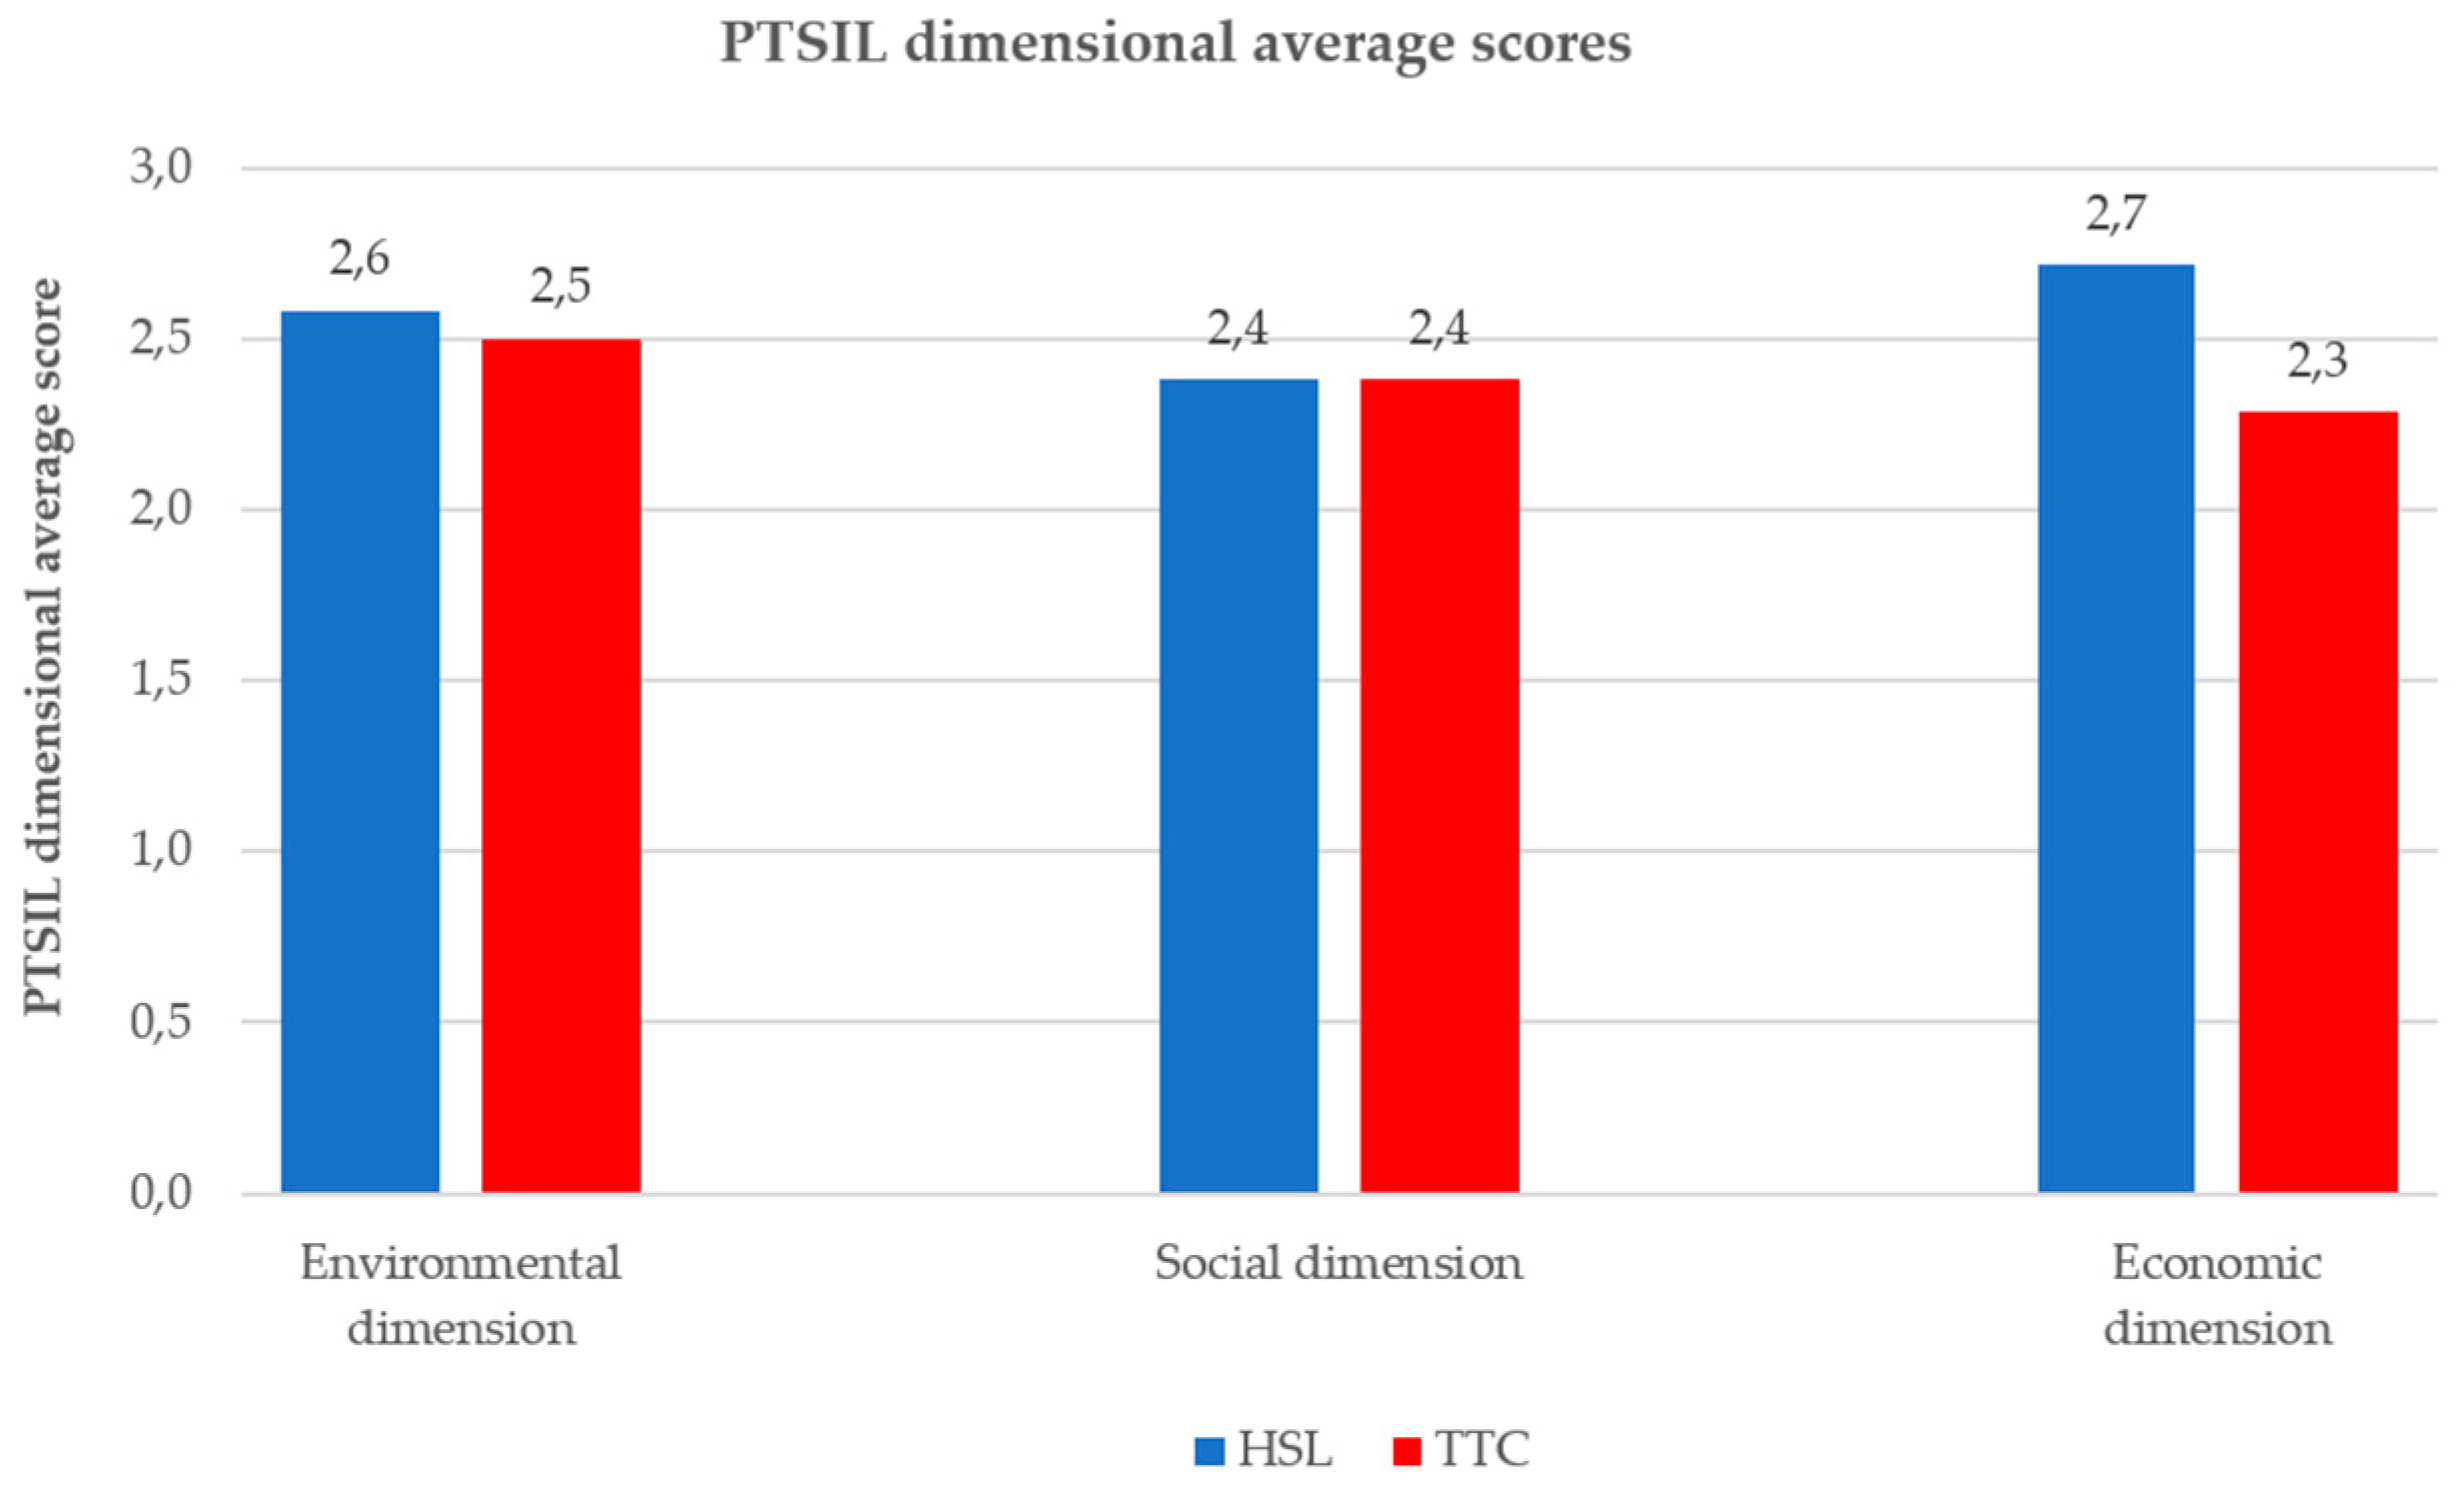
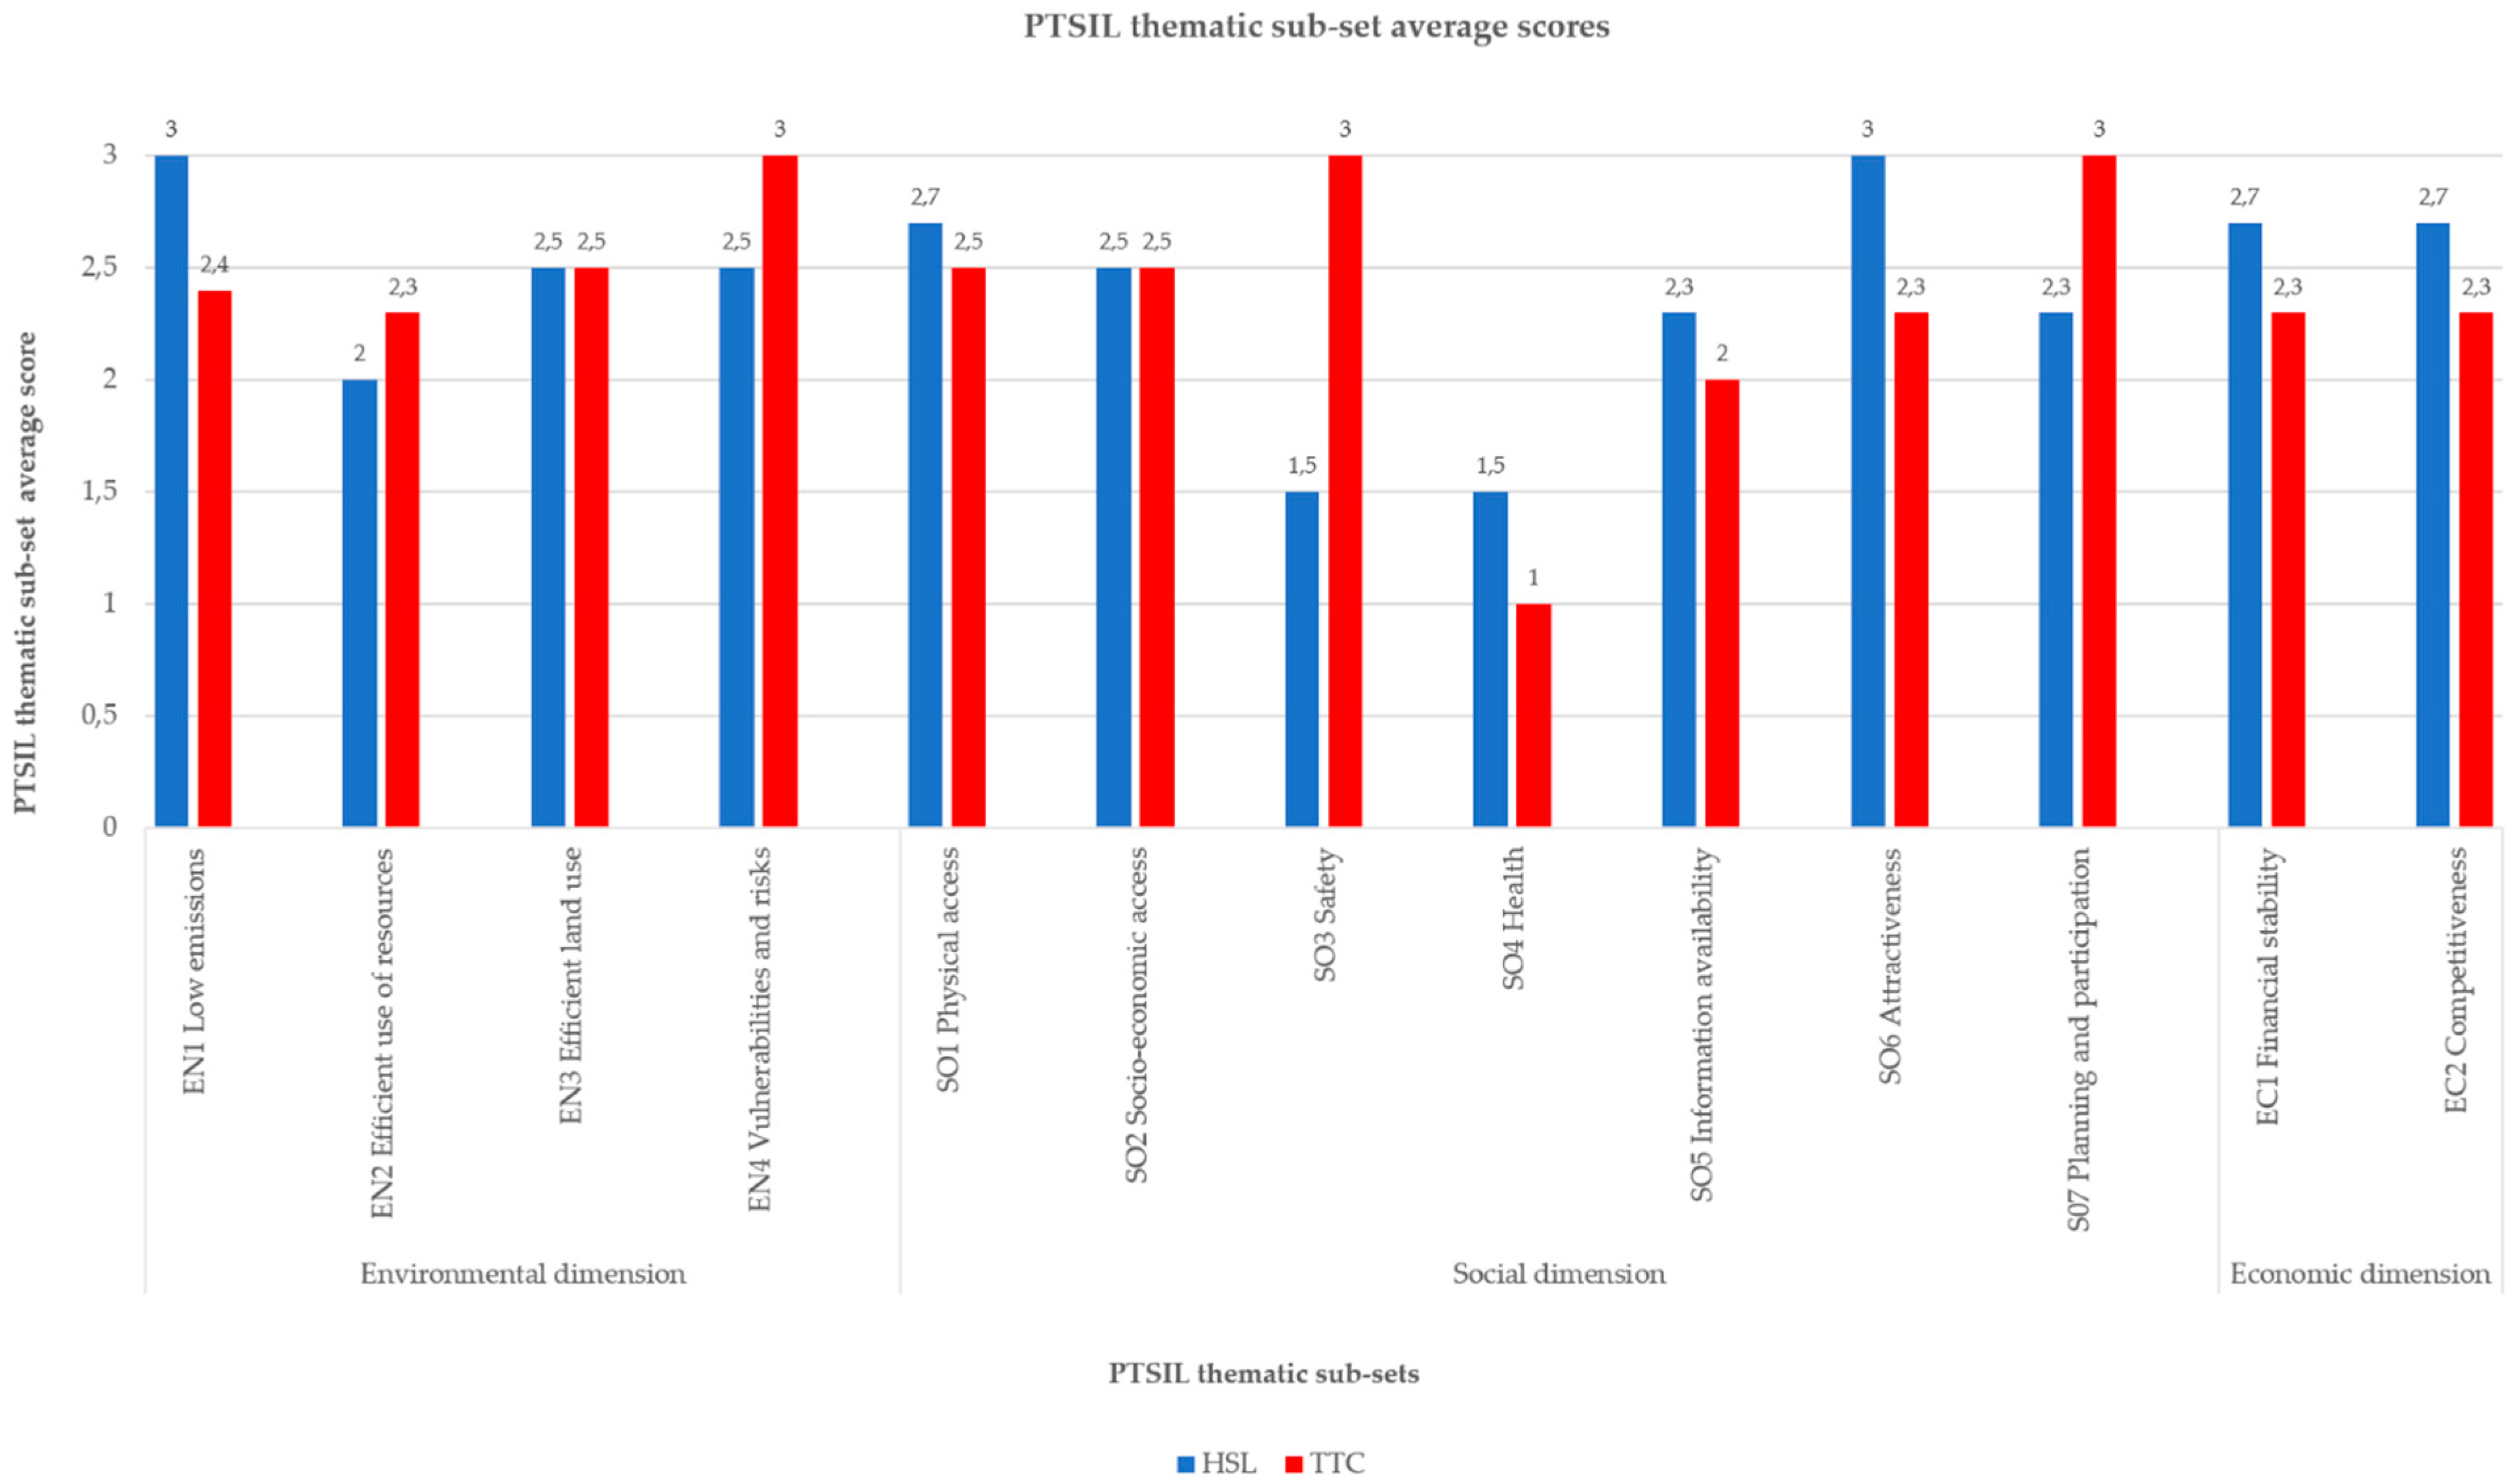
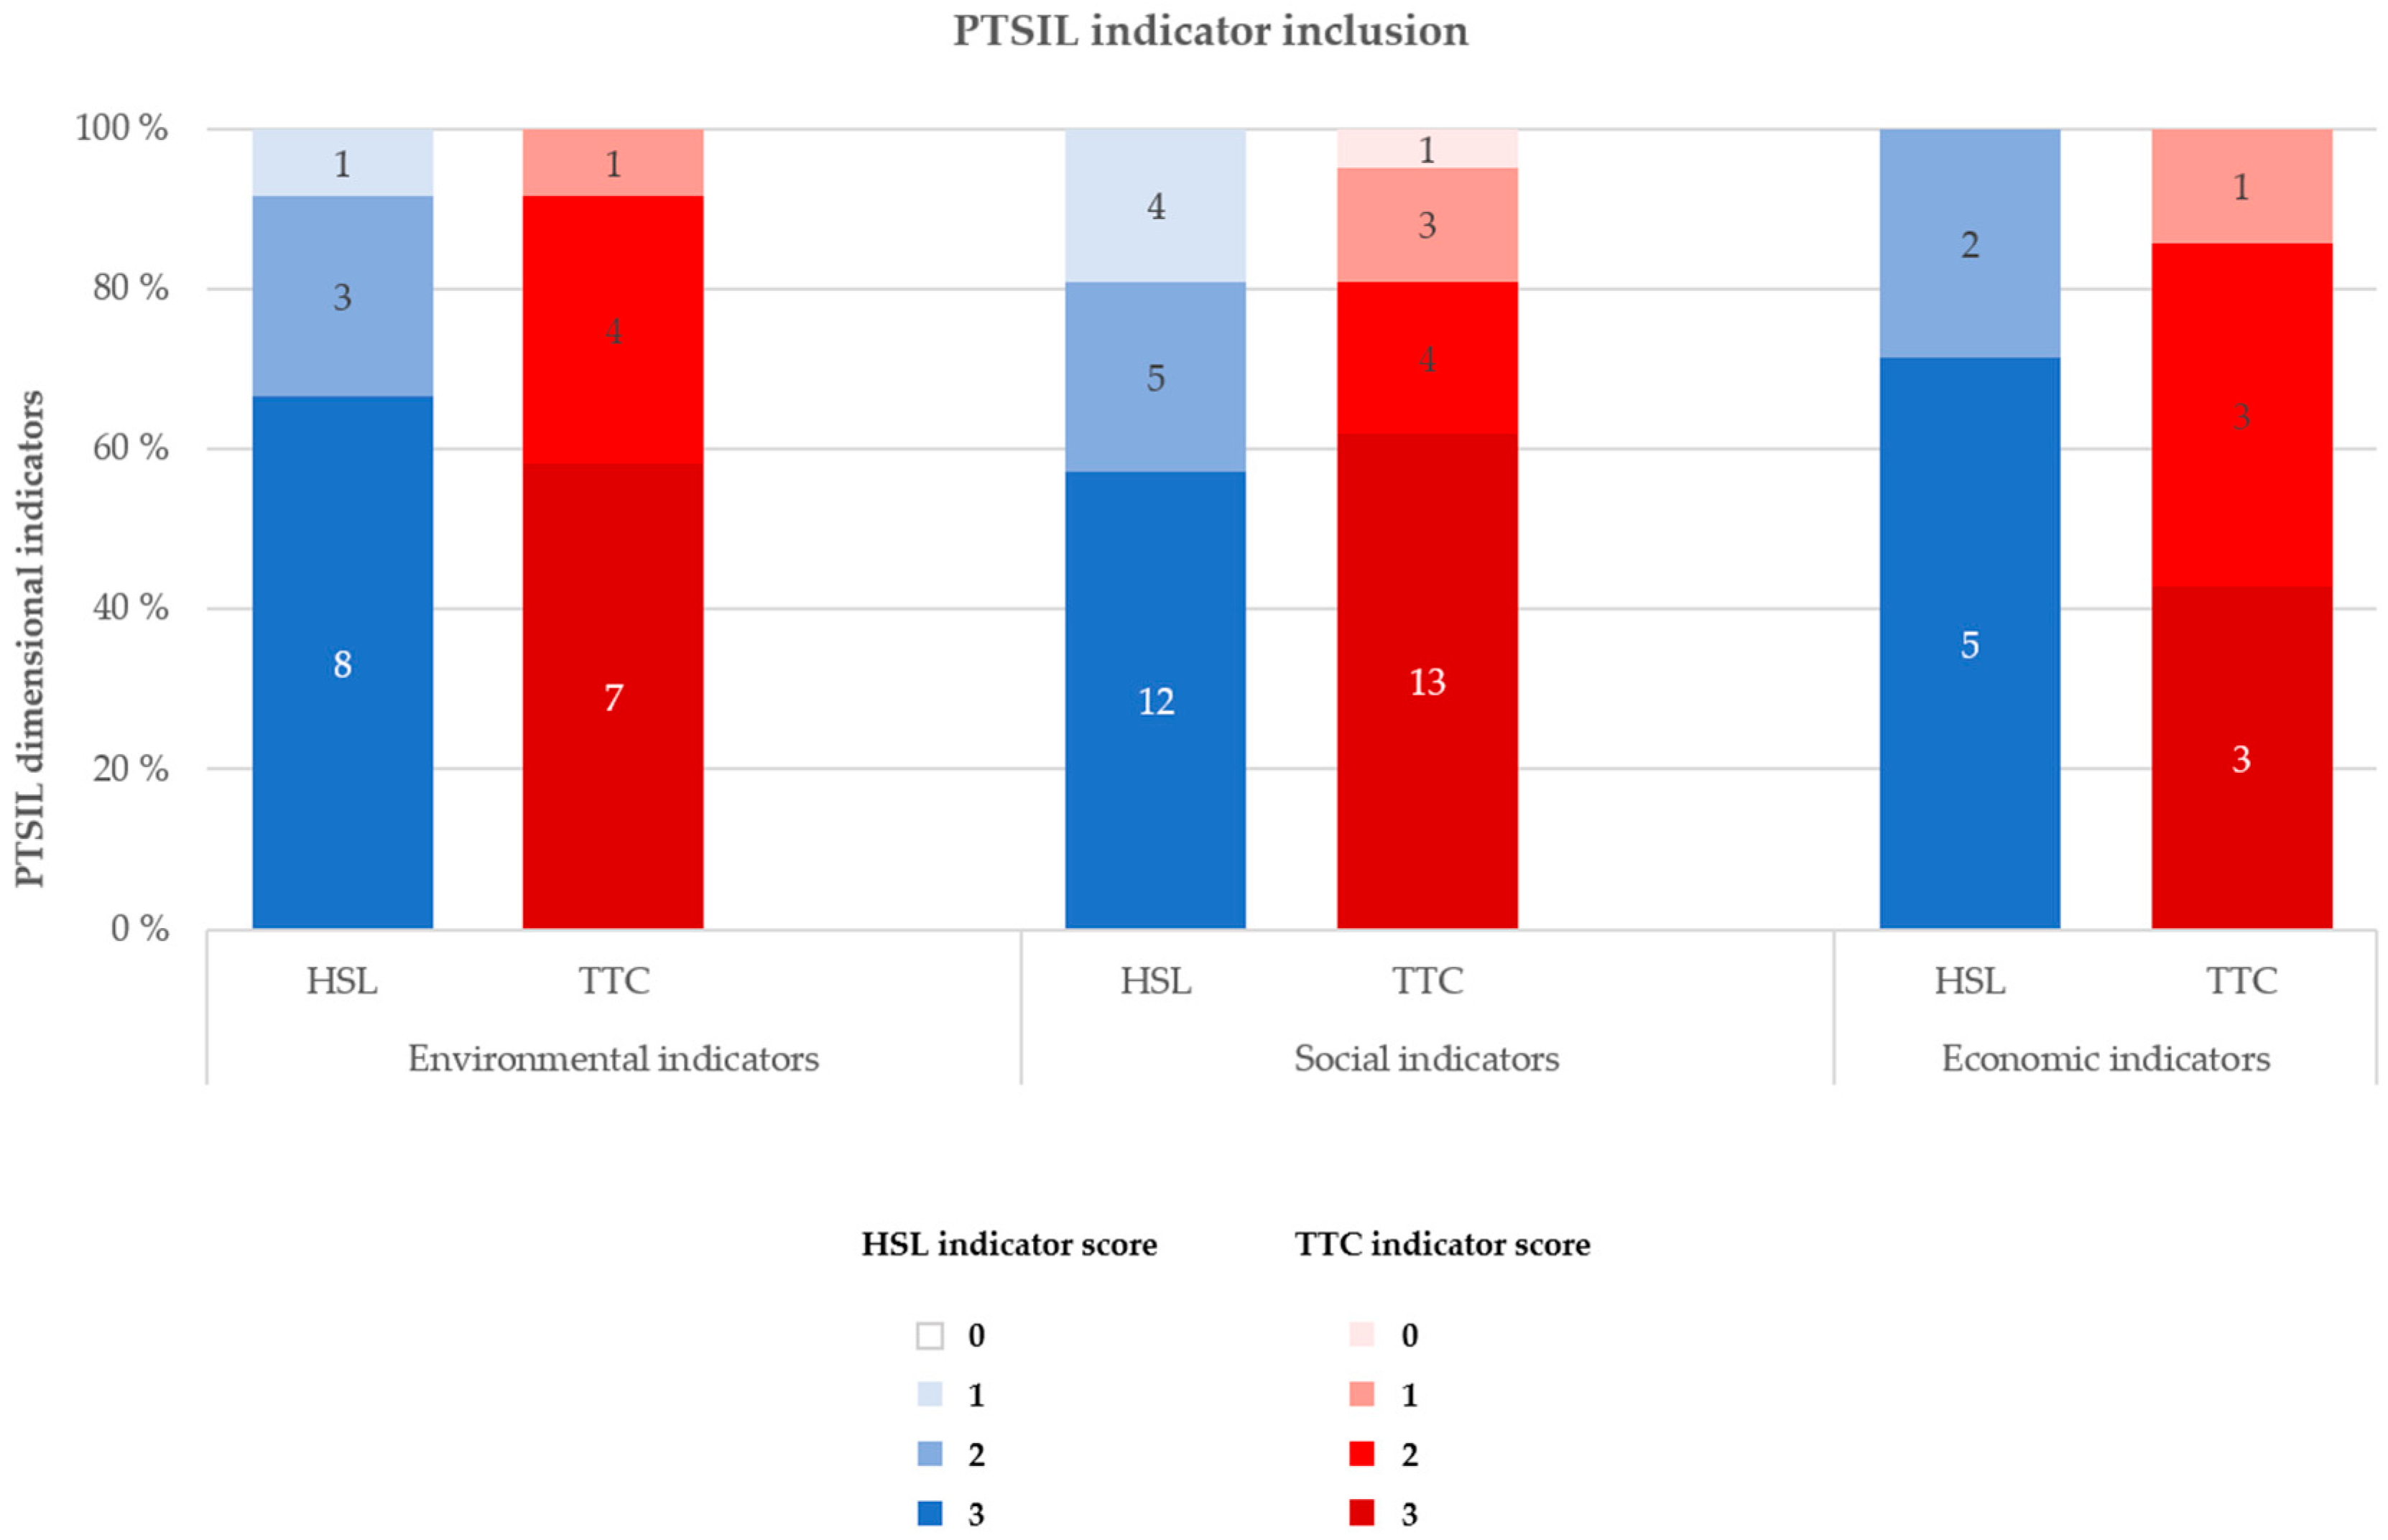
An intercoder reliability test on two selected documents was carried out after the first round of coding. In an initial screening of the test results, a 63% full similarity between two independent coders was achieved, but Krippendorff’s alpha was additionally applied. The lowest acceptable Krippendorff’s alpha score for drawing reliable conclusions from the results is considered to be 0.667 [51]. As the obtained alpha score (0.35) was lower than expected, a second round of coding was decided upon to provide full intercoder comparison between the analyzed documents. See supplementary material for Krippendorff’s alpha calculation (Document S1). The low test score was furthermore looked into, and we found that the differences were mostly caused by missed references of PTSIL indicators in text, or repetitive accidental inclusion of, for example, internal office measures and mentions of external environmental goals carried out on the city level but not adopted by the transportation authority itself. In the final comparison of results after two rounds of full content coding, the remaining differences found in codes were carefully examined, and recorded content references reviewed to determine the rightful final code according to the coding scheme. Weight was not added to single indicators in this original presentation of the PTSIL to maintain a balanced and equal approach between different aspects of sustainability, and to avoid making assumptions over what aspects are more meaningful than others (as applied by e.g., De Gruyter et al. [15]). Further issues related to the development of the PTSIL framework, including indicator weighting and its benefits, are discussed in Section 5.

4. Results

The results are presented based on the layers embedded in the PTSIL, moving from the overarching sustainability dimensions to the thematic sub-sets, and finally, the individual indicators. Here, the case related results will be briefly described and visualized, with particular interest on individual indicator scores presented in Table 4.
Overall, HSL and TTC perform similarly and obtain relatively high average scores in each dimension (see Figure 2). This provides an initial understanding of how inclusively the indicators within and between the three dimensions are addressed in the analyzed policy content. Both authorities score above 2 regarding all dimensions, meaning that most indicators are addressed with at least a desired direction. However, only half of the indicator scores are the same, as shown in Table 4. The thematic sub-sets of indicators are presented as average scores in Figure 3. The thematic division of the dimensions deepens the general trends presented through the dimensional average scores, and moves the analysis towards specific sustainability aspects and individual indicators. The sub-set average scores display how the different wider sustainability aspects are considered in current policy content, allowing for a closer examination of each dimension and moreover the larger trends regarding the way sustainability is framed, particularly essential in identifying weakly addressed sustainability aspects. It is clear from Figure 3 that different aspects are addressed with great variance. For example, health related sustainability scores weakly on average in both cities, while in some sub-sets the average score reaches the maximum value 3 (e.g., EN1 Low emissions for the HSL and SO3 Safety for the TTC). A clear majority of the sub-sets receives an average score between 2 and 3. It must, however, be noted that the volume of indicators within the sub-sets varies (as seen in Table 2). The individual indicator scores presented in Table 4 are discussed in more detail in Section 4.1 and Section 4.2, giving in-depth description of addressed sustainability aspects in both cases.

4.1. HSL Results

On average, HSL scores the highest in the economic dimension (2,7), followed by the environmental dimension (2,6), and finally the social dimension (2,4). HSL scores above 2 in each dimension which implies that most indicators are addressed with a desired direction and a possible target. Out of the 40 indicators, HSL addresses 25 with a clear target, 10 with desired direction, and five indicators in a static or similar manner (Figure 4). HSL does not thus exclude any indicator and addresses over half of them with a target.
The economic indicators only receive scores of 2 and 3, while one environmental indicator and four social indicators are only statically or similarly addressed. Most indicators with a target fall under the social dimension, yet due to the differing volume of indicators within the dimensions, the influence of the individual indicator scores varies in the overall dimensional score. Sustainability aspects that are not addressed with a direction nor a target consist mostly of social indicators, including one environmental indicator. Interestingly, HSL scores low both in public participation and transparency in decision-making. Table 4 presents the individual indicator scores for both authorities.

4.2. TTC Results

TTC receives the highest average score within the environmental dimension (2,5), followed by the social dimension (2,4), while the economic sustainability scores the lowest (2,3). The dimensional average scores obtained by the TTC are slightly lower than those of the HSL, except for the identical score within the social dimension. In total, TTC sets a target for 23 indicators, addresses 11 indicators with a desired direction, similarly or statically addresses five, and fully excludes one indicator (Figure 4). The inclusion levels are lower than those of the HSL for the environmental and economic dimensions, but within the social dimension, the TTC includes one indicator more than the HSL, yet also excludes one.
The TTC scores the weakest within the economic dimension, which can be linked to the challenging funding mechanisms dependent on upper levels of government, thus leading to a situation where the TTC’s hands are tied regarding stable finances [69]. Thus, addressing the economic indicators with a desired direction is common, yet setting exact goals is difficult. Less than half of the economic indicators are given a target, while the number is around 60% for the environmental and social indicators. The scores for individual indicators are presented in Table 4. Both air pollution and GHG emissions are not addressed with a target, which raises concerns since they are both identified as key aspects of sustainable mobility [3]. Improved environmental and individual health and active promotion to non-users score lowest within the social dimension indicators. Furthermore, a journey planner and its development are completely absent in the policy documents, even though the TTC website includes a journey planner search tool. Such issues presented by the content limitations are further discussed in Section 5.

5. Discussion and Conclusions

Our results show that the three dimensions of sustainability are extensively addressed by both authorities, and no dimension is entirely omitted. However, large variation occurs regarding the inclusion of individual indicators and their representative sustainability aspects in the analyzed content. Environmental sustainability includes mostly indicators that focus on limiting emissions and other service outputs, thus making them a feasible target. Hence, in both cases, the high dimensional average scores obtained in the environmental dimension correlate with previous findings in literature, and the slightly lower scores concerning social sustainability support the notion that the realization of social sustainability continues to present challenges in planning (e.g., References [2,13,23]). Yet, we want to emphasize that seemingly both authorities increasingly include social and socio-economic sustainability measures in their practices.
Interestingly, TTC scores slightly higher in social sustainability than the economic one, a finding we link to the challenging funding mechanisms and restricted finances present in the TTC practices [69]. HSL, on the other hand, scores the highest in the economic dimension, reflecting the municipal coalition’s governance structures that bind Helsinki and its region together to coordinate services, and commit to continuously stable funding. It must be noted that the financial struggles of the TTC are not fully dependent on their practices, but on the political will of higher levels of government – a necessary trait for economic sustainability, as noted by e.g., May [29]. Moreover, regional coordination is identified in the literature as a cornerstone of transportation sustainability in growing urban areas (e.g., [4,5,6,27]), and it is currently being addressed in the GTA [67,88]. The issue of fragmentation based on municipal borders within the GTA, and its negative effects on the public transportation services and their usage, are also recognized by Keil and Young [89], and Hatzopoulou and Miller [90].
Overall density has been notably praised in literature as the key to sustainable mobility (e.g., Reference [30]), while others suggest that the focus ought to rather be on studying the variations and distribution of urban population and densities within cities (e.g., References [3,11,27,29]). We, too, argue that overall density is not the most reliable indicator of transportation sustainability. Toronto is nearly 1.5 times denser than Helsinki [91,92], yet facing great challenges regarding its transportation system and public transportation service provision. Focusing on one measure can be misleading, and while urban density is beneficial to public transportation services and their sustainability, a standardized and more comprehensive set of indicators and policy objectives should be applied (as called for by e.g., References [2,5,13,14,15]), and as presented here.
The PTSIL structures and brings together diverse indicators of transportation sustainability presented in literature, with a public transportation focus, thus supporting the need to view the phenomenon more comprehensively. On one hand, it can be used to produce overall dimensional average scores for more general comparison between the three dimensions. On the other hand, individual indicator scores provide valuable information related to current plans, policies, and practices, indicating areas of improvement. Thus, we want to emphasize that individual indicator scores can and should be equally monitored and compared against one another and over time. In our demonstrative study over policy content of the TTC and the HSL, only half of the indicators are addressed with identical scores, even if the dimensional average scores are rather similar. In the absence of existing definitions and assessment tools for planning and governance bodies, such variance in sustainability measures has been identified in literature [2,13]. Thus, looking into the single indicator inclusions is essential for meaningful analysis over the PTSIL results, while maintaining a balanced understanding of the sustainability dimensions to overcome issues of e.g., increased economic measures weakening environmental and social sustainability (as noted by e.g., De Gruyter et al. [15]). The PTSIL analysis both reveals positive actions taking place within the case practices, while also identifying plenty of areas of improvement, such as public participation for the HSL and individual health for the TTC.
Even though the obtained PTSIL results appear to correlate with local conditions and challenges to some extent, the results do not reveal the true state of public transportation service sustainability. It can be argued that our novel approach to construct a comprehensive sustainability check-list that functions as an applicable assessment platform with a policy and planning focus, presents a trade-off of not measuring system performance. Here, the analyzed content was limited to publicly available policy documents outlining planning objectives, targets, and ongoing action. However, it is possible that measures and practices are taking place, but they are not described in the content. Moreover, the indicator list, as it is applied here, does not differentiate between levels of exact targets that have been set. For example, service reliability is addressed by set targets in both cases yielding the same score, yet the HSL service reliability target is set at over 99% with tracked performance reaching it in 2016 [52], while the TTC reliability target is set at 90% for buses and streetcars with tracked performance stagnating around 52–77% [78]. The PTSIL is thus unable to capture such actual numerical values, as it relies on coding the content by an ordinal scale to identify overlooked aspects of sustainability while overcoming issues of comparability. Moreover, our initial presentation of the PTSIL makes no assumptions over indicator importance related to overall sustainability (as discussed by e.g., De Gruyter et al. [15], as well), and thus all indicators are treated equally. Further research is thus recommended to determine weighting of the single indicators. For example, within the environmental dimensions, the TTC does not set a target for greenhouse gas emissions nor air pollution reductions, both of which are considered key aspects of sustainability (e.g., [3]). The HSL sets one for both, yet the dimensional average scores are very close together. By attaching weight to indicators based on their importance to overall sustainability, exclusion of such key measures could be made more visible in the dimensional and thematic sub-set average scores. Thus, in future research, incorporating indicator weighting into the framework alongside accommodation of primary data is highlighted.
With this study, we demonstrate the potential of the PTSIL in public transportation planning and policy-making processes, and emphasize its applicability and versatility. Designed independently of pre-existing local conditions and data availability issues, it can be applied in both external assessments, as presented here, and to review, assess, and develop policies and practices in internal processes within the public transportation sector. As recognized by e.g., Olofsson et al. [17], the planning and decision-making sectors require more applicable and supportive tools and methods to assess, monitor, and guide their processes towards a more comprehensive and inclusive view of sustainability. The PTSIL thus bridges the gap between descriptive definitions of transportation sustainability (e.g., European Union Council of Transport Ministers’ statement) and case specific sustainability performance assessments within the public transportation sector, by providing a comprehensive platform for assessments that does not limit the use of, for example, social sustainability indicators. Aligned with previous academic literature calling for a balanced, holistic and integrated view of public transportation sustainability (e.g., [4,5]), the PTSIL maintains an approach that is accessible [16,22], and holds potential, in planning and policy processes. Our assessment framework continues the line of work carried out by e.g., Ramani et al. [22], Marsden et al. [13], and Olofsson et al. [17], in making the overarching definitions of sustainability more attainable in practice, while constructing the first policy-oriented assessment tool with a public transportation focus.

Supplementary Materials

The following are available online at https://www.mdpi.com/2071-1050/11/4/1028/s1, Document S1: Krippendorff’s alpha intercoder reliability test, Table S1: HSL Codebook and references, Table S2: TTC Codebook and references.

Author Contributions

Conceptualization, L.K. and S.J.; Methodology, L.K.; Analysis, L.K. and S.J.; Data curation, L.K.; Writing—original draft preparation, L.K.; Writing—review and editing, L.K. and S.J.

Funding

This research received no external funding.

Acknowledgments

We would like to thank the three anonymous reviewers for their helpful comments.

Conflicts of Interest

The authors declare no conflict of interest.

References

  1. United Nations. World Urbanization Prospects: The 2014 Revision (ST/ESA/SER.A/366); United Nations, Department of Economic and Social Affairs, Population Division: New York, NY, USA, 2014; Available online: https://esa.un.org/unpd/wup/Publications/Files/WUP2014-Report.pdf (accessed on 1 October 2016).
  2. Jeon, C.M.; Amekudzi, A. Addressing Sustainability in Transportation Systems: Definitions, Indicators, and Metrics. J. Infrastruct. Syst. 2005, 11, 31–50. [Google Scholar] [CrossRef]
  3. Banister, D. Sustainable Urban Development and Transport—A Eurovision for 2020. Transp. Rev. 2000, 20, 113–130. [Google Scholar] [CrossRef]
  4. Pardo, C.F.; Jiemian, Y.; Hongyuan, Y.; Mohanty, C.R. Sustainable urban transport. In United Nations, Department of Economic and Social Affairs (UNDESA), Shanghai Manual—A Guide for Sustainable Urban Development in the 21st Century; The Commercial Press Ltd.: Beijing, China, 2012; pp. 1–36. Available online: https://sustainabledevelopment.un.org/content/documents/shanghaimanual.pdf (accessed on 5 October 2016).
  5. Schiller, P.L.; Bruun, E.C.; Kenworthy, J.R. An Introduction to Sustainable Transportation: Policy, Planning, and Implementation; Earthscan Ltd.: London, UK, 2010. [Google Scholar]
  6. Wheeler, S.M. Planning for Metropolitan Sustainability. J. Plan. Educ. Res. 2000, 20, 133–145. [Google Scholar] [CrossRef]
  7. Wheeler, S.M.; Beatley, T. Sustainable Urban Development Reader, 3rd ed.; Routledge: Abingdon, UK, 2014. [Google Scholar]
  8. Brundtland, G.H.; WCED. Our Common Future (Report of the World Commission on Environment and Development); Oxford University: Oxford, UK, 1987. [Google Scholar]
  9. Bickel, P.; Ahvenharju, S.; Könnölä, T.; Hjelt, M.; De Tommasi, R.; Arend, M.; Röhling, W.; Burg, R. SUMMA: Deliverable 2 of Workpackage 1: Setting the Context for Defining Sustainable Transport and Mobility. 2003. Available online: http://www.tmleuven.be/project/summa/summa-d2.pdf (accessed on 5 February 2017).
  10. Goldman, T.; Gorham, R. Sustainable Urban Transport: Four Innovative Directions. Technol. Soc. 2006, 28, 261–273. [Google Scholar] [CrossRef]
  11. Hull, A. Policy Integration: What Will it Take to Achieve More Sustainable Transport Solutions in Cities? Transp. Policy 2008, 15, 94–103. [Google Scholar] [CrossRef]
  12. Litman, T.; Burwell, D. Issues in Sustainable Transportation. Int. J. Glob. Environ. Issues 2006, 6, 331–347. [Google Scholar] [CrossRef]
  13. Marsden, G.; Kimble, M.; Nellthorp, J.; Kelly, C. Sustainability Assessment: The Definition Deficit. Int. J. Sustain. Transp. 2010, 4, 189–211. [Google Scholar] [CrossRef] [Green Version]
  14. Miller, P.; de Barros, A.G.; Kattan, L.; Wirasinghe, S.C. Public Transportation and Sustainability: A Review. Ksce J. Civ. Eng. 2016, 20, 1076–1083. [Google Scholar] [CrossRef]
  15. De Gruyter, C.; Currie, G.; Rose, G. Sustainability Measures of Urban Public Transport in Cities: A World Review and Focus on the Asia/Middle East Region. Sustainability 2017, 9, 43. [Google Scholar] [CrossRef]
  16. Litman, T. Developing Indicators for Comprehensive and Sustainable Transport Planning. Transp. Res. Rec. J. Transp. Res. Board 2007, 2017, 10–15. [Google Scholar] [CrossRef]
  17. Olofsson, Z.; Hiselius, L.; Várhelyi, A. Development of a tool to assess urban transport sustainability: The case of Swedish cities. Int. J. Sustain. Transp. 2016, 10, 645–656. [Google Scholar] [CrossRef]
  18. Chow, J.Y.J.; Hernandez, S.; Bhagat, A.; McNally, M.G. Multi-Criteria Sustainability Assessment in Transport Planning for Recreational Travel. Int. J. Sustain. Transp. 2013, 8, 151–175. [Google Scholar] [CrossRef]
  19. Danielis, R.; Rotaris, L.; Monte, A. Composite indicators of sustainable urban mobility: Estimating the rankings frequency distribution combining multiple methodologies. Int. J. Sustain. Transp. 2018, 12, 380–395. [Google Scholar] [CrossRef]
  20. Maheshwari, P.; Kachroo, P.; Paz, A.; Khaddar, R. Development of control models for the planning of sustainable transportation systems. Transp. Res. Part C 2015, 55, 474–485. [Google Scholar] [CrossRef]
  21. Miller, P.; de Barros, A.G.; Kattan, L.; Wirasinghe, S.C. Analyzing the Sustainability Performance of Public Transit. Transp. Res. Part D 2016, 44, 177–198. [Google Scholar] [CrossRef]
  22. Ramani, T.; Zietsman, J.; Gudmundsson, H.; Hall, R.; Marsden, G. Framework for Sustainability Assessment by Transportation Agencies. Transp. Res. Rec. J. Transp. Res. Board 2011, 2242, 9–18. [Google Scholar] [CrossRef] [Green Version]
  23. Boschmann, E.E.; Kwan, M.-P. Toward Socially Sustainable Urban Transportation: Progress and Potentials. Int. J. Sustain. Transp. 2008, 2, 138–157. [Google Scholar] [CrossRef]
  24. Murray, A.T.; Davis, R.; Stimson, R.J.; Ferreira, L. Public Transportation Access. Transp. Res. Part D 1998, 3, 319–328. [Google Scholar] [CrossRef] [Green Version]
  25. Banister, D. Cities, mobility and climate change. J. Transp. Geogr. 2011, 19, 1538–1546. [Google Scholar] [CrossRef]
  26. Dell’Olio, L.; Ibeas, A.; Cecin, P. The Quality of Service Desired by Public Transport Users. Transp. Policy 2011, 18, 217–227. [Google Scholar] [CrossRef]
  27. Næss, P. New Urbanism’ or Metropolitan-level Centralization? A Comparison of the Influences of Metropolitan-level and Neighborhood-level Urban Form Characteristics on Travel Behavior. J. Transp. Land Use 2011, 4, 25–44. [Google Scholar]
  28. Atkinson, G.; Oleson, T. Urban sprawl as a path dependent process. J. Econ. Issues 1996, 30, 609–615. [Google Scholar] [CrossRef]
  29. May, A. Urban Transport and Sustainability: The Key Challenges. Int. J. Sustain. Transp. 2013, 7, 170–185. [Google Scholar] [CrossRef]
  30. Newman, P.; Kenworthy, J. Cities and Automobile Dependence: An International Sourcebook; Gower Publishing: Aldershot, UK, 1989. [Google Scholar]
  31. Nijkamp, P.; Ouwersloot, H.; Rienstra, S.A. Sustainable Urban Transport Systems: An Expert-based Strategic Scenario Approach. Urban Stud. 1997, 34, 693–712. [Google Scholar] [CrossRef]
  32. Rodrigue, J.-P.; Comtois, C.; Slack, B. The Geography of Transport Systems; Routledge: Oxford, UK, 2006. [Google Scholar]
  33. Kennedy, C.; Miller, E.; Shalaby, A.; Maclean, H.; Coleman, J. The Four Pillars of Sustainable Urban Transportation. Transp. Rev. 2005, 25, 393–414. [Google Scholar] [CrossRef]
  34. Richardson, B.C. Sustainable Transport: Analysis Frameworks. J. Transp. Geogr. 2005, 13, 29–39. [Google Scholar] [CrossRef]
  35. Environmental Protection Agency. Guide to Sustainable Transportation Performance Measures (EPA Publication No. 231-K-10-004). 2011. Available online: https://www.epa.gov/sites/production/files/2014-01/documents/sustainable_ transpo_performance.pdf (accessed on 16 November 2016).
  36. Walker, W.E.; van Grol, R.; Rahman, S.A.; van de Voort, M.; Röhling, W.; Burg, R. Policy Analysis of Sustainable Tranport and Mobility: The SUMMA Project. In Building Blocks for Sustainable Transport: Obstacles, Trends, Solutions; Perrels, A., Himanen, A., Lee-Gosselin, M., Eds.; Emerald Group Publishing Limited: Bingley, UK, 2007; pp. 225–272. [Google Scholar]
  37. Kenworthy, J.R. Sustainable Urban Transport: Developing Sustainability Rankings and Clusters based on International Comparisons of Cities. In Handbook of Sustainability Research; Filho, W.L., Ed.; Peter Lang: Frankfurt, Germany, 2005; pp. 409–437. [Google Scholar]
  38. Dobranskyte-Niskota, A.; Perujo, A.; Pregl, M. Indicators to Assess Sustainability of Transport Activities Part 1: Review of the Existing Transport Sustainability Indicators Initiatives and Development of an Indicator Set to Assess Transport Sustainability Performance (Report). European Commission. 2007. Available online: https://publications.europa.eu/en/publication-detail/-/publication/ba11f7f1-368b-464f-987f-3e571be6f678/language-en (accessed on 1 September 2016).
  39. Solecki, W.; Rosenzweig, C.; Hammer, S.; Mehrotra, S. The Urbanization of Climate Change: Responding to a New Global Challenge. In Sustainable Urban Development Reader, 3rd ed.; Wheeler, S.M., Beatley, T., Eds.; Routledge: Abingdon, UK, 2013; pp. 107–116. [Google Scholar]
  40. Shen, L.-Y.; Ochoa, J.; Shah, M.N.; Zhang, X. The Application of Urban Sustainability Indicators—A Comparison between Various Practices. Habitat Int. 2011, 35, 17–29. [Google Scholar] [CrossRef]
  41. Hertel, S.; Keil, R.; Collens, M. Next Stop: Equity—Routes to Fairer Transit Access in the Greater Toronto and Hamilton Area. 2016. Available online: http://city.apps01.yorku.ca/wpcontent/uploads/2016/02/Transit-Equity_Reduced_020216.pdf (accessed on 10 November 2016).
  42. Swyngedouw, E.; Heynen, N.C. Urban Political Ecology, Justice and the Politics of Scale. Antipode 2003, 34, 898–918. [Google Scholar] [CrossRef]
  43. Garrett, M.; Taylor, B. Reconsidering Social Equity in Public Transit. Berkeley Plan. J. 1999, 13, 6–27. [Google Scholar]
  44. Sanchez, T.W. Poverty, Policy, and Public Transportation. Transp. Res. Part A 2008, 42, 833–841. [Google Scholar] [CrossRef]
  45. Sanchez, T.W.; Wolf, J.F. Environmental Justice and Transportation Equity: A Review of Metropolitan Planning Organizations (Paper to be presented at the Racial Equity in Transportation: Establishing Priorities for Research and Policy roundtable sponsored by the Civil Rights Project at Harvard). Available online: https://www.researchgate.net/profile/Thomas_Sanchez/publication/230820724_Environmental_justice_and_transportation_equity_A_review_of_metropolitan_planning_organizations/links/0fcfd50b5a04eda5a4000000.pdf (accessed on 5 September 2016).
  46. Murray, A.T.; Davis, R. Equity in Regional Service Provision. J. Reg. Sci. 2001, 41, 577–600. [Google Scholar] [CrossRef]
  47. Fellesson, M.; Friman, M. Perceived Satisfaction with Public Transport Service in Nine European Cities. J. Transp. Res. Forum 2008, 47, 93–103. [Google Scholar] [CrossRef]
  48. OECD. Towards Sustainable Transportation (OECD Proceedings—The Vancouver Conference 1996, March 24–27th). Available online: http://www.oecd.org/greengrowth/greening-transport/2396815.pdf (accessed on 10 November 2016).
  49. Cervero, R. Transit pricing research: A review and synthesis. Transportation 1990, 17, 117–139. [Google Scholar] [CrossRef]
  50. Haghshenas, H.; Vaziri, M. Urban Sustainable Transportation Indicators for Global Comparison. Ecol. Indic. 2012, 15, 115–121. [Google Scholar] [CrossRef]
  51. Krippendorff, K. Content Analysis: An Introduction to its Methodology; Sage Publications Ltd.: London, UK, 2004. [Google Scholar]
  52. Neuendorf, K.A. The Content Analysis Guidebook; Sage Publications: Thousand Oaks, CA, USA, 2002. [Google Scholar]
  53. Metsämuuronen, J. Tutkimuksen Tekemisen Perusteet Ihmistieteissä; Gummerus Kirjapaino Oy: Jyväskylä, Finland, 2009. [Google Scholar]
  54. HSL. HSL Vuosikertomus 2015. Available online: https://www.hsl.fi/sites/default/files/hsl_vuosikertomus_fi_2015_aukeamat_1.pdf (accessed on 10 November 2016).
  55. TTC. System Map. Available online: http://www.ttc.ca/PDF/Maps/TTC_SystemMap.pdf (accessed on 1 November 2016).
  56. HSL. HSL liikuttaa meitä kaikkia. Available online: https://www.hsl.fi/sites/default/files/uploads/hsl_liikuttaa_meita_kaikkia_0.pdf (accessed on 10 November 2016).
  57. HSL. HSL Perussopimus. Available online: https://www.hsl.fi/sites/default/files/uploads/hsl_perussopimus.pdf (accessed on 10 November 2016).
  58. Helsingin kaupunki. Helsingin Yleiskaava. Available online: http://www.hel.fi/hel2/ksv/julkaisut/yos_2016-3.pdf (accessed on 20 January 2017).
  59. Helsingin kaupunki. Joukkoliikenteen runkoverkko 2050. Available online: http://www.hel.fi/hel2/ksv/Liitteet/2016_kaava/Yleiskaava_joukkoliikenteen_runkoverkko_20160614.pdf (accessed on 20 January 2017).
  60. HSL. Helsingin seudun liikennejärjestelmäsuunnitelma HLJ 2015. Available online: https://www.hsl.fi/sites/default/files/uploads/2015-03-03-hlj_2015-raportti.pdf (accessed on 10 November 2016).
  61. HSL. Matkan pituus näkymään lipun hinnassa entistä selvemmin. Available online: https://www.hsl.fi/taksa-ja-lippujarjestelma (accessed on 30 January 2017).
  62. HSL. HSL:n hallitus hyväksyi sopimusmallin matkaketjuyhteistyöstä. Available online: https://www.hsl.fi/uutiset/2016/hsln-hallitushyvaksyi-sopimusmallin-matkaketjuyhteistyosta-9317 (accessed on 20 January 2017).
  63. HSL. Digitalisation to Enable More Freedom of Choice in Transport. Available online: https://www.hsl.fi/en/news/2015/digitalisation-enablemore-freedom-choice-transport-6052 (accessed on 20 January 2017).
  64. HSL. HLJ 2015 Joukkoliikennestrategia. Available online: https://www.hsl.fi/sites/default/files/uploads/joukkoliikennestrategia_hlj2015_raportti.pdf (accessed on 10 November 2016).
  65. HSL. HLJ 2015:n nykytilatarkastelu (NYYTTI). Available online: https://www.hsl.fi/sites/default/files/ uploads/nykytilatarkastelu_nyytti_hlj2015_raportti.pdf (accessed on 10 November 2016).
  66. City of Toronto. Toronto Transit Commission (TTC)—Board Governance Structure. Available online: http://www1.toronto.ca/wps/portal/contentonly?vgnextoid=c773811db1704410VgnVCM10000071d60f89RCRD (accessed on 25 January 2017).
  67. Metrolinx. The Big Move—Transforming Transportation in the Greater Toronto and Hamilton Area. Available online: http://www.metrolinx.com/thebigmove/Docs/big_move/TheBigMove_020109.pdf (accessed on 20 November 2016).
  68. City of Toronto. Toronto Official Plan. Available online: http://www1.toronto.ca/planning/chapters1-5.pdf (accessed on 25 January 2017).
  69. TTC. Five Year Corporate Plan 2013–2017. Available online: https://www.ttc.ca/PDF/TTC_Corporate-Plan_Accessible_v2.pdf (accessed on 1 November 2016).
  70. Kennedy, C. A Comparison of the Sustainability of Public and Private Transportation Systems: Study of the Greater Toronto Area. Transportation 2002, 29, 459–493. [Google Scholar] [CrossRef]
  71. Miller, E.J.; Shalaby, A. Evolution of Personal Travel in Toronto Area and Policy Implications. J. Urban Plan. Dev. 2003, 129, 1–26. [Google Scholar] [CrossRef]
  72. Toronto Foundation. Toronto’s Vital Signs 2015 Report. Available online: http://2015.torontosvitalsigns.ca/sites/default/files/OP-TVS%202015-Full-Report-PRINTING.pdf (accessed on 10 April 2016).
  73. HSL. HSL:n joukkoliikenteen asiakastyytyväisyystutkimus, syksy 2015. Available online: https://www.hsl.fi/sites/default/files/uploads/7_2016_asty_syksy_2015.pdf (accessed on 10 November 2016).
  74. HSL. Joukkoliikenteen suunnitteluohje HSL-liikenteessä 2016. Available online: https://www.hsl.fi/sites/default/files/uploads/joukkoliikenteen_suunnitteluohje_hsl-liikenteessa_2016.pdf (accessed on 10 November 2016).
  75. HSL. Viisas liikkuminen: Kestävät liikkumisvalinnat. Available online: https://www.hsl.fi/sites/default/files/00_viisas_liikkuminen_helsingin_seutu_tietopaketti_hsl.pdf (accessed on 12 November 2016).
  76. HSL. Ympäristöraportti. Available online: https://www.hsl.fi/sites/default/files/uploads/ hsl_ymparistoraportti_2014.pdf (accessed on 11 November 2016).
  77. HSL. HSL Toimintastrategia 2025 ja tausta-aineisto. Available online: https://www.hsl.fi/sites/default/files/uploads/hsl_toimintastrategia.pdf; https://www.hsl.fi/sites/default/files/uploads/hsl_toimintastrategia_tausta_aineisto.pdf (accessed on 10 November 2016).
  78. HSL. HSL:n laatu-ja ympäristöpolitiikka. Available online: ttps://www.hsl.fi/sites/default/files/uploads/hsl_laatu_ja_ymparistopolitiikka.pdf (accessed on 10 November 2016).
  79. TTC. 2016 TTC Accessibility Plan Status Report. Available online: https://www.ttc.ca/About_the_TTC/Commission_reports_and_information/Commission_meetings/2016/February_25/Reports/2016_Accessibility_Plan_Status_Report_BR_17780_V2.pdf (accessed on 1 November 2016).
  80. TTC. TTC Chief Executive Officer’s Report—May 2016 Update. Available online: https://www.ttc.ca/About_the_TTC/CEO_Report/index.jsp (accessed on 1 November 2016).
  81. TTC. TTC Annual Report 2015. Available online: https://www.ttc.ca/PDF/About_the_TTC/Annual_Reports/TTC_2015AnnualReport_AODA_FINAL-s.pdf (accessed on 1 November 2016).
  82. TTC. 2014-2018 TTC Multi-Year Accessibility Plan. Available online: http://www.toronto.ca/legdocs/mmis/2014/di/bgrd/backgroundfile-70029.pdf (accessed on 1 November 2016).
  83. TTC. TTC Customer Satisfaction Survey—2013 Results. Available online: https://www.ttc.ca/PDF/Customer_Service/Board_Presentation_on_Customer_Satisfaction_Survey_2013_Q1-Q.pdf (accessed on 1 November 2016).
  84. TTC. TTC Environmental Plan—Initiatives and Implementation. Available online: https://www.ttc.ca/About_the_TTC/Commission_reports_and_information/Commission_meetings/2007/Dec_6_2007/Other/TTC_Environmental_Pl.pdf (accessed on 1 November 2016).
  85. TTC. TTC Ridership Growth Strategy. Available online: https://www.ttc.ca/PDF/Transit_Planning/ridership_growth_strategy_2003.pdf (accessed on 1 November 2016).
  86. TTC. TTC Sustainability Report 2013. Available online: http://www.ttc.ca/PDF/About_the_TTC/Sustainability_Reports/2013_Sustainability_Report.PDF (accessed on 1 November 2016).
  87. City of Toronto. Toward a Policy Framework for Toronto Transit Fare Equity. Available online: https://www.toronto.ca/legdocs/mmis/2014/ex/bgrd/backgroundfile-70755.pdf (accessed on 1 November 2016).
  88. Metrolinx. 2015–2020 Metrolinx Five Year Strategy. Available online: http://www.metrolinx.com/en/aboutus/publications/Metrolinx_Five_Year_Strategy_2015-2020_EN.pdf (accessed on 20 November 2016).
  89. Keil, R.; Young, D. Transportation: The Bottleneck of Regional Competitiveness in Toronto. Environ. Plan. C: Gov. Policy 2008, 26, 728–751. [Google Scholar] [CrossRef]
  90. Hatzopoulou, M.; Miller, E.J. Institutional Integration for Sustainable Transportation Policy in Canada. Transp. Policy 2008, 15, 149–162. [Google Scholar] [CrossRef]
  91. Statistics Canada. 2011 Census of Population: Toronto, Ontario (Code 3520005) and Ontario (Code 35) (Table), Statistics Canada Catalogue No. 98-316-XWE, Ottawa. Available online: https://www12.statcan.gc.ca/census-recensement/2011/dp-pd/prof/details/page.cfm?Lang=E&Geo1=CSD&Code1=3520005&Geo2=PR&Code2=35&Data=Count&SearchText=Toronto&SearchType=Begins&SearchPR=01&B1=All&GeoLevel=PR&GeoCode=3520005 (accessed on 15 November 2016).
  92. Suomen virallinen tilasto. Väestörakenne (ISSN=1797-5379). Helsinki: Tilastokeskus. Available online: http://www.stat.fi/tup/alue/kuntienavainluvut.html#?year=2016&active1=091 (accessed on 16 December 2016).
Figure 1. Analytical framework. This figure gathers together diverse sustainability aspects relevant to public transportation services, as identified from literature. The aspects presented here form the higher-level thematic view on public transportation sustainability and provide the basis and structure for the construction of the more detailed Public Transportation Sustainability Indicator List (PTSIL).
Sustainability 11 01028 g001
Figure 2. Dimensional average scores. In this figure the dimensional average scores for the Helsingin Seudun Liikenne (HSL) and the Toronto Transit Commission (TTC) are presented. Average score for each dimension was calculated based on the individual indicator scores (as seen in Table 4) ranging on a 0–3 scale according to the scoring scheme. Value 3 thus, too, presents the highest possible average score, signifying that all indicators within the dimension would be addressed in the analyzed policy content with a specific target.
Sustainability 11 01028 g002
Figure 3. Thematic sub-set average scores. This figure deepens the analysis of the dimensional average scores and provides a structuring and generalizing layer of result analysis between the overarching dimensions and individual indicators. Here, average scores are applied for each thematic sub-set that structure the Public Transportation Sustainability Indicator List (PTSIL) framework and form cohesive groups of indicators. The average scores were calculated based on the individual indicator scores (as seen in Table 4) ranging on a 0–3 scale according to the scoring scheme. Value 3 thus presents the highest possible average score, signifying that all indicators within the sub-set would be addressed with a specific target.
Sustainability 11 01028 g003
Figure 4. Helsingin Seudun Liikenne (HSL) and Toronto Transit Commission (TTC) indicator inclusion. This figure presents the scores (0–3) obtained by single indicators in the analysis (as presented in Table 4) within the three sustainability dimensions. The color scheme for the scores is applied by using blue for the HSL and red for the TTC, with darker hues accounting for more ambitious inclusion and targeting of indicators and lighter shades for neglect or exclusion. The stacked columns present percentage values on the y axis due to differing volumes of indicators within the Public Transportation Sustainability Indicator List (PTSIL) dimensions, but the numerical values inside the columns represent the volume of indicators that obtained a certain score in the analysis. The figure provides insight on the inclusion levels of indicators within and between the dimensions, while summarizing and generalizing the detailed indicator scores of Table 4.
Sustainability 11 01028 g004
Table 1. Indicator selection criteria (adopted from Haghshenas and Vaziri [50]).
CriterionExplanation
Target relevanceIndicator must show one aspect of sustainable transportation
Data availability and measurabilityIndicators must be measurable with chosen data
ValidityIndicators must measure the issue it is supposed to measure
SensitivityIndicator must be able to reveal sustainable transport changes
TransparencyIndicators should be feasible to understand and possible to reproduce
IndependentIndicators should be independent of each other
StandardizedIndicators should be standardized by city size for comparison
Table 2. Public Transportation Sustainability Indicator List.
Environmental Sustainability
EN1 Low emissionsEN1-1 GHG emissions (↓)
EN1-2 Air pollution (PM, NOx, SOx, O3) (↓)
EN1-3 Noise pollution (↓)
EN1-4 Use of renewable energy (↑)
EN1-5 Use of innovative technology (↑)
EN2 Efficient use of resourcesEN2-1 Emissions per passenger (↓)
EN2-2 Efficient energy use (↑)
EN2-3 Amount of waste (↓)
EN3 Efficient land useEN3-1 Preservation of open land and natural areas (↑)
EN3-2 Transit oriented development (↑)
EN4 Vulnerabilities and risksEN4-1 Vulnerability and risk assessment (↑)
EN4-2 Vulnerability and risk contingency (↑)
Social Sustainability
SO1 Physical accessSO1-1 Proximity to service (↑)
SO1-2 Service frequency (↑)
SO1-3 Travel time (↓)
SO1-4 Multi-modality (↑)
SO1-5 Inter-modality (↑)
SO1-6 Access with disabilities (↑)
SO2 Socio-economic accessSO2-1 Share of income used on PT (↓)
SO2-2 Attention to the elderly, young, and low-income (↑)
SO3 SafetySO3-1 Traffic accidents and injuries (↓)
SO3-2 Feeling of safety (↑)
SO4 HealthSO4-1 Improved environmental health (↑)
SO4-2 Improved individual health (↑)
SO5 Information availabilitySO5-1 Timely service information available (↑)
SO5-2 Personal journey planner available (↑)
SO5-3 Transparency in decision-making (↑)
SO6 AttractivenessSO6-1 User satisfaction (↑)
SO6-2 Active promotion to non-users (↑)
SO6-2 Service reliability (↑)
SO7 Planning and participationSO7-1 Public participation (↑)
SO7-2 Regional cooperation (↑)
SO7-3 Commitment to long-term plans (↑)
Economic Sustainability
EC1 Financial stabilityEC1-1 State funding and subsidies (↑)
EC1-2 Fare revenue (↑)
EC1-3 Budget deficit (↓)
EC2 CompetitivenessEC2-1 High ridership (↑)
EC2-2 System capacity (↑)
EC2-3 Investment cost-efficiency (↑)
EC2-4 Operating cost-efficiency (↑)
Table 3. Helsingin Seudun Liikenne (HSL) and Toronto Transit Commission (TTC) data [54,56,57,60,64,69,73,74,75,76,77,78,79,80,81,82,83,84,85,86,87].
  HSL  TTC
  • HSL Perussopimus, 2012 (HSL Treaty)
  • HSL liikuttaa meitä kaikkia, 2014 (HSL Moves us all)
  • HSL Toimintastrategia 2025 ja tausta-aineisto, 2014 (HSL Strategy 2025 and background material)
  • HLJ 2015 Joukkoliikennestrategia, 2014 (HLJ 2015 Public transport strategy)
  • Helsingin seudun liikennejärjestelmäsuunnitelma HLJ 2015, 2015 (Helsinki Region Transport System Plan HLJ 2015)
  • HSL Vuosikertomus 2015, 2016 (HSL Annual report 2015)
  • Ympäristöraportti 2014, 2015 (Environmental report 2014)
  • HSL:n joukkoliikenteen asiakastyytyväisyystutkimus, syksy 2015, 2016 (HSL’s public transport customer satisfaction survey, Autumn 2015)
  • HSL:n laatu- ja ympäristöpolitiikka, n.d. (HSL Quality and environmental policy)
  • Viisas liikkuminen: Kestävät liikkumisvalinnat, 2015 (Sustainable mobility)
  • Joukkoliikenteen suunnitteluohje HSL-liikenteessä, 2016 (Public Transport Planning Guidelines for HSL’s Transport Services)
  • TTC Chief Executive Officer’s Report—May 2016 Update, 2016
  • TTC: Five Year Corporate Plan 2013–2017, 2013
  • TTC Ridership Growth Strategy, 2003
  • 2014-2018 TTC Multi-Year Accessibility Plan, 2014
  • 2016 Accessibility Plan Status Report, 2016
  • TTC Annual Report 2015, 2016
  • TTC Environmental Plan—Initiatives and implementation, 2007
  • TTC Customer Satisfaction Survey—2013 Results, 2013
  • TTC Sustainability Report 2013, n.d.
  • TTC and City of Toronto: Toward a Policy Framework for Toronto Transit Fare Equity, 2014
Table 4. Individual indicator scores obtained by the Helsingin Seudun Liikenne (HSL) and the Toronto Transport Commission (TTC). Column on the left is divided according to the scoring scheme: 0 = indicator not addressed, 1 = indicator similarly or statically addressed, 2 = indicator addressed with desired direction (increase or decrease as presented through arrows), and 3 = indicator addressed with desired direction and a target.
ScoreHSLTTC
0 SO5-2 Personal journey planner available (↑)
1EN2-3 Amount of waste (↓)
SO3-2 Feeling of safety (↑)
SO4-1 Improved environmental health (↑)
SO5-3 Transparency in decision-making (↑)
SO7-1 Public participation (↑)
EN2-1 Emissions per passenger (↓)
SO4-1 Improved environmental health (↑)
SO4-2 Improved individual health (↑)
SO6-2 Active promotion to non-users (↑)
EC2-3 Investment cost-efficiency (↑)
2EN2-1 Emissions per passenger (↓)
EN3-1 Preservation of open land and natural areas (↑)
EN4-1 Vulnerability and risk assessment (↑)
SO1-1 Proximity to service (↑)
SO1-3 Travel time (↓)
SO2-1 Share of income used on PT (↓)
SO3-1 Traffic accidents and injuries (↓)
SO4-2 Improved individual health (↑)
EC1-3 Budget deficit (↓)
EC2-2 System capacity (↑)
EN1-1 GHG emissions (↓)
EN1-2 Air pollution (PM, NOx, SOx, O3) (↓)
EN1-3 Noise pollution (↓)
EN3-2 Transit oriented development (↑)
SO1-1 Proximity to service (↑)
SO1-3 Travel time (↓)
SO1-4 Multi-modality (↑)
SO2-1 Share of income used on PT (↓)
EC1-2 Fare revenue (↑)
EC1-3 Budget deficit (↓)
EC2-4 Operating cost-efficiency (↑)
3EN1-1 GHG emissions (↓)
EN1-2 Air pollution (PM, NOx, SOx, O3) (↓)
EN1-3 Noise pollution (↓)
EN1-4 Use of renewable energy (↑)
EN1-5 Use of innovative technology (↑)
EN2-2 Efficient energy use (↑)
EN3-2 Transit oriented development (↑)
EN4-2 Vulnerability and risk contingency (↑)
SO1-2 Service frequency (↑)
SO1-4 Multi-modality (↑)
SO1-5 Inter-modality (↑)
SO1-6 Access with disabilities (↑)
SO2-2 Attention to the elderly, young, and low-income (↑)
SO5-1 Timely service information available (↑)
SO5-2 Personal journey planner available (↑)
SO6-1 User satisfaction (↑)
SO6-2 Active promotion to non-users (↑)
SO6-2 Service reliability (↑)
SO7-2 Regional cooperation (↑)
SO7-3 Commitment to long-term plans (↑)
EC1-1 State funding and subsidies (↑)
EC1-2 Fare revenue (↑)
EC2-1 High ridership (↑)
EC2-3 Investment cost-efficiency (↑)
EC2-4 Operating cost-efficiency (↑)
EN1-4 Use of renewable energy (↑)
EN1-5 Use of innovative technology (↑)
EN2-2 Efficient energy use (↑)
EN2-3 Amount of waste (↓)
EN3-1 Preservation of open land and natural areas (↑)
EN4-1 Vulnerability and risk assessment (↑)
EN4-2 Vulnerability and risk contingency (↑)
SO1-2 Service frequency (↑)
SO1-5 Inter-modality (↑)
SO1-6 Access with disabilities (↑)
SO2-2 Attention to the elderly, young, and low-income (↑)
SO3-1 Traffic accidents and injuries (↓)
SO3-2 Feeling of safety (↑)
SO5-1 Timely service information available (↑)
SO5-3 Transparency in decision-making (↑)
SO6-1 User satisfaction (↑)
SO6-2 Service reliability (↑)
SO7-1 Public participation (↑)
SO7-2 Regional cooperation (↑)
SO7-3 Commitment to long-term plans (↑)
EC1-1 State funding and subsidies (↑)
EC2-1 High ridership (↑)
EC2-2 System capacity (↑)

