Article

Factors Influencing Upcycling for UK Makers

1
Faculty of Arts, Design and Humanities, De Montfort University, Leicester LE1 9BH, UK
2
School of Architecture, Design and the Built Environment, Nottingham Trent University, Nottingham NG1 4FQ, UK
3
School of Design, The University of Edinburgh, Edinburgh EH8 9YL, UK
*
Author to whom correspondence should be addressed.
Sustainability 2019, 11(3), 870; https://doi.org/10.3390/su11030870
Submission received: 16 January 2019 / Revised: 28 January 2019 / Accepted: 3 February 2019 / Published: 7 February 2019

Abstract

:
Changing consumer behaviour can reduce environmental impacts. Upcycling is one of the understudied yet promising, environmentally sustainable behaviours that has the potential to contribute to the reduction of waste and greenhouse gas emissions. This paper addresses this knowledge gap by exploring factors influencing upcycling for UK makers. The study employed a survey based on Triandis’s theory of interpersonal behaviour and Ajzen’s theory of planned behaviour. The survey results revealed key determinants of upcycling as attitude, intention, and subjective norm, and demographic characteristics of people who are more likely to upcycle frequently as females aged 30+ working in art and design. The paper further discusses the theoretical and practical implications of the study.

1. Introduction

Global greenhouse gas (GHG) emissions continue to rise due to high levels of consumption [1,2]. An important distinction is between ‘territorial’ emissions and ‘consumption-based’ emissions, with the latter taking imported goods and services into account and being around twice the level of territorial (i.e., production-based) emissions in industrialised countries [1,3]. For example, UK territorial emissions between 1990 and 2009 showed a 27% reduction, whereas the UK’s consumption-based GHG emissions showed 20% of growth between 1990 and 2008, taking into account emissions from imports [1,4,5]. Changing consumer behaviour, therefore, has the potential to reduce emissions significantly across national boundaries [6]. For this reason, along with other environmental and social benefits (e.g., reducing waste, improving health and well-being), several top–down and bottom–up approaches to changing consumer behaviours have been investigated and implemented in order to promote sustainable behaviours [7,8,9,10,11], such as purchasing sustainable products [12], recycling [13], walking and cycling instead of driving [14], using fewer plastic bags and less packaging [15,16], and saving energy [17]. Amongst these behaviours, upcycling is an understudied yet promising sustainable behaviour that has the potential to contribute significantly to the reduction of waste and energy consumption and, therefore, GHG emissions [18,19]. This study aimed to investigate upcycling focusing on factors influencing upcycling for UK makers.

1.1. Upcycling

Upcycling is a relatively new term with varied definitions and practices, which is often defined as the material process of retaining high quality in a closed-loop industrial cycle [20,21,22,23]. Our preferred definition is ‘the creation or modification of a product from used or waste materials, components or products which is of equal or higher quality or value than its compositional elements’ [18,24]. Upcycling is popularly understood as an umbrella concept incorporating ‘creative’ forms of repair, reuse, repurpose, refurbishment, upgrade, remanufacture, and recycling [25]. It is one of the key concepts and practices embedded in the emerging circular economy—an alternative to the current linear economy of take–make–use–dispose [26,27]. At the household level, examples of upcycling include (a) used clothing and accessories that have been redesigned and remade into new products, (b) jewellery made from used pieces of metal, plastic, and fabric, and (c) re-upholstered, repainted or redecorated furniture [25]. Upcycling in theory extends the lifetimes of products, components, and materials [18,28], thereby increasing material efficiency and reducing energy consumption, ultimately contributing to the reduction of GHG emissions [18,29]. It reduces solid waste or at least delays its addition to landfill [18,30,31]. It can furthermore provide people engaged in upcycling with sociocultural and psychological benefits, such as learning and being empowered, and a sense of community and relaxation [24]. Anecdotal evidence suggests that the number of people who upcycle in industrialised countries has increased. This is possibly a response to the contemporary ‘maker movement’ [32], readily available physical resources such as Hackspaces and Makerspaces, and shared digital resources (e.g., Instructables, Etsy, Folksy). Despite this growth, however, upcycling as a consumer behaviour remains a niche or marginal activity [18]. Encouraging more consumers to engage in upcycling could therefore contribute to realising the potential benefits of upcycling.
Academic research undertaken on upcycling has focused on fashion and textiles [33,34,35,36,37,38,39,40] or plastic recycling [31,41,42,43]. For example, Fletcher [34] described the concept and process of fashion and textile upcycling. Han et al. [40] analysed the innovative ways that upcycling designers recreate style and value from discarded textiles. Busch [33] used upcycling as a way of reverse engineering, hacking, tuning, and sharing of fashion as a form of social activism. Park and Kim [36] provided a set of design guidelines for fashion upcycling. Zhuo and Levendis [31] reviewed prior work on the particular chemical recycling route that converts polymers into carbon-based nanomaterials. Pol [41] presented an innovative recycling process that converts various waste plastics into a carbon microsphere, an industrially significant, value-added product. La Mantia [43] reviewed different strategies for upgrading recycled plastics. In general, upcycling has been mainly understood as a sustainable practice or approach in engineering and technology [31,41,42,43,44], design [34,36,40,45,46,47,48,49] or business [48,50,51,52]. Despite the rising interest in upcycling manifested by industrial interest along with increased publication levels, previous research has not paid sufficient attention to public interest, such as upcycling craft, hobbies, and home DIY (do it yourself) for housewares, furniture, and accessories. Few studies have been conducted to understand upcycling as a consumer behaviour, which has been identified as avenues for future research and theory development [19,53]. (For those who would like to read more about upcycling theory or other pieces of literature on upcycling, Sung’s [53] systematic review provides good synthesis and critical discussion of varied definitions and practices of upcycling and some aspects of evolution and emergence of upcycling theory.)

1.2. Project Background and Aim

The UK is legally obliged to reduce its GHG emissions by at least 80% from its 1990 levels by 2050 [54]. As part of its Government’s commitment to achieving this target, the RCUK (Research Councils UK) established six End Use Energy Demand centres [55]. The Centre for Industrial Energy, Materials, and Products (CIE-MAP) was one of these and focused on identifying opportunities along the product supply chain that may ultimately deliver a reduction in materials and energy consumption in the UK [56]. This study investigated upcycling as one such opportunity and sought to develop actionable strategies for scaling up upcycling in households and beyond—i.e., transitioning upcycling from a niche to a mainstream activity [57]—with the ultimate goal of reducing carbon emissions [18]. It had three objectives: (a) To gain behavioural insights into upcycling in the UK (e.g., approaches to and context for upcycling); (b) to identify UK-specific key behaviour factors for upcycling; and (c) to formulate design and policy interventions for scaling up upcycling. This paper reports on the second part of the study, the findings from which informed the subsequent development of design and policy interventions.

2. Theoretical Framework

2.1. Behaviour Models to Understand Behaviour

Amongst psychologists and policy makers, it is accepted that understanding behaviour and behaviour change policies rests on certain theoretical models (either explicitly or implicitly) which exhibit (for example) what the behaviour is, what its antecedents are, and how it is influenced, shaped, and constrained. It is, therefore, crucial to decide which model to use for understanding particular forms of behaviour. Concerning environmentally significant behaviour (or sustainable behaviour), Stern [58] summarised the evidence on the factors and provided four types of causal variables: (a) Attitudes, values, and beliefs, (b) contextual forces (e.g., social, economic, institutional, and political factors), (c) personal capabilities and resources, and (d) habit. Similarly, many researchers share a common perspective that sustainable behaviour is complex and should therefore be understood by both internal factors (e.g., attitude, emotions, habits) and external factors (e.g., situational constraints and conditions) [59,60,61]. Most notably, Jackson [62] extensively reviewed the literature on consumer behaviour and behaviour change regarding sustainable consumption and concluded that “a grand unified theory of human behaviour is probably impossible. But a pragmatic synthesis is a useful starting point for policy design. Triandis’s early theory of interpersonal behaviour provides a good illustration of such a synthesis.” (p. 5) Similarly, Martiskainen [61] reviewed different models of behaviour and change regarding households’ energy-related behaviour, and recommended Triandis’s model for its comprehensiveness.
Some researchers, in an attempt to understand the complexity of behaviour, proposed a pragmatic synthesis instead of choosing an existing model. Feola and Binder suggested an integrative agent-centred framework to better understand farmers’ behaviour [63]; Klöckner and Blöbaum introduced and examined the comprehensive action determination model of ecological behaviour [64]; and Kallbekken et al. [60] combined the theory of planned behaviour by Ajzen and Fishbein [65] and the value–belief–norm Theory by Schwartz [66]. Despite the differences, one common aspect is that most factors in these models are included in Triandis’s theory of interpersonal behaviour (TIB). This provides the corroboration for Jackson’s conclusion and Martiskainen’s recommendation.
Triandis’s model is known for its wide applicability, unlike other models: For instance, norm activation theory is more appropriate for predicting altruistic behaviour and the health belief model for preventative health behaviour [67]. Triandis’s model has been used for technology adoption behaviour [68], civic behaviour [69], dietary behaviour [70], design intervention for sustainable product use at home [71], and in many other ways, notably in relation to sustainable consumption [59] and energy-related behaviour [61]. Upcycling is not only a sustainable behaviour but also an action for engaging with communities or in product personalisation. The main motivation for some people may not be pro-environmental intention; in this respect, upcycling needs a versatile model which can not only explain sustainable behaviour but also other behaviour domains, such as community participation and self-expression. Triandis’s model, due to its comprehensive nature and wide applicability, was therefore considered to be the most suitable model to understand upcycling behaviour in this study. Despite our choice of the Triandis’s model for its aforementioned advantages, it should also be noted that few academics hold a view that Triandis’s model might be outdated or irrelevant to a contemporary perspective or it might provide a monolithic, mechanistic, and one-dimensional view of human behaviour.

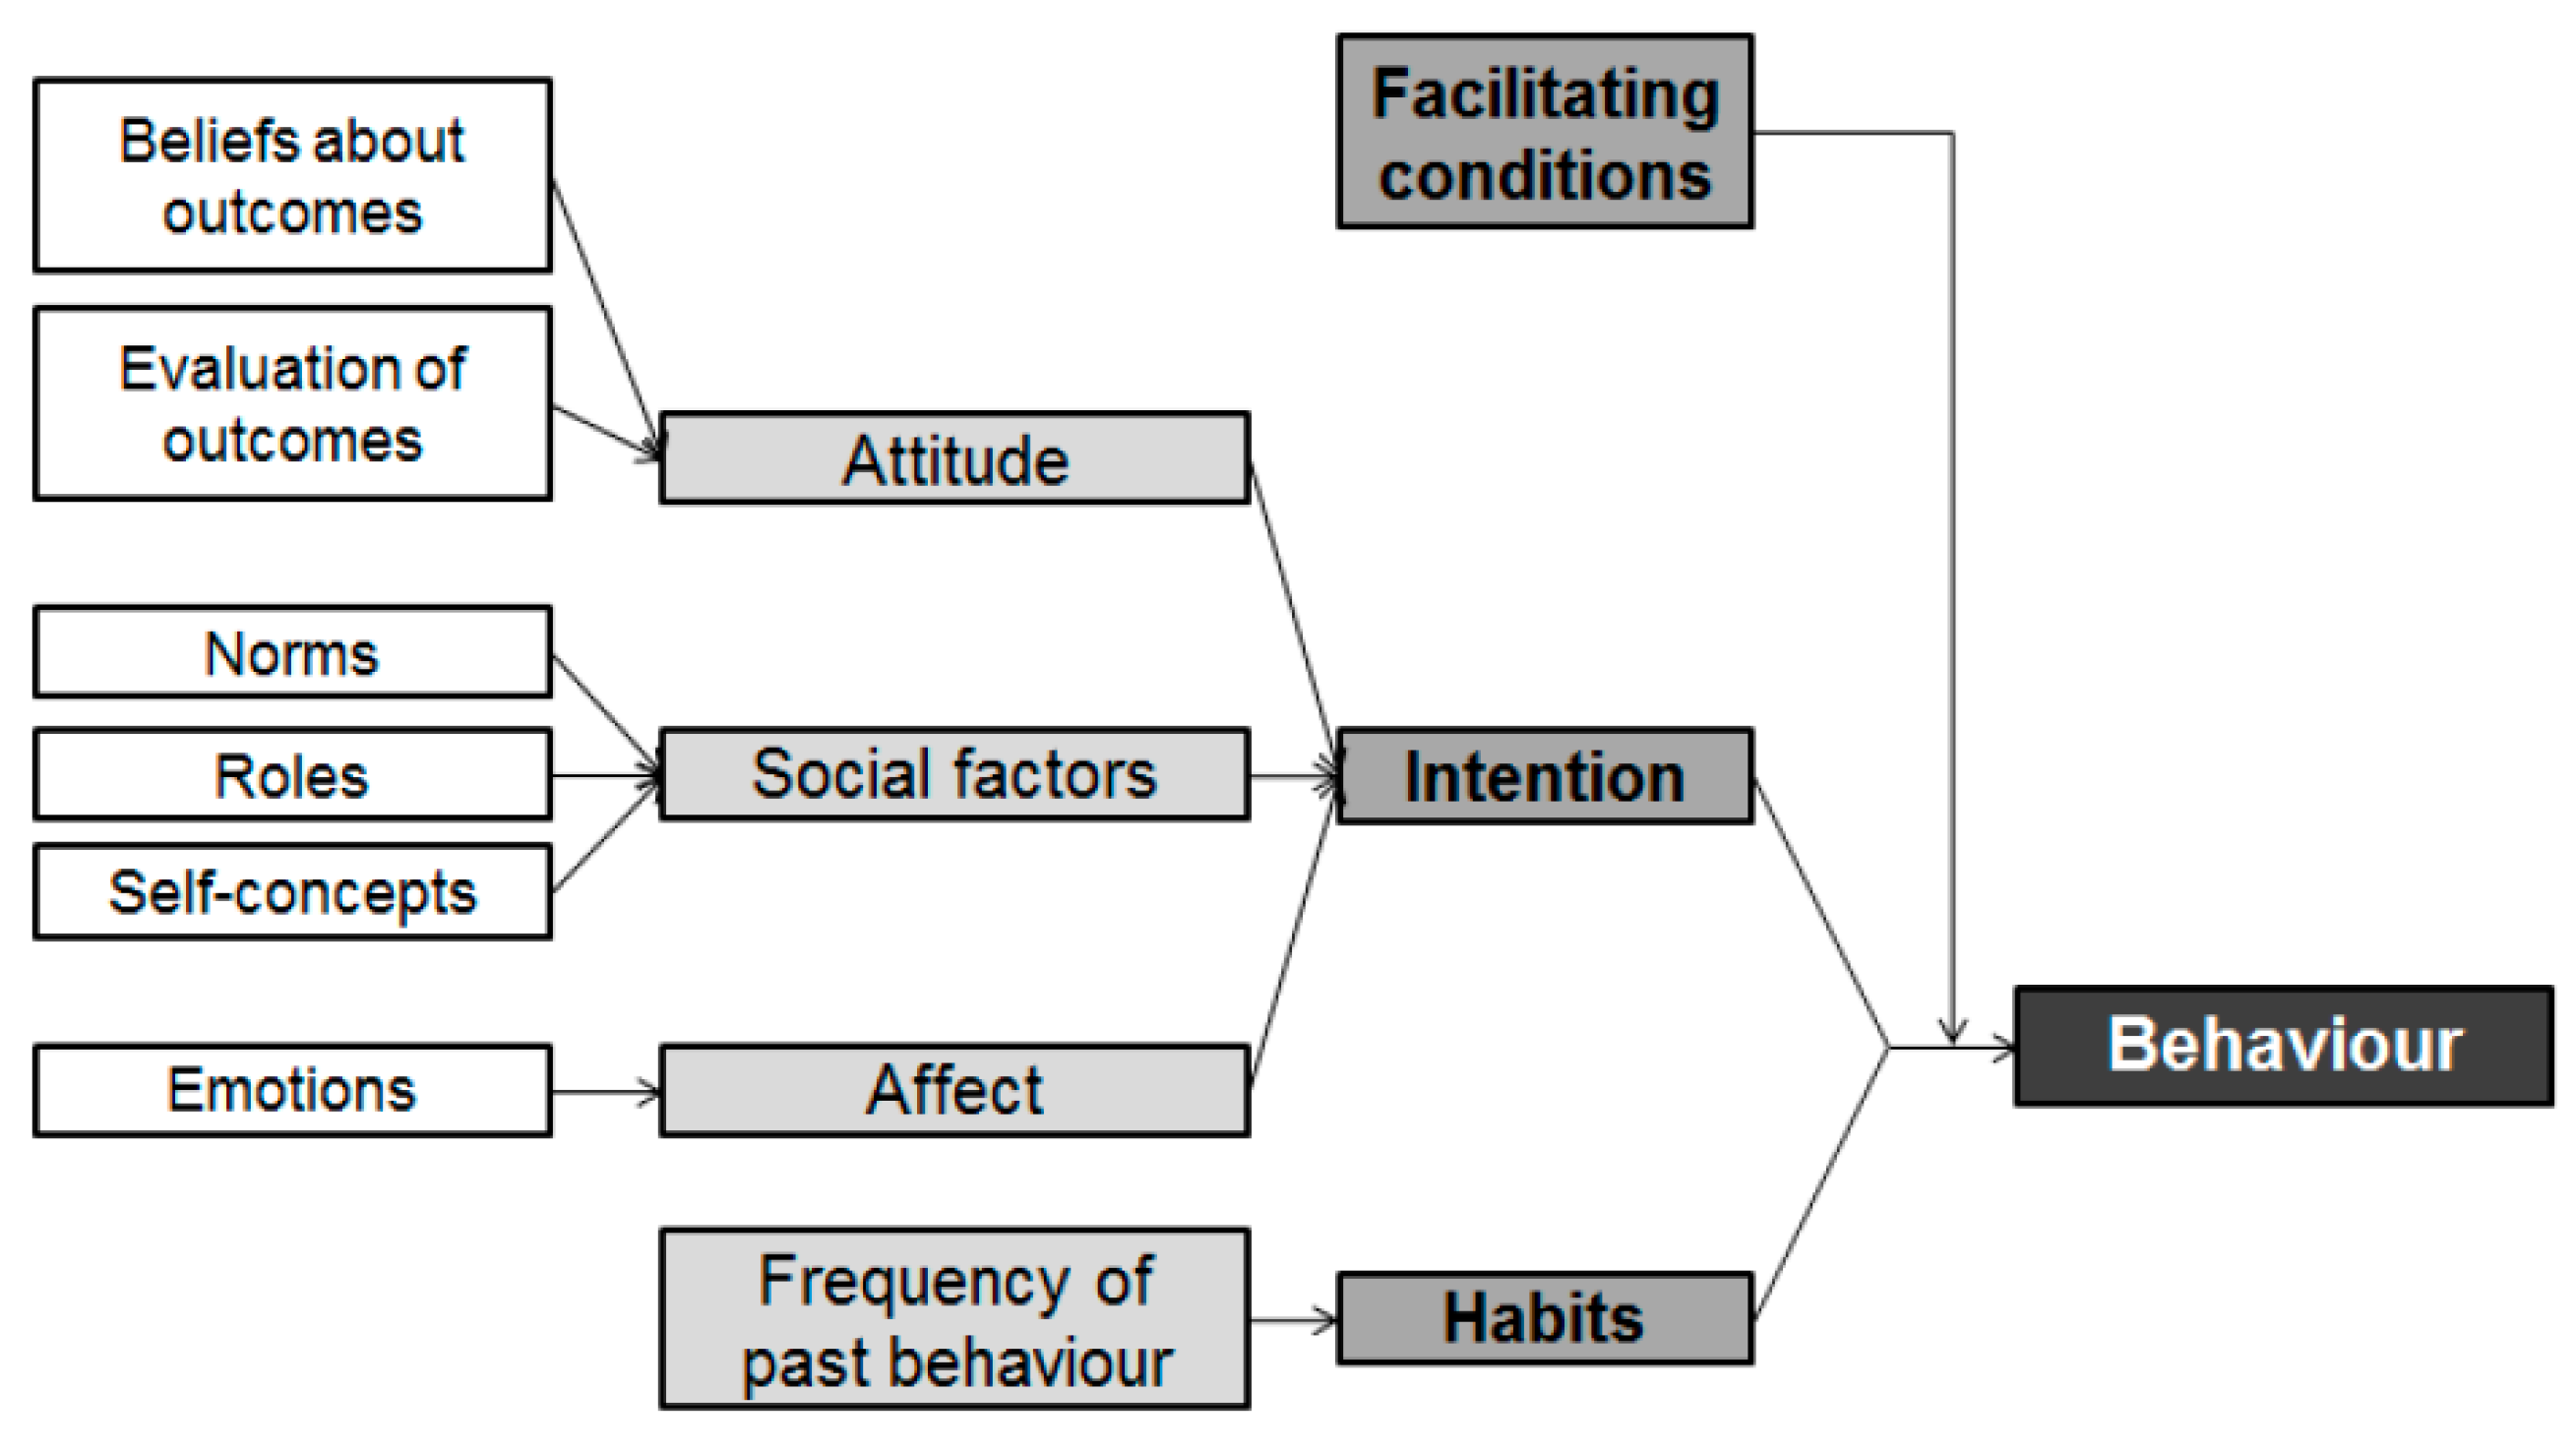
2.2. Triandis’s Theory of Interpersonal Behaviour (TIB)

Triandis explained three determinants of the probability of behaviour: Intention, strength of habits, and the presence (or absence) of conditions that either hinder or facilitate a behaviour [72]. Triandis identified three determinants of behaviour intention: Social factors (such as norms, roles, self-image, social contracts, and self-monitoring); affect (i.e., emotions) attached to the behaviour; and the value of the perceived consequences of the behaviour.
A refined model and explanation of TIB can be found in Jackson’s work [59]. Jackson explains that social factors and emotions, along with attitude, play a key role in forming intention, that past behaviour (i.e., habits) exerts a significant influence on present behaviour, and that the influences from intention and habits are moderated by facilitating conditions. As his work is more compatible with other contemporary behavioural theories, the rest of this section explains each factor based on Jackson’s model (Figure 1).
Intention is the immediate antecedent and key determinant of behaviour in many popular behaviour models, such as the theory of reasoned action (TRA) [65] and the theory of planned behaviour (TPB) [73], as well as TIB [72]. It is generally regarded as a key factor to predict or explain behaviour unless the behaviour is either entirely habitual or altruistic.
Attitude towards a behaviour is “a person’s overall evaluation of performing the behaviour in question” [74] (p. 5) or “the perceived value of the expected consequences” [59] (p. 94). It is one of three key determinants of intention in TIB, as well as in TRA and TPB. Both beliefs about outcomes and evaluation of outcomes shape attitudes [59].
Social factors are a second predictor of intention and include norms, roles, and self-concepts. Norms are “social rules about what should and should not be done” [59] (p. 94). Roles are “sets of behaviours that are considered appropriate for persons holding particular positions in a group” [72] (p. 8). Self-concept is “the idea that I have of myself, the goals that it is appropriate for this kind of person to pursue or to eschew, and the behaviours that this kind of person does or does not engage in” [59] (p. 94).
Affect is a third predictor of intention and an unconscious input to decision-making based on “emotional responses to a decision or to a decision situation […] distinct from rational-instrumental evaluations of consequences [which are] both positive and negative emotional responses of varying strengths” [59] (p. 94).
Habits determine behaviour along with intention in TIB [59]. Facilitating conditions, the moderator of effects from intention and habits, are regarded by Jackson as “a similar concept to Stern’s notion of external contextual factors” [59] (p. 93). Stern provided examples of such factors as advertising, government regulations, monetary incentives and costs, and capabilities and constraints provided by technology and the built environment.

2.3. Issues in the Theory of Interpersonal Behaviour

Bamberg and Schmidt [75] argued that TIB has received little attention, whereas TRA and TPB were more frequently used and cited in research since the 1970s [76,77,78,79,80,81,82]. Jackson [59] similarly recognised that TIB has been used far less than TPB or the norm-activation model by Schwartz [83,84,85,86,87], especially in relation to sustainable behaviour. Jackson argued that this is partly because of the greater complexity in TIB, or the lack of parsimony of the model. Godin [88] used similar reasons to explain why TIB is so rarely tested: (a) Researchers’ preference towards parsimonious models, (b) no clear guidelines for the operational definition of the variables in TIB, and (c) relatively late awareness of the value of TIB by the scientific community.
There are a few recent examples showing a clear framework and guidelines for the use of TIB in empirical research [68,75,89,90]. The studies did not necessarily address sustainable behaviour, nor were they strictly based on the original model. The reasons behind the latter include the ambiguities in the original model, researchers’ different interpretations of them, and, to some extent, unavoidable adaptation depending on the behaviour under investigation. For example, Gagnon et al. [89] used perceived consequences in a way that encompassed the value of the consequences by referring to the technology acceptance model [91]. They separated norms as perceived social norms (including role beliefs and normative beliefs) and personal normative belief [89]. Gagnon et al., in another study [68], slightly modified the model to include three categories of belief: Social normative beliefs, personal normative beliefs, and attitudinal beliefs.
Bamberg and Schmidt tested TIB in an empirical study that compared the predictive power of three different behaviour models (TIB, TPB, and norm-activation model), using a different set of variables and terms [75]. They used behavioural beliefs rather than perceived consequences and control beliefs rather than facilitating conditions and omitted the self-identity element. After comparative analysis, they reported findings concerning the three models (but mainly focussing on TIB and TPB) [75]. Three out of six constructs in TIB were statistically significant direct predictors of intention: Behavioural beliefs, control beliefs, and role beliefs. Compared to TPB, the much more complex TIB explained only 8% more intentional variance. Role beliefs in TIB had a significant, very strong effect on intention. If the subjective norm and role beliefs are subsumed under social factors, TPB empirically confirmed that attitude, social factors, and perceived behaviour control are the three main determinants of the intention-building process. Habit significantly increased the predictive power of TPB. These findings were considered for adapting TIB for this particular study (see Section 2.4).

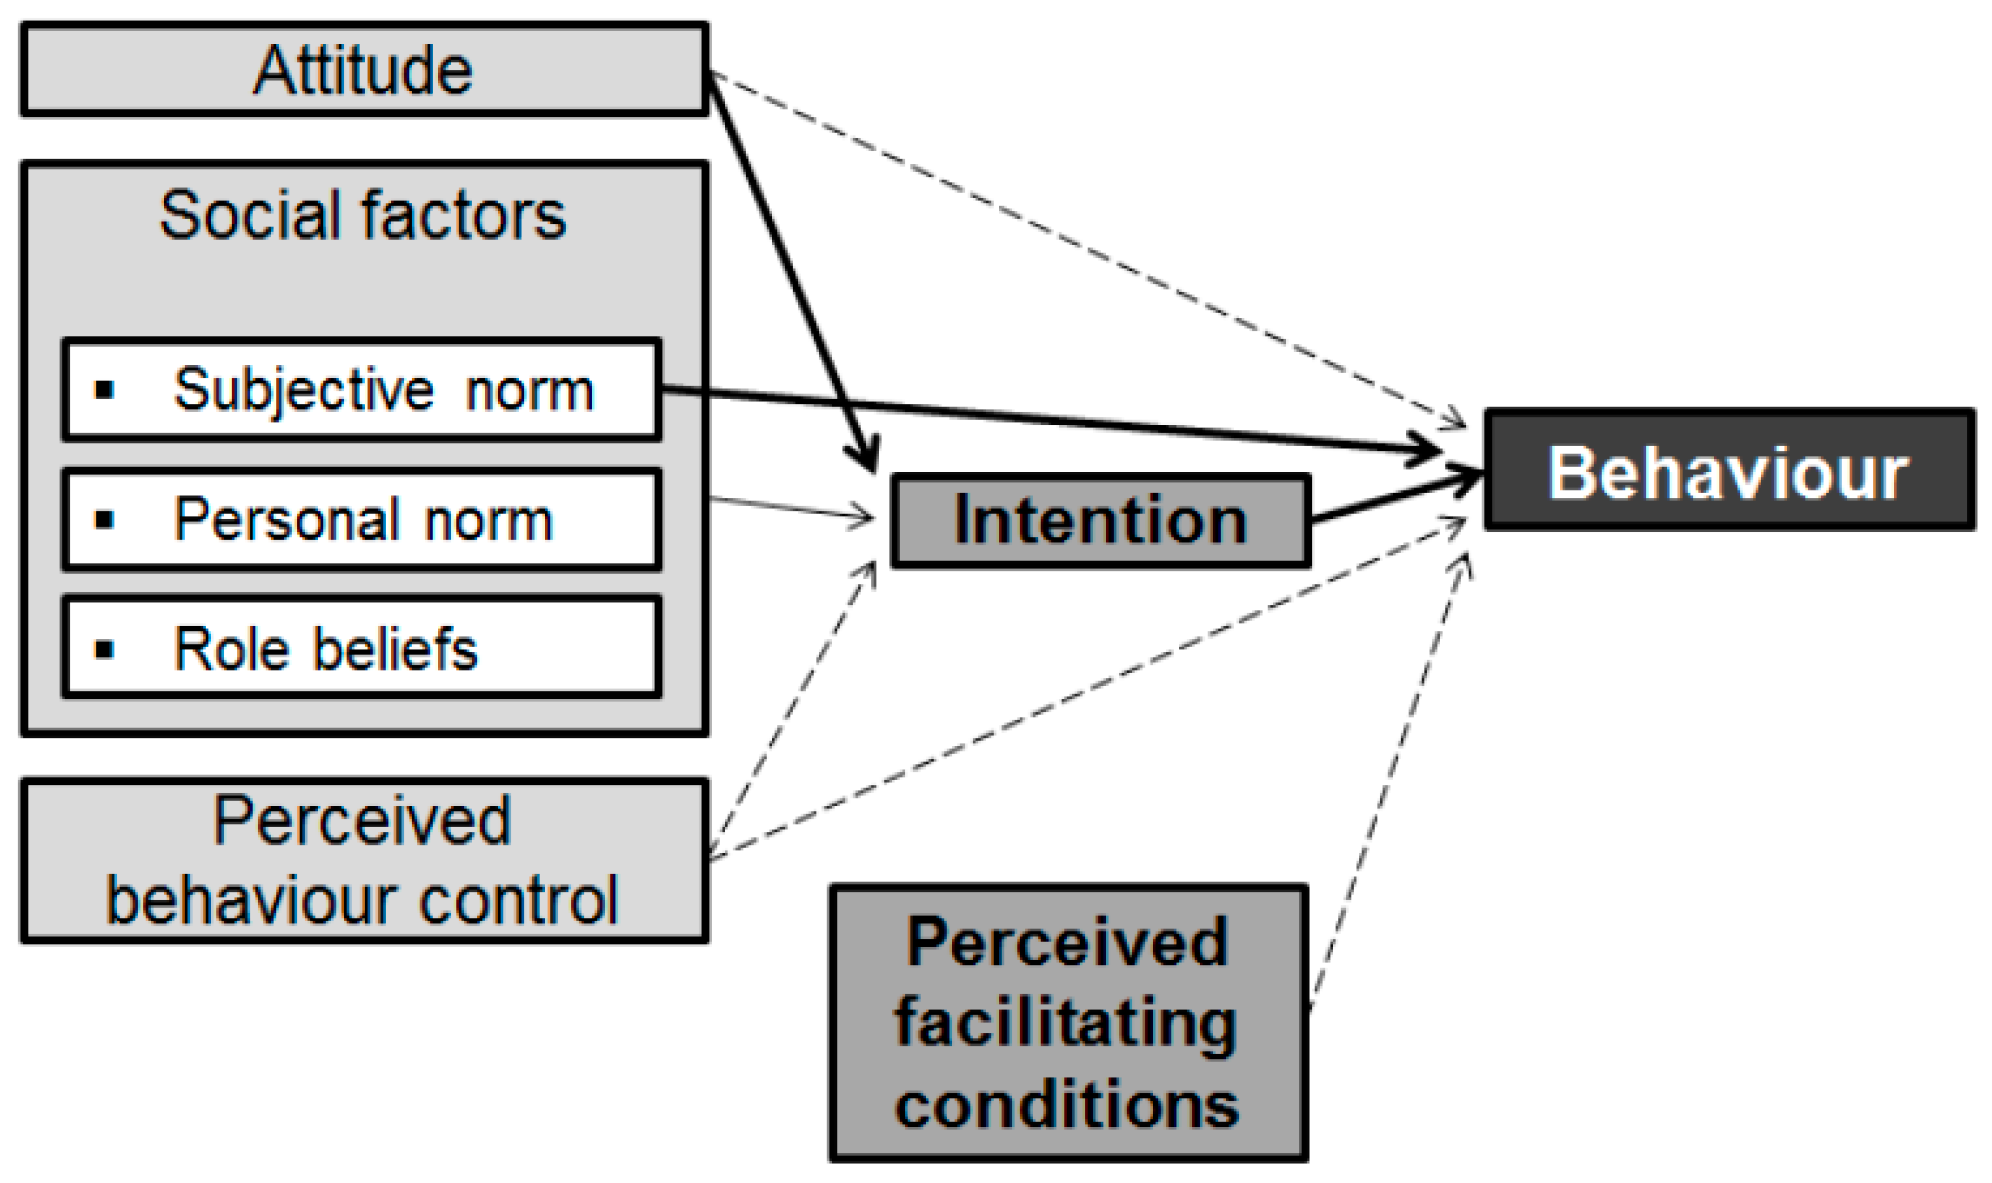
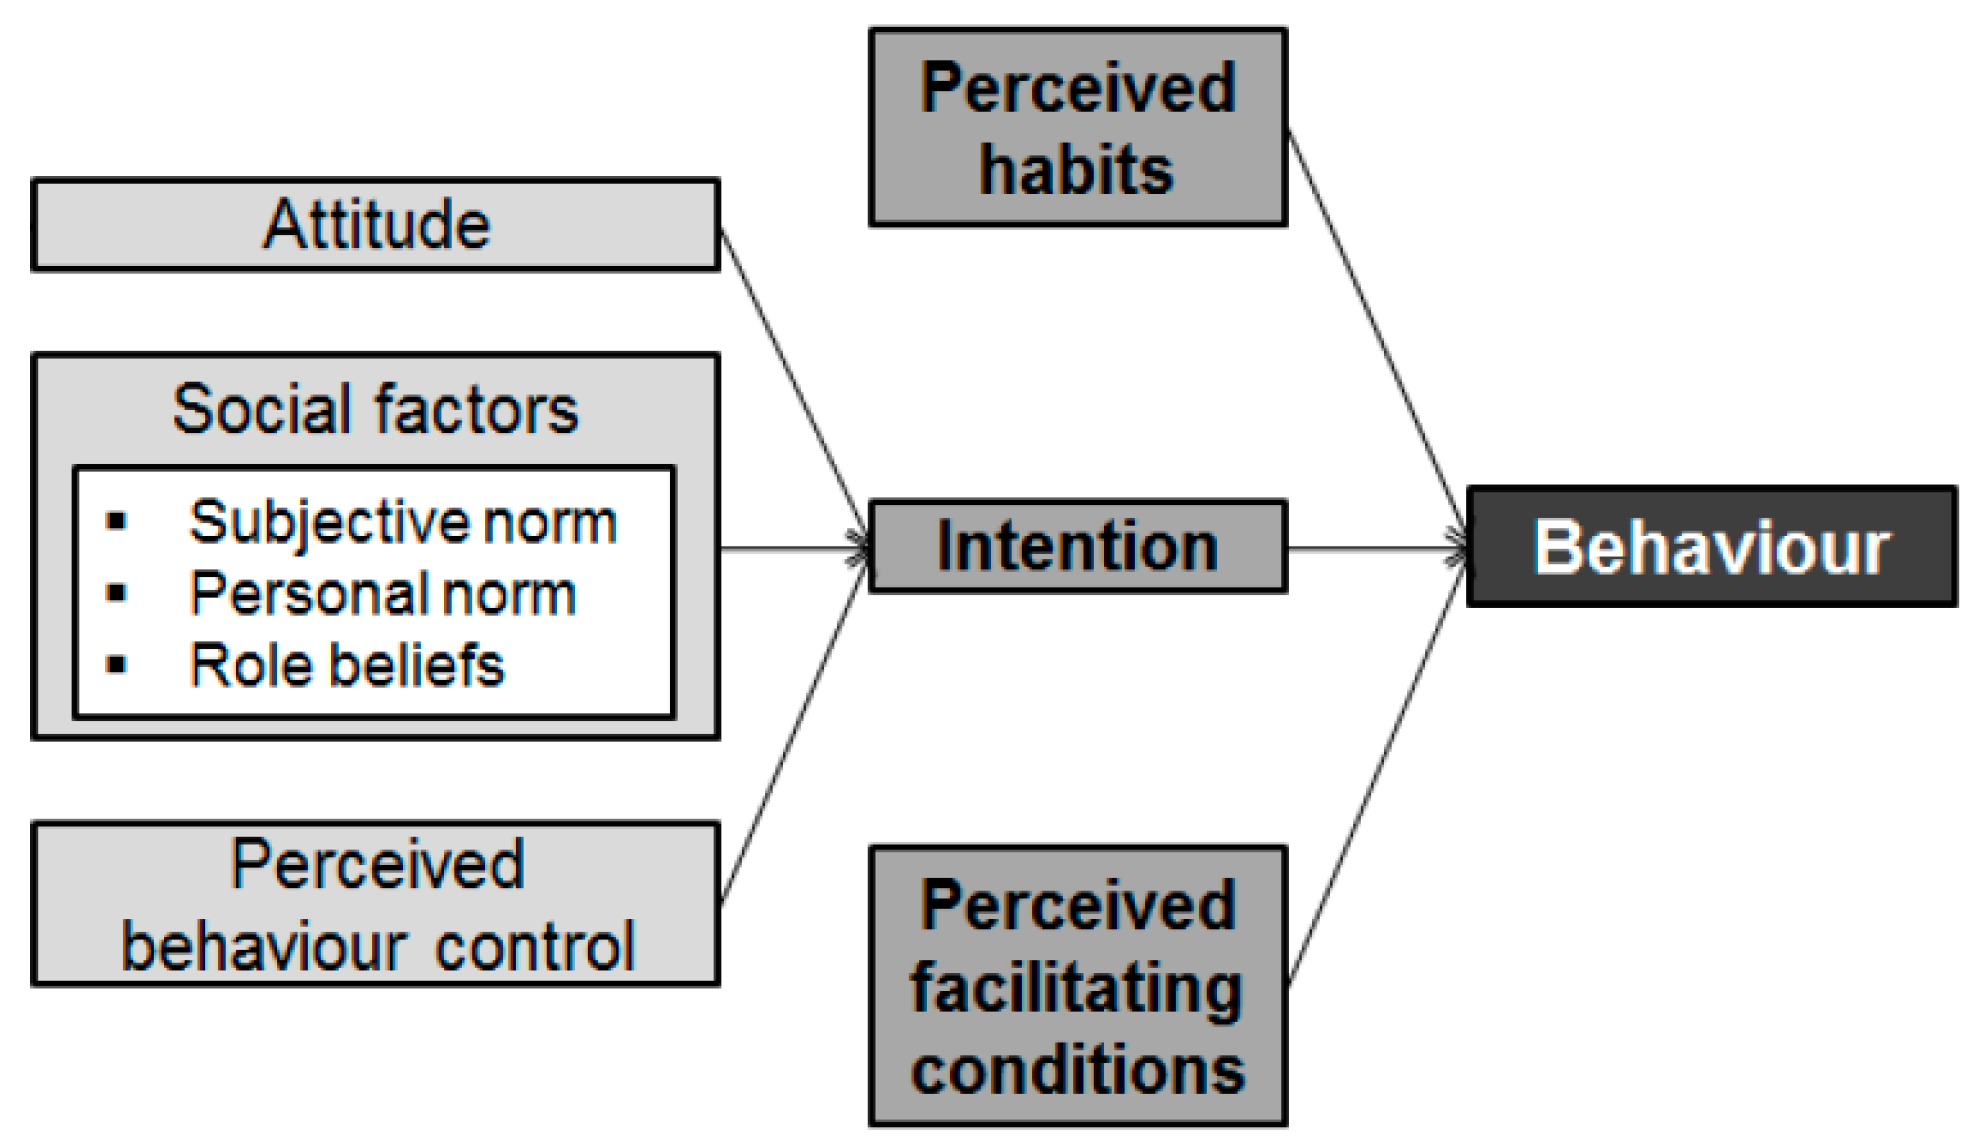
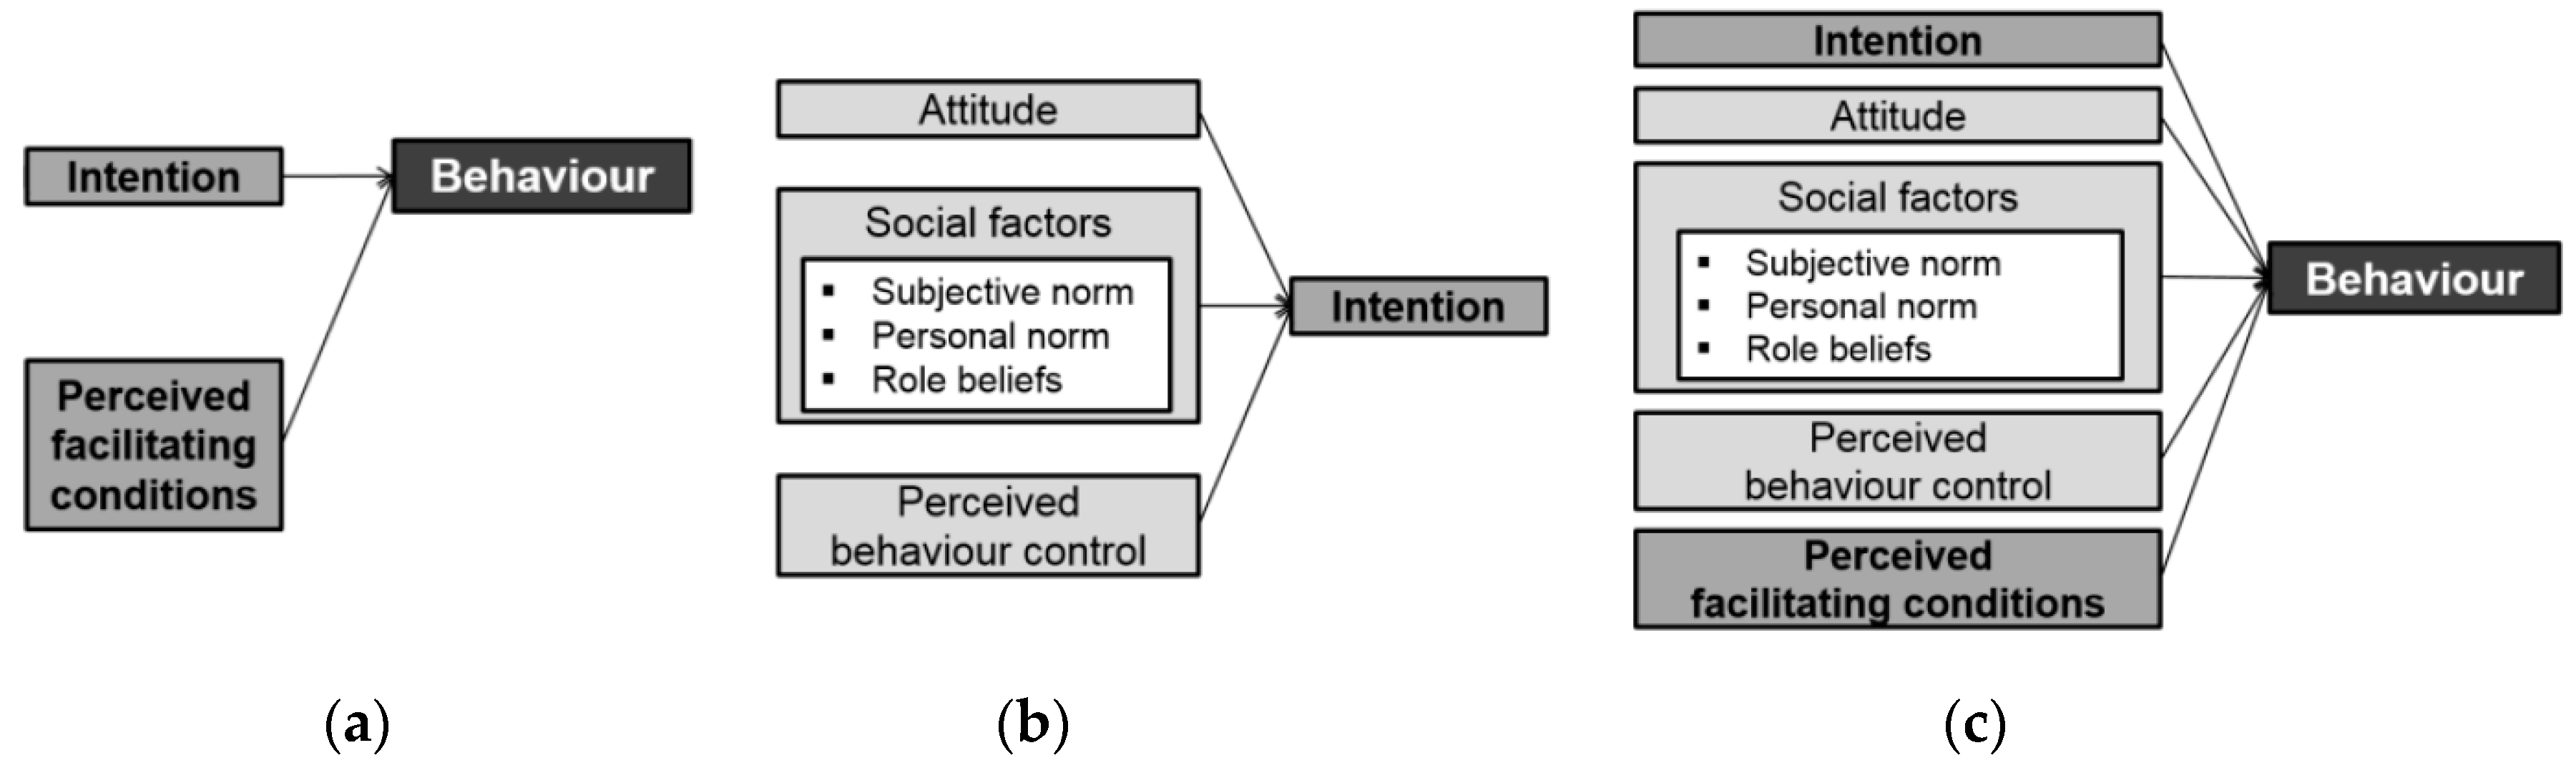
2.4. Revised Behaviour Model

Taking into account the complexity and vagueness of TIB and the limited explanatory power of TPB, these two models were combined in order to improve the operationalisation of TIB and to strengthen the explanatory or predictive power of TPB (Figure 2).
The (empirically confirmed) three main determinants of the intention-building process (attitude, social factors, and perceived behavioural control) were included in a combination model for this study. The model includes subjective norm, personal norm, and role beliefs as major social factors. Normative beliefs are excluded, as they are breakdowns of subjective norm in TPB. Self-concept was also excluded for the lack of consensus in testing. Perceived behaviour control was included as one of three direct predictors of intention in TPB. As objective ‘facilitating conditions’ were not observed by the study investigators, ‘perceived facilitating conditions’ was considered to be a more appropriate term. This variable has also been included as a predictor in other adapted TIB models [75,89,90]. Habits were included as perceived habits (i.e., those which could be remembered and stated by respondents).

3. Research Methodology

The data were collected between June and July 2015 through an internet survey using Google Forms. The instrument, sampling, procedure, respondents, and analysis are described below.

3.1. Instrument

The survey questions were based on the factors in the combination model between TIB and TPB (see Section 2.4). Most questions were formulated by adopting constructs that have already been used and validated by other researchers, including Ajzen [74], Bamberg and Schmidt [75], Gagnon et al. [89], Francis et al. [79], and Tonglet et al. [13]. The only difference was how perceived habits were measured. Since the model was not used to predict future behaviour (i.e., explain past behaviour), habits could not be used as the frequency of past behaviour. Frequency of similar activities to upcycling was instead measured.
Measures for the variables of subjective norm, personal norm, perceived behaviour control, and intention were obtained on seven-point Likert scales (1 = ”strongly disagree”, 7 = ”strongly agree”), whereas a ‘not applicable’ option was provided for role beliefs. Perceived facilitating conditions and perceived habits used different seven-point Likert scales (1 = ”not at all”, 7 = ”to a very great extent” and 1 = ”never”, 7 = ”very frequently”). Attitude was assessed by means of seven-point bipolar adjective scales (e.g., 1 = ”unpleasant”, 7 = ”pleasant”). To measure the frequency of behaviour in the past five years, eight options were given (Table 1).

3.2. Sampling

The survey targeted UK ‘makers’ as defined by Anderson [32]: Makers are people interested in making, crafting, painting, gardening, cooking, knitting, sewing, scrap-booking, beading, cross-stitching, etc. (i.e., potentially anyone). The premise of this selection of target population was that these UK makers are not necessarily upcyclers but may have the potential to use upcycling in their creative activities. This group of people may not be nationally representative but the most relevant to the topic of investigation. UK makers in this study were not defined by the nationality but by residence in the UK. Due to the difficulty of identifying the sampling frame (the listing of all units in the population from which the sample are selected [92]) with limited time and resources, purposive sampling (nonprobability sampling based on the specific needs in a project) [92,93] was used. Makers are active in producing and consuming shared digital resources such as Instructables, Etsy, and Folksy. Recognising this, some makers engaging in upcycling in the UK (who participated in a separate interview study [94]) were asked about the websites they use in relation to upcycling on a regular basis. The websites identified were used as the starting point to contact the target population. As access to these websites is not limited by any particular geographical area, demographic questions were used in the survey to distinguish between UK and non-UK residents.

3.3. Procedure

A pilot survey (after pretests and several rounds of revision of the survey) through Google Forms was administered to 23 websites (Hackspace Google fora, Instructables fora, and Etsy chitchat) in June 2015 to ensure the validity and reliability of the study. Data were collected from 68 respondents. Pilot analysis included descriptive statistics on demographics and all variables to check the general trend of the data and any unexpected results, and Cronbach’s Alpha to test the reliability of scales. No unexpected results were found, and all Cronbach’s Alpha values showed above 0.7, confirming the readiness for the survey.
A range of websites were used for administering the survey (see Section 3.2). The online survey began with a short introduction to the survey including the definition of upcycling—the creation or modification of any product out of used products, components or materials in an attempt to produce a product of equal or higher quality or value than the compositional elements. The introduction section explained what was expected of respondents (particular interest in identifying key drivers for and barriers to upcycling at the household level in the UK) and details of rewards (providing access to the results, and a £15 Amazon voucher for five randomly selected respondents). Respondents were asked questions that enabled the theoretical constructs of the combination model of TIB and TPB to be measured (see Section 2.4). At the end of the survey, sociodemographic information was collected, such as gender, age group, nationality, residence, ethnicity, employment status, occupational area, and educational level.

3.4. Respondents

A total of 122 responses from UK residents were used for the analysis. The respondents were from all nine regions of England, Scotland, and Wales in the UK (no one from Northern Ireland). The overwhelming majority of the respondents were White-British (nearly 85%) and had completed higher education (over 70%). Around half of the respondents were aged between 30 and 49, and a similar proportion were employed in either creative arts and design or science and engineering. (Table 2).

3.5. Analysis

Preliminary analysis was first conducted to ensure the reliability of the scales used. Cronbach’s Alpha values showed above 0.8 for attitudes, personal norms, role beliefs, intention, and perceived facilitating conditions; and between 0.7 and 0.8 for subjective norm. Perceived behaviour control and perceived habits, however, showed below 0.7. Factor analysis was therefore conducted for these two variables to see if both of these factors had multiple components. The confirmatory factor analysis for perceived behaviour control recommended extracting one component: The Kaiser–Meyer–Olkin value was 0.697 (over the recommended value of 0.6); a principal component analysis revealed the presence of one component with eigenvalues exceeding 1 (2.073), explaining 51.8% of the variance; and the Screeplot showed a clear break between the second and third component. This result indicates that all items in perceived behaviour control measure one factor.
The result of perceived habits, however, recommended extracting three components, not just one. The Kaiser–Meyer–Olkin value was 0.596; a principal components analysis revealed the presence of three components with eigenvalues exceeding 1 (2.531, 1.980, and 1.563), explaining 23%, 18%, and 14.2% of the variance, respectively, and the Screeplot showed a clear break between the fourth and fifth component. As this indicates that the items in perceived habits did not measure one factor, it was removed from the statistical analysis in this study.
The responses (excluding perceived habits) were analysed by employing descriptive statistics, correlation analysis (Spearman’s rank order correlation), logistic regression, and nonparametric statistics for comparing groups (Mann–Whitney U Test and Kruskal–Wallis H Test), using SPSS (Statistical Package for the Social Science) version 22.0. All statistical tests were nonparametric as most independent variables were not continuous variables and some results did not show a normal distribution.
When intention was used as an independent variable (e.g., correlation between intention and the behaviour, i.e., the frequency of upcycling), all three intention items were used. When intention was used as a dependent variable (e.g., correlation between intention and factors influencing intention), one intention item (“I intend to upcycle”) was used, as it had the highest correlation coefficient in the relationship with the frequency of upcycling (see Table 5).
Even though there is no consensus on the approach to sample size with logistic regression [95], a rule of a thumb is to have at least 10 cases for each predictor [96]. As the sample size was 122, the number of predictors for the logistic regression was limited to below 12 by extracting items with high(er) correlation coefficients from the correlation analysis. To calculate an R2 for logistic regression, there is no consensus on which approach is the best [97]. This research used the logistic regression output of SPSS: Cox and Snell r square and Nagelkerke r square.

4. Results

The following subsections describe the survey results, structured around the statistical tests that were applied: (a) An overview of the data using descriptive statistics, (b) relationships between factors influencing upcycling by correlation analysis, (c) key factors and models to explain the frequency and intention of upcycling by logistic regression, and (d) group differences based on demographics by nonparametric statistics.

4.1. Overview of the Data

Most respondents had a positive attitude towards upcycling (Mean = 5.75–5.96, SD = 1.05–1.25) (Table 3). Many did not agree that most people who are important to them expect them to upcycle or think that they ought to upcycle (Mean = 3.85–3.93, SD = 1.39–1.74). The majority, however, agreed that most people who are important to them would approve of their upcycling (Mean = 5.57, SD = 1.20). Several respondents answered that they felt a weak personal, moral obligation to upcycle, related to guilt and a sense that it would be unacceptable not to upcycle (Mean = 4.43–4.63, SD = 1.74–1.77). Most, however, answered that upcycling reflects their principles about using resources responsibly (Mean = 5.43, SD = 1.44). Respondents perceived that upcycling fits their roles in their community and friendship or support networks (Mean = 5.06, SD = 1.33–1.36) more than in their workplace or family (Mean = 4.15–4.92, SD = 1.44–1.69). Their confidence in their ability to upcycle was high (Mean = 5.11–6.16, SD = 0.81–1.23). Overall, respondents did not answer that external factors (i.e., perceived facilitating conditions) have impeded their upcycling. Lack of space and spare time were the important perceived barriers (Mean = 4.41–4.51, SD = 1.92–2.03). The respondents did not seem to perceive teachers or helpers, information, supporting culture, supporting policy or financial incentives as common barriers. Overall, their intention to upcycle was relatively high (Mean = 5.45–5.70, SD = 0.96–1.31) (Table 3).
The frequency of upcycling varied widely, with the highest proportion responding about once every three months (n = 32; 26.2%) or about once every six months (n = 24; 19.7%) (Table 4).

4.2. Relationships between Factors Influencing Upcycling

In order to examine the extent to which intention and perceived facilitating conditions are correlated with the frequency of upcycling, Spearman’s correlation was used (Table 5). The results revealed that all intention items were positively correlated with the frequency of upcycling; all correlations showed strong relationships (i.e., r = 0.5 to 1.0) [98]. Seven out of the fifteen items in perceived facilitating conditions showed statistically significant correlation with the frequency of upcycling: A lack of tools, a lack of used products, components, and materials, a lack of teachers or helpers, a lack of skills, a lack of imagination, a lack of inspiration, and a lack of information. Among these, two items (imagination and inspiration) showed a medium size correlation (r = 0.30 to 0.49), whereas five others showed a small size correlation (r = 0.10 to 0.29).
The extent to which attitude, social factors, and perceived behavioural control are correlated with intention to upcycle was then examined, again using Spearman’s correlation. All items tested were positively correlated with intention. All five attitude items showed a medium size correlation. One subjective norm item (“Most people who are important to me expect me to upcycle”) showed a large size correlation (r > 0.50), whereas the other two showed a medium size correlation. All three personal norm items showed a large correlation. One role belief item (“Upcycling fits my role in my community”) showed a large correlation (r = 0.512); two role belief items (“… in my family” and “… in my friendship/support networks”) showed medium correlation; and one item (“… in my workplace”) small correlation. Most perceived behaviour control items showed a medium correlation, except for one item (“It is mostly up to me whether or not I upcycle”), which showed small correlation (Table 6).

4.3. Key Factors Explaining the Frequency and Intention of Upcycling

The effects of various factors on the likelihood that (i) respondents engaged in upcycling relatively frequently and that (ii) they intend to upcycle were assessed, using logistic regression. Seven-point scale ordinal data and nominal data with more than two options were converted into binary nominal data for logistic regression (e.g., relatively frequent upcycling as more than once every six months and less frequent upcycling as less than once every six months). The limited number of items (n = 9–10) with high correlation coefficients (from the correlation analysis) were used as independent variables for analysis (see Section 3.5).
The first model (Figure 3a) contained all three intention items and seven perceived facilitating conditions that showed significant correlations with frequency of upcycling (Table 5). The model revealed relationships that were statistically significant (x2 (df = 10, N = 122) = 30.90, p < 0.05), indicating that it was able to distinguish between respondents who upcycled more frequently (than once every six months) and those who upcycled less frequently. The model explained between 22.4% (Cox and Snell r square) and 30.6% (Negelkerke r square) of the variance in frequency of upcycling, and correctly classified 76.2% of cases. Only one of the three intention items (“I intend to upcycle”) made a unique statistically significant contribution to the model, recording an odds ratio of 9.47 (Table 7). This ratio indicates that respondents who intended to upcycle were over nine times more likely to actually upcycle more frequently than those who did not intend to do so (controlling for all other factors in the model).
The second model to explain behaviour intention (Figure 3b) contained ten items from attitude, subjective norm, personal norm, role beliefs, and perceived behaviour control (two items per factor) (see Section 3.5). The model showed statistically significant relationships (X2 (df = 10, N = 116) = 30.53, p < 0.05), indicating that it was able to distinguish between respondents who do intend to upcycle and those who do not. The model explained between 23.1% (Cox and Snell r square) and 41.9% (Negelkerke r square) of the variance in intention to upcycle, and correctly classified 89.7% of cases (Table 8).
Only one attitude item (“To me, taking part in upcycling is pleasant”) made a unique statistically significant contribution to the model, recording an odds ratio of 17.61, indicating that respondents who find upcycling pleasant were over 17 times more likely to intend to upcycle than those who find it unpleasant (controlling for all other factors in the model). One subjective norm (“Most people who are important to me expect me to upcycle”), one personal norm (“It would be unacceptable to me not to upcycle, especially when used materials are available and would become waste otherwise”), and one role belief (“Upcycling fits my role in my community”) showed relatively high odds ratios (2.92, 3.86, and 2.42, respectively) without a significant p-value.
The third model (Figure 3c) was created by putting all behaviour factors as potential determinants to explain behaviour frequency (whether it is more or less frequently than once every six months), containing nine items from all behaviour factors (one item per factor except for perceived facilitating conditions—three items) (see Section 3.5). This new model showed statistically significant relationships (X2 (df = 9, N = 117) = 48.68, p < 0.001) and better explained frequency of upcycling than the original model ((a) in Figure 3). The new model explained between 34.0% (Cox and Snell r square) and 46.4% (Negelkerke r square) of the variance in frequency of upcycling and correctly classified 84.6% of cases. Two items made a unique statistically significant contribution to the model: Intention and subjective norm. The odds radios were 8.97 and 4.59, indicating that (i) respondents with high intention to upcycle were nearly nine times more likely to report more frequent upcycling than those with low intention, and (ii) respondents who believed that most people important to them expect them to upcycle were over four times more likely to report more frequent upcycling than those who did not (Table 9).

4.4. Group Differences based on Demographics

Finally, group differences based on demographics were compared. The Mann–Whitney U Test was used for gender group differences and the Kruskal–Wallis H Test was used for group differences based on age, occupation, educational level, and employment status.
There were statistically significant differences between males (n = 59) and females (n = 63) for two attitude items, two social factor items, one perceived behaviour control item, one intention item, and behaviour frequency of upcycling (Table 10). Two attitude items (Worthless–Worthwhile and Harmful–Beneficial) showed a small effect size difference with no median value difference. Two social factors (other people’s approval subjective norm and feeling guilty personal norm) showed a small size effect, with females’ median scores higher than those of males. The gender difference in perceived behaviour control was small, with no median value difference. Intention difference was small, with a higher female median score. The difference in the frequency of upcycling was small, with no difference in median scores. There was no statistically significant difference across gender groups for role beliefs or perceived facilitating conditions.
There were statistically significant differences across three age groups (n(Gp1: under 30) = 22, n(Gp2: 30−49) = 63, n(Gp3: 50 and over) = 37) for four attitude items, two social factors, one perceived behaviour control item, all three intention items, and the frequency of upcycling. Median scores of two attitude items and perceived behaviour control did not differ significantly across age groups. Respondents aged between 30 and 49 scored higher median values in two attitude items (Bad−Good and Worthless−Worthwhile) than other age groups. Respondents aged 30 and over reported higher median scores in two social factors (unacceptable-not-to-upcycle personal norm and community role belief), all three intention items, and behaviour frequency than respondents aged under 30. There was no statistically significant difference in subjective norms or perceived facilitating conditions across the age groups (see Table 11).
There were statistically significant differences across five occupational area groups (n(Gp1: business and sales) = 14, n(Gp2: creative arts and design) = 35, n(Gp3: science, engineering and technology) = 32, n(Gp4: teaching and education) = 14, n(Gp5: others) = 27) in four attitude items, six social factor items, all intention items, and frequency of upcycling. In general, respondents working in ‘arts and design’ scored higher median values in most variables than others, whereas respondents working in ‘science, engineering, and technology’ scored lower median values in all variables than others. There was no statistically significant difference in perceived behaviour control or perceived facilitating conditions across occupational area groups (Table 12).
There was no statistically significant difference in the data set across the three educational level groups (n(Gp1: primary school or secondary school) = 11, n(Gp2: further education or vocational training) = 25, n(Gp3: higher education) = 86).
There were statistically significant differences across the three employment status groups (n(Gp1: full-time employed) = 54, n(Gp2: part-time or self-employed) = 39, n(Gp3: not currently employed) = 28) in five social factor items, one perceived behaviour control item, all intention items, and frequency of upcycling. Respondents with part-time work or self-employment generally scored higher median values than others, whereas those not currently in employment scored the lowest median values for all variables. There was no statistically significant difference in attitude or perceived facilitating conditions across different employment status groups (Table 13).

5. Discussion

UK makers revealed their tendency to have a positive attitude toward and high intention for upcycling, showing their potential to engage in upcycling further. Socio-psychological factors appeared to be important to them, including approval from others, adhering to their principles about using resources responsibly, and fitting in their community, friendship or support networks. This implies that UK makers in general may be driven by what making and craft stand for historically—improving the environment while creating artefacts and fulfilling themselves psychologically [99,100]. This further implies that upcycling could be understood as a long-standing collective human behaviour or practice which could benefit from a historical study. Upcycling turned out to be related to presence/absence of tools, materials, teachers/helpers, skills, imagination, inspiration, and information. A lack of these seven perceived facilitating conditions may be the common barrier for upcycling. In particular, sourcing sufficient used or waste materials was found to be one of the big, common challenges for upcycling entrepreneurs in another study [51]. Improved material provision should therefore be one of the priority interventions when it comes to scaling up (e.g., encouraging more people to engage in upcycling). The correlation between intention and potential intention determinants (attitude, social factors, and perceived behaviour control) corroborates many studies predicting or explaining sustainable behaviour [75,101,102,103,104,105].
The results from logistic regression analyses showed particularly strong contribution by intention, attitude, and subjective norm (other people’s expectations). Taking this into account, Figure 4 shows a new, proposed behaviour model to explain upcycling. In summary, attitude exerts a strong influence on intention, whereas norms and role beliefs have a moderate influence and perceived behaviour control a weak influence. Intention and subjective norm strongly influence frequency of upcycling, whereas all the other factors exert a weak influence. The results demonstrate that upcycling is an intention-driven, deliberate act strongly influenced by positive attitude (pleasant) and social expectations. Although an intention−behaviour gap (i.e., intention without taking action) or an attitude−behaviour gap (i.e., positive attitude without taking action) has been reported for some forms of sustainable behaviour [106,107,108,109,110,111], upcycling has been proven to be an intention- and attitude-driven behaviour to some extent. Considerable influence of subjective norm on intention and the frequency of upcycling corroborates existing studies on sustainable food consumption [12,112], sustainable agricultural practices [113,114] or waste recycling [115,116]. A noticeable influence of role beliefs (role in community) on intention has been relatively less reported than those of attitude or subjective norm (e.g., pro-environmental civic engagement [117] or mode of travel [75]). This implies that upcycling may be more community-oriented than other types of sustainable behaviour. Community-based interventions (rather than targeting individuals) are therefore recommended.
The new, proposed model (Figure 4) is particularly useful for guiding the actionable strategies (or interventions) for scaling up upcycling. The key factors influencing the upcycling behaviour provide the foci of future intervention planning and implementation. Any actors (e.g., central government, local authorities, NGOs, activists) aiming to promote upcycling therefore need to pay more attention to intention shaping, which focuses on building positive attitudes towards upcycling and establishing positive subjective norms (social expectation) around upcycling. For instance, interesting TV shows and other effective information and inspirational materials (e.g., social media campaign, YouTube videos) as well as community-based upcycling family events, workshops, and training sessions could contribute to the development of positive attitudes and subjective norms [18]. Change in government procurement policies (to favour upcycled goods over mass-produced ones based on virgin materials) and commissioned upcycling projects by famous artists and designers could help to establish strong, positive subjective norms around upcycling [18]. Sung’s research project [18] generated a number of promising interventions based on this survey result and qualitative inquiry result and tested the initial intervention ideas and further developed them with British experts (academics and policy makers). This validation process with experts produced a number of prioritised interventions (i.e., high-priority interventions for the short term, medium-priority interventions for the short term, and priority interventions for the long term). For example, there were two high-priority interventions for the short term. One was improving access to and the facilities and services of community workshops with space, tools, materials, and training for diverse demographic populations. The other was producing TV shows and other inspirational media to share the best practices.
Regarding the differences identified by comparing demographic groups, females, 30+ age groups, and art and design occupational area groups are markedly meaningful, as these groups are most likely to start upcycling or engage more frequently in upcycling as a result of an intervention. Other than the occupational area group, 30+ females’ inclination may be rooted in the long history of women’s domestic arts, handicrafts, and home improvements as precursors to any DIY activities of today, including upcycling [118,119]. This could be related to the previous speculation about upcycling as a long-standing collective human behaviour, further suggesting a historical study on upcycling for future endeavours to add knowledge to upcycling theory.

6. Conclusions

Research on sustainable consumer behaviour has paid relatively little attention to upcycling as an important opportunity to contribute significantly to the reduction of waste and greenhouse gas emissions. This paper aimed to address this knowledge gap by exploring factors influencing upcycling for UK makers. The study employed an online survey using the combination model between Triandis’s theory of interpersonal behaviour and Ajzen’s theory of planned behaviour, recognising the promises and limitations of both models.
The analysis of the survey revealed relationships between factors influencing upcycling, key factors explaining the frequency and intention of upcycling, and group differences based on demographics. Key influencing factors (i.e., determinants) for upcycling turned out to be intention, attitude, and subjective norm. Demographic characteristics of people who are likely to upcycle frequently were 30+ females working in art and design. The paper further discussed how the results are related to the existing studies and how they can be used to develop and implement interventions for scaling up.
This study is limited to household upcycling by UK makers. The generalisability of results is confined by the geographic and demographic focus of this study. Due to this justifiably narrow and focused scope of research, findings and practical implications are applicable only to the UK context. As all the factors were used to explain the frequency of past behaviour, the results may not be consistent with those to predict future behaviour. Further studies could address these limitations by, for instance, conducting a nationwide survey in the UK with a nationally representative sample or an international survey comparing multiple geographical areas with a survey instrument to predict future behaviour.
Despite the limitations, the paper presents the first study exploring consumer upcycling using the combination model between Triandis’s theory of interpersonal behaviour and Ajzen’s theory of planned behaviour, demonstrating how understanding attitude, intention, and subjective norm helps to explain upcycling behaviour. The paper extends our understanding of why UK makers (or some consumers) are motivated to engage in upcycling in households and how this information could be used to develop and implement effective interventions for scaling up. The paper thus contributes to both conceptual understanding and practices of upcycling. The theoretical developments (the combination model) could be applied to other contexts and behaviour domains in any effort involving behaviour investigation and intervention. In a wider discussion of sustainability, this study adds knowledge to investigation into an alternative to mass production and consumption from a consumer behaviour perspective and how the alternative behaviour could be scaled up by addressing key behaviour factors. It is our hope that our findings will not only inspire and inform academic researchers for their further studies on upcycling but also enable relevant actors to scale up upcycling in the UK and beyond, contributing to sustainable production and consumption.

Author Contributions

K.S. conceived, designed, and conducted the survey, analysed the data and wrote the paper. T.C. and S.K. contributed to the conception and design of the study and critical revision of the paper.

Funding

This research was funded by Nottingham Trent University with support from the RCUK Energy Programme’s funding for the Centre for Industrial Energy, Materials, and Products, grant number EP/N022645/1, for research design, data collection and analysis. The APC was funded by De Montfort University.

Acknowledgments

Paper writing was supported by the Research and Innovation Allowance from De Montfort University (DMU). We thank Stuart Lawson and Deborah Cartmell for supporting this research at DMU. Many thanks to Michael White for reviewing statistical analyses.

Conflicts of Interest

The authors declare no conflict of interest. The funding bodies had no role in the design of the study; in the collection, analyses, or interpretation of data; in the writing of the manuscript, and in the decision to publish the results.

References

  1. Barrett, J.; Peters, G.; Wiedmann, T.; Scott, K.; Lenzen, M.; Roelich, K.; Le Quéré, C. Consumption-based GHG emission accounting: A UK case study. Clim. Policy 2013, 13, 451–470. [Google Scholar] [CrossRef]
  2. Millward-Hopkins, J.; Gouldson, A.; Scott, K.; Barrett, J.; Sudmant, A. Uncovering blind spots in urban carbon management: The role of consumption-based carbon accounting in Bristol, UK. Reg. Environ. Chang. 2017, 17, 1467–1478. [Google Scholar] [CrossRef]
  3. Minx, J.; Baiocchi, G.; Wiedmann, T.; Barrett, J.; Creutzig, F.; Feng, K.; Förster, M.; Pichler, P.; Weisz, H.; Hubacek, K. Carbon footprints of cities and other human settlements in the UK. Environ. Res. Lett. 2013, 8, 035039. [Google Scholar] [CrossRef]
  4. Wiedmann, T.; Wood, R.; Lenzen, M.; Minx, J. Development of an Embedded Carbon Emissions Indicator-Producing a Time Series of Input-Output Tables und Embedded Carbon Dioxide Emissions for the UK by Using a MRIO Data Optimisation System. 2008. Available online: https://www.sei.org/publications/development-embedded-carbon-emissions-indicator-producing-time-series-input-output-tables-embedded-carbon-dioxide-emissions-uk-using-mrio-data-optimisation-system/ (accessed on 5 February 2019).
  5. Wiedmann, T.; Wood, R.; Minx, J.C.; Lenzen, M.; Guan, D.; Harris, R. A carbon footprint time series of the UK–results from a multi-region input-output model. Econ. Syst. Res. 2010, 22, 19–42. [Google Scholar] [CrossRef]
  6. West, S.E.; Owen, A.; Axelsson, K.; West, C.D. Evaluating the use of a carbon footprint calculator: Communicating impacts of consumption at household level and exploring mitigation options. J. Ind. Ecol. 2016, 20, 396–409. [Google Scholar] [CrossRef]
  7. Whitmarsh, L.; Lorenzoni, I.; O’Neill, S. Engaging the Public with Climate Change: Behaviour Change and Communication; Routledge: Abingdon, UK, 2012. [Google Scholar]
  8. Barr, S.; Gilg, A.; Shaw, G. ‘Helping people make better choices’: Exploring the behaviour change agenda for environmental sustainability. Appl. Geogr. 2011, 31, 712–720. [Google Scholar] [CrossRef]
  9. Webb, J. Climate change and society: The chimera of behaviour change technologies. Sociology 2012, 46, 109–125. [Google Scholar] [CrossRef]
  10. Moloney, S.; Horne, R.E.; Fien, J. Transitioning to low carbon communities—From behaviour change to systemic change: Lessons from Australia. Energy Policy 2010, 38, 7614–7623. [Google Scholar] [CrossRef]
  11. Barr, S.; Shaw, G.; Coles, T. Times for (Un) sustainability? Challenges and opportunities for developing behaviour change policy. A case-study of consumers at home and away. Glob. Environ. Chang. 2011, 21, 1234–1244. [Google Scholar] [CrossRef]
  12. Vermeir, I.; Verbeke, W. Sustainable food consumption among young adults in Belgium: Theory of planned behaviour and the role of confidence and values. Ecol. Econ. 2008, 64, 542–553. [Google Scholar] [CrossRef]
  13. Tonglet, M.; Phillips, P.S.; Read, A.D. Using the Theory of Planned Behaviour to investigate the determinants of recycling behaviour: A case study from Brixworth, UK. Resour. Conserv. Recycl. 2004, 41, 191–214. [Google Scholar] [CrossRef]
  14. Prillwitz, J.; Barr, S. Moving towards sustainability? Mobility styles, attitudes and individual travel behaviour. J. Transp. Geogr. 2011, 19, 1590–1600. [Google Scholar] [CrossRef]
  15. Ritch, E.; Brennan, C.; MacLeod, C. Plastic bag politics: Modifying consumer behaviour for sustainable development. Int. J. Consum. Stud. 2009, 33, 168–174. [Google Scholar] [CrossRef]
  16. Nordin, N.; Selke, S. Social aspect of sustainable packaging. Packag. Technol. Sci. 2010, 23, 317–326. [Google Scholar] [CrossRef]
  17. Webb, D.; Soutar, G.N.; Mazzarol, T.; Saldaris, P. Self-determination theory and consumer behavioural change: Evidence from a household energy-saving behaviour study. J. Environ. Psychol. 2013, 35, 59–66. [Google Scholar] [CrossRef]
  18. Sung, K. Sustainable Production and Consumption by Upcycling: Understanding and Scaling up Niche Environmentally Significant Behaviour. Ph.D. Thesis, Nottingham Trent University, Nottingham, UK, 2017. [Google Scholar]
  19. Wilson, M. When creative consumers go green: Understanding consumer upcycling. J. Product Brand Manag. 2016, 25, 394–399. [Google Scholar] [CrossRef]
  20. Emgin, B. Trashion: The Return of the Disposed. Des. Issues 2012, 28, 63–71. [Google Scholar] [CrossRef]
  21. McDonough, W.; Braungart, M. The Upcycle: Beyond Sustainability—Designing for Abundance; North Point Press: New York, NA, USA, 2013; ISBN 978-0-86547-748-3. [Google Scholar]
  22. Braungart, M. Upcycle to eliminate waste: The chemist recasts materials in an endless loop. Nature 2013, 494, 174–175. [Google Scholar] [CrossRef]
  23. Martin, M.; Eklund, M. Improving the environmental performance of biofuels with industrial symbiosis. Biomass Bioenergy 2011, 35, 1747–1755. [Google Scholar] [CrossRef]
  24. Sung, K.; Cooper, T.; Kettley, S. Individual Upcycling Practice: Exploring the Possible Determinants of Upcycling Based on a Literature Review. In Proceedings of the Sustainable Innovation 2014 Conference, Copenhagen, Denmark, 3–4 November 2014; pp. 237–244. [Google Scholar]
  25. Sung, K.; Cooper, T.; Kettley, S. Emerging Social Movements for Sustainability: Understanding and Scaling Up Upcycling in the UK. In The Palgrave Handbook of Sustainability; Springer: Cham, Switzerland, 2018; pp. 299–312. ISBN 978-3-319-71389-2. [Google Scholar]
  26. Stahel, W.R. The circular economy. Nature 2016, 531, 435–438. [Google Scholar] [CrossRef]
  27. Ellen MacArthur Foundation Circular Economy. Available online: http://www.ellenmacarthurfoundation.org (accessed on 12 December 2018).
  28. Cooper, T. Longer Lasting Products; Routledge: Abingdon, UK, 2010; ISBN 978-1-315-59293-0. [Google Scholar]
  29. Allwood, J.M.; Ashby, M.F.; Gutowski, T.G.; Worrell, E. Material efficiency: A white paper. Resour. Conserv. Recycl. 2011, 55, 362–381. [Google Scholar] [CrossRef]
  30. Bramston, D.; Maycroft, N. Designing with waste. Mater. Exp. Fundam. Mater. Des. 2013, 123–133. [Google Scholar] [CrossRef]
  31. Zhuo, C.; Levendis, Y.A. Upcycling waste plastics into carbon nanomaterials: A review. J. Appl. Polym. Sci. 2014, 131, 1–14. [Google Scholar] [CrossRef]
  32. Anderson, C. Makers: The New Industrial Revolution; Random House Business: London, UK, 2012; ISBN 9781847940674. [Google Scholar]
  33. Busch, O.V. Fashion-able. Hacktivism and Engaged Fashion Design. Ph.D. Thesis, University of Gothenburg, Gothenburg, Sweden, 2008. [Google Scholar]
  34. Fletcher, K. Sustainable Fashion and Textiles: Design Journeys; Earthscan: London, UK, 2008; ISBN 9781317935216. [Google Scholar]
  35. McCorkill, G. Triangles in silk: Piecing together a practice of upcycling. In Proceedings of the Shapeshifting: A Conference on Transformative Paradigms of Fashion and Textile Design, Auckland, New Zealand, 14–16 April 2014. [Google Scholar]
  36. Park, J.H.; Kim, Y.H. A Study on fashion design for up-cycled waste resources. J. Korean Soc. Costume 2014, 64, 138–154. [Google Scholar] [CrossRef]
  37. Park, H.H. Clothing & Textiles: Original Article; the Influence of LOHAS Consumption Tendency and Perceived Consumer Effectiveness on Trust and Purchase Intention Regarding Upcycling Fashion Goods. Int. J. Hum. Ecol. 2015, 16, 37–47. [Google Scholar] [CrossRef]
  38. Twigger Holroyd, A. Fashion Diggers: Transgressive making for personal benefit. Mak. Futures 2012, 2, 51–61. [Google Scholar]
  39. Cassidy, D.; Han, S. Sustainability in Fashion and Textiles: Values, Design, Production and Consumption; Routledge: London, UK, 2013; pp. 148–163. ISBN 9781351277594. [Google Scholar]
  40. Han, S.; Tyler, D.; Apeagyei, P. Upcycling as a design strategy for product lifetime optimisation and societal change. In Proceedings of the Product Lifetimes and the Environment 2015 Conference, Nottingham, UK, 17–19 June 2015. [Google Scholar]
  41. Pol, V.G. Upcycling: Converting waste plastics into paramagnetic, conducting, solid, pure carbon microspheres. Environ. Sci. Technol. 2010, 44, 4753–4759. [Google Scholar] [CrossRef]
  42. Mo, Y.; Zhao, L.; Chen, C.; Tan, G.Y.A.; Wang, J. Comparative pyrolysis upcycling of polystyrene waste: Thermodynamics, kinetics, and product evolution profile. J. Therm. Anal. Calorim. 2013, 111, 781–788. [Google Scholar] [CrossRef]
  43. La Mantia, F.P. Polymer mechanical recycling: Downcycling or upcycling? Prog. Rubber Plast. Recycl. Technol. 2004, 20, 11–24. [Google Scholar] [CrossRef]
  44. Park, S.H.; Kim, S.H. Poly (ethylene terephthalate) recycling for high value added textiles. Fash. Text. 2014, 1, 1–17. [Google Scholar] [CrossRef]
  45. Goldsworthy, K. Design for Cyclability: Pro-active approaches for maximising material recovery. Mak. Futures 2014, 3, 250–261. [Google Scholar]
  46. Ankrah, N.A.; Manu, E.; Hammond, F.N.; Kim, K.G.B.A. Beyond Sustainable Buildings: Eco-Efficiency To Eco-Effectiveness Through Cradle-To-Cradle Design. In Proceedings of the 7th International Conference on Sustainability in Energy and Buildings, Lisbon, Portugal, 1–3 July 2015. [Google Scholar]
  47. Santulli, C.; Langella, C. ‘+ design − waste’: A project for upcycling refuse using design tools. Int. J. Sustain. Des. 2013, 2, 105–127. [Google Scholar] [CrossRef]
  48. Sung, K.; Cooper, T. Sarah Turner–Eco-artist and designer through craft-based upcycling. Craft Res. 2015, 6, 113–122. [Google Scholar] [CrossRef]
  49. Janigo, K.A.; Wu, J. Collaborative Redesign of Used Clothes as a Sustainable Fashion Solution and Potential Business Opportunity. Fash. Pract. 2015, 7, 75–97. [Google Scholar] [CrossRef]
  50. Todeschini, B.V.; Cortimiglia, M.N.; Callegaro-de-Menezes, D.; Ghezzi, A. Innovative and sustainable business models in the fashion industry: Entrepreneurial drivers, opportunities, and challenges. Bus. Horiz. 2017, 60, 759–770. [Google Scholar] [CrossRef]
  51. Sung, K.; Cooper, T.; Ramanathan, U.; Singh, J. Challenges and support for scaling up upcycling businesses in the UK: Insights from small-business entrepreneurs. In Proceedings of the Product Lifetimes and the Environment 2017 Conference, Delft, The Netherlands, 8–10 November 2017; IOS Press: Amsterdam, The Netherlands, 2017; pp. 397–401. [Google Scholar] [CrossRef]
  52. Steinhilper, R.; Hieber, M. Remanufacturing-the key solution for transforming “downcycling” into “upcycling” of electronics. In Proceedings of the 2001 IEEE International Symposium on Electronics and the Environment, Denver, CO, USA, 9 May 2001; IEEE: New York, NY, USA, 2002; pp. 161–166. [Google Scholar] [CrossRef]
  53. Sung, K. A review on upcycling: Current body of literature, knowledge gaps and a way forward. In Proceedings of the 17th International Conference on Environmental, Cultural, Economic and Social Sustainability, Venice, Italy, 13–14 April 2015; Volume 17, pp. 28–40. [Google Scholar]
  54. UK Government 2010 to 2015 Government Policy: Greenhouse Gas Emissions. Available online: https://www.gov.uk/government/publications/2010-to-2015-government-policy-greenhouse-gas-emissions/2010-to-2015-government-policy-greenhouse-gas-emissions#issue (accessed on 12 December 2018).
  55. EUED What is EUED? Available online: http://www.eued.ac.uk/whatiseued (accessed on 12 December 2018).
  56. CIE-MAP About CIE-MAP. Available online: http://ciemap.leeds.ac.uk/index.php/about/ (accessed on 12 December 2018).
  57. Van den Bosch, S.J.M. Transition Experiments: Exploring societal Changes towards Sustainability. Ph.D. Thesis, Erasmus University Rotterdam, Rotterdam, The Netherlands, 2010. [Google Scholar]
  58. Stern, P. Toward a coherent theory of environmentally significant behavior. J. Soc. Issues 2000, 56, 407–424. [Google Scholar] [CrossRef]
  59. Jackson, T. Motivating sustainable consumption: A review of evidence on consumer behaviour and behavioural change. In Sustainable Development Research Network; University of Surrey: Surrey, UK, 2005. [Google Scholar]
  60. Kallbekken, S.; Rise, J.; Westskog, H. Combining insights from economics and social psychology to explain environmentally significant consumption. In Sustainable Energy; John, K.D., Rübbelke, D.T.G., Eds.; Routledge: London, UK, 2008; pp. 127–145. ISBN 9781136899614. [Google Scholar]
  61. Martiskainen, M. Affecting consumer behaviour on energy demand, 2007. In SPRU-Science and Technology Policy Research; University of Sussex: Sussex, UK, 2007. [Google Scholar]
  62. Jackson, T. SDRN briefing one: Motivating sustainable consumption. In Sustainable Development Research Network; University of Sussex: Surrey, UK, 2005. [Google Scholar]
  63. Feola, G.; Binder, C.R. Towards an improved understanding of farmers’ behaviour: The integrative agent-centred (IAC) framework. Ecol. Econ. 2010, 69, 2323–2333. [Google Scholar] [CrossRef]
  64. Klöckner, C.A.; Blöbaum, A. A comprehensive action determination model: Toward a broader understanding of ecological behaviour using the example of travel mode choice. J. Environ. Psychol. 2010, 30, 574–586. [Google Scholar] [CrossRef]
  65. Fishbein, M.; Ajzen, I. Belief, Attitude, Intention and Behavior: An Introduction to Theory and Research; Addison-Wesley: Reading, MA, USA, 1975. [Google Scholar]
  66. Stern, P.C.; Dietz, T.; Abel, T.D.; Guagnano, G.A.; Kalof, L. A value-belief-norm theory of support for social movements: The case of environmentalism. Hum. Ecol. Rev. 1999, 6, 81–97. [Google Scholar]
  67. Darnton, A. Reference Report: An Overview of Behaviour Change Models and Their Uses; Government Social Research: London, UK, 2008. [Google Scholar]
  68. Gagnon, M.; Sánchez, E.; Pons, J. From recommendation to action: Psychosocial factors influencing physician intention to use Health Technology Assessment (HTA) recommendations. Implement. Sci. 2006, 1, 8. [Google Scholar] [CrossRef]
  69. Cotterill, S.; Stoker, L.R.G.; Wales, C. Reinvigorating the Civic: Searching for a Rationale for our Research Programme. In Proceedings of the Political Studies Association Conference 2008, Swansea, UK, 1–3 April 2008. [Google Scholar]
  70. Salonen, A.O.; Helne, T.T. Vegetarian diets: A way towards a sustainable society. J. Sustain. Dev. 2012, 5, 10–24. [Google Scholar] [CrossRef]
  71. Tang, T. Towards Sustainable Use: Design Behaviour Intervention to Reduce Household Environment Impact. Ph.D. Thesis, Loughborough University, Loughborough, UK, 2010. [Google Scholar]
  72. Triandis, H.C. Interpersonal Behavior; Brooks/Cole Publishing: Monterey, CA, USA, 1977; ISBN1 081850188X. ISBN2 9780818501883. [Google Scholar]
  73. Ajzen, I.; Madden, T.J. Prediction of goal-directed behavior: Attitudes, intentions, and perceived behavioral control. J. Exp. Soc. Psychol. 1986, 22, 453–474. [Google Scholar] [CrossRef]
  74. Ajzen, I. Constructing a TPB questionnaire: Conceptual and methodological considerations; University of Massachusetts: Amherst, MA, USA, 2002. [Google Scholar]
  75. Bamberg, S.; Schmidt, P. Incentives, morality, or habit? Predicting students’ car use for university routes with the models of Ajzen, Schwartz, and Triandis. Environ. Behav. 2003, 35, 264–285. [Google Scholar] [CrossRef]
  76. Armitage, C.J.; Conner, M. Efficacy of the theory of planned behaviour: A meta-analytic review. Br. J. Soc. Psychol. 2001, 40, 471–499. [Google Scholar] [CrossRef] [PubMed]
  77. Conner, M.; Sparks, P. Theory of planned behaviour and health behaviour. Predict. Health Behav. 2005, 2, 170–222. [Google Scholar]
  78. Fishbein, M.; Ajzen, I. A theory of reasoned action: Some applications and implications. In Nebraska Symposium on Motivation; Howe, H.E., Jr., Page, M.M., Eds.; University of Nebraska Press: Lincoln, NE, USA, 1980; Volume 27, pp. 65–116. [Google Scholar]
  79. Francis, J.J.; Eccles, M.P.; Johnston, M.; Walker, A.; Grimshaw, J.; Foy, R.; Kaner, E.F.; Smith, L.; Bonetti, D. Constructing Questionnaires Based on the Theory of Planned Behaviour. A Manual for Health Services Researchers; University of Newcastle: Newcastle upon Tyne, UK, 2004; ISBN 0-9540161-5-7. [Google Scholar]
  80. Madden, T.J.; Ellen, P.S.; Ajzen, I. A comparison of the theory of planned behavior and the theory of reasoned action. Person. Soc. Psychol Bull. 1992, 18, 3–9. [Google Scholar] [CrossRef]
  81. Montano, D.E.; Kasprzyk, D. Theory of reasoned action, theory of planned behavior, and the integrated behavioral model. In Health Behavior: Theory, Research and Practice, 5th ed.; Glanz, K., Rimer, B.K., Viswanath, K., Eds.; Jossey-Bass: San Francisco, CA, USA; pp. 95–124. ISBN 978-1-118-62898-0.
  82. Sheppard, B.H.; Hartwick, J.; Warshaw, P.R. The theory of reasoned action: A meta-analysis of past research with recommendations for modifications and future research. J. Consum. Res. 1988, 15, 325–343. [Google Scholar] [CrossRef]
  83. De Groot, J.I.; Steg, L. Morality and prosocial behavior: The role of awareness, responsibility, and norms in the norm activation model. J. Soc. Psychol. 2009, 149, 425–449. [Google Scholar] [CrossRef]
  84. Harland, P.; Staats, H.; Wilke, H.A. Situational and personality factors as direct or personal norm mediated predictors of pro-environmental behavior: Questions derived from norm-activation theory. Basic Appl. Soc. Psychol. 2007, 29, 323–334. [Google Scholar] [CrossRef]
  85. Joireman, J.A.; Lasane, T.P.; Bennett, J.; Richards, D.; Solaimani, S. Integrating social value orientation and the consideration of future consequences within the extended norm activation model of proenvironmental behaviour. Br. J. Soc. Psychol. 2001, 40, 133–155. [Google Scholar] [CrossRef]
  86. Monteith, M.J.; Deneen, N.E.; Tooman, G.D. The effect of social norm activation on the expression of opinions concerning gay men and Blacks. Basic Appl. Soc. Psychol. 1996, 18, 267–288. [Google Scholar] [CrossRef]
  87. Liere, K.D.; Dunlap, R.E. Moral Norms and Environmental Behavior: An Application of Schwartz’s Norm-Activation Model to Yard Burning. J. Appl. Soc. Psychol. 1978, 8, 174–188. [Google Scholar] [CrossRef]
  88. Araújo-Soares, V.; Presseau, J. Theory-based behaviour prediction and change: An interview with Gaston Godin. Eur. Health Psychol. 2008, 10, 51–53. [Google Scholar]
  89. Gagnon, M.; Godin, G.; Gagné, C.; Fortin, J.; Lamothe, L.; Reinharz, D.; Cloutier, A. An adaptation of the theory of interpersonal behaviour to the study of telemedicine adoption by physicians. Int. J. Med. Inf. 2003, 71, 103–115. [Google Scholar] [CrossRef]
  90. Knoeri, C.; Russell, S. motivations and barriers to infrastructure service-performance contracting: Survey procedure and design. In Sustainability Research Institute; University of Leeds: Leeds, UK, 2014. [Google Scholar]
  91. Venkatesh, V.; Davis, F.D. A theoretical extension of the technology acceptance model: Four longitudinal field studies. Manag. Sci. 2000, 46, 186–204. [Google Scholar] [CrossRef]
  92. Bryman, A. Social Research Methods, 5th ed.; Oxford University Press: New York, NY, USA, 2016; ISBN 978-0-19-968945-3. [Google Scholar]
  93. Robson, C. Real World Research: A Resource for Social Scientists and practitioner-Researchers, 2nd ed.; Blackwell: Oxford, UK, 2002; ISBN 9781405182409. [Google Scholar]
  94. Sung, K.; Cooper, T.; Kettley, S. Individual Upcycling in the UK: Insights for Scaling up Towards Sustainable Development. In Sustainable Development Research at Universities in the United Kingdom; Leal Filho, W., Ed.; Springer: Cham, Switzerland, 2017; pp. 193–227. [Google Scholar] [CrossRef]
  95. Demidenko, E. Sample size determination for logistic regression revisited. Stat. Med. 2007, 26, 3385–3397. [Google Scholar] [CrossRef] [PubMed]
  96. Peduzzi, P.; Concato, J.; Kemper, E.; Holford, T.R.; Feinstein, A.R. A simulation study of the number of events per variable in logistic regression analysis. J. Clin. Epidemiol. 1996, 49, 1373–1379. [Google Scholar] [CrossRef]
  97. Allison, P. What’s the Best R-Squared for Logistic Regression? University of Pennsylvania: Philadelphia, PA, USA, 2013. [Google Scholar]
  98. Cohen, J. Statistical Power Analysis for the Behavioural Sciences; Lawrence Earlbaum Associates: Hillsdale, MI, USA, 1988; ISBN 978-0-12-179060-8. [Google Scholar]
  99. Greenhalgh, P. The history of craft. In The Design History Reader; Lees-Maffei, G., Houze, R., Eds.; Berg: Oxford, UK, 2010; pp. 329–335. ISBN 9781847883889. [Google Scholar]
  100. Metcalf, B. Contemporary craft: A brief overview. In Exploring Contemporary Craft: History, Theory and Critical Writing; Johnson, J., Ed.; Coach House Books and Harbourfront Centre: Toronto, ON, Canada, 2002; pp. 13–23. ISBN 978-1-77056-049-9. [Google Scholar]
  101. Blok, V.; Wesselink, R.; Studynka, O.; Kemp, R. Encouraging sustainability in the workplace: A survey on the pro-environmental behaviour of university employees. J. Clean. Prod. 2015, 106, 55–67. [Google Scholar] [CrossRef]
  102. Gatersleben, B.; Murtagh, N.; Abrahamse, W. Values, identity and pro-environmental behaviour. Contemp. Soc. Sci. 2014, 9, 374–392. [Google Scholar] [CrossRef]
  103. De Leeuw, A.; Valois, P.; Seixas, R. Understanding high school students’ attitude, social norm, perceived control and beliefs to develop educational interventions on sustainable development. Procedia Soc. Behav. Sci. 2014, 143, 1200–1209. [Google Scholar] [CrossRef]
  104. Kumar, B. Theory of Planned Behaviour Approach to Understand the Purchasing Behaviour for Environmentally Sustainable Products; Indian Institute of Management: Ahmedabad, India, 2012. [Google Scholar]
  105. Ramayah, T.; Lee, J.W.C.; Lim, S. Sustaining the environment through recycling: An empirical study. J. Environ. Manag. 2012, 102, 141–147. [Google Scholar] [CrossRef] [PubMed]
  106. Roundtable, S.C. I Will if You Will: Towards Sustainable Consumption; Sustainable Consumption Roundtable: London, UK, 2006; ISBN 1-899581-79-0. [Google Scholar]
  107. Carrington, M.J.; Neville, B.A.; Whitwell, G.J. Why ethical consumers don’t walk their talk: Towards a framework for understanding the gap between the ethical purchase intentions and actual buying behaviour of ethically minded consumers. J. Bus. Eth. 2010, 97, 139–158. [Google Scholar] [CrossRef]
  108. Hassan, L.M.; Shiu, E.; Shaw, D. Who says there is an intention–behaviour gap? Assessing the empirical evidence of an intention–behaviour gap in ethical consumption. J. Bus. Eth. 2016, 136, 219–236. [Google Scholar] [CrossRef]
  109. Juvan, E.; Dolnicar, S. The attitude–behaviour gap in sustainable tourism. Ann. Tour. Res. 2014, 48, 76–95. [Google Scholar] [CrossRef]
  110. Boulstridge, E.; Carrigan, M. Do consumers really care about corporate responsibility? Highlighting the attitude—Behaviour gap. J. Commun. Manag. 2000, 4, 355–368. [Google Scholar] [CrossRef]
  111. Young, W.; Hwang, K.; McDonald, S.; Oates, C.J. Sustainable consumption: Green consumer behaviour when purchasing products. Sustain. Dev. 2010, 18, 20–31. [Google Scholar] [CrossRef]
  112. Shin, Y.H.; Hancer, M. The role of attitude, subjective norm, perceived behavioral control, and moral norm in the intention to purchase local food products. J. Foodserv. Bus. Res. 2016, 19, 338–351. [Google Scholar] [CrossRef]
  113. Fielding, K.S.; Terry, D.J.; Masser, B.M.; Hogg, M.A. Integrating social identity theory and the theory of planned behaviour to explain decisions to engage in sustainable agricultural practices. Br. J. Soc. Psychol. 2008, 47, 23–48. [Google Scholar] [CrossRef] [PubMed]
  114. Velde, F.V.; Claerebout, E.; Cauberghe, V.; Hudders, L.; Van Loo, H.; Vercruysse, J.; Charlier, J. Diagnosis before treatment: Identifying dairy farmers’ determinants for the adoption of sustainable practices in gastrointestinal nematode control. Vet. Parasitol. 2015, 212, 308–317. [Google Scholar] [CrossRef] [PubMed]
  115. Park, J.; Ha, S. Understanding consumer recycling behavior: Combining the theory of planned behavior and the norm activation model. Fam. Consum. Sci. Res. J. 2014, 42, 278–291. [Google Scholar] [CrossRef]
  116. Chan, K. Mass communication and pro-environmental behaviour: Waste recycling in Hong Kong. J. Environ. Manag. 1998, 52, 317–325. [Google Scholar] [CrossRef]
  117. Buta, N.; Holland, S.M.; Kaplanidou, K. Local communities and protected areas: The mediating role of place attachment for pro-environmental civic engagement. J. Outdoor Recreat. Tour. 2014, 5, 1–10. [Google Scholar] [CrossRef]
  118. Edwards, C. ‘Home is where the art is’: Women, handicrafts and home improvements 1750–1900. J. Des. Hist. 2006, 19, 11–21. [Google Scholar] [CrossRef]
  119. Atkinson, P. Do it yourself: Democracy and design. J. Des. Hist. 2006, 19, 1–10. [Google Scholar] [CrossRef]
Figure 1. Triandis’s theory of interpersonal behaviour model as adapted by Jackson [59].
Sustainability 11 00870 g001
Figure 2. Combination model of theory of interpersonal behaviour and theory of planned behaviour.
Sustainability 11 00870 g002
Figure 3. (a) 1st model to explain frequency of upcycling; (b) 2nd model to explain intention to upcycle; (c) 3rd model to explain frequency of upcycling based on all independent variables.
Sustainability 11 00870 g003
Figure 4. New, suggested model to explain upcycling behaviour (→ strong contribution; → medium contribution; ---> weak contribution).
Sustainability 11 00870 g004
Table 1. Questions asked in the survey.
FactorQuestions and Answer Options
AttitudeTo me, taking part in upcycling is…
(1: unpleasant–7: pleasant; 1: bad–7: good; 1: worthless–7: worthwhile; 1: harmful–7: beneficial; 1: unenjoyable–7: enjoyable)
Subjective norm (social factor 1)How much do you agree or disagree with the following sentences?
(1) Most people who are important to me think that I ought to upcycle; (2) Most people who are important to me expect me to upcycle; (3) Most people who are important to me would approve of me upcycling
(1: strongly disagree–7: strongly agree)
Personal norm (social factor 2)How much do you agree or disagree with the following sentences?
(1) I would feel guilty if I was not upcycling, especially when used materials are available and would become waste otherwise; (2) Upcycling reflects my principles about using resources responsibly; (3) It would be unacceptable to me not to upcycle, especially when used materials are available and would become waste otherwise.
(1: strongly disagree–7: strongly agree)
Role beliefs
(social factor 3)
How much do you agree or disagree with the following sentences?
Upcycling fits my role in…
(1) my workplace; (2) my family; (3) my community; (4) my friendship / support networks
(1: strongly disagree–7: strongly agree; not applicable)
Perceived behaviour control How much do you agree or disagree with the following sentences?
(1) For me upcycling would be possible; (2) If I wanted to I could upcycle; (3) Upcycling would be easy for me; (4) It is mostly up to me whether or not I upcycle.
(1: strongly disagree–7: strongly agree)
Intention How much do you agree or disagree with the following sentences?
(1) My likelihood of upcycling is high; (2) If I have the opportunity, I will upcycle; (3) I intend to upcycle.
(1: strongly disagree–7: strongly agree)
Perceived facilitating conditions To what extent do you think the following factors have impeded your upcycling? A lack of…
(1) space; (2) tools; (3) used products, components or materials; (4) teachers or helpers; (5) knowledge; (6) skills; (7) imagination; (8) inspiration; (9) information; (10) collaborators or companions; (11) spare time; (12) supporting culture; (13) supporting policy; (14) financial incentives; (15) money to pay for materials and tools involved
(1: not at all–7: to a very great extent)
Perceived habitsHow frequently do you engage in the following activities?
(1) drawing, painting and/or other art work; (2) hacking, tinkering and/or experimenting; (3) donating products to charities; (4) sharing, bartering, lending and/or swapping products; (5) simple reusing (e.g., use plastic package as a food container); (6) handcraft using new materials; (7) repairing and/or fixing things; (8) recycling household waste; (8) composting; (9) digital creation (e.g., use on/offline software to create pictures, articles, videos, etc.); (10) making and/or building using new materials
(1: never–7: very frequently)
Frequency of upcycling Approximately how often have you upcycled things in the past five years?
(1: never; 2: less frequently than once a year; 3: about once a year; 4: about once every six months; 5: about once every three months; 6: about once a month; 7: about once a week; 8: more frequently than once a week)
Table 2. Sociodemographic characteristics of survey respondents.
CharacteristicFrequencyCharacteristic Frequency
Gender Male
Female
59 (48.4%)
63 (51.6%)
Ethnicity White-British
White-Irish
Any other white
Any other mixed
Asian-Chinese
Any other Asian
African
102 (83.6%)
1 (0.8%)
14 (11.5%)
2 (1.6%)
1 (0.8%)
1 (0.8%)
1 (0.8%)
Age group Under 30
30 to 49
50 and over
22 (18.0%)
63 (51.6%)
37 (30.3%)
Nationality British
American
German
Irish
Italian
Romanian
Slovakian
South African
110 (90.2%)
4 (3.3%)
2 (1.6%)
1 (0.8%)
1 (0.8%)
1 (0.8%)
1 (0.8%)
1 (0.8%)
Region of residencyEast Midlands
East of England
London
North East
North West
Scotland
South East
South West
Wales
West Midlands
Yorkshire and the Humber
13 (10.7%)
11 (9.0%)
8 (6.6%)
8 (6.6%)
23 (18.9%)
6 (4.9%)
28 (23.0%)
13 (10.7%)
3 (2.5%)
3 (2.5%)
5 (4.1%)
Education Primary
Secondary
Further
Higher
2 (1.6%)
9 (7.4%)
25 (20.5%)
86 (70.5%)
Employment Full time
Part-time and self-employed
Not currently in employment
54 (44.3%)
39 (32.0%)
28 (23.0%)
Occupation/
study area
Business and sales
Creative arts and design
Science and engineering
Teaching and education
Others
14 (11.5%)
35 (28.7%)
32 (26.2%)
14 (11.5%)
27 (22.1%)
Table 3. Attitude, social factors, perceived behaviour control and facilitating conditions, and intention (n = 122).
Factor ItemsMeanSD
AttitudeUnpleasant–Pleasant
Bad–Good
Worthless–Worthwhile
Harmful–Beneficial
Unenjoyable–Enjoyable
5.75
5.96
5.79
5.85
5.96
1.14
1.13
1.25
1.18
1.05
Subjective normMost people who are important to me think that I ought to upcycle
Most people who are important to me expect me to upcycle
Most people who are important to me would approve of me upcycling
3.85
3.93
5.57
1.39
1.74
1.20
Personal normI would feel guilty if I was not upcycling, especially when used materials are available and would become waste otherwise4.431.77
Upcycling reflects my principles about using recourses responsibly5.431.44
It would be unacceptable to me not to upcycle, especially when used materials are available and would become waste otherwise4.631.74
Role beliefsUpcycling fits my role in my workplace
Upcycling fits my role in my family
Upcycling fits my role in my community
Upcycling fits my role in my friendship/support networks
4.15
4.92
5.06
5.06
1.69
1.44
1.33
1.36
Perceived behaviour control For me upcycling would be possible
If I wanted to I could upcycle
Upcycling would be easy for me
It is mostly up to me whether or not I upcycle
6.05
5.98
5.11
6.16
0.81
0.81
1.23
0.83
Perceived facilitating conditions A lack of space
A lack of tools
A lack of used products, components or materials
A lack of teachers or helpers
A lack of knowledge
A lack of skills
A lack of imagination
A lack of inspiration
A lack of information
A lack of collaborators or companions
A lack of spare time
A lack of supporting culture
A lack of supporting policy
A lack of financial incentives
A lack of money to pay for materials and tools involved
4.41
3.54
3.48
2.85
3.33
3.39
3.14
3.38
2.95
3.03
4.51
2.72
2.99
2.62
3.64
1.92
1.84
1.75
1.68
1.89
1.77
1.88
1.99
1.70
1.75
2.03
1.86
1.88
1.68
1.86
Intention My likelihood of upcycling is high
If I have the opportunity, I will upcycle
I intend to upcycle
5.45
5.70
5.68
1.31
0.96
1.16
Table 4. Frequency of upcycling (n = 122).
Factor Answer OptionNPercentage (%)
Frequency of upcyclingNever
Less frequently than once a year
About once a year
About once every six months
About once every three months
About once a month
About once a week
More frequently than once a week
0
7
14
24
32
19
11
15
0.0
5.7
11.5
19.7
26.2
15.6
9.0
12.3
Table 5. Intention and perceived facilitating conditions with upcycling frequency (n = 122).
Factor ItemsCorrelation Coefficient
Intention My likelihood of upcycling is high
If I have the opportunity, I will upcycle
I intend to upcycle
0.568 **
0.583 **
0.600 **
Perceived facilitating conditionsA lack of space
A lack of tools
A lack of used products, components or materials
A lack of teachers or helpers
A lack of knowledge
A lack of skills
A lack of imagination
A lack of inspiration
A lack of information
A lack of collaborators or companions
A lack of spare time
A lack of supporting culture
A lack of supporting policy
A lack of financial incentives
A lack of money to pay for materials and tools involved
0.139
0.187 *
0.244 **
0.183 *
0.174
0.181 *
0.307 **
0.350 **
0.184 *
0.018
0.061
0.129
0.131
0.021
0.119
Note: * p < 0.005 (2-tailed), ** p < 0.001 (2-tailed).
Table 6. Attitude, social factors, and perceived behaviour control with intention (n = 122).
Factor ItemsCorrelation Coefficient
Attitude Unpleasant–Pleasant
Bad–Good
Worthless–Worthwhile
Harmful–Beneficial
Unenjoyable–Enjoyable
0.447 **
0.423 **
0.474 **
0.401 **
0.309 **
Subjective norm Most people who are important to me think that I ought to upcycle
Most people who are important to me expect me to upcycle
Most people who are important to me would approve of me upcycling
0.362 **
0.587 **
0.346 **
Personal norm I would feel guilty if I was not upcycling, especially when used materials are available and would become waste otherwise 0.516 **
Upcycling reflects my principles about using resources responsibly 0.558 **
It would be unacceptable to me not to upcycle, especially when used materials are available and would become waste otherwise 0.599 **
Role beliefs Upcycling fits my role in my workplace
Upcycling fits my role in my family
Upcycling fits my role in my community
Upcycling fits my role in my friendship/support networks
0.287 **
0.341 **
0.512 **
0.401 **
Perceived behaviour control For me upcycling would be possible
If I wanted to I could upcycle
Upcycling would be easy for me
It is mostly up to me whether or not I upcycle
0.435 **
0.355 **
0.447 **
0.214 *
Note: * p < 0.005 (2-tailed), ** p < 0.001 (2-tailed).
Table 7. Likelihood of reporting frequent upcycling with intention and perceived facilitating conditions (n = 122).
Factor
(Number)
ItemsβSE βWald’s x2dfpOdds Ratio
Intention
(3/3)
I intend to upcycle
My likelihood of upcycling is high
If I have the opportunity, I will upcycle
2.248
0.673
1.446
0.909
0.617
0.997
6.113
1.189
2.101
1
1
1
0.013
0.275
0.147
9.467
1.961
4.245
Perceived facilitating conditions
(7/15)
A lack of materials
A lack of imagination
A lack of inspiration
A lack of tools
A lack of teachers/helpers
A lack of skills
A lack of information
0.158
0.198
0.007
0.576
0.192
0.282
-0.123
0.494
0.582
0.613
0.574
0.477
0.549
0.563
0.102
0.115
0.000
1.007
0.162
0.264
0.048
1
1
1
1
1
1
1
0.750
0.734
0.991
0.316
0.687
0.607
0.826
1.171
1.219
1.007
1.779
1.212
1.326
0.884
Constant -3.9021.22910.07710.002NA
Test X2dfp
Omnibus tests of model coefficients
Hosmer and Lemeshow test
30.902
10.844
10
7
0.001
0.146
Model summary and classification
Pseudo r square statistics 0.224 (Cox and Snell R2)0.306 (Nagelkerke R2)
Overall percentage correct 76.2
Table 8. Likelihood of reporting intention to upcycle with attitude, social factors, and perceived behaviour control (n = 116).
Factor (Number)ItemsβSE βWald’s x2dfpOdds Ratio
Attitude (2/5)Unpleasant–Pleasant
Worthless–Worthwhile
2.869
−0.869
0.985
1.066
8.477
0.664
1
1
0.004
0.415
17.612
0.420
Subjective norm (2/3)Most people who are important to me think that I ought to upcycle0.4330.9610.20410.6521.543
Most people who are important to me expect me to upcycle1.0710.9761.20410.2732.918
Personal norm (2/3)Upcycling reflects my principles about using resources responsibly 0.6190.8690.50610.4771.856
It would be unacceptable to me not to upcycle, especially when used materials are available and would become waste otherwise 1.3510.9452.04410.1533.862
Role beliefs (2/4)Upcycling fits my role in my community 0.8810.9350.88810.3462.413
Upcycling fits my role in my friendship/support networks−0.4190.9490.19510.6590.658
Perceived behaviour control (2/4)For me upcycling would be possible−0.0451.4820.00110.9760.956
Upcycling would be easy for me0.0010.8120.00010.9991.001
Constant −1.2461.4770.71110.3990.288
Test X2dfp
Omnibus tests of model coefficients
Hosmer and Lemeshow test
30.532
3.449
10
7
0.001
0.841
Model summary and classification
Pseudo r square statistics 0.231 (Cox and Snell R2)0.419 (Nagelkerke R2)
Overall percentage correct 89.7
Table 9. Likelihood of reporting frequent upcycling with all variables (n = 117).
Factor (Number)Item βSE βWald’s x2dfpOdds Ratio
Intention (1/3)I intend to upcycle2.1930.8816.19310.0138.966
Facilitating conditions (3/15) A lack of materials
A lack of imagination
A lack of inspiration
0.273
0.768
−0.042
0.508
0.641
0.630
0.289
1.436
0.004
1
1
1
0.591
0.231
0.947
1.314
2.155
0.959
Attitude (1/5) Worthless-Worthwhile0.5280.7260.52910.4671.696
Subjective norm (1/3)Most people who are important to me expect me to upcycle 1.5240.6076.30810.0124.593
Personal norm (1/3) It would be unacceptable to me not to upcycle, especially when used materials are available and would become waste otherwise0.7760.5511.98110.1592.173
Role beliefs (1/4)Upcycling fits my role in my community 0.2510.5430.21410.6441.286
Perceived behaviour control (1/4)Upcycling would be easy for me0.6920.5811.41910.2341.998
Constant −4.0681.12213.13810.000NA
Test X2dfp
Omnibus tests of model coefficients
Hosmer and Lemeshow test
48.682
12.397
9
7
0.000
0.088
Model summary and classification
Pseudo r square statistics 0.340 (Cox and Snell R2)0.464 (Nagelkerke R2)
Overall percentage correct 84.6
Table 10. Group differences based on gender (n = 122).
Factor (Number) ItemsUZSig.rMd
Attitude (2/5)Worthless–Worthwhile1473–2.060.039 **0.19M:6.0
F:6.0
Harmful–Beneficial1479–2.040.042 **0.18M:6.0
F:6.0
Social factors (2/10)Most people who are important to me would approve of me upcycling1461–2.130.033 **0.19M:5.0
F:6.0
I would feel guilty if I was not upcycling, especially when used materials are available and would become waste otherwise1385–2.460.014 **0.22M:4.0
F:5.0
Perceived behaviour control (1/4) It is mostly up to me whether or not I upcycle1407–2.510.012 **0.23M:6.0
F:6.0
Intention (1/3)If I have the opportunity, I will upcycle 1408–2.440.015 **0.22M:5.0
F:6.0
Behaviour (1/1)Frequency of upcycling 1411–2.330.020 **0.21M:5.0
F:5.0
Note: ** p < 0.05 (2-tailed).
Table 11. Group differences based on age (n = 122).
Factor (Number) ItemsX2Sig.Md
Gp1Gp2Gp3
Attitude (4/5)Unpleasant−Pleasant
Bad−Good
Worthless−Worthwhile
Unenjoyable−Enjoyable
10.66
11.18
16.32
6.40
0.005 **
0.004 **
0.000 **
0.041 **
6.0
6.0
5.0
6.0
6.0
7.0
7.0
6.0
6.0
6.0
6.0
6.0
Social factors (2/10)It would be unacceptable to me not to upcycle, especially when used materials are available and would become waste otherwise7.190.027 **4.05.05.0
Upcycling fits my role in my community6.630.036 **4.05.05.0
Perceived behaviour control (1/4)Upcycling would be easy for me 8.610.013 **5.05.05.0
Intention (3/3)My likelihood of upcycling is high
If I have the opportunity, I will upcycle
I intend to upcycle
7.25
6.80
7.47
0.027 **
0.033 **
0.024 **
5.0
5.0
5.0
6.0
6.0
6.0
6.0
6.0
6.0
Behaviour (1/1)Frequency of upcycling 11.370.003 **4.05.05.0
Note: ** p < 0.05 (2-tailed).
Table 12. Group differences based on occupational area groups (n = 122).
Factor (Number)ItemsX2Sig.Md
Gp1Gp2Gp3Gp4Gp5
Attitude (4/5)Unpleasant−Pleasant
Bad−Good
Worthless−Worthwhile
Unenjoyable−Enjoyable
12.27
11.65
17.83
10.36
0.015 **
0.020 **
0.001 **
0.035 **
6.0
6.0
6.0
6.0
6.0
7.0
7.0
6.0
5.0
5.0
5.0
6.0
6.0
6.0
6.0
6.0
6.0
6.0
6.0
6.0
Social factors (6/10)Most people who are important to me think that I ought to upcycle 1.230.037 **4.05.03.54.04.0
I would feel guilty if I was not upcycling, especially when used materials are available and would become waste otherwise13.880.008 **4.55.03.55.05.0
It would be unacceptable to me not to upcycle, especially when used materials are available and would become waste otherwise11.690.020 **5.05.04.55.55.0
Upcycling fits my role in my workplace 25.310.000 **3.06.04.04.04.0
Upcycling fits my role in my family 15.380.004 **5.06.04.56.04.0
Upcycling fits my role in my community 10.140.038 **5.06.04.06.05.0
Intention (3/3)My likelihood of upcycling is high13.180.010 **6.06.05.06.06.0
If I have the opportunity, I will upcycle 13.410.009 **6.06.05.06.06.0
I intend to upcycle 12.770.012 **6.06.05.56.06.0
Behaviour (1/1)Frequency of upcycling 13.570.009 **5.06.04.05.54.0
Note: ** p < 0.05 (2-tailed).
Table 13. Group differences based on employment status (n = 122).
Factor (Number)ItemsX2Sig.Md
Gp1Gp2Gp3
Social factors (5/10)Most people who are important to me would approve of me upcycling8.820.012 **6.06.05.0
I would feel guilty if I was not upcycling, especially when used materials are available and would become waste otherwise10.120.006 **4.05.04.5
Upcycling reflects my principles about using resources responsibly8.590.014 **6.06.05.0
It would be unacceptable to me not to upcycle, especially when used materials are available and would become waste otherwise6.860.032 **5.05.05.0
Upcycling fits my role in my workplace6.570.037 **4.05.04.0
Perceived behaviour control (1/4)Upcycling would be easy for me 6.010.049 **5.06.95.0
Intention (3/3)My likelihood of upcycling is high
If I have the opportunity, I will upcycle
I intend to upcycle
7.01
14.29
16.57
0.030 **
0.001 **
0.000 **
6.0
6.0
6.0
6.0
6.0
7.0
5.0
5.0
5.0
Behaviour (1/1)Frequency of upcycling 8.240.016 **5.06.05.0
Note: ** p < 0.05 (2-tailed).

