Article

36th Cordoba Guitar Festival: Spectator Analysis Using Structural Equation Modelling (SEM)

by
Juan V. Fruet-Cardozo
1,*,
Jesús C. Pérez-Gálvez
1,
Carol Jara-Alba
2 and
Gema Gómez-Casero
1
1
Applied Economics, University of Cordoba, Puerta Nueva s/n, 14071 Cordoba, Spain
2
Department of Research, Casa Grande University, Guayaquil 090613, Ecuador
*
Author to whom correspondence should be addressed.
Sustainability 2019, 11(3), 826; https://doi.org/10.3390/su11030826
Submission received: 2 December 2018 / Revised: 28 January 2019 / Accepted: 31 January 2019 / Published: 5 February 2019
(This article belongs to the Section Tourism, Culture, and Heritage)

Abstract

:
The Cordoba Guitar Festival is one of the most important cultural events in Spain. This article analyses the musical preferences, satisfaction, attitudinal loyalty, and behavioural loyalty of spectators who attended the 36th festival held in July 2016, as well as the festival’s economic impact on the city. These characteristics of the public give rise to the four hypotheses of this study. To achieve this aim, a structural equation model (SEM) was used. The results −χ2 = 27.79, with the p-value found to be p = P (χ2 ≥ 27.79) = 0.224—show the goodness-of-fit of the model and indicate that the observed data do fit the expected dataset. The results therefore allow us to accept the proposed hypotheses concerning the influence of different latent factors, such as musical preferences, loyalty, and satisfaction with the festival. This is the main focus with which the present study has been written. Regarding the economic impact, the Festival raised 1.2 million euros, that is, slightly more than 73,000 euros per day. The amount, although not very high, is important as additional income for the city. The conclusions show the need to consider the preferences of the spectator as an essential tool to enable the continuation and longevity of the Cordoba Guitar Festival—an important cultural destination.

1. Introduction

1.1. Overview

The guitar is one of the most popular instruments in the world of music. Since the 1980s, it has been the leitmotiv of the Cordoba Guitar Festival, among the most important cultural events in Spain. The festival’s title alone combines two awe-inspiring concepts: The guitar—the instrument par excellence of Spanish music—and Cordoba, a World Heritage site and host to the event.
According to Horng, So, and Su [1], festivals are tourism-motivating events and pillars that support the development and consolidation of tourist destinations. As Fonseca and Ramos [2] have shown, these events are a place of encounter, socialisation, and where unique experiences can be enjoyed. These same authors argue that festivals are associated with cultural identities, lifestyles, and consumption habits and, therefore, each musical genre is identified with a type of subculture. In this line, Horng, So and Su [1] affirm that it is important to determine the impact of such events for cities, the motivations of the attendees, the segmentation of the spectators, and their levels of satisfaction. This paper is inspired in this last aspect, albeit obviously, with its own approach.
The festival offers two complementary schemes: (i) A concert programme where world-class guitarists are invited to perform; and (ii) a programme of training courses led by teachers of different musical guitar styles. Over 20,000 spectators have attended the concerts in recent festival editions, while over 150 people have attended the training courses, most of them foreigners.
The main objective of this paper is to contribute to the scientific literature related to festivals as elements of cultural and tourist development. In this regard, the most relevant sociodemographic characteristics of the attending public are presented, focusing especially on their motivations, expectations, and level of satisfaction with the concerts and courses offered. To this end, this article analyses the responses of the spectators on the different activities and events during the 10 days of the festival following Abreu-Novais and Arcodia [
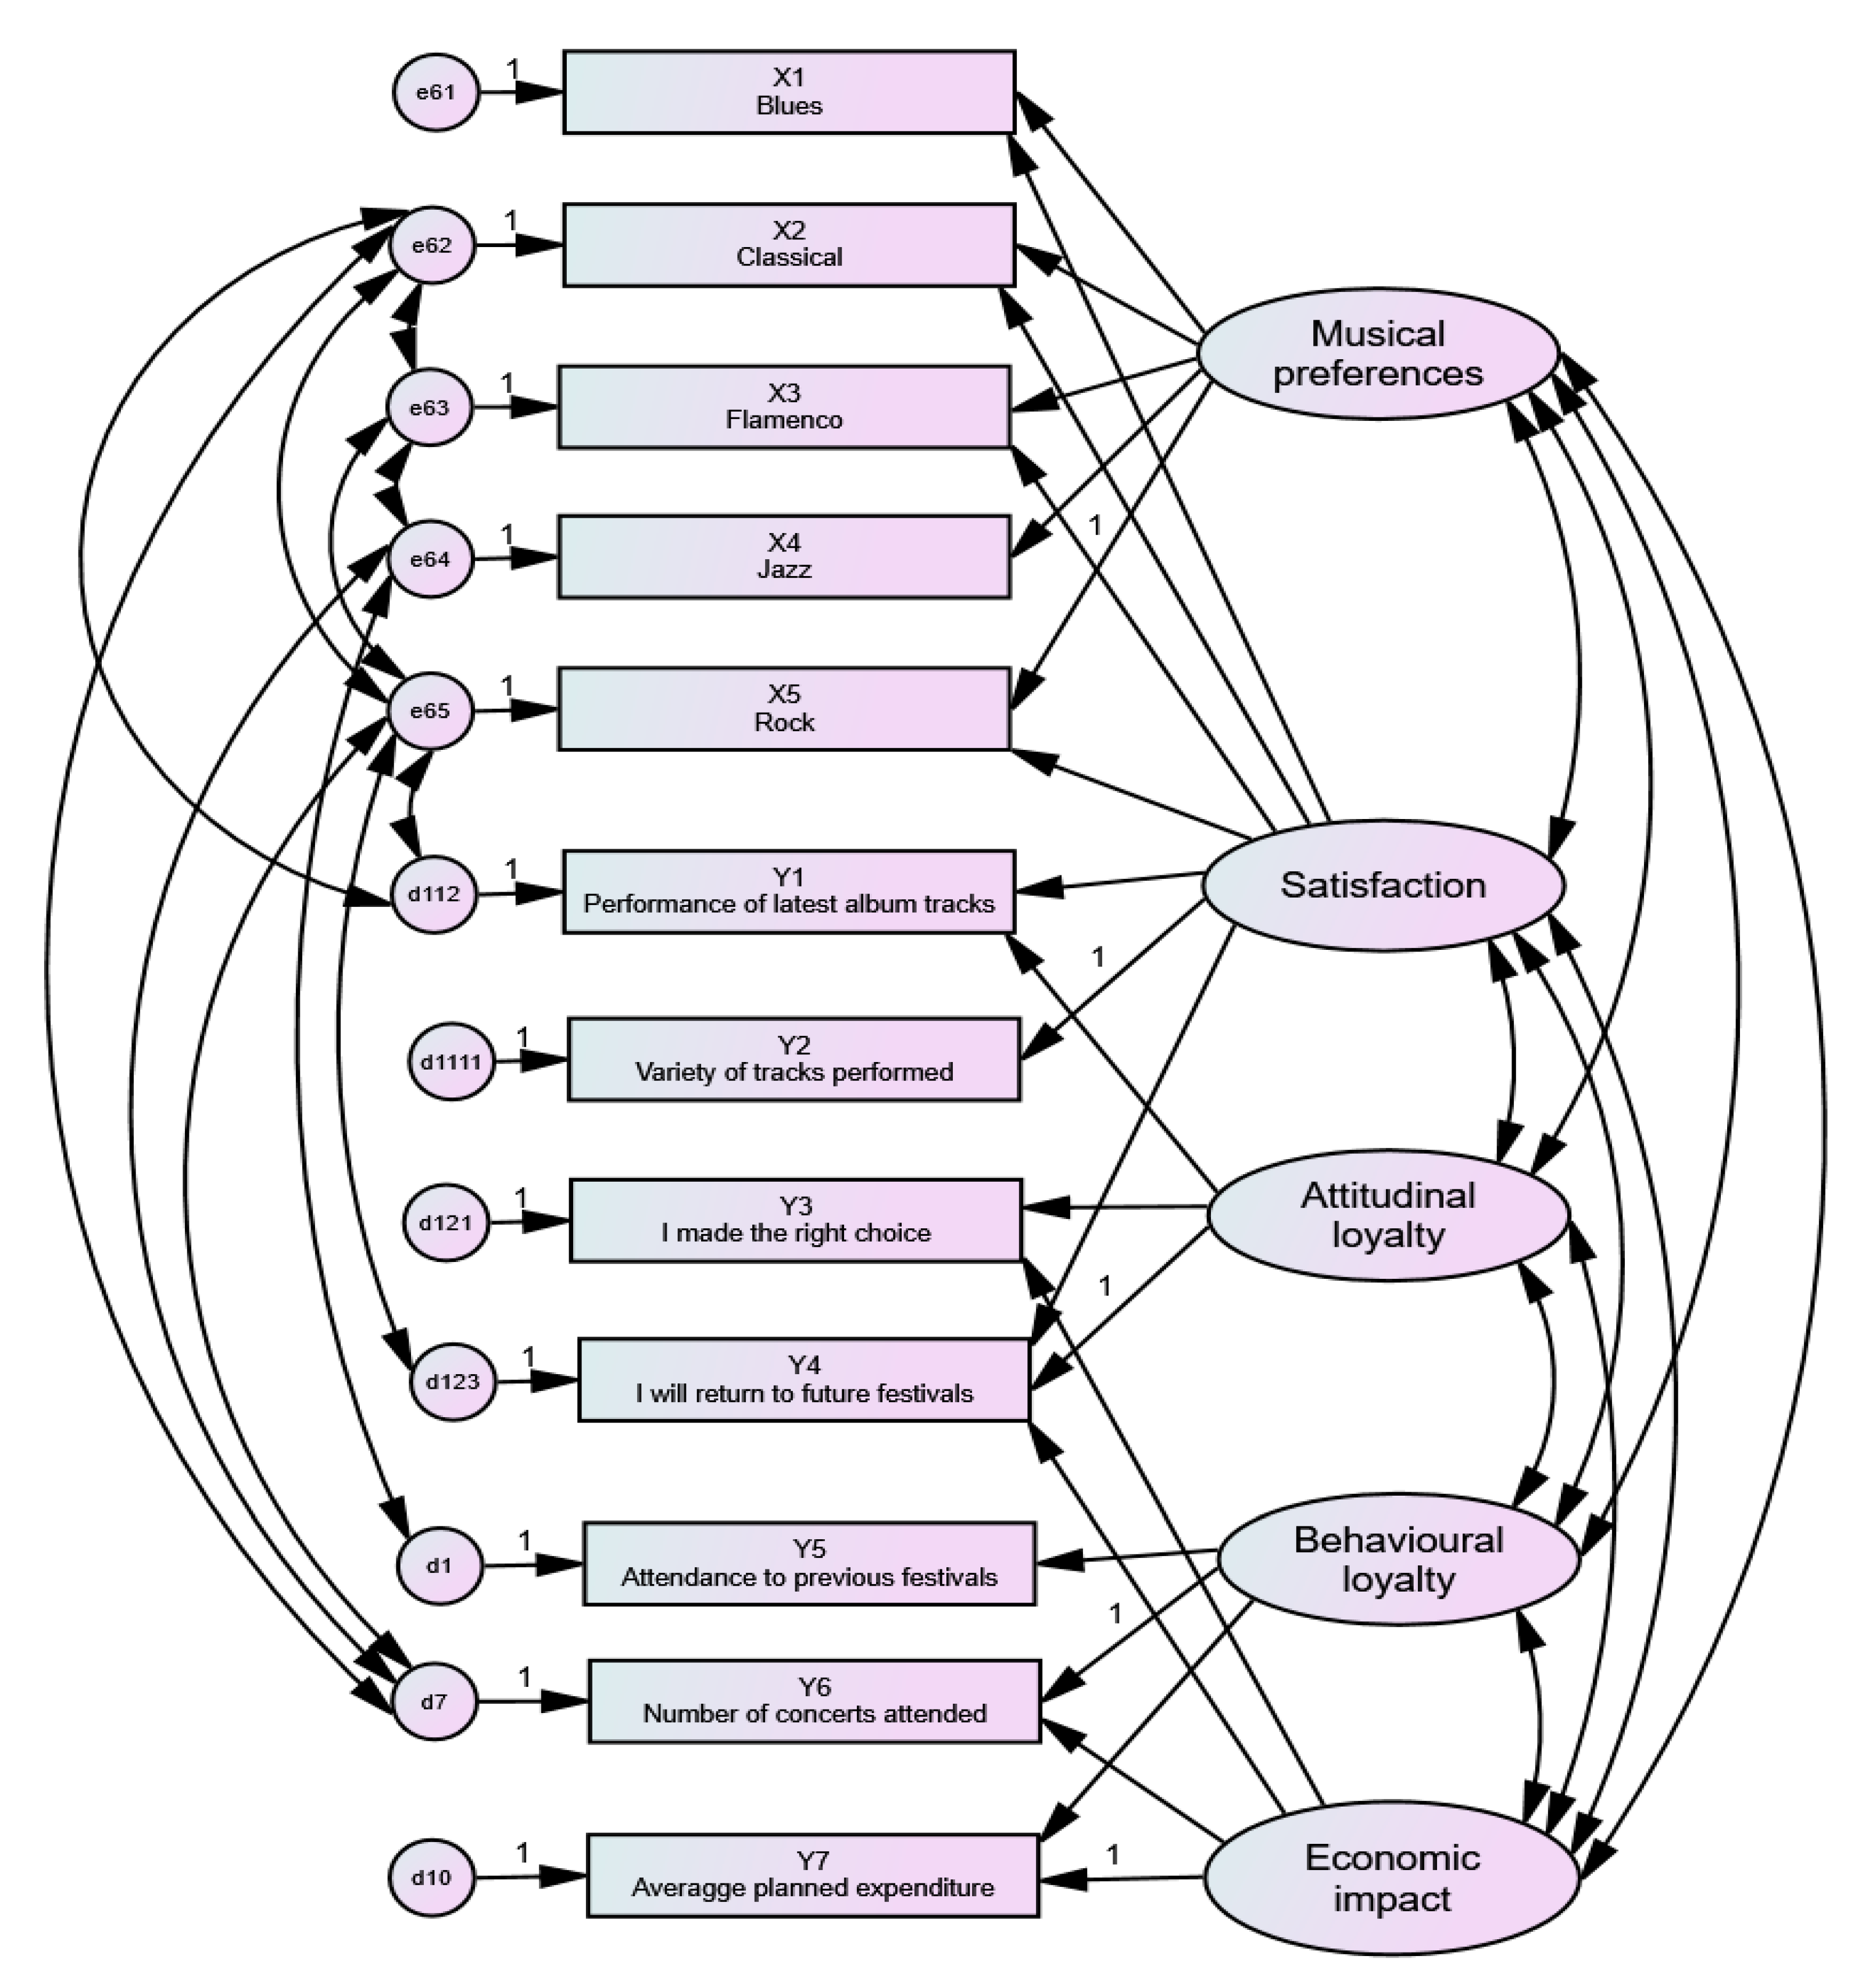
3]. The data were collected by means of a questionnaire administered to spectators attending the 36th festival held in July 2016, and the results were analysed using a structural equation model (SEM), whose main feature is the use of latent and observed variables. The latent variables include musical preferences, satisfaction, attitudinal loyalty, behavioural loyalty, and to a lesser degree of importance, the economic impact on the city.

1.2. Literature Review

As Bowen and Daniels [4] have shown, music festivals are unique, special events that attract spectators for a variety of reasons. According to Saayman and Saayman [5], musical events, in the same way as art festivals, are able to offer spectators a musical genre, for example, classical music, or a combination of several genres. Many authors have studied music festivals, among them Abreu-Novais and Arcodia [3], Formica and Uysal [6], Brown and Knox [7], Li and Lin [8], Kruger and Saayman [9], Pérez-Gálvez et al. [10], Kruger and Saayman [11], and Kruger and Saayman [12].
The consumption of different musical categories is influenced by sociodemographic factors and motivations and the fact that different musical genres have different target audiences [13]. Music festivals have the potential to create benefits beyond the festival itself or the host destination, in particular by encouraging the appreciation of a musical genre, increasing the purchase of musical products, and promoting musical tourism, according to Kruger and Saayman [9,12]. Likewise, Wróblewski et al. [14,15], and Getz and Page [16] studied the sustainable management of cultural events, a relatively new field in the economy of culture.
This section presents a review of the SEM literature that has supported this research. Elosua [17] proposed a model in the framework of SEM to assess preferences among quality of life dimensions for the elderly. Likewise, the recent work of Caridad and Ocerín [18] provides clear examples of SEM using AMOS. As regards the classical literature on this topic, Bagozzi and Heatherton [19] proposed a framework for representing personality constructs at four levels of abstraction using latent variables. Browne and Cudeck [20] considered two types of error involved in fitting a model: The error of approximation and overall error. According to Bentler [21], normed—coefficient yield new normed (CFI)—and non-normed fit indexes (FI) are frequently used as adjuncts to chi-square statistics for evaluating the fit of a structural model. Moreover, Bollen [22] provided a comprehensive and more advanced treatment of structural equations with latent variables.
Several researchers have used statistical methods such as SEM to examine the relationships between spectator motivation and satisfaction as well as future behavioural loyalty, among them Zins [23], Gallarza and Gil Saura [24], Lee and Hsu [25], Sun et al. [26], Li and Lin [8], Prebensen et al. [27], and Kruger and Saayman [12].
As Kruger and Saayman [12] have argued, it is important to market the festival properly because visitors’ motives are strongly related to their behavioural intentions. Prebensen et al. [28] used a SEM approach and found that motivation and participation are linked to the perceived value of the tourist experience, and that motivation affects the level of participation. This supports the hypothesis that motivation has a positive effect on the perceived value of the destination experience. This same hypothesis is also supported by the study of [27] using SEM.
Mason and Paggiaro [29] analysed the importance of festivals in determining emotions, satisfaction, and future behaviour of participants in gastronomic events. The authors used SEM with latent variables to survey the responses of attendees to the Italian festival Friuli DOC.
Several studies have analysed loyalty using SEM, such as Chen and Chen [30]. Munusturalar et al. [31] suggested that future research could use SEM to determine the relationships between scales, including festival experience, festival loyalty, and festival benefits. Chen and Chen [30] used SEM to examine tourists’ experience of heritage tourism. The authors showed that the quality of the experience has a direct effect on perceived value and satisfaction, which supports the hypothesis that an increase in tourists’ perceived value increases behavioural intentions (increased loyalty). This hypothesis is also supported by Tam [32], who found that perceived value affects behavioural intentions both directly and indirectly. Sirakaya-Turk et al. [33] examined the relationship between hedonic and utilitarian values and tourists’ overall shopping experience satisfaction and destination loyalty. The authors tested hypotheses on the hedonic value of word-of-mouth purchasing and the utilitarian value of word-of-mouth purchasing and found that the first hypothesis is supported but that the second is not significant.
Other studies using SEM, such as Zins [23], Gallarza and Gil Saura [24], and Prebensen et al. [27], do not directly relate perceived value to loyalty but through satisfaction, finding support for both hypotheses (perceived value–satisfaction and satisfaction–loyalty). Although these studies do not report the indirect effects, satisfaction is very likely a mediating variable between perceived value and loyalty. Lastly, the study of Sun et al. [26] using SEM does not support the hypothesis that higher perceived value leads to increased spectator loyalty.
The structural models developed in the study of Li and Lin [8] establish that the values of the visitors to a musical festival have a positive effect on visitor satisfaction and loyalty, and that satisfaction also influences loyalty. It has also been found that the most significant value in satisfaction is functional value, while in loyalty, it is emotional value. Finally, according to Kruger and Saayman [9], the importance of analysing music festivals lies in the fact that events could have far-reaching benefits which can contribute to their legacy.
In accordance with the review of the literature, the following hypotheses have been formulated:
H1. 
Individual musical preferences influence spectator festival experience.
The study of musical preferences provides an indicator of the importance that the public gives to the programmed concerts. In this sense, there is a first dimension, which can be called electroacoustic, by revealing preferences towards concerts featuring electric guitars and/or electroacoustic guitars. A second dimension shows greater preferences towards Spanish guitar concerts. Thus, the presence of both dimensions makes it possible to test if the spectators attending the festival have different musical tastes or preferences in relation to the guitar as a musical instrument. Moreover, each segment of spectators is generally considered as a group that has the same interests, identical motivations, similar perspectives, and similar sociodemographic characteristics. Kruger [34] defines market segmentation as the process of subdividing into smaller groups with homogeneous characteristics or behaviours. To this end, the author identifies different variables that can be used in the segmentation process. According to Saayman and Saayman [13], market segmentation is important because visitors have different needs, motives, or lifestyles.
H2. 
Spectator festival experience is measured by level of satisfaction.
Crompton and McKay [35] point out three reasons for analysing spectators’ motives for attending festivals: (i) Motives are a key element in designing and offering products to the visitors, since different visitors need and want different things; therefore, if we correctly identify the motives, the festival will be a success; (ii) motives are closely related to satisfaction, and satisfaction affects repetition (loyalty); and (iii) the identification of motivations is a key element to understand spectators’ decision processes. Uysal et al. [36] and Yolal et al. [37] allude to five different motives: Escape, excitement/thrills, event novelty, socialisation, and family togetherness.
H3. 
Level of satisfaction affects loyalty. Two variables related to loyalty were analysed: Attitudinal loyalty, which measures the probability of recommending the festival, and behavioural loyalty, which measures the number of festivals and concerts attended.
Spectator satisfaction with the festival can be a key element to determine future behaviour (loyalty) towards that festival (Kim et al. [38]). Spectators report high satisfaction with their experience in the festival, with attendance to the musical preferences of the public being the most important aspect. The results reveal that spectators’ perception of the festival differs significantly and is much more positive among those with more heterogeneous preferences.
The analysis of satisfaction is of interest due to its relationship with other related concepts, such as loyalty. Loyalty can be defined as the public’s commitment to the festival and is manifested through their intention to revisit the festival in the future and recommend it if someone asks for advice (attitudinal loyalty). The results for reported satisfaction show a high degree of loyalty to the festival as a cultural destination. This finding is in line with the rate of repetition to the festival, as seven out of ten respondents had already attended festivals in the past. On the other hand, the level of loyalty is higher among spectators whose musical preferences are more heterogeneous. The existing differences show evidence of satisfaction as an essential requirement to improve the positioning of the festival as a cultural product. This information is useful for the growth of the festival as a cultural destination and as a source of activity and income generation.
H4. 
The level of economic impact of the festival is influenced by spectators’ musical preferences.
The null hypothesis (H0), corresponding to the four hypotheses, is that the influence of musical preferences is not detected, and furthermore the alternative hypotheses are contrary to the previous ones, that is, they do not have effect on each other. The alternative hypotheses, in each of the four cases, are precisely H1, H2, H3, and H4. Taking this into account, when obtaining a model in which these hypotheses are related to the observed variables, the influences foreseen in these four hypotheses are accepted. Thus, the musical preferences influence the experience of the festival and its economic impact, and the level of satisfaction determines the overall experience of the festival and its economic impact.
To test the hypotheses, SEM was used; a statistical tool which has become increasingly popular among social science researchers. The model enables investigating a set of relationships among one or more continuous or discrete independent variables and developing a way of breaking down the observed correlations into a system of equations that describe the hypotheses concerning causal relationships. According to Batista-Foguet and Coenders [39], the aim of SEM is to study the causal relationships among directly observable data under the assumption that the relationships are linear.

2. Materials and Methods

2.1. Sample

The research is based on field work in which a questionnaire was administered to a representative sample of spectators. From an initial survey, and after successive refinements, a pretest was conducted with an initial sample of characteristics similar to the final sample until arriving at the definitive format. The survey used in this research was based on Yolal et al. [37], Fonseca and Ramos [2], Saayman and Saayman [13], and Kruger and Saayman [40] and included questions on music as a cultural product. The survey was distributed in two languages, Spanish and English.
The survey was structured into four large blocks. The first collected the characteristics of the visit and information on attendance to previous festivals. The second block focussed on the analysis of the preferences or tastes in relation to the musical genre of the programmed concerts and the motives for attending the festival. The third block collected information on perceived satisfaction and future expectations. Finally, the last block collected the sociodemographic characteristics of the spectators, such as age, gender, and educational level. The survey included yes/no, open, and closed questions and responses, which were measured on a 5-point Likert scale (1 = not very important; 5 = very important).
The surveys were conducted by a team of data collectors from the University of Cordoba. The surveys were administered in different areas of the city where the music shows were being held and at the end of each of the concerts. A nonprobabilistic sampling technique was used, which is widely used in this type of research, where the sample is available to be surveyed in a certain place and time, as recommended by Finn et al. [41]. It was not stratified by gender, age, training, nationality, or any other variable, as no previous studies are available to support this stratification. Therefore, the selection procedure was spectators that were available and willing to respond to the survey. The rejection rate was low and insignificant for all variables. A total of 612 valid surveys, from a total of 631, were completed at the different concerts held between 1st and 16th July 2016.
The specific framework of our study is restricted to spectators attending a cultural event such as the Cordoba Guitar Festival. According to the information provided by the Municipal Performing Arts Institute (IMAE, acronym in Spanish), the organisation in charge of managing the festival, 24,236 spectators attended the 2015 edition. Using this figure as the population of reference, the sampling error for a 95% confidence level is ± 3.91%.

2.2. Amos Diagram

The concepts specified in the previous section are included in the path diagram of the model shown in Figure 1. SPSS v23 and AMOS software were used to draw the diagram. Likewise, the survey mentioned in the same section is contained in an SPSS v23 file (see details in Supplementary Materials). AMOS was used to specify, estimate, assess, and present the model in a path diagram to show the hypothetical relationships among the variables.
The latent variables, also known as unobserved or hidden variables, are represented by five ellipses: (i) Musical preferences; (ii) Satisfaction; (iii) Attitudinal loyalty; (iv) Behavioural loyalty; and (v) Economic impact. All the latent variables are related through covariance. Likewise, each latent variable is linked to its corresponding observed variables, which can be measured and are represented by rectangles. They are classified into exogenous (X) and endogenous (Y) variables as follows:
-
Exogenous variables (X). In multiple regression, exogenous variables are known as independent variables, that is, they influence but are not influenced by other variables. In the model, they are represented by X1 Blues; X2 Classical; X3 Flamenco; X4 Jazz; and X5 Rock.
-
Endogenous variables (Y). These variables are called dependent variables in multiple regression. In the model they are represented by Y1 Performance of latest album tracks; Y2 Variety of tracks performed; Y3 I made the right choice; Y4 I will return to future festivals; Y5 Attendance to previous festivals; Y6 Number of concerts attended; and Y7 Average planned expenditure.
In turn, each exogenous and endogenous variable has an associated error variable (e) and (d), respectively. The relationships among the variables (arrows representing the connections pertaining to regressions and correlations) are described in more detail below. The respective weights and coefficients are presented in Table 1, Table 2 and Table 3.
The first column of Table 1 shows the question numbers of the survey included in the SPSS database. Thus, for example, Q65 refers to question number 6, item 5, “Rock”; Q64 refers to question 6, item 4 “Jazz”, and so on.
As regards Figure 1, it should be noted that:
-
The first latent variable, Musical preferences, is related to the observed variables that represent the five musical genres at the festival: Blues, Classical, Flamenco, Jazz, and Rock.
-
The second latent variable, Satisfaction, is related to the observed variables Rock, Performance of latest album tracks, Variety of tracks performed, and I will return to future festivals.
-
The third latent variable, Attitudinal loyalty, is related to the observed variables Performance of latest album tracks, I made the right choice, and I will return to future festivals.
-
The fourth latent variable, Behavioural loyalty is related to the observed variables Attendance to previous festivals, Number of concerts attended, and Average planned expenditure.
-
The fifth latent variable, Economic impact, is related to the observed variables I made the right choice, I will return to future festivals, Number of concerts attended, and Average planned expenditure.
Regarding the error variables (which capture the variance not considered in the model), it can be seen that the observed variables X1 Blues and Y7 Average planned expenditure do not have covariance relationships with the other error variables. That is, if they were related to another musical style error variable or to another endogenous variable, the fit would improve slightly but would overload the design of the model and make it more difficult to interpret.

3. Results

3.1. Sociodemographic Characteristics of the Sample

The public interviewed is, in global terms, young. In fact, around 70% are less than 50 years old, with significant differences being detected according to musical preferences (Snedecor’s F coefficient, ANOVA = 5253, p = 0.005). These differences are detected between the rock audience and the public with greater preference towards the classical guitar, since the average age of the former is significantly lower and the latter, higher. The academic level is high, since 72.5% of respondents declare to be a graduate or postgraduate university student. The analysis by musical preferences enables the detection of significant differences (Snedecor’s F coefficient, ANOVA = 3322, p = 0.037) between the public rocker and public with high preferences towards all the different genres of the guitar (music lover audience). The rocker public is not only the youngest group but also has a corresponding lower academic level: 64.2% declare university studies, compared to 79.4% of the music-loving public. The differences allow us to equate a higher level of academic formation with more heterogeneous preferences or musical tastes related to the guitar.
As expected, the question about the monthly level of family income was the most distrusted by the respondents. A total of 78 spectators, of the 612 interviewed, did not answer, despite the amplitude of intervals proposed in the survey. However, it has been possible to deduce that the attendants of the Guitar Festival are identified as being a public with a medium-high purchasing power. Of the public that answered, 30.9% declare having an income of less than 1000 euros per month, compared to 44.9% who claim to earn more than 1500 euros. There are no significant disparities regarding musical preferences (Snedecor’s F coefficient, ANOVA = 0.081, p = 0.992).
Regarding the place of origin of the festival attendees, the local audience represents 61.2% of the total. Among the nonlocal public, 30.3% are national and the remaining 8.5% are foreigners. Among the national nonlocal public, five provinces of origin stand out above the rest (Jaen, Seville, Madrid, Malaga, and Granada) and represent 54% of the total nonlocal national category which attended the Festival. In relation to the foreign public, the presence of North American, English, and Brazilian spectators stands out.

3.2. Goodness-of-Fit

All the variables were estimated using maximum likelihood estimation (MLE), which is the most common method used to fit SEM as it provides consistent, efficient, and unbiased estimates for smaller samples. MLE requires normally distributed variables, although failure to meet the multivariate normality condition does not affect the method’s ability to estimate unbiased model parameters. MLE is able to facilitate the convergence of estimates even in the absence of normality. The results obtained were correct; therefore, the model conforms to the baseline assumptions.
Following Browne and Cudeck [20], the main results of the study are presented below: Chi-square (CMIN), probability (p), the minimum fit measure (FMIN), comparative fit index (CFI), and root mean squared error of approximation (RMSEA).

3.3. Measures Based on Covariances: CMIN, FMIN, RMSEA, and CFI

3.3.1. Chi-Square (χ2)

The chi-square (χ2) goodness-of-fit test is one of the most widely used nonparametric tests to determine the discrepancy between an observed dataset and an expected dataset. This test and its limiting probability (p) is the only goodness-of-fit test associated with significance testing; the other measures and indices are merely descriptive.
The goodness-of fit-test indicates that the proposed model is acceptable, since the likelihood ratio statistic is χ2 = 27.79. Moreover, the model has 55 estimable and identified parameters, while the covariance structure includes 78 distinct sample moments, the p-value is 0.224, and, thus, the proposed model is clearly adequate. That is to say: p = P[χ2 ≥ 27.79] = 0.224, which is higher than any reasonable level of significance (α = 0.05, 0.10, even 0.20), and the null hypothesis is clearly accepted, thus validating the proposed model.

3.3.2. FMIN

The FMIN index is used to measure a model’s fit. FMIN is the minimum value of the discrepancy function F, which is obtained by fitting the model to population moments rather than sample moments. The minimum value of the discrepancy (0.045) indicates a good fit.

3.3.3. RMSEA

RMSEA is an index based on the model covariance that can also be interpreted as the mean approximation error per degree of freedom. According to Browne and Cudeck [20], values below 0.05 indicate a good fit of the model. Therefore, our result of 0.018 also indicates a good fit.

3.3.4. CFI

CFI compares the discrepancy between the covariance matrix predicted by the model and the observed covariance matrix to the discrepancy between the zero model covariance matrix and the observed covariance matrix in order to assess the degree of loss that occurs when the model is changed to the zero model. The values of this index range from 0 to 1. According to Bentler [21], the CFI value should be greater than 0.90, which indicates that at least 90% of the data covariance can be reproduced by the model. Therefore, our result of 0.996 is excellent.

3.3.5. Weights and Coefficients of Regressions, Variances, and Covariances

It should be mentioned that, in general, the results for the regressions (Table 1), the coefficients of variances (Table 2), and the covariances (Table 3) also indicate the goodness-of-fit of the model to the observed data.

4. Discussion and Conclusions

After 36 editions, the Cordoba Guitar Festival, which is held at the beginning of summer for around 10 days, has become a national benchmark in the world of culture due to the fact that (i) it revolves around the guitar, the Spanish musical instrument par excellence, (ii) it offers a diversity of musical styles, and (iii) it creates a very special atmosphere which envelops the city and is particularly suited to catering to spectators.
The many musical styles on offer at the festival are gradually becoming a reference point for research; not only in its facet as a music or cultural festival, but also in the many facets that characterise the spectators who attend the concerts.
In this paper, we formulated four hypotheses concerning the spectators who attend the festival that are supported by the fit of the SEM statistical tool. The estimated model and the p-value provide the goodness-of-fit of the overall test to determine if the data is congruent with this proposed model. The optimal value of the likelihood ratio statistic is zero, meaning that the covariance structure between the variables fit the data perfectly. The null hypothesis, H0, indicates that the proposed model is adequate (which is our objective: To propose a model congruent with the observational data), while the alternative hypothesis leads us to reject this model. The asymptotic sampling distribution in our test is χ2 (with 23 degrees of freedom), as there are 78 distinct sample moments and 55 model parameters. The model is identified, and the chi-square statistic is G2 = 27.79; thus, the p-value is p = P (χ2 ≥ 27.79) = 0.224, greater than any reasonable level of significance (α = 0.05, 0.10, and even 0.20). Therefore, the null hypothesis is clearly accepted, and the proposed model is validated.
As regards hypotheses H1: Individual musical preferences influence spectator festival experience, H2: Spectator festival experience is measured by level of satisfaction, and H3: Level of satisfaction influences loyalty, the table of frequencies presented in Table 4, Table 5, Table 6, Table 7 and Table 8 confirms that the most preferred musical genre was Rock (40.8%), followed by Classical (35.6%), Jazz (33%), Flamenco (32.4%), and Blues (29.1%).
These findings are corroborated in Figure 1 and Table 4, where it can be seen that the error variable e65 Rock has five covariances. Specifically, covariance is found for e62 Classical with a value of −0.411, e63 Flamenco with a value of −0.204, d112 Performance of latest album tracks with a value of 0.218, d123 Attitudinal loyalty with a value of 0.106, and d7 Number of concerts attended with a value of −0.124. The first three values show significant dependence and minor standard error (between 0.074 and 0.071).
The fourth hypothesis, H4: The level of economic impact of the festival is influenced by spectators’ musical preferences, is the only hypothesis that is not fully supported. Thus, for example, although the result of the covariance between the latent variables Economic impact and Musical preferences indicates a direct dependence of 0.082, this value is not sufficiently consistent with the expected dependence. However, the covariance of 2.617 between Economic impact and Attitudinal loyalty mitigates the result of the previous covariance. The reason for this eventual weakness in the correlation of the fourth hypothesis with the others might be due to the formulation of the survey questions. In this regard, the questions focused on the spectators’ individual direct expenditure for the concert and accommodation, and in a very global way, on indirect expenses such as transport, drinks, food, souvenirs, etc. In strict monetary terms, the planned average cost of attending a concert amounted to 33.6 euros, and there are no significant differences when related to the musical preferences of the audience. However, the results do not allow us to determine if the more heterogeneous the tastes or musical preferences of the public, the greater the economic impact of the festival.
Considering the number of spectators attending the Festival in the edition when the research was carried out (25,635 people attended the 2016 edition, according to data provided by the Municipal Performing Arts Institute) and the expense of the spectator per concert, an approximation can be calculated of the economic impact derived from the 36th edition of the Córdoba Guitar Festival. The economic impact amounts to 1.2 million euros, that is, slightly more than 73,000 euros per day. These revenues have an impact on the local economy through the payment of salary, the purchase of goods and services, and also by increasing the demand in other areas of economic activity, such as hotel trade, commerce, transport, and leisure. Taking this into consideration, it can be concluded that the Festival has a positive impact on the economic activity of the city of Córdoba.
In reference to the Cordoba Guitar Festival, three management implications can be derived from this study. Firstly, greater promotion and dissemination are needed to increase the festival’s cultural attractiveness both nationally and internationally. Secondly, the audience’s search for new musical experiences implies that, without renouncing its essence, concerts related to other guitar musical genres (for example, tango, rancheras or gruperas), as well as instruments belonging to the guitar family (such as the requinto, the charango or the guitarrón) should be included in the programming. Thirdly, it is important to enhance the festival’s good image as a cultural event by improving the complementary services offered at concerts (bars and vending machines, among others) and increasing the visibility of information and signalling points for viewers.
Lastly, we would like to highlight two aspects. First, the results of this study indicate a good fit of the model. Second, given that the Cordoba Guitar Festival is a major cultural event, we believe it is important to continue research on the festival as a cultural benchmark, as well on the spectators who attend the event. In this sense, according to Wróblewski et al. [15], the issues currently studied by cultural management [15], in which both public- and private-sector institutions must be involved, should be considered. Moreover, a study on the festival’s visibility, especially at an international level, would offer an important contribution.

Supplementary Materials

SPSS v23 file is available online at https://www.mdpi.com/2071-1050/11/3/826/s1.

Author Contributions

J.V.F.-C. designed the research and the SEM model, drafted the manuscript, and edited the final version. J.C.P.-G. designed the research, administered the survey, contributed to the Results and Discussion sections, and revised the manuscript. C.J.-A. and G.G.-C. contributed to the literature review and revised the manuscript. All authors discussed the research, jointly revised the paper, and have read and approved the final manuscript.

Acknowledgments

The authors of this article want to thank the collaboration of the Municipal Institute of Performing Arts of Córdoba (IMAE, acronym in Spanish) for its help in carrying out this research.

Conflicts of Interest

The authors declare no conflict of interest.

References

  1. Horng, J.-S.; So, A.; Su, C.-S. Segmenting food festival visitors: Applying the theory of planned behavior and lifestyle. J. Conv. Event Tour. 2013, 14, 193–216. [Google Scholar] [CrossRef]
  2. Fonseca, J.R.; Ramos, R. Segmenting and profiling the portuguese festival-goers through the most ancient form of music retailing: The music festivals. J. Conv. Event Tour. 2014, 15, 271–297. [Google Scholar] [CrossRef]
  3. Abreu-Novais, M.; Arcodia, C. Music festival motivators for attendance: Developing an agenda for research. Int. J. Event Manag. Res. 2013, 8, 34–48. [Google Scholar]
  4. Bowen, H.E.; Daniels, M.J. Does music matter? Motivations for attending a music festival. Even Manag. 2005, 9, 155–164. [Google Scholar] [CrossRef]
  5. Saayman, M.; Saayman, A. The economic impact of the Comrades Marathon. J. Event Festiv. Manag. 2012, 3, 220–235. [Google Scholar] [CrossRef]
  6. Formica, S.; Uysal, M. A Market Segmentation of Festival Visitors: Umbria Jazz Festival in Italy. Festiv. Manag. Event Tour. 1996, 3, 175–182. [Google Scholar] [CrossRef]
  7. Brown, S.C.; Knox, D. Why go to pop concerts? The motivations behind live music attendance. Musicae Sci. 2016, 21, 233–249. [Google Scholar] [CrossRef]
  8. Li, C.-J.; Lin, S.-Y. The service satisfaction of jazz festivals in structural equation modelling under conditions of value and loyalty. J. Conv. Event Tour. 2016, 17, 266–293. [Google Scholar] [CrossRef]
  9. Kruger, M.; Saayman, M. Segmenting beyond behavioural intentions: Fine tuning music festival visitors’ music appreciation. Int. J. Event Festiv. Manag. 2017, 8, 204–223. [Google Scholar] [CrossRef]
  10. Pérez-Gálvez, J.C.; López-Guzmán, T.; Gómez-Casero, G.; Fruet-Cardozo, J.V. Segmentation of the spectators attending a festival based on musical preferences. Int. J. Event Festiv. Manag. 2017, 8, 346–360. [Google Scholar] [CrossRef]
  11. Kruger, M.; Saayman, M. First-time versus repeat visitors to a music festival in South Africa. J. Conv. Event Tour. 2018, 19, 219–247. [Google Scholar] [CrossRef]
  12. Kruger, M.; Saayman, M. All that jazz: The relationship between music festival visitors’ motives and behavioural intentions. Curr. Issues Tour. 2018, 1–16. [Google Scholar] [CrossRef]
  13. Saayman, M.; Saayman, A. Clustering attendees at the Philharmonic Orchestra’s Summer Festival. Leis. Stud. 2014, 35, 314–331. [Google Scholar] [CrossRef]
  14. Wróblewski, L.; Dziadzia, B.; Dacko-Pikiewiecz, Z. Sustainable managament of the offer of cultural institution in the cross-border market for cultural services—Barriers and conditions. Sustainability 2018, 10, 3253. [Google Scholar] [CrossRef]
  15. Wróblewski, L.; Bilinska-Reformat, K.; Grzesiak, M. Sustainable activity of cultural service consumers of social media users—Influence on the brand capital of cultural institution. Sustainability 2018, 10, 3986. [Google Scholar] [CrossRef]
  16. Getz, D.P.; Page, S.J. Event Studies: Theory, Research and Policy for Planned Events, 3rd ed.; Event Management Series; Routledge: London, UK, 2016; p. 53. [Google Scholar]
  17. Elosua, P. Subjective values of quality of life dimensions in elderly people. A SEM preference model approach. Soc. Indic. Res. 2011, 104, 427–437. [Google Scholar]
  18. Caridad y Ocerín, J.M. Modelos estructurales con AMOS; Ediciones Don Folio: Cordoba, Spain, 2016. [Google Scholar]
  19. Bagozzi, R.P.; Heatherton, T.F. A general approach to representing multifaceted personality construct: Application to state sef-esteem? Struct. Equ. Modeling 1994, 1, 35–67. [Google Scholar] [CrossRef]
  20. Browne, M.W.; Cudeck, R. Alternative ways of assessing model fit. In Testing Structural Equation Models; Bollen, K.A., Long, J.S., Eds.; SAGE Publications Inc.: Newbury Park, CA, USA, 1993; pp. 136–162. [Google Scholar]
  21. Bentler, P.M. Comparative fit indexes in structural models. Psychol. Bull. 1990, 107, 238–246. [Google Scholar] [CrossRef]
  22. Bollen, K.A. Structural Equations with Latent Variables; John Wiley & Sons: New York, NY, USA, 1989. [Google Scholar]
  23. Zins, A.H. Relative attitudes and commitment in customer loyalty models. Int. J. Serv. Ind. Manag. 2001, 12, 269–294. [Google Scholar] [CrossRef]
  24. Gallarza, M.G.; Saura, I.G. Value dimensions, perceived value, satisfaction and loyalty: An investigation of university students’ travel behavior. Tour. Manag. 2006, 27, 437–452. [Google Scholar] [CrossRef]
  25. Lee, T.H.; Hsu, F.Y. Examining how attending motivation and satisfaction affects the loyalty for attendees at aboriginal festivals. Int. J. Tour. Res. 2013, 15, 18–34. [Google Scholar] [CrossRef]
  26. Sun, X.; Chi, C.G.; Xu, H. Developing destination loyalty: The case of Hainan Island. Ann. Tour. Res. 2013, 43, 547–577. [Google Scholar] [CrossRef]
  27. Prebensen, N.K.; Woo, E.; Uysal, M.A. Experience value: Antecedents and consequences. Curr. Issues Tour. 2014, 17, 910–928. [Google Scholar] [CrossRef]
  28. Prebensen, N.K.; Woo, E.; Uysal, M.A. Motivation and involvement as antecedents of the perceived value of the destination experience. J. Travel Res. 2012, 52, 253–264. [Google Scholar] [CrossRef]
  29. Mason, M.C.; Paggiaro, A. Investigating the role of festivalscape in culinary tourism. The case of food and wine events. Tour. Manag. 2012, 33, 1329–1336. [Google Scholar] [CrossRef]
  30. Chen, C.F.; Chen, F.S. Experience quality, perceived value, satisfaction and behavioral intentions for heritage tourists. Tour. Manag. 2010, 31, 29–35. [Google Scholar] [CrossRef]
  31. Munusturalar, M.A.; Argan, M.; Argan, M.T. An examination of spring festival attendees’ motivations within campus recreation. Anthropologist 2015, 22, 133–145. [Google Scholar] [CrossRef]
  32. Tam, J.L.M. The effects of service quality, perceived value and customer satisfaction on behavioral intentions. J. Hosp. Leis. Mark. 2000, 6, 31–43. [Google Scholar]
  33. Sirakaya-Turk, E.; Ekinci, Y.; Martine, D. The efficacy of shopping value in predicting destination loyalty. J. Bus. Res. 2015, 68, 1878–1885. [Google Scholar] [CrossRef] [Green Version]
  34. Kruger, M. A Critical Evaluation of Market Segmentation at National Arts Festivals in South Africa; North-West University: Westonaria, South Africa, 2010. [Google Scholar]
  35. Crompton, J.L.; McKay, S.L. Motives of visitors attending festival events. Ann. Tour. Res. 1997, 24, 425–439. [Google Scholar] [CrossRef]
  36. Uysal, M.; Gahan, L.; Martin, B. An examination of event motivations: A case study. Festiv. Manag. Event Tour. 1993, 1, 5–10. [Google Scholar]
  37. Yolal, M.; Woo, E.; Cetinel, F.; Uysal, M. Comparative research of motivations across different festival products. Int. J. Event Festiv. Manag. 2012, 3, 66–80. [Google Scholar] [CrossRef]
  38. Kim, Y.G.; Suh, B.W.; Eves, A. The relationships between food-related personality traits, satisfaction, and loyalty among visitors attending food events and festivals. Int. J. Hosp. Manag. 2010, 29, 216–226. [Google Scholar] [CrossRef] [Green Version]
  39. Batista-Foguet, J.M.; Coenders, G. Cuadernos de Estadística. Modelos de Ecuaciones Estructurales; Editorial La Muralla: Madrid, Spain, 2000. [Google Scholar]
  40. Kruger, M.; Saayman, M. A 3E typology of visitors at an electronic dance music festival. Int. J. Event Festiv. Manag. 2016, 7, 219–236. [Google Scholar] [CrossRef]
  41. Finn, M.; Elliot-White, M.; Walton, M. Tourism and Leisure Research Methods: Data Collection, Analysis and Interpretation; Pearson Education: London, UK, 2000. [Google Scholar]
Figure 1. Path diagram of the SEM model.
Sustainability 11 00826 g001
Table 1. Regressions.
EstimateSECRp-ValueLabel
Q65<---Musical_preferences1.000
Q64<---Musical_preferences1.0830.1417.690***
Q62<---Musical_preferences0.4820.1233.926***
Q61<---Musical_preferences2.0380.3455.908***
Q1111<---Satisfaction1.000
Q112<---Satisfaction0.2350.1581.4840.138
Q123<---Attitudinal_loyalty1.000
Q121<---Attitudinal_loyalty0.3200.3680.8690.385
Q7<---Behavioural_loyalty1.000
Q1<---Behavioural_loyalty5.0704.3231.1730.241
Q10<---Economic_impact1.000
Q63<---Musical_preferences0.2260.1161.9490.051
Q112<---Attitudinal_loyalty0.1230.1770.6960.487
Q7<---Economic_impact−0.3180.202−1.5730.116
Q65<---Satisfaction0.0670.0471.4420.149
Q63<---Satisfaction0.0950.0511.8490.064
Q62<---Satisfaction0.0210.0350.6020.547
Q10<---Behavioural_loyalty−0.9210.393−2.3420.019
Q61<---Satisfaction−0.1280.081−1.5860.113
Q121<---Economic_impact−3.4083.210−1.0610.288
Q123<---Economic_impact−12.75421.874−0.5830.560
Q123<---Satisfaction−0.5790.997−0.5810.561
Source: The authors. SE: CR:
Table 2. Variances.
Table 2. Variances.
EstimateSEC.R.p-Value
Musical preferences0.3520.0854.142***
Satisfaction2.0080.6962.8840.004
Attitudinal loyalty38.555112.3790.3430.732
Behavioural loyalty0.0940.0871.0890.276
Economic impact0.1930.1601.2080.227
e651.6620.10615.650***
e641.2910.09214.049***
e631.9980.11417.458***
e621.7190.10017.256***
e610.3760.1971.9070.057
d1111−0.6200.694−0.8950.371
d1121.1020.1826.069***
d123−0.5721.789−0.3200.749
d1210.6160.1484.154***
d71.1420.10311.114***
d10.1171.9730.0590.953
d106.5820.40016.444***
Source: The authors.
Table 3. Covariances.
EstimateSECRp-Value
Musical preferences<-->Satisfaction0.1890.0623.0760.002
Attitudinal loyalty<-->Behavioural loyalty−0.3120.540−0.5780.563
Musical preferences<-->Attitudinal loyalty1.2921.9270.6700.503
Satisfaction<-->Economic impact0.1500.1111.3520.176
Musical preferences<-->Behavioural loyalty0.0120.0140.9130.361
Behavioural loyalty<-->Economic impact−0.0240.024−1.0000.317
Satisfaction<-->Attitudinal loyalty3.6735.0910.7220.471
Attitudinal loyalty<-->Economic impact2.6173.7790.6920.489
Musical preferences<-->Economic impact0.0820.0402.0390.041
Satisfaction<-->Behavioural loyalty−0.0320.031−1.0320.302
e63<-->e620.4250.0765.590***
e65<-->e62−0.4110.074−5.574***
e62<-->d70.2200.0563.909***
e64<-->d10.2570.0763.392***
e64<-->d70.1720.0533.2470.001
e65<-->e63−0.2040.074−2.7500.006
e65<-->d1120.2180.0713.0790.002
e64<-->e630.1480.0652.2610.024
e65<-->d1230.1060.0452.3700.018
e65<-->d7−0.1240.057−2.1760.030
e62<-->d112−0.1210.061−1.9810.048
Source: The authors.
Table 4. Frequency—Rock.
FrequencyPercentageValid PercentageCumulative Percentage
ValidVery low8013.113.113.1
Low6811.111.124.2
Moderate7412.112.136.3
High14022.922.959.2
Very high25040.840.8100.0
Total612100.0100.0
Table 5. Frequency—Classical.
FrequencyPercentageValid PercentageCumulative Percentage
ValidVery low6510.610.610.6
Low7011.411.422.1
Moderate12520.420.442.5
High13421.921.964.4
Very high21835.635.6100.0
Total612100.0100.0
Table 6. Frequency—Jazz.
FrequencyPercentageValid PercentageCumulative Percentage
ValidVery low6210.110.110.1
Low6210.110.120.3
Moderate13021.221.241.5
High15625.525.567.0
Very high20233.033.0100.0
Total612100.0100.0
Table 7. Frequency—Flamenco.
FrequencyPercentageValid PercentageCumulative Percentage
ValidVery low9215.015.015.0
Low7712.612.627.6
Moderate9615.715.743.3
High14924.324.367.6
Very high19832.432.4100.0
Total612100.0100.0
Table 8. Frequency—Blues.
FrequencyPercentageValid PercentageCumulative Percentage
ValidVery low7512.312.312.3
Low6310.310.322.5
Moderate14623.923.946.4
High15024.524.570.9
Very high17829.129.1100.0
Total612100.0100.0
Source: The authors.

