Article

The Relationships between Corporate Credibility, Service Convenience, and Consumers’ Use Intentions: Toward Ticketing Apps for Low-Cost Carriers

1
Department of Tourism Management, National Kaohsiung University of Science and Technology, Kaohsiung 80778, Taiwan
2
Department of Leisure, Recreation and Tourism Management, Tzu Hui Institute of Technology, Pingtung 92641, Taiwan
3
Department of Tourism Culture, Kun Shan University, Tainan 71070, Taiwan
4
Department of Electronic Engineering, National Kaohsiung University of Science and Technology, Kaohsiung 80778, Taiwan
*
Author to whom correspondence should be addressed.
Sustainability 2019, 11(3), 810; https://doi.org/10.3390/su11030810
Submission received: 15 December 2018 / Revised: 24 January 2019 / Accepted: 31 January 2019 / Published: 4 February 2019
(This article belongs to the Special Issue Sustainability in E-Business)

Abstract

:
This study explored behavioral models based on low-cost carrier customers’ use of a ticketing app. Technology readiness, service convenience, and corporate credibility were evaluated in the model. A total of 815 valid responses were collected from customers of Tigerair, Taiwan, who had flown from one of the two major international airports in Taiwan. With technology readiness regarded as the grouping variable, the results indicated that corporate credibility significantly affected customers’ intentions to use the app, whereas the effects of service convenience on the technology exploration, technology contradiction, and the technology insecurity groups varied. Finally, this paper presents a discussion of management implications and suggestions for future studies.

1. Introduction

In an era of continuous technological advancement, the application of technology and the internet have become increasingly popular. Therefore, the service patterns of industries have also changed. In particular, as the worldwide population of mobile commerce (m-commerce) users continues to grow, the combination of m-commerce and technology is becoming crucial in numerous industries. Stamford [1] indicated that the Asia-Pacific region will exceed other regions worldwide in the amount of mobile payment transactions, which is expected to reach US $165 billion by 2016.
In recent years, favorable external conditions such as the worldwide trend of air transport liberalization have resulted in the rapid development of low-cost carriers (LCCs) in the aviation markets of Europe and Asia-Pacific, rendering LCCs the fastest growing field in the aviation industry. However, the continuous development of LCCs contributed to mutual learning between conventional full-service airlines and their low-cost competitors. Low-cost carriers have been prompted to gradually operate under the hybrid value carrier (HVC) model. However, in response to competition from LCCs, full-service airlines have reduced unnecessary services to lower their costs, converting some of their services to paid services, and even established their own subsidiary LCCs. By contrast, LCCs have grown from an initial operating model involving the seizure of a low-fare advantage by simplifying services and reducing costs to developing various value-added services (e.g., adjusting from providing a uniform economy class cabin throughout the carrier to incorporating a premium economy class cabin or business class cabin and offering transfer services or VIP rooms in airports), thus creating and satisfying focus demands.
To comply with the standards of the business environment and be more customer friendly, both LCCs and full-service airlines must adopt air ticket reservation systems that not only satisfy current operating demands, but also cope with possible changes in operating models. Therefore, aviation companies should focus on applying new technology (e.g., mobile apps), continuously developing additional services, and enhancing the service convenience for customers to improve service quality and reduce human resource-related service costs. In this consumer-oriented era, service convenience has become essential. Berry, Seiders, and Grewal [2] conceptualized perceived service convenience as the time and effort customers perceive themselves to have spent when purchasing or using a service. The LCC industry owners have designed their mobile apps in consideration of their customers’ perspectives. Hence, these apps save time and effort for customers and prompt customers to try new services. Previous studies have shown that related studies on m-commerce are mostly extensions of those on conventional e-commerce. When companies enhance the convenience of m-commerce functions for consumers, these companies are more likely to succeed in the market [3,4,5].
Corporate credibility is a component of corporate reputation that influences how consumers evaluate the integrity and expertise of a company; it consists of the perceived expertise and perceived trust of consumers toward a company and reflects the gap between what consumers expect and what they get from the delivered service [6,7]. Corporate credibility is a key factor in addressing the safety of the consumer and trust-related issues associated with the building of online trust and the reduction of private risk. Therefore, when a customer interacts with a new technology service and has no previous user experience to base an evaluation on, the customer’s perceived expertise and perceived trust would then serve as a primary reference in regard to his or her decision to use the service. The corporate credibility of LCCs plays a key role in determining whether customers are willing to accept their technology services.
The technology acceptance of each study participant was tested through the technology readiness index. Verma, Stock, and McCarthy [8] adopted the technology readiness index to conduct a test, finding that customers who scored higher on the technology readiness index (most likely to accept new technology) were young customers, who frequently took business trips, attained higher education, and earned higher salaries. They claimed that business users are more likely to accept m-commerce than other people.
For a company to foster acceptance of a new self-service technology among customers, understanding customers’ attitudes toward self-service technology and factors affecting their acceptance is crucial. Therefore, technology readiness, namely consumers’ mental readiness to accept a new technology, is an influential factor in this process [9].
Becker et al. [10] pointed out that unobservable heterogeneity is often present in the intention of customers to use self-service technology. In that study, the technology acceptance model was used, and the population was sorted into two groups; the results showed that perceived ease of use and perceived usefulness produced opposite effects on intention to use, strongly indicating that this heterogeneity is a very meaningful segment variable in marketing.
Liau and Tan [11] employed data-mining techniques to identify four primary topics of discussion among LCC customers, namely, customer service, LCC ticket promotions, flight cancellations or delays, and post-booking management. These topics will help LCCs to attract more customers and generate more revenue. Lin, Shih, and Sher [12] integrated technology readiness into the technology acceptance model, in the context of the consumer adoption of e-service systems and theorized that the impact of technology readiness on use intention is completely mediated by both perceptions of usefulness and ease of use. Lin and Chang [13] developed and tested a model that integrates the role of technology readiness into the technology acceptance model. They found that technology readiness influences perceived usefulness, perceived ease of use, attitude toward using self-service technologies, and behavioral intentions. Therefore, to achieve better self-service technology service outcomes, firms implementing self-service technologies should pay increased attention to customer technology readiness. Technology readiness measures a person’s psychological inclination (both positive and negative inclinations) toward cutting-edge technology and reflects a person’s psychological “tug-of-war” in accepting or rejecting certain technologies.
In recent years, research on the LCC industry has focused on competitive strategy analysis with traditional airlines [14,15,16,17] and route planning, which is different from traditional airlines [18,19], market research for customer characteristics [20], etc., and there has been less discussion on the operation and customer service of self-service technology. Moreover, few studies have used technology readiness as a segment variable to explore the market segmentation of self-service technology users. This study adopted technology readiness as the variable for group heterogeneity regarding the acceptance of technology among LCC customers. Additionally, this study examined whether customers’ intentions to use apps are affected by the app service convenience and corporate credibility. The study results regarding these effects have implications for the management and market segmentation of LCC customers in relation to their use and acceptance of LCC-provided apps.

2. Literature Review

2.1. Technology Readiness

Most mobile devices including smartphones, personal digital assistants, and tablet computers support Wi-Fi, enabling their users to instantaneously access numerous services. However, compared with consumers in the past, mobile-device users must expend more effort to learn how to use a wider variety of services. Thus, technology readiness is specifically essential for those users. Technological advancements have enriched consumers’ lives, increased their mobility, and brought them satisfaction. However, these advances have narrowed the range of consumers’ choices in daily life [21]. According to the definitions of attitude and intention and the relation between these two elements, the acceptance, conception, and perception of consumers in relation to technology-based products or services comprise their attitudes toward technology. These attitudes, in turn, affect consumers’ use of technology-based products and services.
Earlier literature regarding m-commerce reveals that the individual traits of consumers are likely to affect their adoption of new technologies or services [22,23,24]. With small changes over long periods of time, the integration of technology readiness into the technology acceptance model for m-commerce have been explored in different domains. For instance, it was verified that consumers’ cognitive and affective evaluations of new technologies are significantly influenced by their technology readiness [25]. The results show that the technological readiness of a consumer influences his/her mobile shopping behavior. In addition, perceived usefulness mediates the relation between technology readiness and m-commerce [26]. Parasuraman [27] explored individual traits and developed the concept of technology readiness. The author defined technology readiness as “people’s propensity to embrace and use new technologies for accomplishing goals in home life and at work.” Additionally, the author posited that consumer attitudes toward new technologies or services can be divided into positive feelings that propel them toward such technologies (drivers) and negative feelings that hold them back (inhibitors). People alternate between these contradictory feelings. Parasuraman [27] indicated that the dominant type of feelings varies across individuals (consumers), depending on their individual traits. Therefore, an individual is likely to exhibit positive and negative attitudes toward a new technology in relation to multiple considerations. As described, individual traits leading to different attitudes among consumers are the constituents of technology readiness. Thus, technology readiness reflects an individual’s belief about a new technology rather than a measurement of the individual’s ability to use the new technology.
Parasuraman [27] proposed four constructs for measuring technology readiness: (a) optimism, (b) innovativeness, (c) discomfort, and (d) insecurity. Among these constructs, optimism and innovativeness are positive technology readiness drivers that prompt consumers to use technology, whereas discomfort and insecurity are negative inhibitors that impede consumers from using technology-based products and services. Following the demonstration of the validity of the technology readiness index for measuring consumer acceptance of various cutting-edge technologies, presented by Liljander et al. [9]. Parasuraman and Colby [28] proposed new insights into technology readiness, adapted the concept to changes in the technology landscape, and simplified the original technology readiness index (36 items) into a 16-item scale.
According to individuals’ scores for the four technology readiness constructs, Parasuraman and Colby [29] divided individuals into the following clusters: (a) explorers, who are highly motivated and do not fear technology; (b) pioneers, who seek the benefits of the most advanced technologies; (c) skeptics, who must be convinced of technology’s benefits; (d) paranoid people, who are convinced of technology’s benefits but preoccupied with related risks; and (e) laggards, who may never adopt technology, unless they are forced to do so. Positive and negative feelings about technology correspond to two groups with contrasting values. Explorers exhibit high levels of optimism and innovativeness, which drive them to adopt new technologies, whereas laggards feel intense discomfort and insecurity, which inhibit them from adopting new technologies [29]. These two clusters exhibit different action tendencies.

2.2. Service Convenience

Verma, Stock, and McCarthy [8] compared business and leisure travelers’ preferences in relation to online, social media, and mobile innovations in the hospitality industry context. The authors summarized three preferences that customers exhibited during app use. Location-based information and apps were most desired by customers, followed by communication-related innovations and hotel-services-based innovations. The service convenience concept first appeared in marketing literature regarding product classification. The idea of service convenience was introduced, which can be defined as the convenience of services related to the purchase of goods, with centralized distribution [30]. In early marketing terminology, convenience referred to relatively low requirements of time and effort from consumers in the process of purchasing a good, and not to the product features or attributes [31] or a consumer’s convenience in choosing among products or services. The perception of service convenience among consumers refers to the time and effort that consumers perceive they have spent in buying or using a service. Time and effort are non-monetary costs, and in this context, they can be regarded as the consumers’ opportunity costs. Consumers have exhibited an intense focus on time costs, and their requirements for convenience have increased accordingly. When consumers recognize that the time cost of a service is high, they may perceive the service as exhibiting a low convenience [2]. Davis and Vollmann [32] determined that waiting time affects customer reviews. Convenience has become a key factor in decision-making among consumers with limited time [33]. Numerous researchers have confirmed that the convenience orientation critically affects decision-making among consumers [2]. Yale and Venkatesh [34] asserted that convenience preferences shape unique consumption strategies. In addition, there have been numerous studies investigating the role of service convenience. Roy et al. [35] examine the moderating role of service convenience in relation to the relationship of service quality, service fairness, and different forms of customer engagement behaviors. Moreover, Chang et al. [36] look into service convenience and service quality in relation to their effect on future return intentions. Such a relation remains nearly stable, even if service convenience is used as a moderator. To sum up, service convenience plays an important role in consumer behavior associated with the purchase, use, and disposal of products or apps. Gehrt and Yale [37] argued that a business can retain consumers by considering the convenience of product or service consumption in their marketing strategies.
Berry et al. [2] summarized the literature related to consumer convenience and services and accordingly proposed a service convenience model. On the basis of consumers’ processes of using or purchasing services, the authors categorized service convenience into the following five constructs: benefit convenience, decision convenience, access convenience, transaction convenience, and post-benefit convenience. These five constructs can be used to discuss consumers’ evaluations of convenience. The constructs also reflect the consumers’ perceptions of the practical benefits derived from saving time and effort when purchasing or using services. Explanations of each construct are as follows: (a) decision convenience involves consumers’ determination of how to obtain desired services, according to their perceptions of related time and effort expenditures; (b) access convenience refers to consumers’ perceived time and effort expenditures, with regard to their contact with service providers; (c) transaction convenience involves consumers’ perceived time and effort expenditures during transactions; (d) benefit convenience refers to consumers’ perceptions of the amount of time and effort that must be expended to experience the core benefits of services; and (e) post-benefit convenience involves consumers’ perceived time and effort expenditures in the re-initiation of contact with service providers.

2.3. Corporate Credibility

Studies related to source credibility have indicated that credible sources are more persuasive than non-credible sources [38,39]. Goldsmith, Lafferty, and Newell [6] defined source credibility as “the extent to which the source is perceived as possessing expertise relevant to the communication topic and can be trusted to give an objective opinion on the subject.” This definition implies that expertise and credibility are key factors shaping consumer perceptions and that corporate credibility reflects a corporation’s level of source credibility. Accordingly, marketing communication studies have long established the effects of corporate credibility on consumer attitudes and behaviors, and it is worth noting that corporate credibility comprises three distinct dimensions, namely, trustworthiness, expertise and dynamism. In other words, for loyal customers, it is likely that trustworthiness has a higher influence on their attitudes and support intentions than expertise and dynamism [40].
Keller [41] defined corporate credibility as the extent to which consumers believe that a firm can deliver products and services that meet the customers’ desires. In this conception, credibility is formed by consumers’ perceptions of a firm’s expertise and trustworthiness. In addition to its considerable effect on advertising, corporate credibility, according to observations of researchers, represents an essential impression in online shopping settings. Kim and Choi [42] mentioned that because consumers cannot directly understand a product or verify the quality of the product when they shop online, their perceptions of the manufacturer’s trustworthiness affect both their judgments of the product quality and the likelihood that they will purchase the product. Consumers often examine the surface credibility of companies that have digitized their businesses to evaluate whether the companies (i.e., service providers) can consistently offer the promised services and benefits [43]. Corporate credibility plays a role as a signal of the company’s key characteristics and as a source of competitive advantage. Thus, consumers rely on corporate credibility to judge the company’s product or service [44]. Moreover, trustworthiness refers to customers’ recognition of the online sellers’ sincerity, honesty, and dependability in delivering the promised online services.
In a recent study on corporate credibility, Musgrove, Choi, and Cox [45] conducted an experiment that examines different types of green marketing claims and corporate credibility in terms of consumer skepticism and other variables relating to consumer perception that are meaningful to firms. Soesilo, Gunadi, and Arimbi [46] found that consumers’ perceived risk was lower when the product was produced by a credible company but endorsed by a less credible source, than when it was produced by a less credible company but endorsed by a more credible source. Zhang et al. [47] investigated the impact of source credibility (expertise and trustworthiness) on air travelers’ purchase intentions in relation to aviation voluntary carbon offsetting products. The result showed that trustworthiness has a significant positive impact on purchase intentions, while the impact of expertise is not significant. In summary, when consumers shop online, product quality is not the only factor that influences purchase decisions. Consumers also rely on enterprise reputation and the trustworthiness of corporate messages. Furthermore, consumers judge the quality of a product according to the expertise and professional image of the manufacturer. Therefore, in online shopping settings, corporate credibility has become a crucial reference point in consumers’ evaluations of the quality of a company’s products.

2.4. Relationships among Technology Readiness for Mobile-Device Use, Service Convenience, Corporate Credibility, and Consumers’ App-Use Intentions

Previous empirical studies on social and behavioral phenomena, such as those related to information systems, management, and marketing, have assumed the homogeneity of population-based data samples [48]. The present study explored the behavioral model of information technology use among customers and considered the heterogeneity of the population. However, Becker et al. [10] suggested that theoretical support cannot be established for unexplainable post-hoc differences. Additionally, when the applied theory digresses from the research topic or the population does not reflect an empirical paradigm, reasonable explanations are unlikely to be discovered. Accordingly, the present study regarded technology readiness as a segmenting construct associated with observable heterogeneity. After validating the constructs, related management implications and insights were determined.
Keeping up with the plethora of apps that come out every day is challenging, whether one is a technologist or not. We all know that “there is an app for that,” and if there are several apps for a certain service, what are the advantages of any one of them [49]? Berry et al. [2] claimed that if consumers experience the core benefits of a commercial service, the perceived time and effort involved in purchasing may decrease, and the convenience may increase consumers’ intentions to purchase the service. Numerous studies have explored the effects of service convenience on consumers’ behavioral intentions and confirmed that most consumers do not want to spend a long time searching for products or services, collecting information, or purchasing goods. Accordingly, simplifying the purchasing process increases the odds that consumers will purchase additional products or services from the company [50]. Numerous studies that focused on m-commerce have also verified that purchase intentions rise when users perceive the benefits of using a new system [51,52]. With regard to consumers who prefer buying novel products, companies can improve transaction convenience in aspects such as finance, payment, and delivery to save consumers’ time during service. Such convenience prompts consumers to engage with new means of buying tickets [50]. Following the aforementioned statements regarding service convenience, the present study inferred that the service convenience of an LCC app significantly affects consumers’ intentions to use the app. Therefore, the first hypothesis is as follows:
H1. 
The service convenience of an LCC app significantly and positively affects consumers’ intentions to use the app.
Studies on e-commerce marketing have verified that online vendors with positive reputations gain trust from consumers [53,54]. When individuals are aware of a firm’s previous dealings, it is likely that they will use this information in their decision-making and assess organizational messages. While consumer perceptions of corporate credibility may have a significant effect on a number of research variables, relatively little research has been devoted to this topic [55]. Consumers assess products or services according to their perceptions of the seller’s expertise and trustworthiness. In the e-service context, users first assess the usefulness of an e-service and then decide whether to use it. The outcome of these two processes is favorable for the e-service provider if consumers believe that the provider is trustworthy, delivers what it promises, and exhibits expertise in safely and reliably completing service transactions [53]. Corporate credibility exerts positive effects on consumers’ reviews of brands and intentions to buy products [6,53,56]. When consumers visit a company’s online transaction platform, unknown attributes of e-service are included in their evaluation of the company. Corporate credibility affects consumers’ perceptions of product or service usefulness, and consumers tend to use an e-service after they adjust to the service platform [53]. As Kim and Choi [42] indicated, applying metrics for traditional and offline buying behavior to the Internet setting results in more uncertainties, and this also applies to the application of the traditional metrics to m-commerce. Accordingly, the present study inferred that the corporate credibility of an LCC’s parent company significantly and positively affects consumers’ intentions to use the LCC’s app. Therefore, the second hypothesis is as follows:
H2. 
The corporate credibility of an LCC positively affects consumers’ intentions to use the LCC’s app.

3. Methods

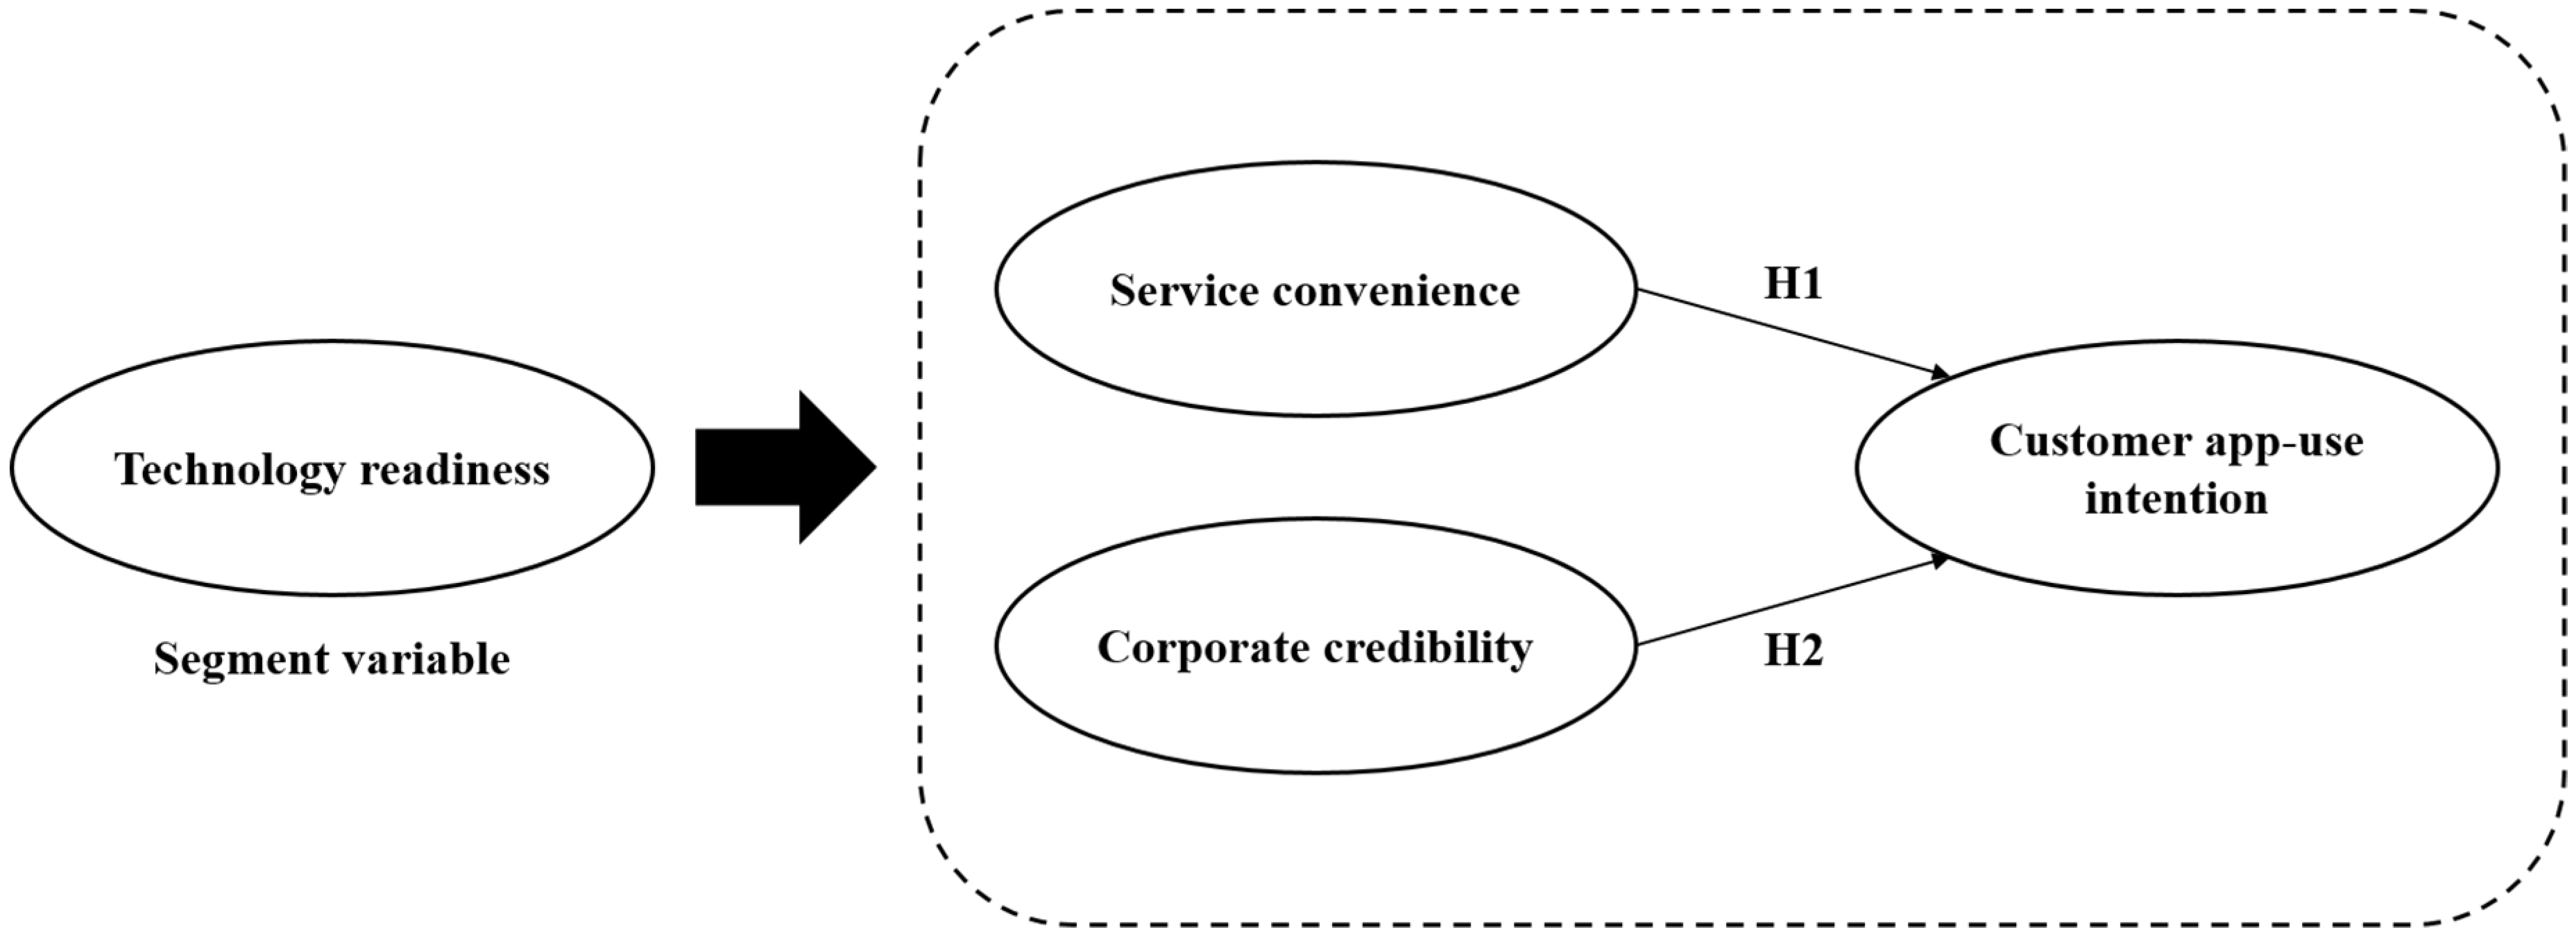
3.1. Research Framework

This study used the technology acceptance model as a theoretical basis for sample grouping, in the hope of demonstrating various psychological attitudes toward technology, fully reflecting the perceived ease of use and perceived usefulness of app service convenience (the contents of which are described above) and using the corporate credibility of LCCs to express their private risk and trust. The research framework according to the aforementioned hypotheses are shown in Figure 1. In Figure 1, the technology readiness is treated as a segment variable, not a latent variable, and is used to group the heterogeneity of the sample interview to explore the causal relationships among service groups, corporate credibility, and customers’ app-use intentions in different groups.

3.2. Questionnaire Design

This study adopted the technology readiness scale used in Parasuraman and Colby [28] to evaluate whether customers’ attitudes toward technology affect their intentions to use the technology. Regarding service convenience, the scale comprising six factors and 34 items proposed by Chen and Yang [57], was employed. Interviews were conducted with 19 LCC executives (i.e., managers and directors) and frontline airport staff (i.e., ground staff) from Tigerair Taiwan, Air Busan, Spring Airlines, Peach Aviation, Jetstar, AirAsia, V Air, Vanilla Air, Scoot, and Juneyao Air. Subsequently, items were revised according to the experts’ suggestions. The revised items were then presented to the same experts who provided additional suggestions and revisions. Finally, a questionnaire of 33 items was finalized. Respondents scored items on a 5-point Likert scale, and scores were analyzed to determine respondents’ perceptions of the importance of each item. Concerning corporate credibility, the perspectives and scale proposed by Featherman et al. [53] were used and the items were adapted to suit the purposes of the present study. Regarding customers’ app-use intentions, items in the studies of Davis and Vollmann [32] and Mallat et al. [58] were referred to and adapted to suit our research scenario. The final part of the questionnaire comprised questions about respondents’ demographic information and travel patterns.

3.3. Respondents and Sampling

Tigerair Taiwan was the first LCC to establish an airline service to and from Taiwan. This Taiwanese LCC is co-owned by China Airlines and Tigerair Singapore and was the first LCC established by a conventional airline to provide service in Taiwan. China Airlines, the parent company of Tigerair Taiwan, has been in business for approximately 50 years and is known for its customer-oriented services. This reputation has strengthened its brand image among Taiwanese consumers. Beginning in 2005, China Airlines received top rankings for its overall service and spotless aircraft cabins for nine consecutive years, reflecting Taiwanese passengers’ perceptions of the airline’s high quality. China Airlines is a traditional airline that serves high-end passengers, whereas Tigerair Taiwan aims to attract customers with a strong price sensitivity. China Airlines Group provides products and services for customers from various segments of society. With this diversification strategy, the group has created a win-win situation. The respondents of this study were customers who took Tigerair Taiwan flights, departing from Taoyuan International Airport or Kaohsiung International Airport. Respondents were selected using convenience sampling and were interviewed before they checked in at the Tigerair service counters in Taoyuan and Kaohsiung International Airports. The two survey periods each lasted two weeks, which is equivalent to an overall survey period of four weeks, and a total of 815 valid responses were collected during this period.

4. Results and Analysis

4.1. Descriptive Statistics

Table 1 presents the socioeconomic statuses of our respondents. A total of 356 men (43.7%) and 459 women (56.3%) completed the survey. The majority of the respondents were aged 21–30 years (414 respondents; 50.8%); nearly a quarter of the respondents were students (188 respondents; 23.1%); more than half of them had earned a bachelor’s degree (556 respondents; 68.2%); and the monthly incomes of 210 of the respondents was, on average, 20,000–40,000 NTD (25.8%). The annual air travel frequency of more than half of the respondents was, on average, three trips or less (470 respondents; 57.7%), and the vast majority of respondents booked their flights on the Internet (676 respondents; 82.9%). Approximately a quarter of the passengers (25.4%) had purchased tickets using the Tigerair Taiwan app.

4.2. Exploratory Factor Analysis

The reliability and power of discrimination among the 33 items regarding service convenience were assessed through item analysis. The t values between the upper 27% and lower 27% groups of each item exceeded three, indicating a significant difference between the upper group and the lower group of each item. In other words, each item exhibited that respondents had the power of discrimination. However, the item-to-total correlation values of the items “Authentication mechanism of QR code ticketing” and “Electronic (paperless) boarding pass,” were lower than 0.45, implying that these two items were not significantly correlated with any of the other items. These two items were removed. The other items, of which the item-to-total correlation values were greater than 0.45, were retained, because they exhibited a desirable reliability and power of discrimination.
Exploratory factor analysis was conducted on the remaining items. Twelve items were deleted, because their factor loadings did not reach 0.5. Finally, a total of five factors, with 21 items whose factor loadings exceeded 0.5, were retained. Specifically, the Kaiser–Meyer–Olkin measure of the sampling adequacy was 0.885; the χ2 value of a sphericity test was 2769.3 (p = 0.000); and the five factors accounted for 57.7% of the total variance (Cronbach’s alpha of each factor > 0.7). The results indicated that the service convenience of the Tigerair Taiwan app comprised five factors, with a favorable reliability. Moreover, according to the aforementioned literature concerning the constructs of service convenience, the five factors in the present study were renamed as “benefit convenience” (M = 4.03), “transaction convenience” (M = 4.49), “decision convenience” (M = 4.51), “access convenience” (M = 4.21), and “post-benefit convenience” (M = 3.57). Table 2 presents the details of the relevant findings. Transaction convenience and decision convenience exhibited a relatively high importance, whereas post-benefit convenience exhibited the lowest importance.

4.3. Confirmatory Factor Analysis

A confirmatory factor analysis was conducted to test the convergent and discriminant validity of the constructs in this study (i.e., technology readiness, corporate credibility, and customers’ app-use intentions). The indices of the overall model fit reached the ideal fit level (χ2 = 1061.50 (p = 0.0); χ2/df = 2.83; goodness-of-fit index (GFI) = 0.92; adjusted goodness-of-fit index (AGFI) = 0.90; comparative fit index (CFI) = 0.95; root mean square error of approximation (RMSEA) = 0.047; root mean square residual (RMR) = 0.039; parsimony goodness-of-fit index (PGFI) = 0.74; and normed fit index (NFI) = 0.94). The results of the analysis indicated that the average variance extracted and the construct reliability of each factor exceeded 0.5 and 0.6, respectively, revealing the desirable convergent validity among technology readiness, corporate credibility, and customers’ app-use intentions (Table 3). Additionally, the correlation coefficients among factors were between −0.042 and 0.777, indicating that no correlations were evident among the factors. Accordingly, the constructs exhibited a favorable discriminant validity (Table 4).

4.4. Results of Cluster Analysis

With technology readiness as the grouping variable, the samples were grouped through a two-stage cluster analysis. Ward’s method for hierarchical clustering was employed to calculate the suitable number of clusters. The level of changes in agglomerative coefficients and the dendrogram, derived through Ward’s method were referenced to identify the suitable number of clusters. Subsequently, K-means clustering was conducted for non-hierarchical analysis, and the results revealed that the optimal number of clusters was three. One-way analysis of variance was then conducted to determine differences among the three clusters. As depicted in Table 5, the first cluster was associated with high perceptions of positive constructs and low perceptions of negative constructs. This result indicated that the respondents in the first cluster exhibited positive attitudes toward technology. This cluster was thereby labelled the “technology exploration group.” The second cluster exhibited strong perceptions of both positive and negative constructs, implying that this group of respondents accepted yet feared technology. The second cluster was named the “technology contradiction group.” The third cluster was associated with low perceptions of positive constructs and high perceptions of negative constructs. The respondents in this cluster averaged the highest score for technology insecurity, compared with those in other clusters. Thus, the third cluster was labelled the “technology insecurity group”.

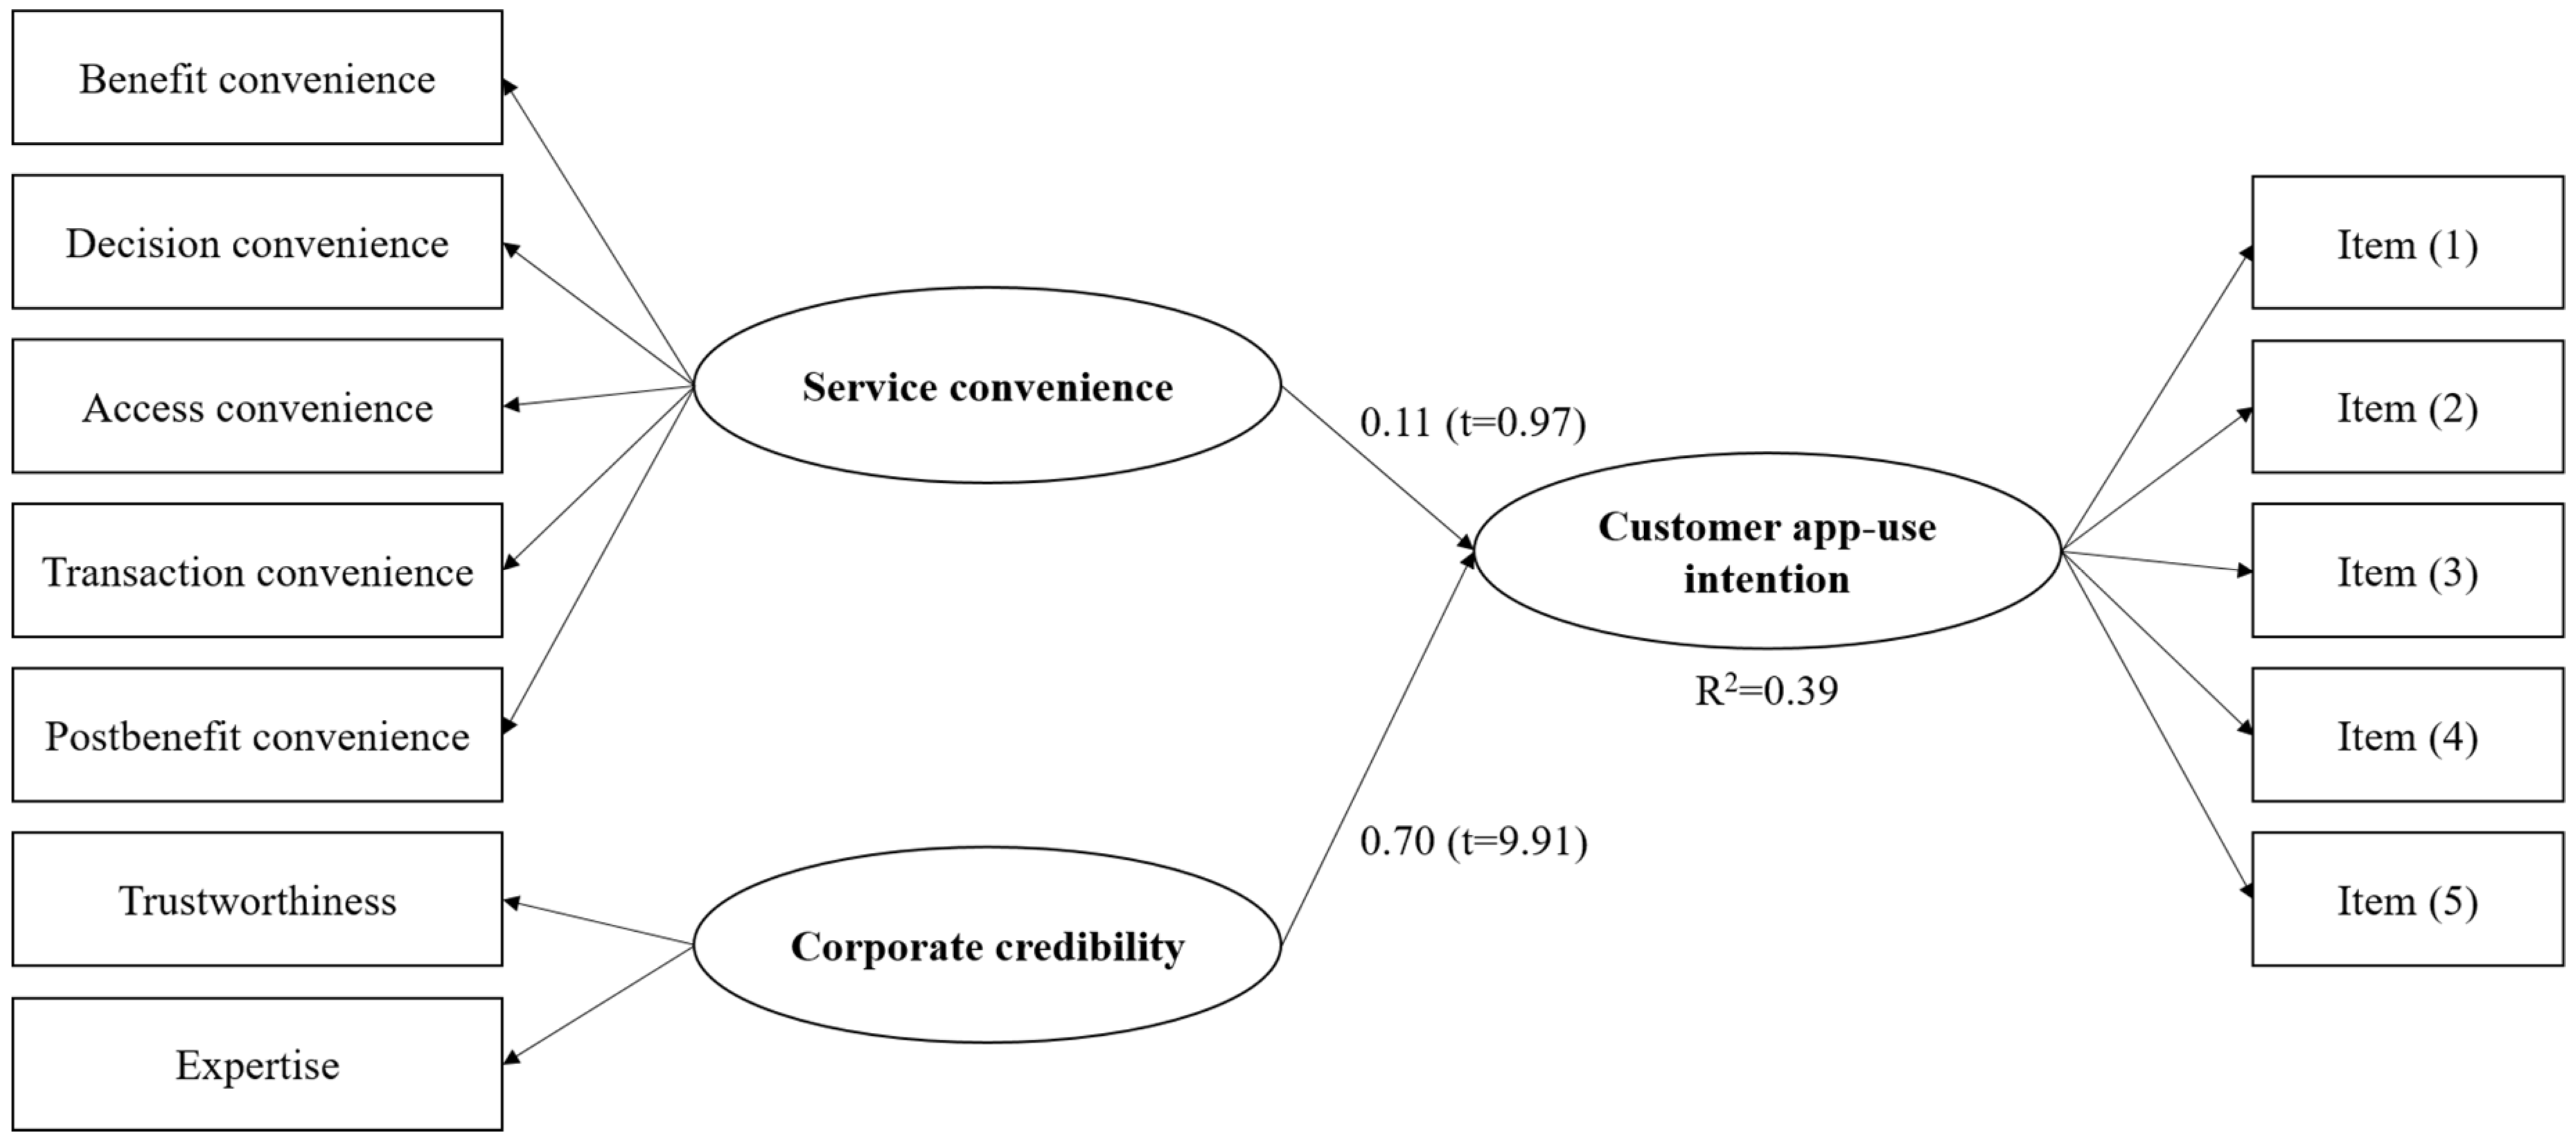
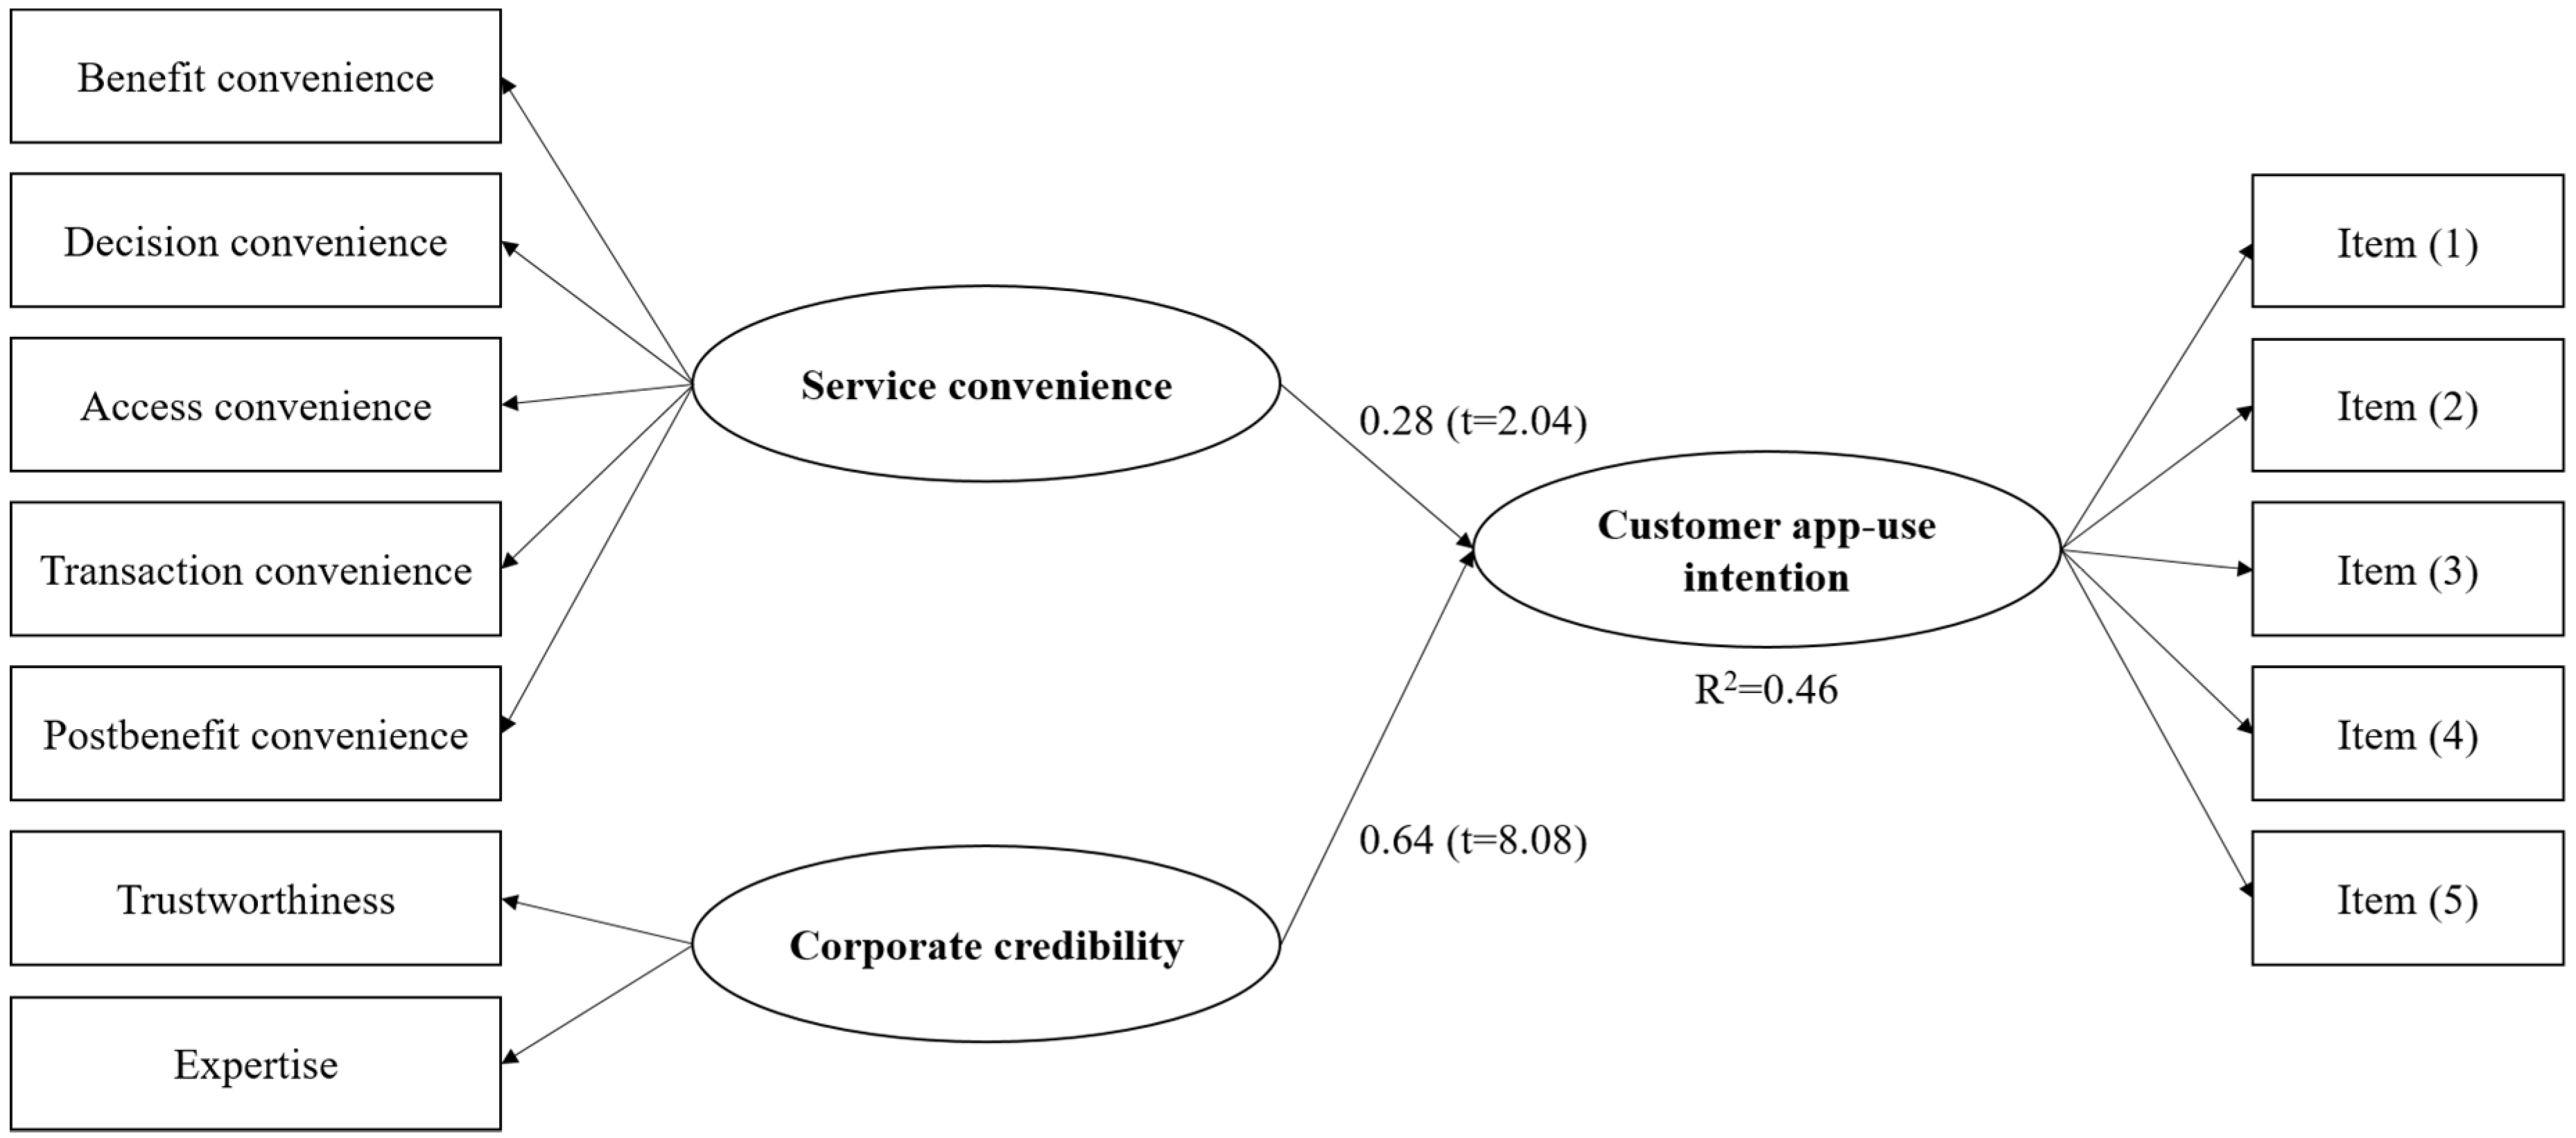
4.5. Verification of the Theoretical Model

Using technology readiness as a classification variable, through the previous cluster analysis results, structural equation modelling was performed to analyze the causal relationships among customers’ technology readiness in relation to the use of the Tigerair Taiwan app, corporate credibility, service convenience, and app-use intentions in three groups. Positive analysis was separately conducted on all the samples and three groups (analysis was repeated four times in total). The measurement model revealed that the values of error variance were positive numbers, and the standard errors of each parameter estimates were few, demonstrating that the basic estimation principles of the model were not violated. The factor loadings for each observational variable were greater than 0.5, indicating that the variables (i.e., indicators) each fully reflected the corresponding latent variables. Table 6 lists the indices of the overall model fit, and each index achieved an acceptable level. Figure 2, Figure 3, Figure 4 and Figure 5 illustrate the empirical results.
As depicted in Figure 2, the path coefficient between service convenience and app-use intentions of the total sample was 0.18 (t = 3.08). Therefore, H1 was confirmed. The path coefficient between corporate credibility and app-use intentions was 0.66 (t = 17.31). Accordingly, H2 was supported. These results validated the hypothesis that service convenience and corporate credibility exerted significant effects on consumers’ intentions to use the ticketing app, and the effect of corporate credibility was higher than that of service convenience. However, the analysis produced results that were considerably different after the data were clustered. Among the aforementioned three groups, corporate credibility exerted the most significant effect on app-use intentions. In the technology exploration group, corporate credibility (ß = 0.64; t = 8.08) and service convenience (ß = 0.28; t = 2.04) significantly affected app-use intentions (Figure 3). However, service convenience (ß = 0.01; t = 0.089) did not significantly influence app-use intentions (Figure 4) in the technology contradiction group. Similarly, in the technology insecurity group, service convenience (ß = 0.11; t = 0.97) did not significantly affect app-use intentions (Figure 5). The values of the four constructs measuring technology readiness among the three groups (Table 4) indicated that service convenience significantly affected app-use intentions in the technology exploration group, which exhibited a low perception of negative constructs (i.e., discomfort and insecurity). Conversely, no significance was discovered between service convenience and app-use intentions in the other two groups, which both presented strong perceptions of negative technology readiness constructs.

5. Conclusions and Discussion

5.1. Conclusions

Through the use of technology readiness as a grouping variable, respondents were segmented into three groups in this study, and the findings were extremely useful. First, among the aforementioned three groups, corporate credibility was confirmed to be the deciding factor in customers’ intentions to use the ticketing app developed by Tigerair Taiwan. As Hanzaee and Taghipourian [59] indicated, corporate credibility positively affects the perceived quality of a product or service. This empirical evidence showed that more favorable perceptions of corporate credibility led to a reduction of the perceived risk. The customers would then increase their intentions to use mobile applications to purchase tickets or related goods.
However, the effects of service convenience varied among the groups. This study contributes to the literature by confirming that technology readiness can serve as a straightforward grouping variable that reveals management implications, when heterogeneity exists in a population. This finding may help researchers identify a theoretical basis for a concept or construct with unobserved heterogeneity. Additionally, the effects of service convenience were less noticeable than those of corporate credibility within the three groups of customers. This empirical evidence showed that the combination of corporate credibility and service convenience variables helps to better understand the status of mobile app use. As Escobar-Rodríguez and Carvajal-Trujillo [60] found, key determinants of purchasing are trust, cost savings, ease of use, performance and hedonic motivation.
In the initial stages of mobile app development, LCCs should focus on customers from the technology exploration group and provide futuristic and innovative services to those customers who tend to experiment with novel technologies, thereby instantly boosting user engagement with the designed app. Technology explorers can be initial promoters and contribute to constructing a customer base for the app. The results presented in Figure 3 suggested that the effect of LCCs’ corporate credibility (ß = 0.64; t = 8.08) was higher than that of app service convenience (ß = 0.28; t = 2.04) on technology explorers’ intentions to use the ticketing app. Therefore, increasing the corporate credibility and designed apps that provide innovative and convenient services, with consumer values, should be LCCs’ major strategies in strengthening app user engagement among technology explorers. The development of the transaction and decision convenience of services is particularly crucial. The five factors of app service convenience may serve as a reference for LCCs in mobile app development. In the app-development stage, LCCs should also analyze demands and perceptions among technology explorers.
In this study, the number of customers in the technology contradiction and insecurity groups was far larger than the number of customers labeled “technology explorers.” In practice, all the aforementioned groups consisted of customers of LCCs. Therefore, we suggest that LCCs should focus on customer retention and innovations in relation to the contradiction and insecurity groups. According to the results in Figure 4 and Figure 5, strong corporate credibility was the main factor that prompted the customers in the technology contradiction and insecurity groups to use the LCC mobile app, and service convenience did not exert a significant effect on these two groups. Kim and Choi [42] indicated that in online shopping settings, the security of electronic transaction cannot be demonstrated, and actual products cannot be seen, that is, access to internal information (e.g., the main features of a product) is limited. Consequently, external information has become consumers’ main reference for product evaluation. Consumers search for various types of external information on the Internet, such as the product manufacturer, retailer, price, and guarantees, to evaluate the product quality or assess a product’s performance risks before purchase. Accordingly, consumers’ trust in a manufacturer affects consumers’ judgment of the product quality and their purchase intentions in relation to the product in question. In short, customers in the technology contradiction and insecurity groups exhibited favorable impressions of firms that had excellent corporate credibility and trustworthiness during the initial stage of mobile app development. These customers referred to corporate credibility and message quality in their decision to use the mobile app and assessed the quality of an LCC’s product according to the expertise and professional image of the LCC. In summary, corporate credibility has become a vital indicator for consumers in their evaluations of products and in their app-use intentions. As Inoue and Kent [61] showed, corporate credibility is a construct that evolved from research in the area of source credibility, where it referred to the state of being perceived as expert and trustworthy, and thereby being seen as worthy of serious consideration by others.

5.2. Management Implications

The effects of corporate credibility on mobile technology readiness and app-use intentions were more significant than those of service convenience. The findings corroborated prior research [40], indicating that source credibility has an impact on attitudes and purchase intentions. Additionally, Kim and Choi [42] emphasized that corporate credibility plays a key role in service quality and risk reduction. Corporate credibility is an essential element in developing marketing measures for customers who are skeptical of cutting-edge technology and must be convinced of technology’s benefits [29]. When an airline is highly credible, its customers’ perceptions of ticketing-app risk decrease, and consumers’ app-use intentions increase. Therefore, LCCs should focus on expertise. For its mobile app services, an LCC should construct a communication mechanism to offer customers ticketing-app-related expertise with simplified content. These features may enhance customers’ perceptions of the security and accuracy of the ticketing app, reduce errors in app-mediated transactions, and demonstrate the high quality of the company’s services through value-creating ticket-purchase procedures. By achieving these goals, an LCC is likely to gain consumers’ trust in its mobile app, and the customers’ willingness to use the ticketing app will increase accordingly.

5.3. Limitations and Suggestions for Future Studies

Differences have gradually developed among LCC business models in Taiwan. For example, LCCs differ in their strategies regarding the availability of business class seats, services for additional charges, and sales of luxury goods. Therefore, the findings of this study may not be applicable to all of these LCCs. The ownership characteristics of joint ventures and regional differences should be considered in related work. Low-cost carriers in Taiwan were established, because traditional airlines noticed the potential of the LCC market. In launching an LCC, a parent company establishes a subsidiary (through investment or joint venture) to create another brand and achieve market segmentation. Thus, the parent company can attract travelers who are sensitive to prices, without interfering with its existing routes and market shares. The established LCC enables its parent to effectively improve its operation and spread the operational risks. Numerous studies have demonstrated that a favorable corporate reputation positively affects customers’ satisfaction, perceived quality, and loyalty [62,63]. Future research may explore whether the corporate reputation of a traditional airline that co-owns an LCC extends to the LCC, triggering automatic loyalty among customers of the parent company. Future studies may also examine the extent to which trust is affected by credibility and the effectiveness of reducing psychological risks in order to increase consumers’ intentions to use an LCC’s app. In addition, this study indicated that most passengers buy tickets from LCCs on websites. However, ticketing apps exhibit a potential growth. Therefore, flight-booking channels (i.e., mobile app and websites) are crucial for determining self-service technology acceptance and consumers’ intentions to use self-service technologies, which in turn may affect the integration of the channels.

Author Contributions

Conceptualization, K.H.C. and P.M.C.; methodology, K.H.C. and P.M.C.; formal analysis, K.H.C.; investigation, P.M.C.; data curation, K.H.C. and P.M.C.; writing—original draft preparation, K.H.C., F.H.C., Y.L.C. and P.M.C.; writing—review and editing, K.H.C., F.H.C. and Y.L.C.; visualization, F.H.C.; supervision, K.H.C. and F.H.C.

Funding

This research received no external funding.

Acknowledgments

We gratefully acknowledge the help provided by constructive comments of the anonymous referees.

Conflicts of Interest

The authors declare no conflict of interest.

References

  1. Stamford, C. Gartner Says Worldwide Mobile Payment Transaction Value to Surpass $235 Billion in 2013. Available online: http://www.gartner.com/newsroom/id/2504915 (accessed on 17 November 2015).
  2. Berry, L.L.; Seiders, K.; Grewal, D. Understanding service convenience. J. Mark. 2002, 66, 1–17. [Google Scholar] [CrossRef]
  3. Cheong, J.H.; Park, M.-C. Mobile internet acceptance in Korea. Internet Res. 2005, 15, 125–140. [Google Scholar] [CrossRef]
  4. Choi, J.; Seol, H.; Lee, S.; Cho, H.; Park, Y. Customer satisfaction factors of mobile commerce in Korea. Internet Res. 2008, 18, 313–335. [Google Scholar] [CrossRef]
  5. Wu, J.-H.; Wang, S.-C. What drives mobile commerce?: An empirical evaluation of the revised technology acceptance model. Inf. Manag. 2005, 42, 719–729. [Google Scholar] [CrossRef]
  6. Goldsmith, R.E.; Lafferty, B.A.; Newell, S.J. The impact of corporate credibility and celebrity credibility on consumer reaction to advertisements and brands. J. Advert. 2000, 29, 43–54. [Google Scholar] [CrossRef]
  7. Greyser, S.A. Advancing and enhancing corporate reputation. Corp. Commun. Int. J. 1999, 4, 177–181. [Google Scholar] [CrossRef]
  8. Verma, R.; Stock, D.; McCarthy, L. Customer preferences for online, social media, and mobile innovations in the hospitality industry. Cornell Hosp. Q. 2012, 53, 183–186. [Google Scholar] [CrossRef]
  9. Liljander, V.; Gillberg, F.; Gummerus, J.; Van Riel, A. Technology readiness and the evaluation and adoption of self-service technologies. J. Retail. Consum. Serv. 2006, 13, 177–191. [Google Scholar] [CrossRef]
  10. Becker, J.-M.; Rai, A.; Ringle, C.M.; Völckner, F. Discovering unobserved heterogeneity in structural equation models to avert validity threats. Mis Q. 2013, 37, 665–694. [Google Scholar] [CrossRef]
  11. Liau, B.Y.; Tan, P.P. Gaining customer knowledge in low cost airlines through text mining. Ind. Manag. Data Syst. 2014, 114, 1344–1359. [Google Scholar] [CrossRef]
  12. Lin, C.H.; Shih, H.Y.; Sher, P.J. Integrating technology readiness into technology acceptance: The TRAM model. Psychol. Mark. 2007, 24, 641–657. [Google Scholar] [CrossRef]
  13. Lin, J.-S.C.; Chang, H.-C. The role of technology readiness in self-service technology acceptance. Manag. Serv. Qual. Int. J. 2011, 21, 424–444. [Google Scholar] [CrossRef]
  14. Fu, X.; Lei, Z.; Wang, K.; Yan, J. Low cost carrier competition and route entry in an emerging but regulated aviation market—The case of China. Transp. Res. Part A Policy Pract. 2015, 79, 3–16. [Google Scholar] [CrossRef]
  15. Klaas, T.; Klein, J. Strategic airline positioning in the German low cost carrier (LCC) market. In Strategic Management in the Aviation Industry; Routledge: New York, NY, USA, 2017; pp. 119–142. [Google Scholar]
  16. O’Connell, J.F.; Connolly, D. The strategic evolution of Aer Lingus from a full-service airline to a low-cost carrier and finally positioning itself into a value hybrid airline. Tour. Econ. 2017, 23, 1296–1320. [Google Scholar] [CrossRef]
  17. Pearson, J.; O’Connell, J.F.; Pitfield, D.; Ryley, T. The strategic capability of Asian network airlines to compete with low-cost carriers. J. Air Transp. Manag. 2015, 47, 1–10. [Google Scholar] [CrossRef]
  18. Clavé, S.A.; Saladié, Ò.; Cortés-Jiménez, I.; Young, A.F.; Young, R. How different are tourists who decide to travel to a mature destination because of the existence of a low-cost carrier route? J. Air Transp. Manag. 2015, 42, 213–218. [Google Scholar] [CrossRef]
  19. De Wit, J.G.; Zuidberg, J. Route churn: An analysis of low-cost carrier route continuity in Europe. J. Transp. Geogr. 2016, 50, 57–67. [Google Scholar] [CrossRef]
  20. Tsui, K.W.H. Does a low-cost carrier lead the domestic tourism demand and growth of New Zealand? Tour. Manag. 2017, 60, 390–403. [Google Scholar] [CrossRef]
  21. Stern, S.E.; Kipnis, D. Technology in Everyday Life and Perceptions of Competence1. J. Appl. Soc. Psychol. 1993, 23, 1892–1902. [Google Scholar] [CrossRef]
  22. Dabholkar, P.A. Consumer evaluations of new technology-based self-service options: An investigation of alternative models of service quality. Int. J. Res. Mark. 1996, 13, 29–51. [Google Scholar] [CrossRef]
  23. Dabholkar, P.A.; Bagozzi, R.P. An attitudinal model of technology-based self-service: Moderating effects of consumer traits and situational factors. J. Acad. Mark. Sci. 2002, 30, 184–201. [Google Scholar] [CrossRef]
  24. Kleijnen, M.; Wetzels, M.; De Ruyter, K. Consumer acceptance of wireless finance. J. Financ. Serv. Mark. 2004, 8, 206–217. [Google Scholar] [CrossRef]
  25. Ferreira, J.B.; da Rocha, A.; da Silva, J.F. Impacts of technology readiness on emotions and cognition in Brazil. J. Bus. Res. 2014, 67, 865–873. [Google Scholar] [CrossRef]
  26. BAŞGÖZE, P. Integration of Technology Readiness (TR) into the Technology Acceptance Model (TAM) for m-shopping. Int. J. Sci. Res. Innov. Technol. 2015, 2, 26–35. [Google Scholar]
  27. Parasuraman, A. Technology Readiness Index (TRI) a multiple-item scale to measure readiness to embrace new technologies. J. Serv. Res. 2000, 2, 307–320. [Google Scholar] [CrossRef]
  28. Parasuraman, A.; Colby, C.L. An updated and streamlined technology readiness index TRI 2.0. J. Serv. Res. 2015, 18, 59–74. [Google Scholar] [CrossRef]
  29. Parasuraman, A.; Colby, C.L. Techno-Ready Marketing; The Free Press: New York, NY, USA, 2001. [Google Scholar]
  30. Copeland, M.T. Relation of consumers’ buying habits to marketing methods. Harv. Bus. Rev. 1923, 1, 282–289. [Google Scholar]
  31. Brown, L.G. Convenience in services marketing. J. Serv. Mark. 1990, 4, 53–59. [Google Scholar] [CrossRef]
  32. Davis, M.M.; Vollmann, T.E. A framework for relating waiting time and customer satisfaction in a service operation. J. Serv. Mark. 1990, 4, 61–69. [Google Scholar] [CrossRef]
  33. Berry, L.L. Time-buying consumer. J. Retail. 1979, 55, 58–69. [Google Scholar]
  34. Yale, L.; Venkatesh, A. Toward the construct of convenience in consumer research. Na-Adv. Consum. Res. 1986, 13, 403–408. [Google Scholar]
  35. Roy, S.K.; Shekhar, V.; Lassar, W.M.; Chen, T. Customer engagement behaviors: The role of service convenience, fairness and quality. J. Retail. Consum. Serv. 2018, 44, 293–304. [Google Scholar] [CrossRef]
  36. Chang, M.-Y.; Chen, K.; Pang, C.; Chen, C.-M.; Yen, D.C. A study on the effects of service convenience and service quality on maintenance revisit intentions. Comput. Stand. Interfaces 2013, 35, 187–194. [Google Scholar] [CrossRef]
  37. Gehrt, K.C.; Yale, L.J. The dimensionality of the convenience phenomenon: A qualitative reexamination. J. Bus. Psychol. 1993, 8, 163–180. [Google Scholar] [CrossRef]
  38. Craig, C.S.; McCann, J.M. Assessing communication effects on energy conservation. J. Consum. Res. 1978, 5, 82–88. [Google Scholar] [CrossRef]
  39. Ohanian, R. Construction and validation of a scale to measure celebrity endorsers’ perceived expertise, trustworthiness, and attractiveness. J. Advert. 1990, 19, 39–52. [Google Scholar] [CrossRef]
  40. Idris, A.; Hati, S.R.H. Corporate Credibility, Religion and Customer Support Intention toward Social Enterprises. In Social Enterprise-Context-Dependent Dynamics in A Global Perspective; IntechOpen: London, UK, 2016. [Google Scholar]
  41. Keller, K.L. Strategic Brand Management; Prentice Hall: Upper Saddle River, NJ, USA, 1998. [Google Scholar]
  42. Kim, S.; Choi, S.M. Credibility cues in online shopping: An examination of corporate credibility, retailer reputation, and product review credibility. Int. J. Internet Mark. Advert. 2012, 7, 217–236. [Google Scholar] [CrossRef]
  43. Tseng, S.; Fogg, B. Credibility and computing technology. Commun. ACM 1999, 42, 39–44. [Google Scholar] [CrossRef]
  44. Melo, T.; Garrido-Morgado, A. Corporate reputation: A combination of social responsibility and industry. Corp. Soc. Responsib. Environ. Manag. 2012, 19, 11–31. [Google Scholar] [CrossRef]
  45. Musgrove, C.F.; Choi, P.; Chris Cox, K. Consumer Perceptions of Green Marketing Claims: An Examination of the Relationships with Type of Claim and Corporate Credibility. Serv. Mark. Q. 2018, 1–16. [Google Scholar] [CrossRef]
  46. Soesilo, P.K.; Gunadi, W.; Arimbi, I.R. The effect of endorser and corporate credibility on perceived risk and consumer confidence: The case of technologically complex products. J. Mark. Commun. 2018, 1–21. [Google Scholar] [CrossRef]
  47. Zhang, B.; Ritchie, B.; Mair, J.; Driml, S. Is the Airline Trustworthy? The Impact of Source Credibility on Voluntary Carbon Offsetting. J. Travel Res. 2018. [Google Scholar] [CrossRef]
  48. Rust, R.T.; Verhoef, P.C. Optimizing the marketing interventions mix in intermediate-term CRM. Mark. Sci. 2005, 24, 477–489. [Google Scholar] [CrossRef]
  49. Spina, C. Finding, evaluating, and sharing new technology. Ref. User Serv. Q. 2014, 53, 217–220. [Google Scholar]
  50. Hurley, R.F. Customer service behavior in retail settings: A study of the effect of service provider personality. J. Acad. Mark. Sci. 1998, 26, 115–127. [Google Scholar] [CrossRef]
  51. Khalifa, M.; Ning Shen, K. Explaining the adoption of transactional B2C mobile commerce. J. Enterp. Inf. Manag. 2008, 21, 110–124. [Google Scholar] [CrossRef]
  52. Song, K.; Fiore, A.M.; Park, J. Telepresence and fantasy in online apparel shopping experience. J. Fash. Mark. Manag. Int. J. 2007, 11, 553–570. [Google Scholar] [CrossRef]
  53. Featherman, M.S.; Miyazaki, A.D.; Sprott, D.E. Reducing online privacy risk to facilitate e-service adoption: The influence of perceived ease of use and corporate credibility. J. Serv. Mark. 2010, 24, 219–229. [Google Scholar] [CrossRef]
  54. Jarvenpaa, S.L.; Tractinsky, N.; Vitale, M. Consumer trust in an Internet store. Inf. Technol. Manag. 2000, 1, 45–71. [Google Scholar] [CrossRef]
  55. Walker, M.; Kent, A. The roles of credibility and social consciousness in the corporate philanthropy-consumer behavior relationship. J. Bus. Ethics 2013, 116, 341–353. [Google Scholar] [CrossRef]
  56. Keller, K.L. Strategic Brand Management: Building, Measuring, and Managing Brand Equity; Prentice Hall: Upper Saddle River, NJ, USA, 2012. [Google Scholar]
  57. Chen, K.-H.; Yang, C.-H. The Service Factors and Market Segmentation for Mobile Commerce Customers: An Empirical Study on T Express of Taiwan High Speed Rail. J. Tour. Leis. Stud. 2013, 19, 279–306. [Google Scholar]
  58. Mallat, N.; Rossi, M.; Tuunainen, V.K.; Öörni, A. The impact of use context on mobile services acceptance: The case of mobile ticketing. Inf. Manag. 2009, 46, 190–195. [Google Scholar] [CrossRef]
  59. Hanzaee, K.H.; Taghipourian, M.J. The effects of brand credibility and prestige on consumers purchase intention in low and high product involvement. J. Basic Appl. Sci. Res. 2012, 2, 1281–1291. [Google Scholar]
  60. Escobar-Rodríguez, T.; Carvajal-Trujillo, E. Online purchasing tickets for low cost carriers: An application of the unified theory of acceptance and use of technology (UTAUT) model. Tour. Manag. 2014, 43, 70–88. [Google Scholar] [CrossRef]
  61. Inoue, Y.; Kent, A. Investigating the role of corporate credibility in corporate social marketing: A case study of environmental initiatives by professional sport organizations. Sport Manag. Rev. 2012, 15, 330–344. [Google Scholar] [CrossRef]
  62. Gorondutse, A.; Hilman, H.; Nasidi, M. Relationship between corporate reputation and customer loyalty on Nigerian food and beverages industry: PLS approach. Int. J. Manag. Bus. Res. 2014, 4, 125–136. [Google Scholar]
  63. Walsh, G.; Dinnie, K.; Wiedmann, K.-P. How do corporate reputation and customer satisfaction impact customer defection? A study of private energy customers in Germany. J. Serv. Mark. 2006, 20, 412–420. [Google Scholar] [CrossRef]
Figure 1. Research framework.
Sustainability 11 00810 g001
Figure 2. Empirical results of Model I (n = 815, the total sample, non-grouping).
Sustainability 11 00810 g002
Figure 3. Empirical results of Model II (n = 226, the technology exploration group).
Sustainability 11 00810 g003
Figure 4. Empirical results of Model III (n = 265, the technology contradiction group).
Sustainability 11 00810 g004
Figure 5. Empirical results of Model IV (n = 322, the technology insecurity group).
Sustainability 11 00810 g005
Table 1. Demographic information and travel patterns of respondents.
VariableSample SizePercentage (%)
GenderMale35643.7
Female45956.3
Age≤20 years526.4
21–30 years41450.8
31–40 years19724.2
41–50 years9211.3
≥51 years607.4
OccupationStudent18823.1
Military, police, civil servant, and teacher11414.0
Business person9011.0
Service worker10412.8
Freelancer14718.0
Laborer344.2
Housekeeper516.3
Retired111.3
Other759.2
EducationJunior high school graduate (or below)30.4
Senior high school/vocational school graduate566.9
Bachelor’s degree55668.2
Graduate degree19724.2
Income per month (NTD)≤20,00018823.1
20,000–40,00021025.8
40,000–60,00018022.1
60,000–80,0009211.3
80,000–100,000668.1
≥100,000647.9
Annual air travel frequency≤3 trips47057.7
4–6 trips25030.7
7–9 trips496.0
≥10 trips445.4
Most frequent channel used for buying Tigerair Taiwan flight ticketsOnline booking67682.9
Customer service center819.9
app485.9
Travel agency101.2
Experience buying tickets on the Tigerair Taiwan appYes20725.4
No60874.6
Travel purpose(s) when taking Tigerair Taiwan flights (multiple answers)Leisure71187.2
Business769.3
Visiting relatives and friends9611.8
Education404.9
Business events232.8
Table 2. Exploratory factor analysis of service convenience.
FactorObservational VariableItemFactor LoadingCronbach’s Alpha
Benefit convenienceSA1Purchase of extra baggage (checked and carry-on baggage) is available.0.7280.764
SA2Service inquiry for passengers with special requirements is available.0.669
SA3Seat selection is available.0.614
SA4Instant booking is available on app before departure.0.601
SA5Live flight status (departures and arrivals) is available.0.584
SA6Weather forecast is provided.0.520
Decision convenienceSB1The app is instantaneously updated.0.7730.76
SB2The app is easy to use.0.761
SB3Tickets and up-to-date flight schedule are available on the app at all times.0.651
SB424-h ticketing service is provided.0.640
Access convenienceSC1The app stores and maintains complete ticketing-related information.0.7540.753
SC2A passenger’s seat is automatically arranged next to that of the accompanying passenger(s) (if any).0.705
SC3The app is available for different mobile device operating systems.0.642
SC4Passengers are free to go back and forth when booking a flight on the app.0.631
Transaction convenienceSD1Travel history can be tracked using the app.0.7350.733
SD2A transaction management system is attached.0.679
SD3Changes of flight schedule trigger alerts.0.660
SD4Multiple methods of payment are available.0.613
Post-benefit convenienceSE1In-flight meals and duty-free goods can be reserved through the app.0.8170.765
SE2Hotel bookings for the destination are available on the app.0.807
SE3Traffic information between the airport and downtown area of the destination is provided through the app.0.647
Table 3. Confirmatory factor analysis of technology readiness, corporate credibility, and customers’ app-use intentions.
Latent VariableItemFactor LoadingError VarianceAverage Variance ExtractedComposite Reliability
Technology readiness
Optimism
(M = 4.09)
TRO10.520.240.570.84
TRO20.620.22
TRO30.590.22
TRO40.580.32
Innovativeness
(M = 3.43)
TRI10.650.410.540.82
TRI20.930.49
TRI30.560.62
TRI40.800.42
Discomfort
(M = 3.12)
TRD10.840.310.510.80
TRD20.570.53
TRD30.590.70
TRD40.820.45
Insecurity
(M = 3.57)
TRS10.500.540.530.81
TRS20.870.37
TRS30.830.42
TRS40.690.61
Corporate credibility
Trustworthiness
(M = 3.66)
reliable0.600.160.720.91
honest0.590.13
trustworthy0.640.10
sincere0.600.19
Expertise
(M = 3.60)
an expert0.640.130.630.90
experienced0.580.25
knowledgeable0.590.17
qualified0.550.22
skilled0.560.23
Customers’ app-use intentions
(M = 3.42)
(I1) I will encourage my friends to use the Tigerair Taiwan app0.650.250.640.90
(I2) I will frequently use the Tigerair Taiwan app0.750.30
(I3) I will recommend the Tigerair Taiwan app to others0.760.15
(I4) I will not reduce the frequency of my use of the Tigerair Taiwan app0.610.30
(I5) I trust the quality of the Tigerair Taiwan app0.610.27
Table 4. Correlation coefficient of technology readiness, corporate credibility, and customers’ app-use intentions.
OptimismInnovativenessDiscomfortInsecurityTrustworthinessExpertiseCustomers’ App-Use Intentions
Optimism1
Innovativeness0.4511
Discomfort0.0230.3111
Insecurity−0.042−0.0240.3241
Trustworthiness0.2850.2100.0200.0531
Expertise0.2980.2070.0350.0550.7771
Customers’ app-use intentions0.3530.3190.1440.0650.5930.5481
Table 5. Results of cluster analysis.
Technology Readiness FactorGroupsp-ValuePost-Hoc Comparison
Technology Exploration
(n = 226) (1)
Technology Contradiction
(n = 265) (2)
Technology Insecurity
(n = 322) (3)
Optimism4.284.373.610.000 ***2,1 > 3
Innovativeness3.553.942.930.000 ***2 > 1 > 3
Discomfort2.653.772.920.000 ***2 > 3 > 1
Insecurity2.654.003.870.000 ***2 > 3 > 1
Notes: *** at a level of p = 0.001.
Table 6. Fit indices of four empirical models.
Model Fit IndexOptimal ValueActual Value
Model I
(n = 815)
Model II
(n = 226)
Model III
(n = 265)
Model IV
(n = 322)
χ2Low values are optimal120.5471.7792.89112.27
χ2/df<32.741.591.942.91
GFI>0.90.980.950.940.94
AGFI>0.90.960.910.910.91
NFI>0.90.980.940.940.94
CFI>0.90.980.980.970.97
PGFI>0.50.550.550.580.59
RMSEA<0.080.0460.0510.060.063
RMR<0.050.0240.0250.0230.027
Critical N>200458.77213.85201.59213.19

