Abstract
There are few studies examining the wellbeing benefits from exposure to natural environments differing in ecological attributes, such as biodiversity, and they have not had consistent results. This study progresses our understanding of the nuanced relationship between nature and wellbeing by analyzing the self-reported benefits derived from urban green spaces varying in a range of objectively measured biodiversity attributes such as bird species richness, habitat diversity, and structural heterogeneity. Respondents’ (n = 840) perceptions of biodiversity and naturalness were also examined. We identified the biodiversity attributes most strongly associated with particular benefits, as well as the types of parks where those benefits were significantly more likely to occur. Findings suggest that perceived, rather than objective measures of biodiversity are better predictors of subjective wellbeing benefits. Of the assessed biodiversity attributes, vegetation cover consistently correlated most strongly with psychological benefits. Stress reduction and mood improvement were greatest in nature parks and lowest in pocket parks. Increases in each biodiversity attribute significantly affected psychological wellbeing at different thresholds, suggesting the relationship between biodiversity and wellbeing is not linear. Thresholds of sensitivity for park attributes are discussed, with vegetation cover, naturalness, structural heterogeneity, and park type emerging as the most useful differentiators for studying human responses to nature. Our findings can help inform green space planning to maximize environmental benefits and health benefits concurrently.
1. Introduction
The accelerating decline in global biodiversity is unquestionably one of the most pressing environmental issues of our time. Despite efforts to halt species loss, extinctions are now occurring at an estimated 1000 times the background or ‘pre-human’ rate [1]. Whilst its drivers are many, from pollution to deforestation, ultimately, our collective extinction scorecard speaks volumes about the conservation values held by many modern societies. As Robertson and Hull [2] argue, “conservation goals derive from people’s values and beliefs about nature and human society,” and thus, species loss may be symptomatic of a growing disconnect between humans and the natural world [3]. Even when the public has a good understanding of environmental issues, the ‘psychological distance’ between many of these issues and their day-to-day lives limits most individuals’ willingness to take action [4]. Directly experiencing the consequences of environmental problems is thought to increase concern and elicit behaviour change [5], however, pre-empting these negative experiences by instead highlighting the ways in which people frequently benefit from positive environmental conditions, such as a diversity of plant and animal species, might also lead to increased advocacy and concern for their protection. To achieve this, individuals must be aware of the positive environmental condition (e.g., biodiversity) and also perceive that it has a beneficial effect on their wellbeing. For this reason, the present study focuses on self-reported psychological wellbeing, whilst acknowledging that a wide range of important health benefits derived from nature are not dependent on human perceptions of the environment (e.g., the influence of biodiversity on the development of normal immune responses [6]).
The body of literature supporting a link between nature and psychological wellbeing is extensive, and encompasses a wide range of benefits such as restoration from mental fatigue, improved stress recovery, and positive changes to mood and self-esteem [7,8]. In light of this, researchers have begun exploring whether greater biodiversity has a positive effect on wellbeing [9], but to date, the results of this research have not been conclusive (see Appendix A). In one of the earliest studies exploring the relationship between biodiversity and self-reported wellbeing, Fuller et al. [10] identified positive associations between psychological benefits such as “reflection” and plant species richness, and determined that participants were able to detect plant species richness fairly accurately. Self-reported benefits were also associated with bird species richness, the size of parks, and the number of habitat types they contained. In contrast, when using the same methods as the 2007 study, Dallimer et al. [11] found no consistent relationship between plant species richness and psychological benefits. They found that benefits increased with perceived biodiversity, however, respondents’ perceptions were markedly inaccurate. Further studies have highlighted the inability of laypeople to perceive differences in biodiversity [12,13]. More recently, Carrus, et al. [14] found that perceived restorativeness varied amongst four types of green space, ranging from an urban square to a protected area; settings selected because they reflected differences in biodiversity. Carrus and colleagues [14] did not assess biodiversity perceptions. Also using a typology of three park types, Van den Berg, et al. [15] found no significant differences in perceived restorativeness between natural conditions using an experimental design.
Given the results of existing research in this field, it is not yet clear whether a relationship exists between perceived or objective measures of biodiversity and perceived wellbeing. There are several limitations in the extant literature on this topic that point to the need for a more systematic evaluation of the issue: (a) Not all studies have examined perceptions of biodiversity to test its effects on the benefits derived from nature experiences; (b) studies have assessed biodiversity using different methods, ranging from counts of species richness, to structural variation, to naturalness, to broad park types; (c) studies have measured different wellbeing outcomes; (d) studies have examined relatively few sites, e.g., 15 sites in Fuller, et al. [10]; 34 sites in Dallimer, et al. [11]; four sites in Carrus, et al. [14] and three natural sites in Van den Berg, et al. [15]; and (e) there have been few experimental studies controlling for potentially confounding variables such as social interaction during nature experiences.
Different types of urban green spaces, such as sports parks and community parks, are known to facilitate different types of wellbeing benefits amongst park visitors [16,17]. Furthermore, those different types of green spaces vary in size and shape [16] and differ in the ways they are both perceived and valued by the public [17]. Although few studies in the biodiversity-human wellbeing literature have used classification systems to differentiate green spaces (i.e., because the focus has been on specific attributes such as species richness), we believe park classifications are an accessible means of operationalising findings in this field. Using a simple park typology, Carrus, et al. [14] found differences in the restorative abilities of urban and peri-urban parks of high and low biodiversity, however, visual assessment of the four parks included in that study suggests they also differed in size, canopy cover, type of ground cover, and intended use, which may also influence wellbeing outcomes (e.g., Fuller, et al. [10,11], Dallimer, et al. [11], Nordh, et al. [18], Brown, et al. [16]. Thus, whilst it is useful to know that different types of green spaces facilitate different wellbeing outcomes, it is important that the components of park types in any given classification system be assessed and controlled for when examining the wellbeing outcomes derived from them.
This paper builds on previous work in this area exploring the following:
- The relationship between self-reported wellbeing benefits and objectively measured biodiversity attributes (naturalness, structural heterogeneity, habitat diversity, bird species richness, vegetation cover, park size).
- The relationship between self-reported wellbeing benefits and perceptions of park attributes (perceived biodiversity, perceived naturalness, perceived canopy cover).
- The relationship between self-reported wellbeing benefits and park type.
- The relationship between respondent characteristics, biodiversity attributes, and the attainment of wellbeing benefits.
2. Materials and Methods
2.1. Study Area and Scope
This study took place across three metropolitan Local Government Areas (LGAs) in the state of South Australia. The cities of Burnside, Unley, and Mitcham are located close to the state’s capital city, Adelaide, as shown in Appendix B. This region was selected as it contains a high number of green spaces of different types, and because the local governments in this area were interested in understanding how the public uses and benefits from urban green space. The region covers an area of 118 km2 and houses approximately 150,000 inhabitants [19]. A database comprising all formal, publicly accessible green spaces within the study area was created using GIS data obtained from each local government. Green spaces between 0.4 ha (1 acre) and 8 ha (20 acres) in size were identified, and all of them were assessed on-site using a variety of rapid assessment tools. In consultation with local government, we included 13 parks larger than 8 ha in the study, as they were known to be popular with the public, to make a total of 134 parks. Following a public questionnaire, parks that were identified by 20 or more respondents were also assessed remotely using i-Tree Canopy software.
Green spaces were classified into four types using a modified NRPA (National Recreation and Park Association) park typology [20], in the same vein as Brown, et al. [16] and Schebella, et al. [17] (Table 1). As in those earlier studies, we made several modifications to the NRPA classification that were appropriate to our study area. Given the number of very small urban parks in the present study, we retained the mini-park classification (now “pocket parks”) and combined neighbourhood and community parks into a single classification. The NRPA size guideline for a community park is 30–50 acres (12–20 ha), and there were only two parks in the study area within this size range that were not more appropriately classified as another park type. As neighbourhood and community parks are largely delineated by size, rather than features or intended use, we chose to combine the two classifications. Further changes include the exclusion of several NRPA park types: Private parks and large urban parks, as they were not present in the study area; school parks, as they are often not publicly accessible; and greenways, as the only potential greenway in the study area was comprised of three separate but similar parks that appeared as extensions of the botanic garden they stemmed from. Given they were separated by roads and contained very similar natural features to the botanic garden, we believed they were more appropriately classified as nature parks.

Table 1.
The park classifications used in the present study, with rationale for changes made to the original National Recreation and Park Association (NRPA) park types developed by Mertes and Hall [20].
2.2. Park Attributes
On-site assessments of park attributes—including estimates of biodiversity and naturalness—were conducted in 121 urban parks that met the 0.4–8 ha size criterion (full assessment of the 13 larger parks was impractical due to their size). Naturalness was assessed using the Urban Park Naturalness Index (UPNI), adapted from Machado’s [21] Index of Naturalness. Biodiversity was estimated using structural heterogeneity and habitat heterogeneity checklists, as well as bird surveys. The checklists were modified from existing assessment tools, and were tested for consistency among multiple assessors in 12 urban parks prior to being used at all 121 sites. The assessment tools and on-site assessment procedure are described in (publication in press). Vegetation cover, as well as impermeable and permeable surface cover was assessed remotely in the 44 most popular parks using i-Tree Canopy software, which was developed by the USDA Forest Service (www.canopy.itreetools.org/). We sampled a minimum of 500 random points in each park until the standard error for all land feature classes was less than 2%, irrespective of park size.
2.3. Perceived Attributes and Benefits
A mail-back questionnaire was delivered to 4000 households across the three LGAs. Each LGA was divided into zones prior to questionnaire distribution. Within each zone, specific quotas of surveys were allocated to major and minor roads, and they were delivered by a contractor to every third letterbox along these roads. This ensured questionnaires were distributed throughout the study area. Questionnaires were delivered with a reply-paid envelope and a colour-printed A3 map highlighting the 134 green spaces in the study (Appendix C). The questionnaire explored a range of issues, including respondents’ perceptions and use of urban parks; the physical and psychological health benefits they believe they derive from them; and their level of environmental knowledge and nature connectedness. It also included a range of demographic questions. Examples of questions included in the study are shown in Appendix D. Respondents were asked to select up to four green spaces in their local area they visit, from the list of 134 parks. They then answered a series of questions about the benefits derived from each park, and their perceptions of the physical environment. ‘Benefits’ questions identified the main benefits respondents believe they derive from visiting each park, as well as the perceived level of physical and psychological benefit attained. Respondents were asked to indicate the effect they believed a “typical visit” to each location would have on their stress, mood, self-esteem, and ability to concentrate, on 11-point scales from 0 “no change” to 10 “a very big improvement”. ‘Perceptions’ questions provided insight into the perceived variety of plant and animal species present at each park, the perceived degree of naturalness, and the perceived amount of canopy cover, answered using seven-point scales.
2.4. Data Analysis
Wellbeing benefits were measured using 11-point ordinal scales in response to the question “how do you think a typical visit to each of these green spaces would improve the following aspects of your wellbeing?” As such, ordinal regression modelling techniques were first explored as a means of assessing the predictive power of park attributes and perceived park attributes for these benefits. However fundamental modelling assumptions for ordinal procedures were not met. As such, multiple linear regression was applied, with the wellbeing variables treated as ordinal approximations to continuous variables [22]. The data supported this approach as the specified criteria for continuous treatment were each satisfied [22], namely the sample size was sufficiently large, the ordinal variables each had at least five levels and were not significantly skewed. This approach offers the advantageous preservation of the ordered nature of the data, which would have been otherwise lost through alternative modelling techniques for categorical data, such as multinomial regression. Analyses were conducted in SPSS version 24.
We examined correlations between perceived biodiversity, perceived naturalness, and four wellbeing benefits (self-reported improvements to stress, mood, concentration, and self-esteem). We also examined correlations between assessed green space attributes (naturalness, structural heterogeneity, habitat heterogeneity, vegetation cover, and bird species richness) and the four wellbeing benefits. Following this, we examined which attributes and perceived attributes had the strongest linear relationship with our respondents’ wellbeing outcomes through multiple regression.
Questionnaire respondents were asked to identify the main benefit they believed they attained from a typical visit to each park, by selecting from a list of seven potential benefits (Table 1). The list was adapted from the 12 benefits used in a study by Brown, et al. [16], which were derived from the Recreation Experience Preference items developed and validated by Driver and colleagues [23,24], and influenced by research conducted in Australian parks by Weber and Anderson [25]. We provided a shorter list of benefits by combining benefits that were similar (e.g., “spend time with friends” and “connect with family” were combined to form the benefit “spend time with friends/family”). As we intended to group benefits into four domains (Table 2), as per Brown, et al. [16] and Moore and Driver [26], we believed the lack of distinction between related benefits to be a minor loss of data.
Table 2.
The list of benefits used in the study. Each benefit was classified into one of four benefit domains, adapted from previous research [16,17,26].
2.5. Respondent Characteristics
A total of 840 questionnaires were returned, giving a final response rate of 21%. Respondents were largely female (62%); highly educated (64% with a bachelor’s degree or higher); married or in a de facto relationship (74%); and either working full-time (36%) or retired (34%). Although the greatest percentage of respondent households were couples with no children at home (37%), there were also many sole adult households (18%), families with children over 18 years of age (17%), and families with children aged 7–18 years (17%). Respondent ages ranged from 15 to 99 years, with a median age of 59 years (mean 58.31 years). Comparing this to national census data, we can see that despite the large sample size, our respondents are not strictly representative of the populations in the three LGAs, which are younger (median age of 42 years) with a lower proportion of females (52.5% female) [27,28,29].
3. Results
3.1. The Relationship between Self-Reported Wellbeing Benefits and Objectively Measured Biodiversity Attributes
The relationship between wellbeing benefits (i.e., self-reported improvements to stress, mood, concentration, and self-esteem) and biodiversity attributes (i.e., structural heterogeneity, naturalness, habitat diversity, bird species richness, vegetation cover, and park size), was first explored using Spearman correlations (Figure 1). All correlations were significant, with the exceptions of those between naturalness and concentration (p = 0.331), naturalness and self-esteem (p = 0.782), and structural elements and self-esteem (p = 0.062), however, those between wellbeing measures and biodiversity attributes were very weak to weak associations. Improvements to stress and mood were correlated most strongly with vegetation cover, however, it was a weak relationship (r = 0.254 and r = 0.239, respectively).
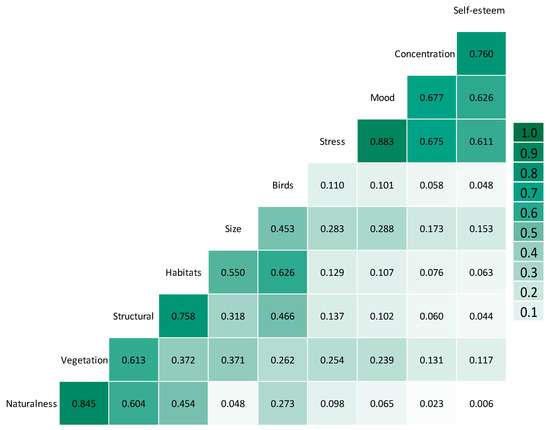
Figure 1.
Heat map visualisation of pairwise Spearman correlation coefficients. Colours represent the strength of the correlation between variables. All correlations in the matrix are statistically significant, with the exceptions of naturalness and concentration, and naturalness and self-esteem.
A series of multiple linear regressions were performed to separately examine the relative effects of the objectively measured biodiversity attributes on each one of the four self-reported wellbeing benefits. Within each regression model, habitat diversity and naturalness were removed due to high collinearity with other biodiversity attributes, assessed using the Variance Inflation Factor (VIF) scores [30]. With the exclusion of these two attributes, all remaining VIF scores were less than two with no further issues of multicollinearity present. All remaining assumptions of multiple linear regression were sufficiently satisfied without further issues.
The remaining biodiversity attributes significantly predicted self-reported improvements to stress (F4, 1395 = 10.443, p < 0.01), mood (F4, 1395 = 6.953, p < 0.01), and concentration (F4, 1387 = 2.551, p < 0.05), but not self-esteem. The results show that the assessed biodiversity attributes are poor predictors of self-reported wellbeing benefits (Table 3). Whilst the predictive power of the models overall is poor—and not unexpected given the weak correlation structure, shown in Figure 1—they still provide insight into the relationships between biodiversity attributes and human wellbeing outcomes. When controlling for vegetation cover, no other biodiversity attribute is a significant predictor of wellbeing outcomes, and on its own, vegetation cover is a stronger predictor of psychological wellbeing (R2 = 0.057) than the combined park attributes model.
Table 3.
Results of four separate multiple linear regressions. The outcome variables are self-reported wellbeing benefits, and predictor variables comprise structural heterogeneity, bird species richness, park size, and vegetation cover.
The analysis was extended to examine differences in the attainment of psychological benefits between parks exhibiting very low, low, moderate, and high levels of each biodiversity attribute (Figure 2 and Figure 3) using one-way ANOVA with Tukey post hoc tests. Each attribute was divided into four equal groups based on the range of values recorded from the biodiversity assessments, as shown in Appendix E. Improvements to concentration and self-esteem were not included in the tests, because they did not meet the assumption of homogeneity of variances, as assessed by Levene’s test for equality of variances (p = 0.027 for concentration and p = 0.019 for self-esteem). Thus, we examined only improvements to stress and mood.
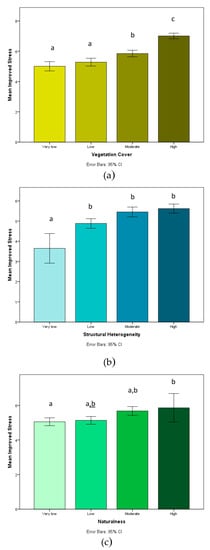
Figure 2.
Mean improvement to self-reported stress at different levels of (a) vegetation cover, (b) structural heterogeneity, and (c) naturalness. Within each figure, labels above the bars denote significant differences between variables.
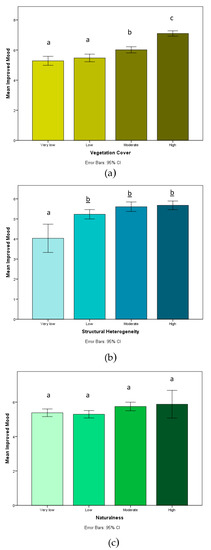
Figure 3.
Mean improvement to self-reported mood at different levels of (a) vegetation cover, (b) structural heterogeneity, and (c) naturalness. Within each figure, labels above the bars denote significant differences between variables.
There were statistically significant differences in improvements to stress and mood for all biodiversity attributes, but not between all levels of each attribute (hence the weak linear relationship between psychological benefits and the physical characteristics of the parks). The strongest differences were in vegetation cover (F3, 2322 = 57.903, p < 0.001) for stress and (F3, 2325 = 53.171, p < 0.001) for mood; structural heterogeneity (F3, 1840 = 13.813, p < 0.001) for stress and (F3, 1843 = 8.350, p < 0.001) for mood; and naturalness (F3, 1840 = 5.521, p = 0.001) for stress and (F3, 1843 = 2.972, p = 0.031) for mood.
For vegetation cover (Figure 2a and Figure 3a), significant differences in stress and mood improvement only appear between the two highest levels of vegetation cover. For structural heterogeneity (Figure 2b and Figure 3b), significant differences in stress and mood improvement only appear between the two lowest levels of structural heterogeneity. For naturalness (Figure 2c), significant differences in stress appear between the lowest and highest level of naturalness.
The analysis was then extended to include a series of categorical analyses to examine the relationship between biodiversity attributes and the main types of benefits (i.e., benefit domains) identified by respondents. We cross-tabulated the main benefit derived by respondents against the physical attributes of each park and examined chi-square statistics and standardised residuals. A standardised residual is calculated by dividing the residual value (i.e., the difference in the observed frequency and expected frequency) by the standard error of the residual. Standardised residuals greater than ±2.0 indicate significantly more or significantly less of a particular benefit than would be expected. As such, they provide a means for assessing the strength of the association between categorical variables. There was a statistically significant association between benefit type and most biodiversity attributes, with the exceptions of habitat diversity and park size, which were not significantly associated with any particular benefit domain. Psychological benefits were disproportionately associated with parks that exhibited high levels of assessed naturalness ( = 67.49, df = 9, p < 0.001), as shown in Table 4, and high percentages of vegetation cover association ( = 116.60, df = 9, p < 0.001), as shown in Table 5.
Table 4.
Park benefits by level of naturalness, showing the standardised chi-square residuals for each benefit domain. Overall association is significant ( = 67.49, df = 9, p < 0.001). Standardised residuals greater than +2.0 are highlighted in yellow and standardised residuals less than −2.0 are highlighted in blue.
Table 5.
Park benefits by level of vegetation cover, showing the standardised chi-square residuals for each benefit domain. Overall association is significant ( = 116.60, df = 9, p < 0.001) Standardised residuals greater than +2.0 are highlighted in yellow and standardised residuals less than −2.0 are highlighted in blue.
3.2. The Relationship between Self-Reported Wellbeing Benefits and Park Type
Two separate one-way ANOVAs were performed to determine if improvements to the self-reported wellbeing benefits of (1) stress and (2) mood differed between four distinct urban park types, namely pocket parks, sports parks, community parks, and nature parks. Note that ANOVAs were not conducted for the wellbeing benefits of concentration and self-esteem as these did not satisfy the assumption of homogeneity of variances. The results indicated that there were statistically significant differences in improvements to both stress (F(3, 2835) = 104.523, p < 0.001) and mood (F(3, 2838) = 93.671, p < 0.001) between each of the four park types considered here.
Two separate Tukey post hoc analyses showed that improvements in both stress (Figure 4a) and mood (Figure 4b) were significantly higher in nature parks than all other park types. Conversely, wellbeing improvements were significantly lower in pocket parks than all other park types for both stress and mood. Interestingly, sport parks and community parks were not found to differ significantly in their improvements to stress or mood.
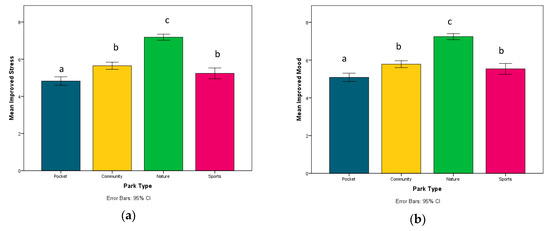
Figure 4.
Results of two separate Tukey post hoc analysis for the differences in mean self-reported improvements to (a) stress and (b) mood between the four considered urban park types. Labels above the bars denote significant differences between variables.
To identify the most important benefits being attained in different types of urban green spaces, we cross-tabulated benefit type against the NRPA park types, and examined the chi-square statistic and standardised residuals. Psychological benefits were disproportionately associated with nature parks ( = 133.62, df = 9, p < 0.001) (Table 6), as were environmental benefits. Social benefits were underrepresented in nature parks and disproportionately positively associated with community parks.
Table 6.
Park benefits by park type, showing the standardised chi-square residuals for each benefit domain. Overall association is significant ( = 133.62, df = 9, p < 0.001). Standardised residuals greater than +2.0 are shown in yellow and standardised residuals less than −2.0 are shown in blue.
3.3. The Relationship between Self-Reported Wellbeing Benefits and Perceptions of Park Attributes
In order to examine the relationship between psychological wellbeing benefits (self-reported improvements to stress, mood, concentration, self-esteem) and perceptions of park attributes (perceived biodiversity, naturalness, and canopy cover) we first examined the Spearman correlations between each benefit, and each perceived attribute (Figure 5). Although all relationships were significant (p < 0.05) and stronger than those between wellbeing and assessed biodiversity attributes (Figure 1), correlations between wellbeing benefits and perceived biodiversity attributes were invariably weak. The four self-reported psychological wellbeing measures were highly correlated with one another. Perceived biodiversity was highly correlated with perceived naturalness. Of the perceived attributes, perceived biodiversity showed the strongest correlations with all four psychological outcomes.
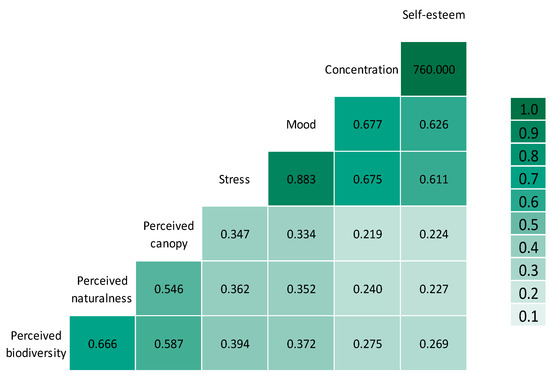
Figure 5.
Heat map visualisation of pairwise Spearman correlation coefficients. Colours represent the strength of the correlation between variables. All correlations in the matrix are statistically significant.
We ran a series of separate multiple linear regressions to examine the relationship between the combined perceived attributes and each wellbeing outcome. The three perceived attributes significantly predicted self-reported improvements to stress (F3, 2920 = 196.973, p < 0.01), mood (F3, 2916 = 176.502, p < 0.01), concentration (F3, 2894 = 87.780, p < 0.01) and self-esteem (F3, 2892 = 89.819, p < 0.01), as shown in Table 7.
Table 7.
Results of four separate multiple linear regressions. The outcome variables are self-reported wellbeing benefits, and predictor variables are perceived plant and animal diversity, perceived naturalness, and perceived canopy cover.
For each benefit, the strongest individual predictor was perceived biodiversity. When controlling for perceived naturalness and perceived canopy cover, a one-point increase in perceived plant and animal diversity increases self-reported stress benefits by 35.9% (B = 0.359, 95% CI = 0.280, 0.438). Although the model explains more of the variance in self-reported wellbeing benefits than the model comprising only objectively assessed attributes (Table 3), it is still not a strong predictor of wellbeing outcomes. Including objectively assessed biodiversity attributes in the perceived attributes model reduced the explanatory power of the model (R2 = 0.107 for self-reported stress), and furthermore, when controlling for assessed biodiversity attributes, only respondents’ perceptions are significant contributors to the model.
3.4. The Relationship between Respondent Characteristics, Biodiversity Attributes, and the Attainment of Wellbeing Benefits
We sought to explore the characteristics of respondents who benefit most strongly from environments exhibiting higher levels of each biodiversity attribute. As the attributes may be suggestive of ecological quality, we hypothesised that including participant characteristics related to nature connection or knowledge about the environment would strengthen the predictive ability of the park attribute model. We also explored other respondent variables that might influence wellbeing outcomes from park experiences (e.g., age, general health), in order to control for their effects on the relationship between biodiversity attributes and wellbeing benefits. In creating the new model, we focused only on self-reported stress improvement as our outcome variable, as it was explained most strongly by the initial models comprising measured biodiversity attributes. The new base model comprised only vegetation cover, as this was a stronger predictor of stress benefits (R2 = 0.057) than the model comprising multiple biodiversity attributes (R2 = 0.029).
To avoid over-saturation of the new model, we initially built five separate linear models, which explored the influence of six different types of participant characteristics on self-reported stress improvement: Demographic variables (age, education), health variables (general wellbeing, pre-existing depression, anxiety, and stress levels), surrounding environment variables (perceived number of parks nearby, perceived quality of nearby parks), environmental knowledge variables (formal conservation education or training, knowledge of ecology-related words, knowledge of consequences of biodiversity loss, perceived knowledge of biodiversity), nature values variables (frequency of nature contact, Nature Relatedness Score, perceived importance of biodiversity to human wellbeing), and park use variables (frequency of visiting each park, perceived level of physical benefit from visit). Theoretically, there is support for including each of these variables in a single model, however, there has not been sufficient research to inspire confidence in determining the order (relative importance) of each of them in predicting wellbeing outcomes. Thus, we thought it prudent to model each new variable separately. As shown in Table 8, the addition of ‘nature values’ and ‘use characteristics’ variables results in the largest increases in R2 over the original vegetation cover model. However, it is clear that the vast majority of the variance in self-reported stress improvement is not explained by the attributes, perceptions, nor respondent characteristics examined in this study, as R2 remains consistently low.
Table 8.
Results of six separate linear regressions. The outcome variable is self-reported stress improvement, and predictor variables comprise vegetation cover and a range of additional variables.
In order to determine whether certain variables only become significant in the presence of others, we included all variables from Table 8 in a single model. This of course strengthens the model (R2 = 0.203), however, it represents a substantial increase in complexity for a marginal improvement in predictive power. Modelling all variables together confirms that vegetation cover is still a significant predictor of stress improvement (p = 0.04).
4. Discussion
Urban parks were assessed for a range of physical attributes known to be related to biodiversity, i.e., structural heterogeneity, habitat diversity, bird species richness, naturalness (each assessed in situ), as well as vegetation cover and park size (assessed remotely using iTree Canopy software and GIS data). Individually, each of the attributes were weakly correlated with self-reported improvements to stress level, mood, concentration, and self-esteem amongst 840 respondents. Stress improvement, however, consistently correlated more strongly with biodiversity attributes than the other wellbeing outcomes, and vegetation cover was the strongest individual predictor of psychological benefits. Collectively, the biodiversity attributes explained little of the variance in respondents’ psychological benefits. Wellbeing benefits were more strongly associated with perceived attributes (i.e., perceived biodiversity, naturalness, and canopy cover—see Figure 5) than objectively measured biodiversity attributes (Figure 1), however, perceptions still explained little of the variance in self-reported wellbeing benefits. Even at the lowest assessed level of any given attribute, or perceived attribute, most respondents still believe that they attain psychological benefits (Figure 2 and Figure 3), highlighting the ability of nature in general to improve wellbeing to some extent. Overall, there appears to be a weak linear relationship between biodiversity attributes and the wellbeing benefits included in this study (Table 3 and Table 7).
The simple and direct measures of wellbeing we included required that respondents be aware of the effects nature experiences have on their psychological and cognitive outcomes, which may be one reason for the weaker relationships identified in the present study than in Fuller, et al. [10]. Frequently used measures such as the Perceived Restorativeness Scale (PRS) [31] can be used to assess the likelihood of cognitive restoration, while not requiring that respondents have explicit awareness of that outcome. From a wellbeing perspective, there is little advantage in our approach, however, from a conservation perspective we believe it is important that the public be aware of the benefits they derive from ecological attributes such as biodiversity. There are a multitude of benefits conveyed to humans by biological diversity, however, many of them are imperceptible (e.g., soil organism diversity helps suppress soil-borne pathogens [32], but this is unlikely to be appreciated very often by laypeople), and therefore, generating awareness of such benefits would require widespread environmental education or marketing campaigns. In contrast, wellbeing benefits do not need to be taught in order to be perceived by the public. If we are to encourage people to value positive environmental conditions while they are still present, they must have the ability to perceive the conditions we seek to protect, as well as the benefits they derive from them. Research suggests that our ability to accurately detect those conditions may be quite poor [11,12,13], but that we respond positively when we think they exist (e.g., Reference [11], and the present study to some extent) This may be indicative of an innate emotional connection with nature (e.g., biophilia) in people who have little need to notice or respond to natural features, because they live in urban settings. Perhaps we care, but we cannot see. Interpretive signs (and even simple labels) have the ability to change the way people perceive and react to natural environments [33], however, interpretation is generally reserved for use in National Parks and important ecological areas, and is not commonplace in small urban parks. Wider usage of interpretive techniques may be effective at highlighting the ecological value of everyday natural environments, positively influencing the way they are perceived by the public, and ultimately improving the wellbeing benefits derived from park visits. Future research could explore whether a concerted effort to highlight positive ecological attributes in parks where they are present, might lead to a sense of their absence in parks where they have been lost, or were never designed to exhibit. Perhaps this juxtaposition in one’s own neighbourhood might help connect the concept of biodiversity loss with life in an urban setting.
Previous studies examining associations between biodiversity attributes and psychological wellbeing [10,11] identified stronger linear relationships than the present study, however, they focused on the following benefits: Reflection (“ability to think and gain perspective”), attachment (“degree of emotional ties with the greenspace”), continuity with past (“extent to which sense of identity is linked to greenspace through continuity across time”), and in Fuller, et al. [10] also ‘distinct identity’ (“degree of feeling unique or different through association with a particular place”), each of which were adapted from restoration and place attachment research. ‘Continuity with past’ and ‘distinct identity’, in particular, are reflective of the construct of place attachment, and as such, highlight clear differences in how we have defined “wellbeing” in our study. While there is no universally accepted definition of the concept of wellbeing, it is frequently used as a synonym for mental health [34] and we have adopted a view of wellbeing more closely aligned with the concept of health. Place, as with wellbeing, is difficult to define [35], and may be viewed “only as a determinant of personal wellbeing” or conversely, as “an expression…of wellbeing in its own right” [36]. Although wellbeing outcomes such as psychological restoration are associated with spending time in places one has an emotional connection with [37], we believe unpacking the two constructs may help strengthen our understanding of the relationship between people and nature. Whilst the benefits studied in Fuller, et al. [10] and Dallimer, et al. [11] were compared with the physical attributes of the green spaces they were derived in, it raises the question of whether respondents who experienced a greater sense of ‘continuity with the past’ or ‘distinct identity’ would equally experience those benefits in another environment exhibiting the same diversity of habitats or species, inasmuch as the benefit may have been derived from an “affective bond to a particular geographic area” [35] rather than the physical attributes of the setting.
Attributes such as species richness and naturalness may influence the development of emotional connections to places, in turn influencing wellbeing outcomes. The finding that greater familiarity with an environment may reduce its perceived restorativeness has been related to a decline in the sense of “being away” in agricultural environments that one has experienced many times before [38]. Dynamic environments exhibiting greater naturalness, wildness, or diversity (i.e., less manicured or controlled environments) are more likely to exhibit visible changes in response to natural processes and seasonal changes than highly managed settings, and as a result may be more likely to facilitate a stronger connection with nature over time than more static environments, i.e., by eliciting an ongoing sense of escape or “being away”. Indeed, biodiversity and wildness were some of the most frequently described attributes of ‘favourite’ natural environments (indicative of an emotional connection to place) in Schebella, et al. [17]. Certainly, in this study greater psychological and environmental benefits were reported at higher levels of naturalness (Table 4).
Our categorical analysis showed that the public’s sensitivity to variations in biodiversity characteristics is not uniform across all types of attributes. For example, respondents’ self-reported psychological wellbeing only changed in response to extreme variations in naturalness (i.e., very low versus high), but did not perceive that slight increases in naturalness would influence the wellbeing benefits they derived from the environment. Similarly, respondents’ wellbeing improvements were significantly lower in parks with 11 or fewer structural elements (i.e., very low structural heterogeneity) than in parks with more than 11 elements, but past this point participants did not respond psychologically to further increases in structural heterogeneity. Respondents were much more sensitive to variations in vegetation cover, perceiving effects to their psychological wellbeing at multiple levels of vegetation cover change. Vegetation cover may be the most obvious visual cue through which individuals detect changes in the environment around them, and may be the key attribute influencing their perceptions of biodiversity [11], however, it is not necessarily the attribute most reflective of ecological quality (e.g., homogenous plantations will exhibit a very high level of vegetation cover). Nevertheless, it is promising that these differences are detected by the public, and furthermore, that they perceive these changes to have an effect on their personal wellbeing. The differences in wellbeing attainment between park types (Figure 4, Table 6) may also be indicative of respondents’ sensitivity to substantial changes in natural settings, with distinct differences in physical attributes between park types.
It has been suggested that the public’s ecological literacy should be improved through environmental education, as greater knowledge of the environment may be associated with sustainable behaviours [39], however, it is possible that deriving a high level of benefit from nature will also influence one’s willingness to engage in pro-environmental behaviours. Our results showed that individuals’ understanding of the natural environment made little difference to the benefits they derived from it, with most people deriving benefits irrespective of their understanding of concepts related to ecology or biodiversity (Table 8). Furthermore, research has shown that even those who value biodiversity and believe it benefits their wellbeing, are unable to notice changes in the species diversity of the parks and gardens they visit [13]. Thus, the challenge may lie in strengthening people’s perceptive abilities, and not only in teaching them why the environment should be valued. If benefits are associated with perceived biodiversity, those perceptions should ideally reflect actual biodiversity. In fields where observational skills are essential, such as the medical profession, activities prompting people to engage in focused observation have been shown to improve observational skills. For example, visually itemising the components of, and interpreting the meaning of works of art, has been shown to significantly improve nursing students’ ability to identify patient symptoms and suggest alternative diagnoses [40]. The method, which often uses artwork, stems from the idea that “using an unfamiliar object about which the student had no biases and no significant prior knowledge would result in the object being very carefully inspected and every feature reported” [41]. How such a technique might be translated to the everyday observational abilities of park visitors will require further research, but once again, environmental interpretation may be one avenue through which this could be achieved. Interventions such as prompting people to notice “three good things in nature” each day, as employed by Richardson and Sheffield [42] are effective at improving nature connectedness in individuals, and may be adapted for use at a community level through interpretive signs or programs in parks. Such interventions could have a stronger ‘observational’ rather than ‘connectedness’ focus by prompting visitors to notice “things that have changed” in the natural environment since their last visit, rather than things that they like. As nature is never static, a heightened ability to perceive natural changes may be quite rewarding and help the public to find continued interest in familiar settings that might no longer elicit strong feelings of fascination or escape.
5. Conclusions
Perceptions of biodiversity, naturalness, and canopy cover were more closely related to wellbeing outcomes than objective measures of biodiversity, but the relationship was weak. Of the objectively measured biodiversity attributes, psychological benefits were associated most strongly with vegetation cover, however, variations to naturalness and structural heterogeneity also influenced perceived wellbeing benefits. The public’s sensitivity to changes in different physical attributes varied, with only subtle differences in vegetation cover having a significant effect on wellbeing, but substantial differences in naturalness and structural heterogeneity required to have an effect on self-reported wellbeing. Different types of parks were found to facilitate different types of wellbeing benefits. The benefit domains associated with particular park types were consistent with previous research, with stress reduction and mood improvement highest in natural parks and lowest in pocket parks. We suggest that attempts to improve the perceptive abilities of park users through interventions or environmental interpretation may result in strengthened wellbeing outcomes and nature connectedness by encouraging individuals to find ongoing interest in familiar natural environments. The relationship between biodiversity and wellbeing is not simple and warrants further investigation of additional constructs that may affect this relationship. However, it is clear that biodiversity plays a role in wellbeing, and should have important implications for both public health and conservation.
Author Contributions
M.F.S. conceived and designed the study with input from D.W. and P.W; M.F.S conducted the study; M.F.S analyzed the data with input from L.S.; M.F.S developed the first draft of the manuscript; all authors contributed to editing the manuscript.
Funding
This research was supported by a scholarship from the University of South Australia.
Acknowledgments
The authors would like to acknowledge the members of the public who participated in the study.
Conflicts of Interest
The authors declare no conflict of interest.
Appendix A
Table A1.
Review of literature pertaining to the psychological benefits associated with biodiversity and related attributes such as naturalness and wildness. The review focused on experiences of those attributes in specific environments, rather than aggregated attributes at neighborhood or state-level.
| Study | Study Design | n | Country | Environment Measures | Number of Natural Sites | Assessed Perceived Biodiversity? | Wellbeing Benefits Measured | Key Findings |
|---|---|---|---|---|---|---|---|---|
| [10] | Comparative In-situ interviews with site visitors (urban green spaces) | 312 | United Kingdom | Species richness of birds, plants, and butterflies; number of habitat types; tree cover; park size. | 15 | Yes, estimation of number of plant, bird, butterfly species | Self-reported: psychological wellbeing (reflection, identity, attachment, continuity with past) | No relationship between butterfly richness and wellbeing. Other park attributes associated with some wellbeing measures: Bird richness with ‘continuity with past’ and ‘attachment’. Plant richness with ‘reflection’ and ‘identity’. Number of habitat types with ‘reflection’, ‘identity’, and ‘continuity with past’. Park size with ‘reflection’, ‘identity’, and ‘continuity with past’. Perceived plant richness increased with plant richness and number of habitats; no comparison between perceived species richness and wellbeing benefits conducted. |
| [43] | Before and after Questionnaire completed by green space users before and after visiting a National Trust site | 132 | United Kingdom | None, but all sites were National Trust sites and thought to be of high natural or heritage value | 4 | No | Self-esteem and mood | Significant improvement in self-esteem and mood after visiting sites. Conducted no comparison of benefits between sites. |
| [44] | Before and after Questionnaire completed prior to and post 30-min walk in either a wild or tended forest | 100 | Switzerland | ‘Wildness’ based on expert opinion and length of time since economic use of forest (i.e., since it was last maintained) | 2 | No | Self-reported: wellbeing (positive affect, activation, negative affect, arousal) | Participants in the ‘tended’ forest exhibited a stronger increase in positive affect and a stronger decrease in negative affect than participants in the ‘wild’ forest. No significant differences in activation or arousal between the two sites. No differences in perceived attractiveness between the two sites. |
| [11] | Comparative In-situ surveying of site visitors (riparian green spaces) | 1108 | United Kingdom | Species richness of birds, plants, and butterflies; bird density; number of habitat types; tree cover. | 34 | Yes, estimation of number of plant, bird, butterfly species | Self-reported: psychological wellbeing (reflection, attachment, continuity with past) | No association between perceived and actual species richness. Perceived species richness positively related to wellbeing. No association between sampled butterfly richness and wellbeing. Bird richness positively related to wellbeing. Plant richness had a negative association with wellbeing. Bird density positively associated with wellbeing, but not as strongly as perceived species richness. Tree cover associated with wellbeing. |
| [15] and [45] | Experiment Recovery from induced stress in different environments (videos of urban green and built sites) | 102 | United Kingdom | Differences in wildness and/or structural variation and/or vegetation density. | 3 (and 1 built scene) | No; did assess perceived naturalness | Self-reported: mood, vitality, and restorative state | Post-recovery, there were no significant differences in mood between nature scenes, only between ‘urban’ and ‘parkland’. No significant differences in vitality between scenes. No significant differences in restorative state between nature scenes, only between ‘urban’ and ‘parkland’ and between ‘urban’ and ‘wild woods’. Significant differences in perceived naturalness between scenes, with the exception of parkland and tended woodland (no difference in perceived naturalness). Significant difference in vitality between high and low perceived naturalness. |
| [46] | Experiment Appraisal of photographs of three different forest sites | 35 | Sweden | Differences in vegetation layers, species composition, and vegetation type. | 3 | Yes, Biodiversity Experience Index (BEI) | EEG; anticipated emotional response (Basic Emotional Processing questionnaire) | Biodiversity perceived accurately using the BEI. Intermediate biodiversity was the most preferred of the three forest environments. Intermediate biodiversity was appraised most positively in both EEG measurements and BEP responses. |
| [14] | Comparative In-situ surveying of site visitors (two urban and two peri-urban green spaces) | 569 | Italy | Ordinal biodiversity levels (low and high) based on experts ranking photographs of each site according to their biodiversity and structural complexity. | 4 | No | Self-reported: perceived restorativeness; and a ‘wellbeing’ score derived from several broad psychological and physical benefits, e.g., “feel better’ | ‘Perceived restorativeness’ and ‘wellbeing’ were positively associated with ‘biodiversity’ (high better than low) and ‘location’ (peri-urban better than urban). ‘Wellbeing’ was significantly correlated with length of visit. |
| [47] | Comparative In-situ surveying of site visitors | 151 | Taiwan | Insect diversity, richness, evenness, and abundance | 60 plots (in 3 green spaces) | No | Heart rate; electromyography (EMG); blood volume pulse (BVP) | Heart rate was significantly negatively correlated with insect species evenness, i.e., as evenness increased, heart rate decreased, suggesting a calming effect. Insect species richness, abundance and diversity were not related to physiological responses. |
| [48] | Before and after Questionnaire completed prior to and post group walk in nature | 127 | United Kingdom | None, green spaces classified by type. | Not reported | Yes, estimation of number of plant, bird, butterfly species; also perceived naturalness | Positive and negative affect (PANAS); self-reported happiness | Post-walk negative affect significantly increased when perceived bird species increased from 0–4 to 5–14 species. Perceived naturalness and biodiversity did not correlate with post-walk emotional wellbeing, but did significantly correlate with perceived restorativeness, which was in turn significantly correlated with the post-walk emotional well-being. |
| [49] | Comparative and Quasi-experiment (a) Observation of aquarium visitors, (b) wellbeing responses before, during, after | (a) 112, (b) 84 | United Kingdom | Number and diversity of fish and crustacean species (stocking levels: unstocked, partially stocked, and fully stocked) | 1 (at three different time periods with variations in species diversity) | (a) Time spent at exhibit, (b) heart rate, blood pressure, two single-item mood scales (the Feeling Scale, the Felt Arousal Scale), five evaluative statements related to interest, enjoyment, feeling better. | (a) Visitors spent longer at the exhibit as stocking level increased. (b) All three levels of species diversity were perceived to be enjoyable and to make participants feel better. All evaluate statements were significantly more positive in the partially stocked exhibit than the unstocked exhibit, and were higher (not significantly) in the fully stocked than partially stocked exhibit. Blood pressure decreased in all exhibits, but only some significant changes. Significant decrease in heart rate in the partially and fully stocked exhibits compared with unstocked. Significant improvements in mood in partially and fully stocked exhibits, but not unstocked. Fully stocked less calming but more energizing. | |
| [50] | Comparative In-situ surveying and interviewing of site visitors | 1411 | United Kingdom | Typology of 9 planting types based on variations in planting structure and species character (nativeness) across three vegetation communities: herbaceous, shrub, and woodland. | 31 | Yes, estimation of number of plant species, native plant species, and insects | Perceived restorative effects (comfort, escape, relaxation, perception of space as unique) | Planting structure, vegetation community, and flower coverage had significant association with perceived restorativeness. Significant low-moderate correlation between perceived number of plant species and perceived restorativeness in shrub plantings. Low-moderate correlation between perceived value of planting for insects and perceived restorativeness in herbaceous plantings. No correlation between perceived biodiversity and perceived restorativeness in woodland plantings. The least natural plantings were perceived as most attractive. Landscape professionals and highly educated respondents found the plantings least restorative. |
| [51] | Comparative Observation of green space users around lakes | NA | Poland | Aquatic, rush, and terrestrial plant species abundance; hemeroby; species diversity | 28 | No | Frequency of visitation and time spent in green space | No relationship between benefits and biodiversity, species abundance, or hemeroby. |
| [52] | Comparative In-situ surveying of park visitors | 12 | United Kingdom | Habitat diversity; species richness of plants, birds, butterflies, bees | 128 | No | Perceived restorativeness | All parks were perceived as restorative. Ecological richness (i.e., plant, bird, bee, butterfly species richness and habitat number) explained 43% of the variance in perceived restorativeness |
Appendix B

Figure A1.
Location of study area (3 councils) in relation to the Greater Adelaide region, South Australia.
Appendix C

Figure A2.
The map distributed to questionnaire respondents, modified to illustrate the different park types in the study.
Appendix D. Example of Survey Questions Included in the Study
In general, how frequently do you visit green spaces?
| Daily | Weekly | Fortnightly | Monthly | Every few months | Yearly | Rarely |
Please estimate the number of green spaces that exist within a 10 min walk from your home (i.e., within about 800 metres).
On the scale below, how would you rate the overall quality of the green spaces within a 10 min walk from home?
| 1 Very low quality | 2 | 3 | 4 | 5 | 6 | 7 | 8 | 9 | 10 Exceptional quality |
How would you rate your understanding of ‘biodiversity’?
| 1 Very low level of understanding | 2 | 3 | 4 | 5 | 6 | 7 | 8 | 9 | 10 Very high level of understanding |
Have you had any formal training in biodiversity conservation as a part of your education, employment, or volunteering? Yes / No / Unsure
Note: participants were provided with a map and asked to identify up to four green spaces that they visit. They were then asked the following questions about each of those parks.
How often do you visit each of these parks? X____ times per week/month/year
How would you rate the level of physical benefit you derive from a typical visit to each of these parks? (i.e., from being physically active).
| 1 Very low level of physical benefit | 2 | 3 | 4 | 5 | 6 | 7 Very high level of physical benefit |
What would you say is the main benefit you derive from a typical visit to each of these parks? (Please select one benefit per park).
| Enjoy scenery | Mentally unwind, escape everyday pressures | Escape crowds, enjoy solitude | Spend time with friends/family | Improve or maintain fitness | Physically rest/relax | Learn about nature | Other |
How would you describe the overall level of plant and animal diversity in each of these parks?
| 1 Very low level of diversity | 2 | 3 | 4 | 5 | 6 | 7 Very high level of diversity |
How would you rate the scenic beauty of each of these parks?
| 1 Very unattractive | 2 | 3 | 4 Neither attractive nor unattractive | 5 | 6 | 7 Very attractive |
How would you rate the ‘naturalness’ of each park on the scale below?
| 1 100% artificial and/or urban | 2 | 3 | 4 50% artificial, 50% natural | 5 | 6 | 7 100% natural |
How would you describe the amount of natural shade at each of these parks? (i.e., from trees).
| 1 Very little or no natural shade | 2 | 3 | 4 | 5 | 6 | 7 Lots of natural shade, very shady |
How do you think a typical visit to each of these green spaces would improve the following aspects of your wellbeing? Please indicate the strength of the effect, by writing a number in each of the boxes below, with 1 being ‘a very small improvement’ and 10 being ‘a very big improvement’. If you feel that visiting a particular green space would have no effect on you, please write ‘0’.
| My stress level: | My mood: | My concentration: | My self-esteem: |
In general, would you say your health is:
| Excellent | Very good | Good | Fair | Poor |
Note: the items from the SF-12 Healthy Survey instrument were included.
How important do you think biodiversity is to the health and wellbeing of you and your family?
| Highly important | Fairly important | Neither important nor unimportant | Fairly unimportant | Highly important | I don’t know what biodiversity is |
Looking at the words and concepts listed below, please select each item that you would feel confident explaining the meaning of to another person:
| Biodiversity | Ecosystem | Remnant Vegetation |
| Island biogeography | Keystone species | Biodiversity hotspot |
| Ecosystem services | Umbrella species | Natural capital |
| Edge Effect | Habitat fragmentation | Endemic species |
| I would not feel confident explaining any of the concept to another person. | ||
In my opinion, the possible consequences of biodiversity loss include:
| Reduced food security | Increased spread of infectious diseases |
| Substantial ozone depletion | Destruction of potential pharmaceuticals |
| Pollution | Increased frequency of natural disasters |
| I don’t know |
Note: In addition, a suite of demographic questions were also asked, including age, gender, and highest level of formal education completed. The 21-item Nature Relatedness Scale was included as were the 21 items in the Depression, Anxiety and Stress Scale (DASS-21).
Appendix E
Table A2.
The range of values categorized as ‘very low’, ‘low’, ‘moderate’, and ‘high’ within each park attribute. Categories were formed by dividing the range of recorded values for each attribute into four equal groups, with the exception of bird species richness and habitat diversity, which could not be divided equally due to being discrete variables.
| Park Attribute | Level | Data Range |
|---|---|---|
| Vegetation cover | Very low | 12.2–27.7% |
| Low | 27.71–43.2% | |
| Medium | 43.21–58.7% | |
| High | 58.71–74.2% | |
| Naturalness | Very low | 35–49.5% |
| Low | 49.51–64% | |
| Medium | 64.01–78.5% | |
| High | 78.51–93% | |
| Habitat diversity | Very low | 2–3 habitats |
| Low | 4–5 habitats | |
| Medium | 6–7 habitats | |
| High | 8–10 habitats | |
| Structural heterogeneity | Very low | 7 to 11 elements |
| Low | 12 to 16 elements | |
| Medium | 17 to 21 elements | |
| High | 22 to 26 elements | |
| Bird species richness | Very low | 0–3 species |
| Low | 4–6 species | |
| Medium | 7–9 species | |
| High | 10–13 species |
References
- De Vos, J.M.; Joppa, L.N.; Gittleman, J.L.; Stephens, P.R.; Pimm, S.L. Estimating the normal background rate of species extinction. Conserv. Biol. 2015, 29, 452–462. [Google Scholar] [CrossRef] [PubMed]
- Robertson, D.P.; Hull, R.B. Beyond Biology: Toward a More Public Ecology for Conservation. Conserv. Biol. 2001, 15, 970–979. [Google Scholar] [CrossRef]
- Louv, R. Last Child in the Woods: Saving Our Children from Nature-Deficit Disorder; Algonquin Books: Chapel Hill, NC, USA, 2008. [Google Scholar]
- McDonald, R.I.; Chai, H.Y.; Newell, B.R. Personal experience and the ‘psychological distance’ of climate change: An integrative review. J. Environ. Psychol. 2015, 44, 109–118. [Google Scholar] [CrossRef]
- Li, Y.; Johnson, E.J.; Zaval, L. Local warming: Daily temperature change influences belief in global warming. Psychol. Sci. 2011, 22, 454–459. [Google Scholar] [CrossRef] [PubMed]
- Sandifer, P.A.; Sutton-Grier, A.E.; Ward, B.P. Exploring connections among nature, biodiversity, ecosystem services, and human health and well-being: Opportunities to enhance health and biodiversity conservation. Ecosyst. Serv. 2015, 12, 1–15. [Google Scholar] [CrossRef]
- Keniger, L.E.; Gaston, K.J.; Irvine, K.N.; Fuller, R.A. What are the benefits of interacting with nature? Int. J. Environ. Res. Public Health 2013, 10, 913–935. [Google Scholar] [CrossRef]
- Capaldi, C.A.; Passmore, H.-A.; Nisbet, E.K.; Zelenski, J.M.; Dopko, R.L. Flourishing in nature: A review of the benefits of connecting with nature and its application as a wellbeing intervention. Int. J. Wellbeing 2015, 5. [Google Scholar] [CrossRef]
- Lovell, R.; Wheeler, B.W.; Higgins, S.L.; Irvine, K.N.; Depledge, M.H. A systematic review of the health and well-being benefits of biodiverse environments. J. Toxicol. Environ. Health. B Crit. Rev. 2014, 17, 1–20. [Google Scholar] [CrossRef]
- Fuller, R.A.; Irvine, K.N.; Devine-Wright, P.; Warren, P.H.; Gaston, K.J. Psychological benefits of greenspace increase with biodiversity. Biol. Lett. 2007, 3, 390–394. [Google Scholar] [CrossRef]
- Dallimer, M.; Irvine, K.N.; Skinner, A.M.J.; Davies, Z.G.; Rouquette, J.R.; Maltby, L.L.; Warren, P.H.; Armsworth, P.R.; Gaston, K.J. Biodiversity and the Feel-Good Factor: Understanding Associations between Self-Reported Human Well-being and Species Richness. Bioscience 2012, 62, 47–55. [Google Scholar] [CrossRef]
- Lindemann-Matthies, P.; Bose, E. How Many Species Are There? Public Understanding and Awareness of Biodiversity in Switzerland. Hum. Ecol. 2008, 36, 731–742. [Google Scholar] [CrossRef]
- Shwartz, A.; Turbé, A.; Simon, L.; Julliard, R. Enhancing urban biodiversity and its influence on city-dwellers: An experiment. Biol. Conserv. 2014, 171, 82–90. [Google Scholar] [CrossRef]
- Carrus, G.; Scopelliti, M.; Lafortezza, R.; Colangelo, G.; Ferrini, F.; Salbitano, F.; Agrimi, M.; Portoghesi, L.; Semenzato, P.; Sanesi, G. Go greener, feel better? The positive effects of biodiversity on the well-being of individuals visiting urban and peri-urban green areas. Landsc. Urban Plan. 2015, 134, 221–228. [Google Scholar] [CrossRef]
- Van den Berg, A.E.; Jorgensen, A.; Wilson, E.R. Evaluating restoration in urban green spaces: Does setting type make a difference? Landsc. Urban Plan. 2014, 127, 173–181. [Google Scholar] [CrossRef]
- Brown, G.; Schebella, M.F.; Weber, D. Using participatory GIS to measure physical activity and urban park benefits. Landsc. Urban Plan. 2014, 121, 34–44. [Google Scholar] [CrossRef]
- Schebella, M.F.; Weber, D.; Lindsey, K.; Daniels, C.B. For the Love of Nature: Exploring the Importance of Species Diversity and Micro-Variables Associated with Favorite Outdoor Places. Front. Psychol. 2017, 8, 2094. [Google Scholar] [CrossRef]
- Nordh, H.; Hartig, T.; Hagerhall, C.M.; Fry, G. Components of small urban parks that predict the possibility for restoration. Urban For. Urban Green. 2009, 8, 225–235. [Google Scholar] [CrossRef]
- Australian Bureau of Statistics. Data by Region, 2011–2016; Australian Bureau of Statistics: Canberra, Australia, 2017.
- Mertes, J.D.; Hall, J.R. Park, Recreation, Open Space and Greenway Guidelines; National Recreation and Park Association: Ashburn, VA, USA, 1996. [Google Scholar]
- Machado, A. An index of naturalness. J. Nat. Conserv. 2004, 12, 95–110. [Google Scholar] [CrossRef]
- DeMaris, A. Regression with Social Data: Modeling Continuous and Limited Response Variables; Willey: Hoboken, NJ, USA, 2005. [Google Scholar]
- Driver, B.L.; Brown, P.J. The Opportunity Spectrum Concept and Behavioral Information in Outdoor Recreation Resource Supply Inventories: A Rationale; USDA Forest Service General Technical Report RM-55; Rocky Mountain Forest and Range Experiment Station: Fort Collins, CO, USA, 1978.
- Manfredo, M.J.; Driver, B.L.; Tarrant, M.A. Measuring Leisure Motivation: A Meta-Analysis of the Recreation Experience Preference Scales. J. Leisure Res. 1996, 28, 188–213. [Google Scholar] [CrossRef]
- Weber, D.; Anderson, D. Contact with nature: Recreation experience preferences in Australian parks. Ann. Leisure Res. 2010, 13, 46–69. [Google Scholar] [CrossRef]
- Moore, R.L.; Driver, B.L. Introduction to Outdoor Education: Providing and Managing Natural Resource Based Opportunities; Venture Publishing, Inc.: State College, PA, USA, 2005. [Google Scholar]
- Australian Bureau of Statistics. 2016 Census QuickStats: Burnside; Australian Bureau of Statistics: Canberra, Australia, 2017.
- Australian Bureau of Statistics. 2016 Census QuickStats: Mitcham; Australian Bureau of Statistics: Canberra, Australia, 2017.
- Australian Bureau of Statistics. 2016 Census QuickStats: Unley; Australian Bureau of Statistics: Canberra, Australia, 2017.
- Bowerman, B.L.; O’Connell, R.T. Linear Statistical Models: An Applied Approach; Duxbury Press: Singapore, 1990. [Google Scholar]
- Hartig, T.; Korpela, K.; Evans, G.W.; Garling, T. A measure of restorative quality in environments. Scand. Hous. Plan. Res. 1997, 14, 175–194. [Google Scholar] [CrossRef]
- Wall, D.H.; Nielsen, U.N.; Six, J. Soil biodiversity and human health. Nature 2015, 528, 69. [Google Scholar] [CrossRef]
- Kaplan, R.; Kaplan, S. The Experience of Nature: A Psychological Perspective; Cambridge University Press: Cambridge, UK, 1989. [Google Scholar]
- Atkinson, S. Moves to measure wellbeing must support a social model of health. BMJ 2011, 343. [Google Scholar] [CrossRef]
- Morgan, P. Towards a developmental theory of place attachment. J. Environ. Psychol. 2010, 30, 11–22. [Google Scholar] [CrossRef]
- Fuller, S.; Atkinson, S. Wellbeing and Place; Taylor & Francis: Didcot, UK, 2016. [Google Scholar]
- Korpela, K.M.; Ylen, M.P. Effectiveness of Favorite-Place Prescriptions A Field Experiment. Am. J. Prev. Med. 2009, 36, 435–438. [Google Scholar] [CrossRef]
- Collado, S.; Staats, H.; Sorrel, M.A. A relational model of perceived restorativeness: Intertwined effects of obligations, familiarity, security and parental supervision. J. Environ. Psychol. 2016, 48, 24–32. [Google Scholar] [CrossRef]
- Pitman, S.D.; Daniels, C.B.; Sutton, P.C. Ecological literacy and socio-demographics: Who are the most eco-literate in our community, and why? Int. J. Sustain. Dev. World Ecol. 2018, 25, 9–22. [Google Scholar] [CrossRef]
- Pellico, L.H.; Friedlaender, L.; Fennie, K.P. Looking is not seeing: Using art to improve observational skills. J. Nurs. Educ. 2009, 48, 648–653. [Google Scholar] [CrossRef]
- Braverman, I.M. To see or not to see: How visual training can improve observational skills. Clin. Dermatol. 2011, 29, 343–346. [Google Scholar] [CrossRef]
- Richardson, M.; Sheffield, D. Three good things in nature: Noticing nearby nature brings sustained increases in connection with nature/Tres cosas buenas de la naturaleza: Prestar atención a la naturaleza cercana produce incrementos prolongados en conexión con la naturaleza. Psyecology 2017, 8, 1–32. [Google Scholar] [CrossRef]
- Barton, J.; Hine, R.; Pretty, J. The health benefits of walking in greenspaces of high natural and heritage value. J. Integr. Environ. Sci. 2009, 6, 261–278. [Google Scholar] [CrossRef]
- Martens, D.; Gutscher, H.; Bauer, N. Walking in “wild” and “tended” urban forests: The impact on psychological well-being. J. Environ. Psychol. 2011, 31, 36–44. [Google Scholar] [CrossRef]
- Jorgensen, A.; Wilson, E.; Van den Berg, A.E. Evaluating stress relief in urban green and open spaces: Does perceived naturaless make a difference? In Proceedings of the Trees and Forests in British Society Conference, Edinburgh, UK, 13–15 April 2010. [Google Scholar]
- Johansson, M.; Gyllin, M.; Witzell, J.; Küller, M. Does biological quality matter? Direct and reflected appraisal of biodiversity in temperate deciduous broad-leaf forest. Urban For. Urban Green. 2014, 13, 28–37. [Google Scholar] [CrossRef]
- Chang, K.; Sullivan, W.; Lin, Y.-H.; Su, W.; Chang, C.-Y. The Effect of Biodiversity on Green Space Users’ Wellbeing—An Empirical Investigation Using Physiological Evidence. Sustainability 2016, 8, 1049. [Google Scholar] [CrossRef]
- Marselle, M.R.; Irvine, K.N.; Lorenzo-Arribas, A.; Warber, S.L. Moving beyond Green: Exploring the Relationship of Environment Type and Indicators of Perceived Environmental Quality on Emotional Well-Being following Group Walks. Int. J. Environ. Res. Public Health 2015, 12, 106–130. [Google Scholar] [CrossRef] [PubMed]
- Cracknell, D.; White, M.P.; Pahl, S.; Nichols, W.J.; Depledge, M.H. Marine Biota and Psychological Well-Being: A Preliminary Examination of Dose-Response Effects in an Aquarium Setting. Environ. Behav. 2016, 48, 1242–1269. [Google Scholar] [CrossRef] [PubMed]
- Hoyle, H.; Hitchmough, J.; Jorgensen, A. All about the ‘wow factor’? The relationships between aesthetics, restorative effect and perceived biodiversity in designed urban planting. Landsc. Urban Plan. 2017, 164, 109–123. [Google Scholar] [CrossRef]
- Sikorska, D.; Sikorski, P.; Hopkins, R. High Biodiversity of Green Infrastructure Does Not Contribute to Recreational Ecosystem Services. Sustainability 2017, 9, 334. [Google Scholar] [CrossRef]
- Wood, E.; Harsant, A.; Dallimer, M.; Cronin de Chavez, A.; McEachan, R.R.C.; Hassall, C. Not All Green Space Is Created Equal: Biodiversity Predicts Psychological Restorative Benefits from Urban Green Space. Front. Psychol. 2018, 9. [Google Scholar] [CrossRef]
© 2019 by the authors. Licensee MDPI, Basel, Switzerland. This article is an open access article distributed under the terms and conditions of the Creative Commons Attribution (CC BY) license (http://creativecommons.org/licenses/by/4.0/).