Complexity in Education for Sustainable Consumption—An Educational Data Mining Approach using Mysteries


Abstract
:1. Introduction
2. Theoretical Background and Current Status of Research
2.1. Addressing Socio-Scientific Issues in Education for Sustainable Consumption
2.2. The Mystery as Method for Understanding Education for Sustainable Consumption
2.2.1. Learning methods for handling Education for Sustainable Consumption
2.2.2. Empirical Results on the Mystery Method and Mystery Map
2.2.3. ESD Mystery Construction and Analysis
3. Method
3.1. Sample
3.2. Design
4. Results
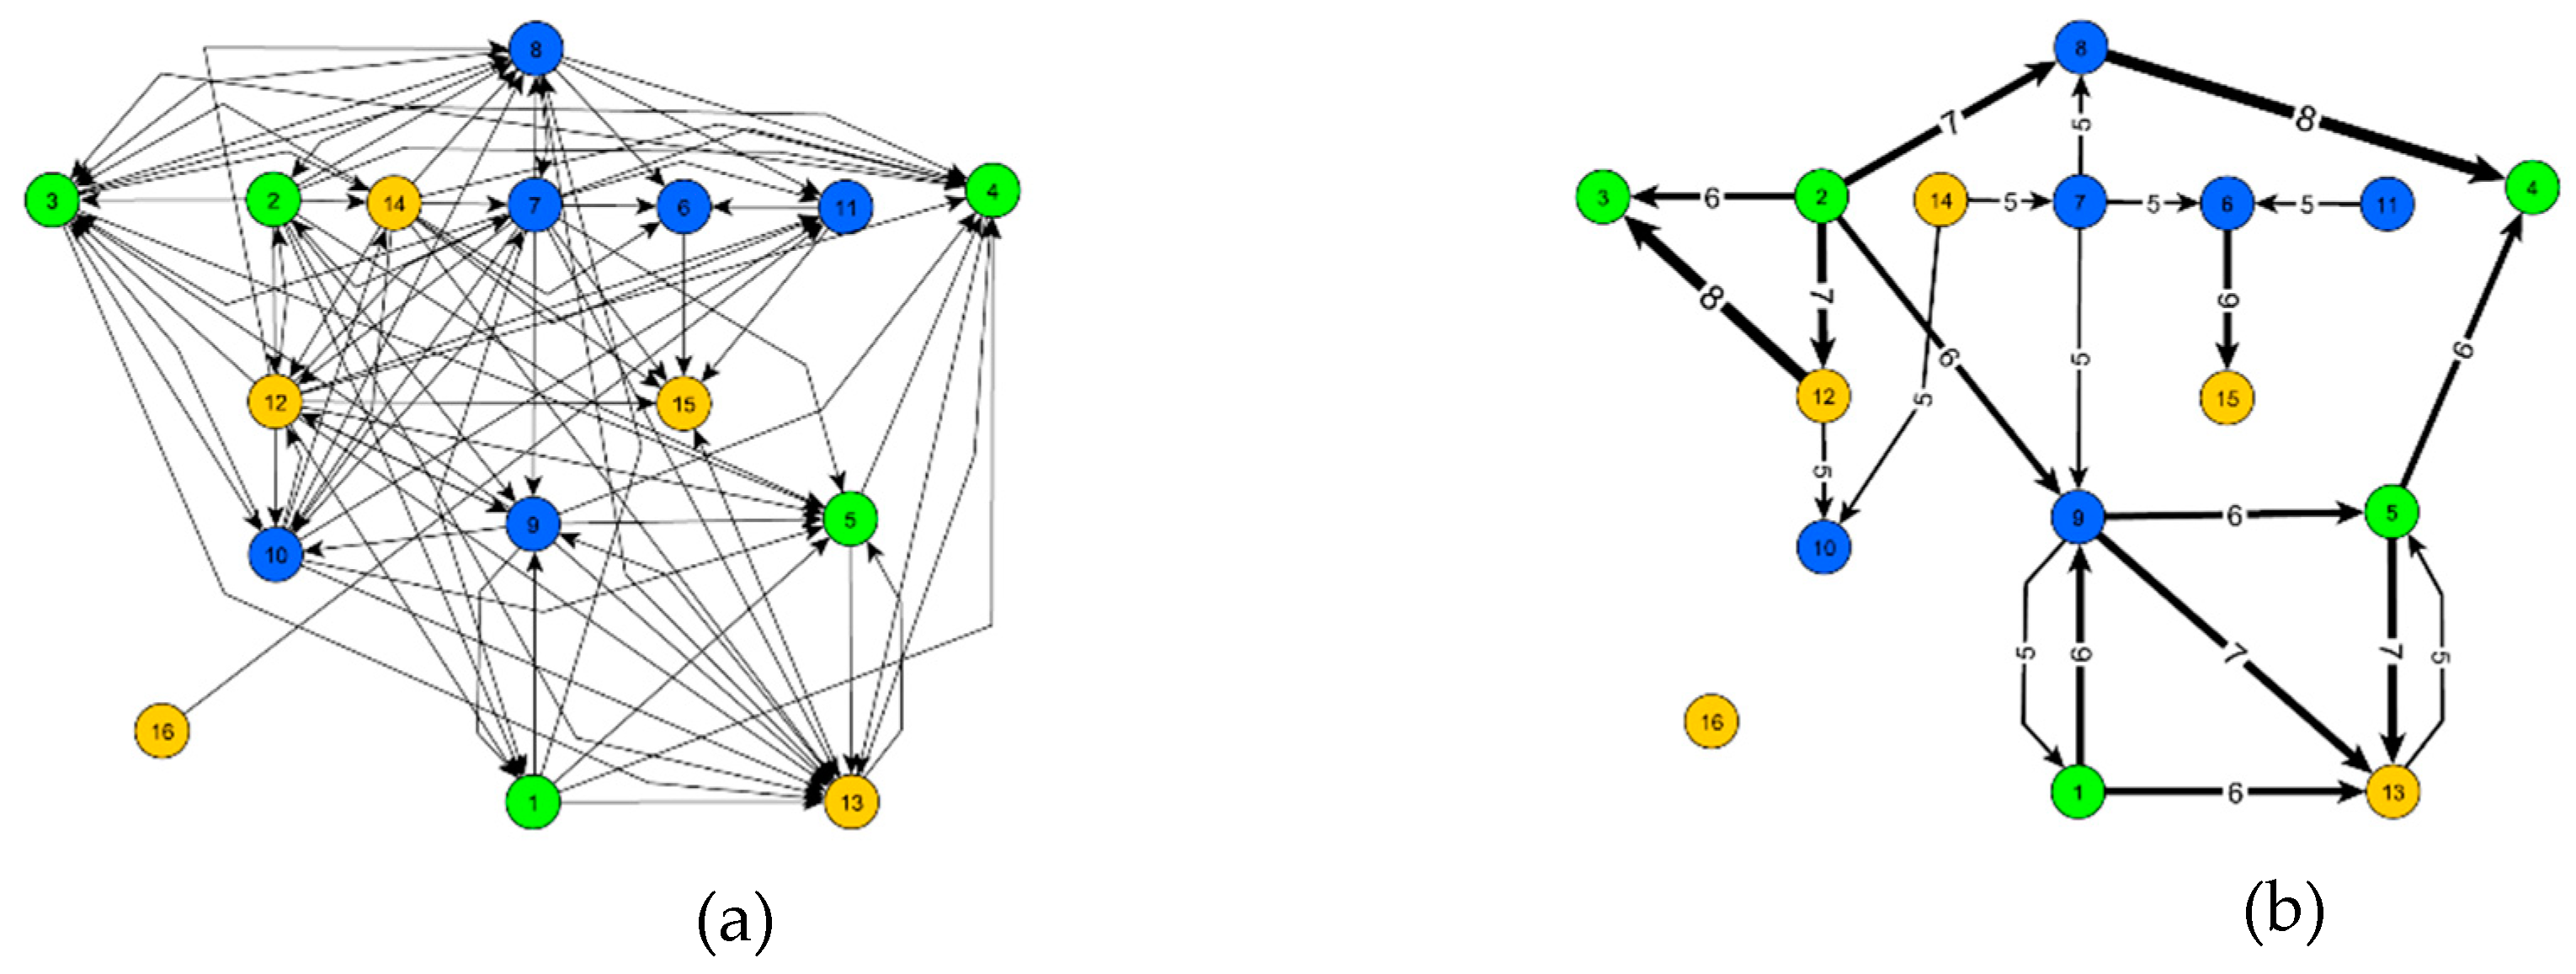
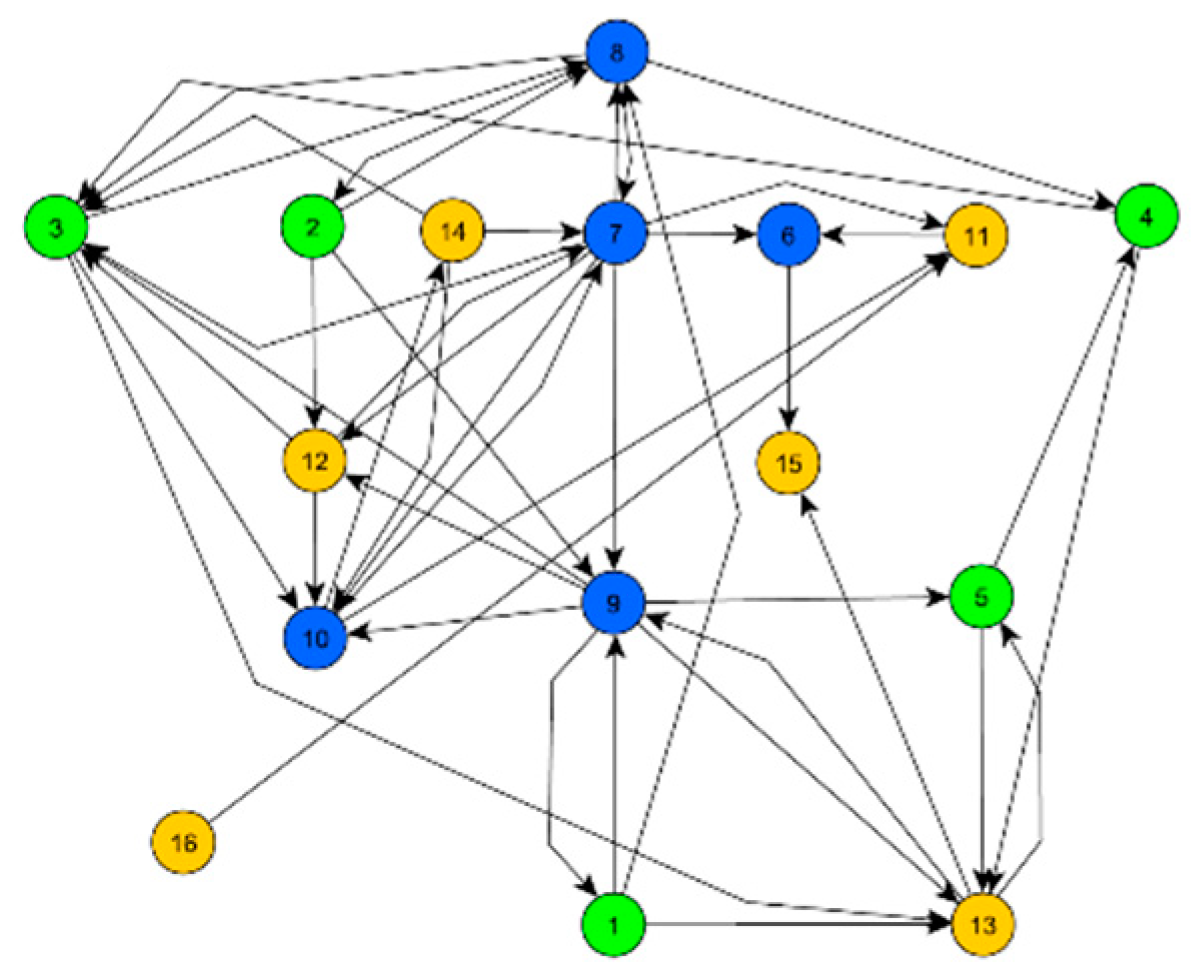
4.1. Network of all Associations Perceived
4.2. Network of Weighted Associations
4.3. Approach for Creating a Reference
5. Discussion
5.1. Structural Aspects
5.2. Methodological Aspects
6. Conclusions
6.1. Prospects for Dealing with Complexity in Education for Sustainable Consumption
6.2. The Importance of Data Mining in Educational Contexts
6.3. Practical Teaching Purposes
Author Contributions
Funding
Acknowledgments
Conflicts of Interest
Appendix A
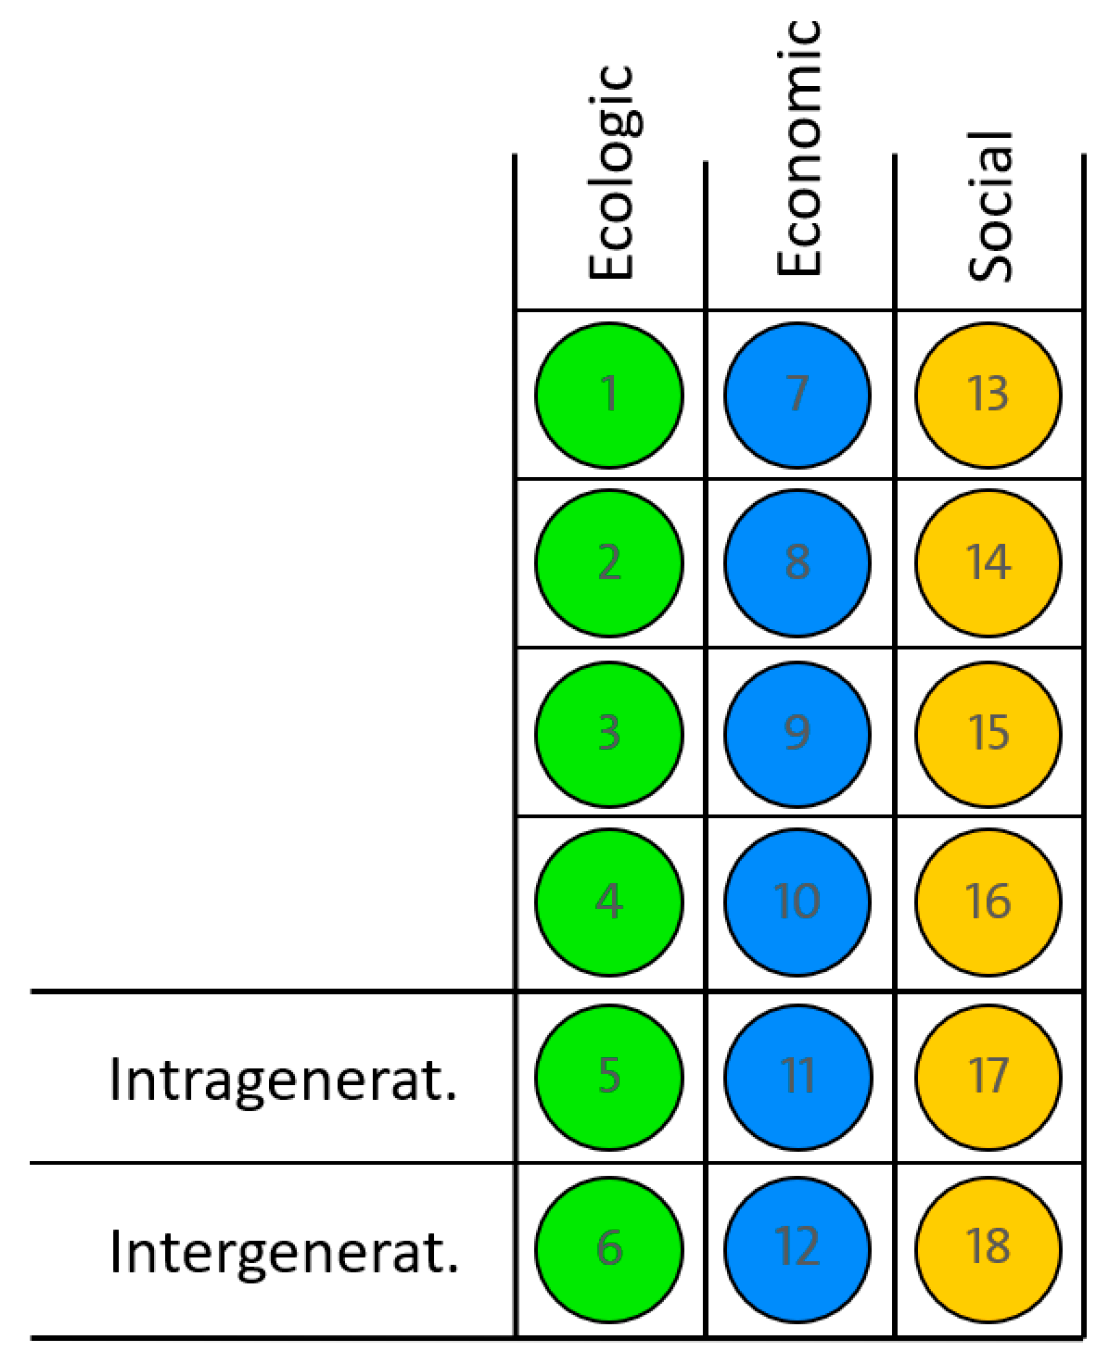
- Ecology:
- [1] Groundwater is the most important water source in El Ejido.
- [2] Tomatoes require sufficient water, nutrients, light, and heat. Simple plastic greenhouses are used to provide these.
- [3] Ever more natural areas are being used for the construction of new greenhouses.
- [4] The quality of the groundwater has deteriorated severely. High levels of fertilizer have been found there, together with salinization.
- [5] The water table in El Ejido has been sinking continuously over the past few years. As a result, seawater has been seeping in and salinating the groundwater.
- Economy:
- [6] Radu receives wages only sporadically, depending on the opportunity to work. Like many other illegal immigrants he has no labor rights.
- [7] The market for tomatoes is subject to extreme price pressure. A few large distributors want to purchase tomatoes at the lowest possible price because supermarket customers only want to pay a low price for them.
- [8] To increase crop yields pesticides and fertilizers are used. They are administered to the tomato plants directly during watering. The surplus often seeps into the ground.
- [9] The least expensive method of watering consists of removing groundwater from deep wells.
- [10] In 2014 approx. 164,000 tons of tomatoes were imported to Germany from Spain. El Ejido exports 3 million tons of various products annually.
- [11] Radu used to earn enough to take care of his family. But the difficult economic situation forces him to work abroad because vegetable prices in his home country have fallen.
- Social:
- [12] Construction of the first greenhouses began with government support in the 1960s; this triggered haphazard growth of cultivated areas. A “sea of plastic” comes into being.
- [13] It is becoming ever more difficult to obtain sufficient tap water. Ever deeper wells have to be dug.
- [14] Petra from Hamburg would like to buy fresh tomatoes, and of course other fruits and vegetables, all year round. At the supermarket around the corner she can always get everything without difficulty.
- [15] Most harvester workers live under wretched conditions at the city’s edge, in metal shacks with no electricity or running water.
- [16] Radu originally comes from Romania and is a farmer like his ancestors. His family still lives in his home village.
References
- Fensham, P.J. Preparing Citizens for a Complex World: The Grand Challenge of Teaching Socio-scientific Issues in Science Education. In Science Environment Health; Springer: Dordrecht, The Netherlands, 2012; pp. 7–29. [Google Scholar]
- Sadler, T.D. Informal reasoning regarding socioscientific issues: A critical review of research. J. Res. Sci. Teach. 2004, 41, 513–536. [Google Scholar] [CrossRef]
- Unesco. Roadmap for Implementing the Global Action Programme on Education for Sustainable Development; Unesco: Paris, France, 2014. [Google Scholar]
- Rost, J.; Lauströer, A.; Raack, N. Kompetenzmodelle einer Bildung für Nachhaltigkeit. Chem. Sch. 2003, 52, 10–15. [Google Scholar]
- Rieckmann, M. Key Themes in Education for sustainable development. In Issues and Trends in Education for Sustainable Development; Leicht, A., Heiss, J., Byun, W.J., Eds.; UNESCO Publishing: Paris, France, 2018; Volume 5, pp. 61–84. [Google Scholar]
- United Nations. Sustainable Development Goals—17 Goals to Transform our World. Available online: http://www.un.org/sustainabledevelopment/sustainable-development-goals/ (accessed on 6 September 2018).
- Mehren, R.; Rempfler, A.; Buchholz, J.; Hartig, J.; Ulrich-Riedhammer, E.M. System competence modeling: Theoretical foundation and empirical validation of a model involving natural, social, and human-environment systems. J. Res. Sci. Teach. 2017, 55, 685–711. [Google Scholar] [CrossRef]
- Schuler, S.; Fanta, D.; Rosenkraenzer, F.; Rieß, W. Systems thinking within the scope of education for sustainable development (ESD)—A heuristic competence model as a basis for (science) teacher education. J. Geogr. High. Ed. 2017, 1–13. [Google Scholar] [CrossRef]
- Leat, D. Thinking Through Geography; Chris Kingston: London, UK, 1998. [Google Scholar]
- Trumpower, D.L.; Sharara, H.; Goldsmith, T.E. Specificity of Structural Assessment of Knowledge. 2010. Available online: https://ejournals.bc.edu/ojs/index.php/jtla/article/view/1624 (accessed on 29 January 2019).
- Baker, R.S. Data mining for education. Int. Encycl. Educ. 2010, 7, 112–118. [Google Scholar]
- Jensen, B.B.; Schnack, K. The Action Competence Approach in Environmental Education. Environ. Educ. Res. 1997, 3, 163–178. [Google Scholar] [CrossRef]
- Colucci-Gray, L.; Camino, E.; Barbiero, G.; Gray, D. From scientific literacy to sustainability literacy: An ecological framework for education. Sci. Educ. 2006, 90, 227–252. [Google Scholar] [CrossRef]
- Emery, K.; Harlow, D.; Whitmer, A.; Gaines, S. Compelling evidence: An influence on middle school students’ accounts that may impact decision-making about socioscientific issues. Environ. Educ. Res. 2016, 1–15. [Google Scholar] [CrossRef]
- Gresch, H.; Hasselhorn, M.; Bögeholz, S. Training in Decision-making Strategies: An approach to enhance students’ competence to deal with socio-scientific issues. Int. J. Sci. Educ. 2013, 35, 2587–2607. [Google Scholar] [CrossRef]
- Funke, J. Solving complex problems: Exploration and control of complex systems. In Complex Problem Solving: Principles and Mechanisms; L. Erlbaum Associates: Mahwah, NJ, USA, 1991; pp. 185–222. [Google Scholar]
- Hallitzky, M. Forschendes und selbstreflexives Lernen im Umgang mit Komplexität. In Kompetenzen der Bildung für Eine Nachhaltige Entwicklung: Operationalisierung, Messung, Rahmenbedingungen, Befunde; Bormann, I., de Haan, G., Eds.; Verlag für Sozialwissenschaften: Wiesbaden, Germany, 2008. [Google Scholar]
- Hmelo, C.E.; Holton, D.L.; Kolodner, J.L. Designing to Learn About Complex Systems. J. Learn. Sci. 2000, 9, 247–298. [Google Scholar] [CrossRef]
- UN General Assembly. Transforming Our World: The 2030 Agenda for Sustainable Development; United Nations: New York, NY, USA, 2015. [Google Scholar]
- World Commission on Environment and Development. Our Common Future; Oxford University Press: Oxford, UK, 1987. [Google Scholar]
- Simonneaux, J.; Simonneaux, L. Educational configurations for teaching environmental socioscientific issues within the perspective of sustainability. Res. Sci. Educ. 2012, 42, 75–94. [Google Scholar] [CrossRef]
- Gausmann, E.; Eggert, S.; Hasselhorn, M.; Watermann, R.; Bögeholz, S. Wie verarbeiten Schüler/innen Sachinformationen in Problem-und Entscheidungssituationen Nachhaltiger Entwicklung? Ein Beitrag zur Bewertungskompetenz. Projekt Bewertungskompetenz. In Kompetenzmodellierung. Zwischenbilanz des DFG-Schwerpunktprogramms und Perspektiven des Forschungsansatzes; Klieme, E., Leutner, D., Kenk, M., Eds.; Beltz: Weinheim, Basel, 2010; pp. 204–215. [Google Scholar]
- Hmelo-Silver, C.E.; Jordan, R.; Liu, L.; Gray, S.; Demeter, M.; Rugaber, S.; Vattam, S.; Goel, A. Focusing on Function: Thinking below the Surface of Complex Natural Systems. Sci. Scope 2008, 31, 27–35. [Google Scholar]
- Rieß, W. Bildung für nachaltige Entwicklung (BNE) und Förderung systemischen Denkes. Anliegen Nat. 2013, 35, 55–64. [Google Scholar]
- Geiger, S.M.; Fischer, D.; Schrader, U. Measuring what matters in sustainable consumption: An integrative framework for the selection of relevant behaviors. Sustain. Dev. 2018, 26, 18–33. [Google Scholar] [CrossRef]
- Haugwitz, M.; Sandmann, A. Kooperatives Concept Mapping in Biologie: Effekte auf den Wissenserwerb und die Behaltensleistung. Z. Didak. Naturwissensch. 2009, 15, 89–107. [Google Scholar]
- Applis, S. Global learning in a geography course using the mystery method as an approach to complex issues. Rev. Int. Geogr. Educ. Online 2014, 4, 58. [Google Scholar]
- Wu, Y.T.; Tsai, C.C. High school students’ informal reasoning regarding a socio-scientific issue, with relation to scientific epistemological beliefs and cognitive structures. Int. J. Sci. Educ. 2011, 33, 371–400. [Google Scholar] [CrossRef]
- Wu, Y.T.; Tsai, C.C. High school students’ informal reasoning on a socio-scientific issue: Qualitative and quantitative analyses. Int. J. Sci. Educ. 2007, 29, 1163–1187. [Google Scholar] [CrossRef]
- Topcu, M.S.; Sadler, T.D.; Yilmaz-Tuzun, O. Preservice science teachers’ informal reasoning about socioscientific issues: The influence of issue context. Int. J. Sci. Educ. 2010, 32, 2475–2495. [Google Scholar] [CrossRef]
- Vankan, L.; van der Schee, J. Leren Denken Met Aardrijkskunde; Stichting Omgeving en Educatie: Nijmege, The Netherlands, 2004. [Google Scholar]
- Schuler, S.; Vankan, L.; Rohwer, G. Diercke Methoden. Denken Lernen Mit Geographie; Westermann: Braunschweig, Germany, 2007. [Google Scholar]
- Novak, J.D.; Cañas, A.J. The Theory Underlying Concept Maps and How to Construct and Use Them; Institute for Human and Machine Cognition: Pensacola, FL, USA, 2008. [Google Scholar]
- Karkdijk, J.; van der Schee, J.; Admiraal, W. Effects of teaching with mysteries on students’ geographical thinking skills. Int. Res. Geogr. Environ. Educ. 2013, 22, 183–190. [Google Scholar] [CrossRef]
- Karkdijk, J.; van der Schee, J.A.; Admiraal, W.F. Students’ geographical relational thinking when solving mysteries. Int. Res. Geogr. Environ. Educ. 2018, 1–17. [Google Scholar] [CrossRef]
- Applis, S. Geography teachers’ concepts of working with Thinking Through Geography strategies–results of an empirical reconstructive study. Int. Res. Geogr. Environ. Educ. 2016, 25, 195–210. [Google Scholar] [CrossRef]
- Van der Schee, J.; Leat, D.; Vankan, L. Effects of the Use of Thinking Through Geography Strategies. Int. Res. Geogr. Environ. Educ. 2006, 15, 124–133. [Google Scholar] [CrossRef]
- Leat, D.; Nichols, A. Brains on the Table: Diagnostic and formative assessment through observation. Assess. Educ. Princ. Policy Pract. 2010, 7, 103–121. [Google Scholar] [CrossRef]
- Rempfler, A.; Uphues, R. System Competence in Geography Education. Development of competence models, diagnosing pupils’ achievement. Eur. J. Geogr. 2012, 3, 6–22. [Google Scholar]
- Rempfler, A.; Uphues, R. Sozialökologisches Systemverständnis: Grundlage für die Modellierung von geographischer Systemkompetenz. Geogr. Didak. 2010, 38, 205–217. [Google Scholar]
- Byrne, J.; Ideland, M.; Malmberg, C.; Grace, M. Climate change and everyday life: Repertoires children use to negotiate a socio-scientific issue. Int. J. Sci. Educ. 2014, 36, 1491–1509. [Google Scholar] [CrossRef]
- Sadler, B. Sustainable development and water resource management. Alternatives 1990, 17, 14–24. [Google Scholar]
- Benninghaus, J.C.; Kremer, K.; Sprenger, S. Assessing high-school students’ conceptions of global water consumption and sustainability. Int. Res. Geogr. Environ. Educ. 2017, 1–17. [Google Scholar] [CrossRef]
- Novak, J.D.; Gowin, B. Learning How to Learn; Cambridge University Press: Cambridge, NY, USA, 1984. [Google Scholar]
- Kinchin, I.M.; Hay, D.B.; Adams, A. How a qualitative approach to concept map analysis can be used to aid learning by illustrating patterns of conceptual development. Educ. Res. 2000, 42, 43–57. [Google Scholar] [CrossRef]
- Rye, J.A.; Rubba, P.A. Scoring concept maps: An expert map-based scheme weighted for relationships. Sch. Sci. Math. 2002, 102, 33–44. [Google Scholar] [CrossRef]
- Balakrishnan, R.; Ranganathan, K. A Textbook of Graph Theory; Springer Science & Business Media: New York, NY, USA, 2012; Volume 2. [Google Scholar]
- Schvaneveldt, R.W. Pathfinder Associative Networks: Studies in Knowledge Organization; Ablex Publishing: New York, NY, USA, 1990. [Google Scholar]
- Muehling, A. Concept Landscapes-A New Way of Using Concept Maps. J. Educ. Data Min. 2017, 9, 1–30. [Google Scholar]
- Kolstø, S.D. Patterns in students’ argumentation confronted with a risk-focused socio-scientific issue. Int. J. Sci. Educ. 2006, 28, 1689–1716. [Google Scholar] [CrossRef]
- Kolstø, S.D. ‘To trust or not to trust,…’-pupils’ ways of judging information encountered in a socio-scientific issue. Int. J. Sci. Educ. 2001, 23, 877–901. [Google Scholar] [CrossRef]
- Rieß, W.; Schuler, S.; Hörsch, C. Wie lässt sich systemisches Denken vermitteln und fördern? Theoretische Grundlagen und praktische Umsetzung am Beispiel eines Seminars für Lehramtsstudierende. Geogr. Sch. 2015, 37, 16–29. [Google Scholar]
- Dorussen, H.; Lenz, H.; Blavoukos, S. Assessing the reliability and validity of expert interviews. Eur. Union Politics 2005, 6, 315–337. [Google Scholar] [CrossRef]
- Fanta, D.; Bräutigam, J.; Greiff, S.; Rieß, W. Entwicklung und Validierung eines Messinstrumentes zur Erfassung von systemischem Denken bei Lehramtsstudierenden in ökologischen Kontexten. Z. Didak. Naturwissensch. 2017, 23, 241–259. [Google Scholar] [CrossRef]
- Sommer, C. Untersuchung der Systemkompetenz von Grundschülern im Bereich Biologie; Christian-Albrechts Universität Kiel: Kiel, Germany, 2005. [Google Scholar]
- Assaraf, O.B.Z.; Orion, N. Development of system thinking skills in the context of earth system education. J. Res. Sci. Teach. 2005, 42, 518–560. [Google Scholar] [CrossRef]
- Hämäläinen, W.; Vinni, M. Classifiers for Educational Data Mining. 2011. Available online: https://pdfs.semanticscholar.org/0a64/44a685294d1a979ee15d26d09d9183399db3.pdf (accessed on 29 January 2019).
- Romero, C.; Ventura, S.; Pechenizkiy, M.; Baker, R.S. Handbook of Educational Data Mining; CRC Press: Boca Raton, FL, USA, 2010. [Google Scholar]


| Weighting | Frequency |
|---|---|
| 8 | 2 |
| 7 | 4 |
| 6 | 7 |
| 5 | 9 |
| 4 | 4 |
| 3 | 14 |
| 2 | 23 |
| 1 | 26 |
© 2019 by the authors. Licensee MDPI, Basel, Switzerland. This article is an open access article distributed under the terms and conditions of the Creative Commons Attribution (CC BY) license (http://creativecommons.org/licenses/by/4.0/).
Share and Cite
Benninghaus, J.C.; Mühling, A.; Kremer, K.; Sprenger, S. Complexity in Education for Sustainable Consumption—An Educational Data Mining Approach using Mysteries. Sustainability 2019, 11, 722. https://doi.org/10.3390/su11030722
Benninghaus JC, Mühling A, Kremer K, Sprenger S. Complexity in Education for Sustainable Consumption—An Educational Data Mining Approach using Mysteries. Sustainability. 2019; 11(3):722. https://doi.org/10.3390/su11030722
Chicago/Turabian StyleBenninghaus, Jens Christian, Andreas Mühling, Kerstin Kremer, and Sandra Sprenger. 2019. "Complexity in Education for Sustainable Consumption—An Educational Data Mining Approach using Mysteries" Sustainability 11, no. 3: 722. https://doi.org/10.3390/su11030722
APA StyleBenninghaus, J. C., Mühling, A., Kremer, K., & Sprenger, S. (2019). Complexity in Education for Sustainable Consumption—An Educational Data Mining Approach using Mysteries. Sustainability, 11(3), 722. https://doi.org/10.3390/su11030722