Abstract
The development of smart cities has greatly improved the living and working environment of urban residents, but whether it can enhance the happiness of urban residents is a controversial topic. In this study, we investigate residents’ experiences of obtaining information, services and networks in smart cities from the aspects of safety, usefulness and convenience, and empirically explore their relationship with residents’ subjective well-being (SWB). The results show that residents’ safety, usefulness and convenience experiences of obtaining information, services and networks in smart cities all have positive impacts on their SWB, and the relationship between residents’ safety experience and SWB is, to a certain extent, mediated by their usefulness and convenience experiences.
1. Introduction
Since the concept of the smart city first appeared in the 1990s [1,2], the theoretical research dynamics and practical development status of smart cities have attracted the extensive attention of academic circles and industry internationally [3]. Anthopoulos [3] provides an “umbrella” definition of the smart city: new or existing cities or regions that use ICT (information and communication technology) and innovation as a means to achieve sustainability in economic, social and environmental terms, and to address several challenges dealing with six dimensions (people, economy, governance, mobility, environment and living). The ultimate goals of a smart city are convenience of public services; livability of the living environment; smartness of infrastructure; long-term effectiveness of network security; and strength of the economic outlook [4].
Smart infrastructure and smart services (SISS) are the core elements of a smart city [5]. Smart infrastructure includes hard infrastructure (all urban facilities and all ICT-based hardware) and soft infrastructure (individuals and groups of people living in the city, business processes, software applications and data), which are equipped with the latest ICT to provide corresponding smart services [3]. The International Standards Organization (ISO) has explained the types of smart services, including climate change adaptation, e-government, transport, logistics, healthcare, energy and resources, environmental protection, public safety, and community and household [4,6]. The technology in smart cities itself is not used to provide smart services [7]. Smart services use ICT and hard and soft infrastructure to provide “products, services and utilities” to stakeholders, so as to improve the quality of life and livability of the whole city [3,8].
The Chinese government attaches great importance to the development of smart cities, especially the construction of smart infrastructure. All construction investment is to improve the service level of government and social institutions to citizens [9]. According to the New Smart City Development Report 2017, intelligent infrastructure includes information infrastructure (sensing infrastructure, passive and active network facilities, user-side peripheral equipment) and intelligent municipal infrastructure (synthesis pipe gallery, the sponge city, municipal utility, big data platform and information network transmission), aiming at solving the problems of urban citizen service and municipal issues [9]. In China, information and services acquired by residents in smart cities are provided by smart infrastructure, including transportation, employment, government affairs, online education, urban supervision and management, social security, medical care, mobile internet life, city cards and wireless networks [9]. Hangzhou, one of the pilot smart cities in China, has been accelerating the development of smart city models since 2012, and has completed the construction of intelligent digital urban management systems and integrated command systems. As of the end of September 2016, the timely settlement rate of urban management issues in Hangzhou’s urban management public cases increased from the initial 26.7% to 99.33%, and the construction effect was very significant [9].
Although theoretical research and practical construction have been effective, the field of the smart city is still in its infancy, and there is a certain gap between utopia and reality [5,10]. The development of smart cities costs a lot of money, but its initial basic goals have never been fully met [11]. Considering the complexity of the real situation, the urgent task for the development of smart cities is not to make multi-faceted investment with existing resources and funds, but to focus on the areas that are in shortage and in urgent need for improvement, so as to formulate a development strategy of smart cities [12]. The application of information technology has been deeply rooted in people’s work and life, and the demand of residents to participate in urban management has increased significantly, and they require a higher level of public management and public service level [13]. Improving residents’ sense of well-being has become the main driving force and ultimate goal of smart city construction in various countries [14], which is also listed as an important indicator of the smart city evaluation system [15].
Subjective well-being (SWB) measures quality of life and determines the importance of smart cities in people’s lives [16]. Different countries and cities have different levels of development, and residents’ experiences and demands for happiness are also at different levels [17,18]. At present, some scholars have begun to pay attention to the topic of well-being brought by the smart city to the residents [19]. The Dubai government has committed to applying the smart city’s hardware and software technology to the improvement of happiness and proposed the ABCDE model of needs linked to SWB, namely, affective and emotional (A), basic (B), cognitive and evaluative (C), deeper and eudaimonic (D), and enabling (E) [20]. In South Korea, practical research on smart tourism technology (STT) has been shown to increase the happiness of tourists [21]. Vagnoli et al. [22] developed the SensorWebBike service framework by using the network information technology of a smart city, aiming at more effective monitoring of urban air quality and improving the living environment of urban residents.
Although the research process of the smart city has been in place for more than 20 years, current research on the smart city focuses more on its definition, practical application, commercial value and management [3], and rarely considers the direct feelings brought by the development of a smart city to its urban residents, and especially their SWB [23,24]. Our contribution lies in that, firstly, we focus on the subjective feelings of smart city development on urban residents’ happiness, which enriches the theoretical research on smart city development. Secondly, safety experience, usefulness experience and convenience experience are introduced to empirically study the driving factors of residents’ SWB in smart cities, and a theoretical model is constructed. Finally, it provides an experience-feedback-oriented research direction for the future development of smart cities.
Based on the above theoretical research basis, this paper explores the impact mechanism of intelligent infrastructure and intelligent services on the SWB of residents in smart cities from residents’ perceptions. Through the use of questionnaire survey data from 247 residents in China’s smart cities, we examine relevant research hypotheses and propose guidelines and strategies to promote the long-term development of smart cities.
2. Theoretical Background and Research Hypotheses
SWB is an important concept in the field of positive psychology and quality of life, and refers to an overall assessment of an individual’s self-state and quality of life in a certain period of time, including life satisfaction, positive emotion, and negative emotion [17]. Positive and negative emotions are also generally considered as the perceptual dimension of SWB, which refers to individuals’ perception of their own subjective emotions; life satisfaction is considered to be the cognitive dimension of SWB, which refers to individuals’ perception and evaluation of their current living conditions [17]. With changes of the environment and the way of interaction between people and the environment, the individual’s SWB also changes [25]. The introduction of SISS is the most important feature distinguishing a smart city from other urban concepts. This paper will explore the impact of this environmental change on residents’ SWB.
In the marketing research field, experience becomes the third key element in attracting consumer attention to consume products and services beyond functionality and quality [26]. The experience stems from a series of complex interactions between customers and products [27]. Through the use of the product, customers can create their own unique experiences [28]. Pine and Gilmore [29] classify consumer experiences into four types based on the customer engagement and the desire or performance of customer access to the activity: entertainment (passive-absorption), educational (active-absorption), escapist (active-immersion), and esthetic (passive-immersion). Schmitt [30] defined the customer experience in five dimensions: sensory experiences (sense); affective experiences (feel); creative cognitive experiences (think); physical experiences, behaviors, and lifestyles (act); and social identity experiences. Gentile, Spiller and Noci [26] proposed six components of customer experience based on previous research, namely, sensorial, emotional, cognitive, pragmatic, lifestyle and relational. In recent years, the experience is increasingly recognized as a multi-dimensional and holistic evaluation applied to marketing and tourism, including all kinds of perceptions and cognitive evaluations of users in the process of consuming products and services [26,27]. In this paper, we portray the concept of experience in the marketing field to the development of smart cities, describing a variety of various functional perceptions and evaluations that urban residents bring in the process of using smart infrastructure and enjoying services. The information security of the system was a concern to the citizens participating in the project of a smart city [31], and the perceived usefulness and the perceived ease of use are the two main factors affecting users’ acceptance and behavior when using the new system [32], as well as the drivers of urban residents’ use of SISS. This paper portrays the functional experiences generated by urban residents using SISS with regard to three aspects: security, usefulness, and ease of use, and attempts to explore their impact on the SWB of urban residents.
Creating an effective user experience within a smart city is an important factor of success [33]. The Stimulus-Organism-Response (SOR) framework of environmental psychology argues that objective conditions such as atmosphere, design, and social factors stimulate consumer perceptions [34]. In smart cities, SISS, as a kind of artificially created activity scene, will inspire urban residents to participate actively or passively and produce various experiences. Residents’ personal experiences of SISS may change their situations and paces of life, which may directly affect emotional changes, different levels of needs and cognitive attitudes [20]. In addition, experiential marketing can provide emotional and functional values through feel perception, think perception, and service quality to induce customer satisfaction in hotels and the tourism industry [35]. At the same time, self-determination theory argues that when a person’s behavior satisfies the three basic psychological needs of ability, relationship, and autonomy, the individual’s well-being increases [36]. Based on the above analysis, we believe that the three functional experiences brought about by urban residents using smart infrastructure and enjoying services can enhance the satisfaction of their three basic psychological needs, thus promoting their well-being.
2.1. Residents’ Safety Experience and Their SWB in the Smart City
When urban residents use SISS, their personal information and activity trajectories will inevitably be recorded and preserved by relevant smart devices, and they will become a key resource for related operators of the smart city to provide intelligent and personalized services to residents [37]. According to exchange theory, this phenomenon can be understood as a kind of exchange of realism, that is, the exchange of individual privacy information for high-quality services [38]. Safety experience refers to the security residents feel when using SISS, especially the perception of personal information and that their behaviors are not disclosed and utilized [39]. In the process of information transmission and processing, whether information will be leaked will affect the user’s psychological cognition and behavioral judgment [40,41]. Safety experience reflects residents’ psychological cognition of the risk of information leakage caused by the use of SISS, and it has an important impact on their living and working conditions.
Although different countries’ governments have different attitudes toward the privacy issue and have built different legislative systems, and users also have different ideas when private information are collected [42], the private information security of residents has always been the focus of smart city development. Li et al. [43] and Kansal [44] pointed out that a poor safety experience would make users confused and doubtful about the quality of the services provided online, and even fall into negative emotion in severe cases. The studies [45] on privacy concerns also pointed out that even if the user’s private information was not revealed, the users’ privacy concerns caused by enjoying online services would produce a feeling of anxiety that affected their emotions and quality of life. Hayes et al. [46], Dinev and Hart [47], and Hsiao and Hwang [37] found that, if certain commitments were given to residents on the information supervision platforms of a smart city, and residents were clearly told that their personal information was protected, they would be more confident of smart city development, especially SISS. The increased safety experience will reduce residents’ privacy concerns, and raise their faith in SISS [47], which in turn will make them enjoy the pleasure and happiness in the use of SISS [48], and give rise to good SWB. Moreover, a safety experience can enable urban residents to show positive self-sense, which can bring a sense of control and emotional pleasure [49]. Moreover, urban residents will pay more attention to personal development and self-expression, which can promote their well-being by meeting basic psychological needs [50]. Based on this, Hypothesis 1 was proposed.
Hypothesis 1.
Residents’ safety experience in a smart city is positively related to their SWB.
2.2. Residents’ Usefulness Experience and Their SWB in the Smart City
In the technology acceptance model (TAM), perceived usefulness is a key factor in explaining a user’s acceptance of a new system. It refers to the user’s perception of a particular system that contributes to improving their performance [32]. The usefulness experience broadens the application range of perceived usefulness and reflects the extent to which user needs are effectively met [51]. It is mainly used to describe urban residents’ perception of the information and service they get by SISS that is beneficial for the improvement in the quality of their life and job.
According to the theory of self-determination, individuals have three basic psychological needs: autonomy need, competence need and relatedness need [52]. The competence need is individuals’ self-confidence and efficacy perceived in their interaction with social environment [53]. When an individual’s competence need is met, their well-being will rise [54]. A good usefulness experience means that the information and services that urban residents have access to through SISS can actually improve their quality of life and job performance [5]. This experience can enhance residents’ self-efficacy, including better adaption to the social environment and accomplishing their tasks more efficiently [55]. That is, to some extent, their competence need is better met, which will lead to higher life satisfaction and more pleasure for urban residents. In addition, when urban residents have a good usefulness experience, they will strengthen their pursuit of a better life in the future [56,57], which will make residents produce positive emotions, such as optimism, and alleviate their negative emotions brought about by life and work stress, such as anxiety and tension [58]. Based on this, we propose Hypothesis 2.
Hypothesis 2.
Residents’ usefulness experience in a smart city is positively related to their SWB.
A good usefulness experience can bring positive emotions and inner satisfaction to urban residents [58], but they will feel hesitant if they need to sacrifice personal privacy [45]. Although some users are willing to provide more private information to obtain personalized services [59,60], self-protection awareness has prompted rejection and aversion to personal privacy breaches [44]. This means security, especially information security, is a prerequisite for residents to obtain the information and services they need through SISS. A good safety experience enables residents to generate trust in SISS. This trust not only allows urban residents to enjoy pleasure in the use of SISS and to be satisfied with the urban environment, but also allows them to better concentrate to accomplish specific tasks through SISS, which will enhance residents’ usefulness experience. Therefore, we believe that safety experience not only directly affects residents’ SWB, but also produces an indirect promotion by enhancing the usefulness experience of urban residents. Based on this, we propose Hypothesis 3.
Hypothesis 3.
Usefulness experience in a smart city mediates the impact of residents’ safety experience on their SWB.
2.3. Residents’ Convenience Experience and Their SWB in a Smart City
Significant costs and energy consumption have been saved by efficiently using information and communication technologies (ICTs), which have improved service quality and brought convenience to residents’ lives [61]. Convenience experience refers to the degree of convenience experienced by urban residents in the use of SISS, especially in terms of time and effort savings [62,63]. In the process of purchasing or consuming goods and services, the convenience of products or services will affect the users’ mood and attitudes, and willingness to continue to use [64]. The convenience experience reflects residents’ psychological cognition of the time and energy saved by the use of SISS. It not only determines their willingness to use the facilities and services, but also affects their attitude towards the working and living environment and their own emotions.
A good convenience experience means that urban residents can easily learn to use SISS, which will affect their SWB in the following two aspects. On the one hand, the mastery and rapid operation of SISS will bring them confidence and a sense of accomplishment, which will improve their self-efficacy and behavioral initiative by enhancing self-association [65,66]. In this way, residents’ need for autonomy and competence will be better satisfied, and their happiness will be improved [67]. On the other hand, an effective convenience experience will help residents save time and effort in accessing information and services based on SISS [24,63,68], which allows them to have more time and energy to engage in social interactions and interpersonal communication than before. Moreover, self-determination theory believes that the satisfaction of individuals’ relatedness need is related to social interaction and interpersonal relationships, which is beneficial to individuals’ pursuit of meaningful happiness [50,69]. In addition, Colwell et al. [70] also pointed out that the more convenient it is for the user to enjoy the service, the higher their life satisfaction. Conversely, the more complex it is for the user to acquire the service, the more bored and disgusted the user is [71], which in turn creates some negative emotion and reduces their SWB [31]. Based on this, we propose Hypothesis 4.
Hypothesis 4.
Residents’ convenience experience in a smart city is positively related to their subject well-being.
As long as there are safety risks, such as the risk of private information leakage of residents, even if smart facilities and services are very easy to use, they will be questioned and distrusted by the residents of a smart city. The safety experience is the main focus of residents on smart city development, and is the basic premise for residents in deciding to use SISS [31]. A good safety experience means that when urban residents use SISS to obtain information and services, their safety, especially information security, can be effectively guaranteed. This guarantee for SISS is like the brand of the product, with value-added functions, which can bring praise to the convenience experience for SISS. At the same time, this safety experience will also alleviate residents’ security concerns and allow them to focus more on the operational use of SISS for a better convenience experience [72,73,74]. Therefore, we believe that the safety experience not only directly affects residents’ SWB, but also produces an indirect promotion by enhancing the convenience experience of urban residents. Based on this, we propose Hypothesis 5.
Hypothesis 5.
Residents’ convenience experience mediates the impact of residents’ safety experience and their SWB.
Based on the above theoretical analysis, a conceptual model was proposed in this study, as shown in Figure 1.
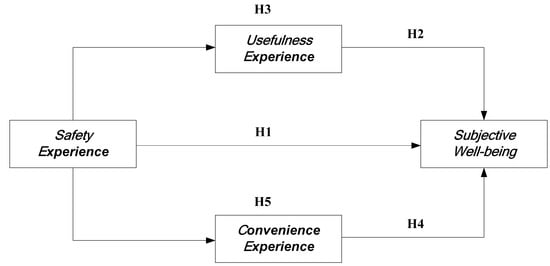
Figure 1.
Conceptual model.
3. Methods
3.1. Questionnaire Design
This paper adopted a questionnaire to collect data, consisting of three parts. Firstly, the specification of the questionnaire explains the purpose of this study to the respondent, and promises that questionnaire responses will be anonymous that the data obtained will be used only for scientific research and is strictly confidential, and encourages the respondent to fill it out with confidence. The second part is the main content of the questionnaire, including the measurement of the safety experience, usefulness experience, convenience experience, and SWB. Each concept is clearly defined before each variable is measured to facilitate the correct understanding of the measurement item by the respondent. The third part comprises the demographic characteristic variables, which collects the basic information of the respondent, including basic information, such as gender, age, work, health, living city, and education.
3.2. Measurement
To ensure the validity and reliability of the measurement tool, the study utilized established scales to detect the core variables of the study. The Likert 6-point scale was used for this questionnaire (1 = completely disagree; 6 = completely agree). To ensure the effectiveness of the questionnaire, before the formalization of this research questionnaire and investigation, we conducted a small-scale pre-study of residents in Guangzhou, a representative smart city in China. After carefully listening to the respondents’ opinions on the questionnaire, some statements were adjusted accordingly to minimize loopholes, such as unclear expressions and unreasonable design of the items. Finally, the content and number of items, and the wording of the questionnaire, were revised to form a final draft to guarantee the scientific and normative nature of the research tools. Measurement of key constructs can be found in Table A1 of Appendix A.
Security is one of the most important aspects of smart city concerns, involving the sustainable development of smart cities and the well-being of urban residents [39]. To measure residents’ perception of their information and behaviors exposed in a smart city, the scale was modified from Hayes et al. [46] and includes three items: “The information is credible”, “These services are of guaranteed quality”, and “The process of obtaining such information or services is secure”.
Usefulness experience measures the extent to which urban residents’ needs for life are met, as well as the perceived degree of living standard and job performance. The concept of perceived usefulness in the TAM was combined with the measurement scale of Adams et al. [51] to obtain five items, namely, “The way this information or service is obtained is easy to learn and master”, “The operation to obtain this information or service is simple”, “The instructions for obtaining the information or service are clear and easy to understand”, “It does not take much time to become an expert in accessing the information or services”, and “These information or services can be accessed quickly in lots of ways”.
Convenience experience measures the extent to which smart city residents spend time and effort on accessing services. This article uses the scale proposed by Seiders, Voss, Godfrey and Grewal [63] to measure the convenience experience, which comprises five items: “It makes me more efficient”, “It improved my work performance”, “It perfected my work environment”, “It improved my quality of life” and “It makes my life more convenient”.
SWB is an evaluation of people’s affection and cognition, including the three dimensions of satisfaction with life, positive emotion and negative emotion [75]. For the measurement of satisfaction with life, this paper uses the scale proposed by Diener et al. [76] to determine how satisfied city residents are in the perception of SISS, including five items, such as “My living conditions are great”. The measurement of positive emotion and negative emotion was performed using the scale of Watson et al. [77]. The items of positive emotion include “Active”, “Enthusiastic”, and “Happy”. The five items of negative emotion include “Ashamed”, “Sad”, and “Afraid”.
In addition, we also consider control variables that may affect SWB. Derdikman-Eiron et al. [78] and Kroll [79] have shown that men are more sensitive to emotional changes in happiness and women are happier. A study by Siedlecki et al. [80] indicates that there is a more complex link between residents’ SWB and age. Shier et al. [81] argue that whether a user has a job also affects their cognitive judgment of happiness in life. A study by Lee and Browne [82] shows that people with physical and mental health are happier. In addition, people with good education have lower emotional distress, and higher SWB [83], since SISS are easier to understand and accept for people with higher education levels [84]. Therefore, this paper chooses gender, age, work, health and education as control variables.
3.3. Sample and Data Collection
The formal research of this study was conducted by urban residents of 220 new smart cities evaluated by the China Development and Reform Commission in 2017. The data collection work was conducted from March 2018 to the end of July 2018. Considering that the domain of the target of the questionnaire was too scattered, we used the third-party platform Questionnaire Star (China’s largest questionnaire distribution platform) to produce an electronic questionnaire, and then distribute it randomly across the country. A total of 516 questionnaires were distributed, eliminating the questionnaires filled out by non-smart urban residents whose respondents had never used mobile payment (Alipay, WeChat, etc.) for purchase transactions, and those with more than 5% of the items not answered. Finally, 247 valid questionnaires were obtained, and the effective questionnaire recovery rate was 47.87%.
4. Analysis and Results
4.1. Reliability and Validity Analysis
We use the Cronbach’s alpha value to test the reliability. As the results of Table 1 show, the Cronbach’s alpha values of safety experience, usefulness experience, convenience experience, the satisfaction with life, positive emotion and negative emotion were, respectively, 0.865, 0.901, 0.920, 0.908, 0.934 and 0.885. All values exceeded the critical value of 0.7, indicating that the study scale had good internal consistency.

Table 1.
The measurement model.
The measurement items in this study are from maturity scales of various variable fields, which guarantees the content validity of the scale. Furthermore, the use of confirmatory factor analysis (CFA) measures the aggregate validity of each scale. The results show that the fitting index of the overall measurement model is within the acceptable range (χ2/df = 2.005; CFI = 0.935; TLI = 0.926; IFI = 0.935; RMR = 0.062). As shown in Table 1, the factor load values of each index are greater than 0.6 and highly significant on the corresponding latent variables. The composite reliability (CR) of each variable is above 0.7, and the average variance extracted value (AVE) of each variable is greater than 0.6, which indicates that the data has a high degree of aggregation validity.
Because measurement items were answered completely by self-reporting of residents, there may be common method variance (CMV). We used the Harman’s single-factor test to determine the range of CMV to reduce its impact on the results of the study. The results showed that principal component analysis extracted six factors with a total variance of 71.78%. There was no single factor, and the first factor accounted for only 37.29% of the interpretation variance. Therefore, this study largely controls the common method variance.
4.2. Descriptive Statistics of the Latent Constructs
The correlation coefficients between the variables and the mean and standard deviation of the respective variables can be seen in Table 2. Safety experience is significantly positively correlated with useful experience (r = 0.632, p < 0.01), and has a significant positive correlation with convenience experience (r = 0.695, p < 0.01). As for the correlations between the three experiences and SWB, safety experience has a significant positive correlation with SWB (r = 0.436, p < 0.01), usefulness experience has a significant positive correlation with SWB (r = 0.419, p < 0.01), and convenience experience has a significant positive correlation with SWB (r = 0.447, p < 0.01). These results formed the basis of subsequent regression analysis.
Table 2.
Descriptive statistics and correlation analysis.
4.3. Hierarchical Regression Analysis
Our hypotheses were tested by using hierarchical linear regression analysis and the results are shown in Table 3. Model 1 (M1), Model 3 (M3), and Model 5 (M5) represent benchmark models for different dependent variables (M1 for UE; M3 for CE; M5 for SWE) with controlled variables, and examined the effects of gender, age, work, health, and education. Models 6 (M6), 7 (M7), and 8 (M8) were used to verify the impact of resident’s safety experience, usefulness experience and convenience experience in a smart city on their SWB, respectively. We used Model 2 (M2), 4 (M4), 9 (M9) and 10 (M10) to examine the mediation effect of the useful experience and convenience of smart city residents on their relationship between safety experience and SWB. Model 11 (M11) is used to test the stability of the relationship between variables. The variance inflation factor of all models was less than 10, indicating that the model did not suffer from multicollinearity and the results were reliable.
Table 3.
Results of hierarchical regression analysis.
Firstly, we tested the effect of resident’s safety experience in a smart city on their SWB. Compared to Model 5, adding safety experience in Model 6 contributes 17% of the variance (ΔR2 = 0.17, p < 0.001). Residents’ safety experience significantly affected their SWB (β = 0.42, p < 0.001); thus, Hypothesis 1 was verified. In the process of using SISS, residents are very concerned about information security and personal information privacy [37]. Furthermore, the above result shows that the better the residents’ safety experience, the stronger their SWB will be. This result supported Hayes’s [46] view that, through monitoring and protecting personal privacy information in related service platforms of a smart city, a safe social atmosphere was created in which residents become more confident in SISS, and get more satisfaction and happiness by using them.
Secondly, we tested the effect of residents’ usefulness experience in a smart city on their SWB. Compared to Model 5, adding usefulness experience in Model 7 contributes 19% of the variance (ΔR2 = 0.19, p < 0.001). Usefulness experience of residents significantly positively affects SWB (β = 0.41, p < 0.001); thus, Hypothesis 2 was verified. The outcome demonstrated that residents’ usefulness experience of SISS can predict their SWB in a smart city, and the government as a designer and promoter of a smart city should pay more attention to residents’ usefulness experience and information security. Furthermore, the mediation of residents’ usefulness experience in the smart city between their safety experience and SWB was analyzed using the procedure recommended by Baron and Kenny [85]. Comparing Model 2 with Model 1, 35% of the variance was explained in Model 2 (ΔR2 = 0.35, p < 0.001). In addition, it can be seen that the residents’ safety experience significantly positively affects their usefulness experience (β = 0.61, p < 0.001). Apart from this, adding the mediating variable (usefulness experience) in Model 9 compared to Model 6 contributes 3% of the variance (ΔR2 = 0.03, p < 0.01). Specifically, the results indicated the positive effect of residents’ safety experience on their SWB decreased (β dropped from 0.42 to 0.28), which indicates that usefulness experience partially mediates the relationship between residents’ safety experience and their SWB. Hypothesis 3 was supported, meaning that residents’ usefulness experience can not only directly enhance their SWB, but also serves as a bridge between the impact of security experience on SWB.
Furthermore, we tested the effects of residents’ convenience experience in a smart city on their SWB. Compared to Model 5, adding convenience experience in Model 8 contributes 20% of the variance (ΔR2 = 0.20, p < 0.001). Residents’ convenience experience had a significant positive impact on their SWB (β = 0.43, p < 0.001); thus, Hypothesis 4 was confirmed. This result complements the view of Hayat [61]. Through the use of SISS, residents save time and cost in their daily lives and work, and enjoy more convenience, which can encourage them to maintain a pleasant mood and an optimistic attitude. Similarly, we further tested the mediating effect of residents’ convenience experience. Comparing Model 4 with Model 3, 40% of the variance was explained in Model 4 (ΔR2 = 0.40, p < 0.001). In addition, it can be seen that residents’ safety experience significantly positively affected their convenience experience (β = 0.65, p < 0.001). It can be seen from the above results that the better the residents’ information and trajectory on the related platforms of a smart city are protected, the better the convenience experience they enjoy. Additionally, adding the mediating variable (convenience experience) in Model 10 compared to Model 6, contributes 3.1% of the variance (ΔR2 = 0.031, p < 0.01). In addition, the positive effect of residents’ safety experience on their SWB decreased (β dropped from 0.42 to 0.26), which indicates that convenience experience partially mediates the relationship between residents’ safety experience and their SWB. Hypothesis 5 was supported, indicating that residents’ convenience experience cannot only directly enhance their SWB, but also indirectly plays a bridge role in the influence of safety experience on SWB. In Model 11, we can also find that resident’s safety, usefulness and convenience experience all significantly positively affected their SWB (β = 0.2, p < 0.05; β = 0.18, p < 0.05; β = 0.18, p < 0.05), which again supports above research hypothesis.
5. Conclusions
From the perspective of security, usefulness and convenience, we investigated the impact of residents’ experience on their SWB. Through the empirical analysis of questionnaire data of 247 urban residents in Chinese smart cities, the relationship between residents’ experience and their SWB was explored. First, we found that residents’ safety experience not only played a positive role in their usefulness experience and convenience experience, but also had a positive effect on their SWB. This reveals that the safety experience is the basis for residents to obtain happiness from the use of SISS. In particular, if the safety experience is not guaranteed, the residents’ usefulness experience and convenience experience will be greatly reduced. Second, residents’ usefulness experience and convenience experience not only play a positive role in their SWB, but also mediate the positive impact of residents’ safety experience on their SWB. This shows that the roles of safety experience, usefulness experience and convenience experience are different in affecting residents’ SWB. In summary, with consideration of residents’ experience of SISS, these results supported the views of Anthopoulos [3], Visvizi and Lytras [24], and Lytras and Visvizi [39] regarding the relationship of smart city construction and residents’ well-being: safety, usefulness and convenience are three key characteristics of residents’ experience in SISS influencing their SWB. In addition, we incorporated residents’ experience into smart city construction, which expanded the research scope of the smart city from urban planning and technological progress to a humanistic perspective, and promoted user orientation in smart city construction.
Our findings have important managerial implications for smart city construction. Firstly, the development of smart cities relies on ICT, and increasing individual behavioral information is actively or passively entered into the smart city network. The storage and transmission of such information requires a high degree of security and confidentiality, and the perception of the residential network security environment is the basis for improving the usefulness experience, convenience experience and SWB. Second, there are differences between individuals, who are always pursuing services that meet their needs and maximize their own interests. The experience is concerned with the willingness and behavior of urban residents to participate, directly affecting their happiness. Therefore, the development of smart cities not only pays attention to the general needs of urban residents, but also satisfies their personalized needs, which is one of the important factors to improve the well-being of smart cities in the future. Finally, intelligent services meet the needs of people through the construction of intelligent infrastructure, which emphasizes that SISS is targeted at people. This also reminds governments, enterprises and relevant institutions to avoid blindness in the construction of smart cities (for example, economic development and government stimulating domestic demand and improving enterprise performance).
We acknowledge several limitations of this study, which also point to possible future research directions. First, we utilized a self-reported survey and a convenient sample research approach to collect the data. Future research may expand the geographical scope of the sample. Second, safety experience, usefulness experience and convenience experience are just three experiences that affect residents’ SWB in a smart city. The experiences of residents are complex and changeable, and there may be other dimensions of residents’ experiences that affect their SWB in a smart city, which is subject to further research and further exploration. Third, in this paper, the control variables have no substantial effect on subjective well-being. More control variables that may have a substantial impact on subjective well-being, such as marriage, personality traits, beliefs, etc., should be considered in the follow-up studies. In addition, regional culture and specific life events will also affect individuals’ perceptions and attitudes towards life and work. Future research can also take them into account and conduct detailed research. They can also be considered in the future to explore the possible differences between long-term factors and sudden factors.
Author Contributions
C.L. and Y.W. conceived and designed the experiments; C.L. performed the experiments; G.Z. and C.Y. analyzed the data; Y.W. contributed reagents/materials/analysis tools; C.L., G.Z. and C.Y. wrote the paper.
Funding
This study was supported financially by the National Social Science Foundation of China (18ZDA062), Fund for Social and Soft Science Projects of Fujian Province in China (FJ2017B012; 20180063) and Science and Technology Projects of Guangdong Province in China (2016B070702001, 2017A070707001).
Acknowledgments
The authors wish to thank the referees for their constructive comments. The valuable suggestions of guest editors to improve this paper are also gratefully acknowledged.
Conflicts of Interest
The authors declare no conflict of interest.
Appendix A
Table A1.
Measurement of key constructs.
Table A1.
Measurement of key constructs.
| Construct | Measurement Items | |
|---|---|---|
| Safety experience | The information is credible. | |
| These services are of guaranteed quality. | ||
| The process of obtaining such information or services is secure. | ||
| Convenience experience | The way these information or services are obtained is easy to learn and master. | |
| The operation to obtain this information or service is simple. | ||
| The instructions for obtaining the information or service are clear and easy to understand. | ||
| It does not take much time to become an expert in accessing the information or services. | ||
| These information or services can be accessed quickly in lots of ways. | ||
| Usefulness experience | It makes me more efficient. | |
| It improved my work performance. | ||
| It perfected my work environment. | ||
| It improved my quality of life. | ||
| It makes my life more convenient. | ||
| SWB | The satisfaction with life | In most ways, my life is close to my ideal. |
| My living conditions are great. | ||
| I’m happy with my life. | ||
| So far, I’ve gained the important things I want in life. | ||
| If I could start my life over, I would change almost nothing. | ||
| Positive emotion | Active | |
| Enthusiastic | ||
| Happy | ||
| Elated | ||
| Excited | ||
| Negative emotion | Ashamed | |
| Sad | ||
| Afraid | ||
| Nervous | ||
| Horrified | ||
References
- Graham, S.; Aurigi, A. Urbanising cyberspace? The nature and potential of the virtual cities movement. City 1997, 2, 18–39. [Google Scholar] [CrossRef]
- Van den Besselaar, P.; Beckers, D. Demographics and sociographics of the digital city. In Community Computing and Support Systems: Social Interaction in Networked Communities; Ishida, T., Ed.; Springer: Berlin/Heidelberg, Germany, 1998; pp. 108–124. [Google Scholar]
- Anthopoulos, L.G. Understanding Smart Cities: A Tool for Smart Government or an Industrial Trick? Springer: Cham, Switzerland, 2017. [Google Scholar]
- ISO. Smart cities—Preliminary Report 2014. Available online: http://www.iso.org/iso/smart_cities_report-jtc1.pdf (accessed on 26 January 2019).
- Janssen, M.; Anthopoulos, L.; Weerakkody, V. A unified smart city model USCM for smart city conceptualization and benchmarking. Int. J. Electron. Gov. Res. 2016, 12, 77–93. [Google Scholar] [CrossRef]
- Bruzzi, S.; Landa, P.; Tànfani, E.; Testi, A. Conceptual modelling of the flow of frail elderly through acute-care hospitals: An evidence-based management approach. Manag. Decis. 2018, 56, 2101–2124. [Google Scholar] [CrossRef]
- Anthopoulos, L.; Janssen, M.; Weerakkody, V. Smart service portfolios: Do the cities follow standards? In Proceedings of the 25th International Conference Companion on World Wide Web, Montréal, QC, Canada, 11–15 April 2016; pp. 357–362. [Google Scholar]
- Zygiaris, S. Smart city reference model: Assisting planners to conceptualize the building of smart city innovation ecosystems. J Know. Econ. 2013, 4, 217–231. [Google Scholar] [CrossRef]
- Nianxiu, L.; Rongwen, Z. New Smart City Development Report 2017 Edition; China Planning Press: Beijing, China, 2017. [Google Scholar]
- Anthopoulos, L. Smart utopia VS smart reality: Learning by experience from 10 smart city cases. Cities 2017, 63, 128–148. [Google Scholar] [CrossRef]
- Yigitcanlar, T.; Lee, S.H. Korean ubiquitous-eco-city: A smart-sustainable urban form or a branding hoax? Technol. Forecast. Soc. Chang. 2014, 89, 100–114. [Google Scholar] [CrossRef]
- Angelidou, M. Smart city policies: A spatial approach. Cities 2014, 41, S3–S11. [Google Scholar] [CrossRef]
- Pan, Y. A Global review on smart city development. In Strategic Research on Construction and Promotion of China’s Intelligent Cities: General Report; Springer: Singapore, 2018; pp. 1–27. [Google Scholar]
- Wang, W.; Wu, Y.C.J.; Yuan, C.H.; Xiong, H.; Liu, W.J. Use of social media in uncovering information services for people with disabilities in China. Int. Rev. Res. Open Distance Learn. 2017, 18, 65–83. [Google Scholar] [CrossRef]
- Chiang, H.H.; Chien, L.H.; Lin, J.S.; Yeh, Y.H.; Lee, T.S.H. Modeling psychological well-being and family relationships among retired older people in Taiwan. Int. J. Ment. Health Nurs. 2013, 22, 93–101. [Google Scholar] [CrossRef]
- Sunderlin, W.; de Sassi, C.; Ekaputri, A.; Light, M.; Pratama, C. REDD+ contribution to well-being and income is marginal: The perspective of local stakeholders. Forests 2017, 8, 125. [Google Scholar] [CrossRef]
- Diener, E. Subjective well-being. The science of happiness and a proposal for a national index. Am. Psychol. 2000, 55, 34. [Google Scholar] [CrossRef] [PubMed]
- Fu, T.S.T.; Tuan, Y.C.; Yen, M.Y.; Wu, W.H.; Huang, C.W.; Chen, W.T.; et al. Psychometric properties of the World Health Organization quality of life assessment—Brief in methadone patients: A validation study in northern Taiwan. Harm Reduct. J. 2013, 10, 37. [Google Scholar] [CrossRef]
- Wu, Y.; Liu, W.J.; Yuan, C.H. A Mobile-based Barrier-free Service Transportation Platform for People with Disabilities. Comput. Hum. Behav. 2018, in press. [Google Scholar] [CrossRef]
- Al-Azzawi, A. Dubai happiness agenda: Engineering the happiest city on earth. In Smart Cities in the Gulf: Current State, Opportunities, and Challenges; Samad, W.A., Azar, E., Eds.; Springer: Singapore, 2019; pp. 195–221. [Google Scholar]
- Lee, J.; Lee, H.; Chung, N.; Koo, C. An Integrative Model of the Pursuit of Happiness and the Role of Smart Tourism Technology: A Case of International Tourists in Seoul; Schegg, R., Stangl, B., Eds.; Springer: Cham, Switzerland, 2017; pp. 173–186. [Google Scholar]
- Vagnoli, C.; Martelli, F.; Filippis, T.D.; Lonardo, S.D.; Gioli, B.; Gualtieri, G.; et al. The sensorwebbike for air quality monitoring in a smart city. In Proceedings of the IET Conference on Future Intelligent Cities, London, UK, 4–5 December 2014; pp. 1–4. [Google Scholar]
- Chou, H.W.; Lin, Y.H.; Chou, S.B. Team cognition, collective efficacy, and performance in strategic decision-making teams. Soc. Behav. Pers. 2012, 40, 381–394. [Google Scholar] [CrossRef]
- Visvizi, A.; Lytras, M. It’s not a fad: Smart cities and smart villages research in European and global contexts. Sustainability 2018, 10, 2727. [Google Scholar] [CrossRef]
- Lischetzke, T.; Eid, M. Why extraverts are happier than introverts: The role of mood regulation. J. Pers. 2006, 74, 1127–1162. [Google Scholar] [CrossRef] [PubMed]
- Gentile, C.; Spiller, N.; Noci, G. How to sustain the customer experience: An overview of experience components that co-create value with the customer. Eur. Manag. J. 2007, 25, 395–410. [Google Scholar] [CrossRef]
- Hosany, S.; Witham, M. Dimensions of cruisers’ experiences, satisfaction, and intention to recommend. J. Travel Res. 2010, 49, 351–364. [Google Scholar] [CrossRef]
- Prahalad, C.K.; Ramaswamy, V. Co-creation experiences: The next practice in value creation. J. Interact. Mark. 2004, 18, 5–14. [Google Scholar] [CrossRef]
- Pine, B.J.; Gilmore, J.H. Welcome to the experience economy. Harv. Bus. Rev. 1998, 76, 97–105. [Google Scholar] [CrossRef] [PubMed]
- Schmitt, B.H. Experiential Marketing: How to Get Customers to Sense, Feel, Think, Act, Relate to Your Company and Brands; Free Press: New York, NY, USA, 1999. [Google Scholar]
- Cilliers, L.; Flowerday, S. Information security in a public safety, participatory crowdsourcing smart city project. In Proceedings of the Internet Security, London, UK, 8–10 December 2014. [Google Scholar]
- Venkatesh, V.; Davis, F.D. A theoretical extension of the technology acceptance model: Four longitudinal field studies. Manag. Sci. 2000, 44, 186–204. [Google Scholar] [CrossRef]
- Sheth, A.; Srivastava, B.; Michahelles, F. IoT-enhanced human experience. IEEE Pervasive Comput. 2018, 22, 4–7. [Google Scholar] [CrossRef]
- Mehrabian, A.; Russell, J.A. An Approach to Environmental Psychology; The MIT Press: Cambridge, MA, USA, 1974. [Google Scholar]
- Yuan, Y.-H.E.; Wu, C.K. Relationships among experiential marketing, experiential value, and customer satisfaction. J. Hosp. Tour. Res. 2008, 32, 387–410. [Google Scholar] [CrossRef]
- Deci, E.L.; Ryan, R.M. Handbook of Self-Determination Research; University Rochester Press: Rochester, NY, USA, 2002. [Google Scholar]
- Hsiao, Y.C.; Hwang, G.H. Chinese wall security model for workflow management systems with dynamic security policy. J. Inf. Sci. Eng. 2013, 29, 417–440. [Google Scholar]
- Culnan, M.J.; Bies, R.J. Consumer privacy: Balancing economic and justice considerations. J. Soc. Issues 2003, 59, 323–342. [Google Scholar] [CrossRef]
- Lytras, M.; Visvizi, A. Who uses smart city services and what to make of it: toward interdisciplinary smart cities research. Sustainability 2018, 10, 1998. [Google Scholar] [CrossRef]
- Nyshadham, E.A.; Castano, D. Affect and online privacy concerns. SSRN Electron. J. 2012, May, 1–9. [Google Scholar] [CrossRef]
- Hallam, C.; Zanella, G. Online self-disclosure: The privacy paradox explained as a temporally discounted balance between concerns and rewards. Comput. Hum. Behav. 2017, 68, 217–227. [Google Scholar] [CrossRef]
- Cooper, R.; Assal, H.; Chiasson, S. Cross-national privacy concerns on data collection by government agencies. In Proceedings of the Privacy, Security and Trust, Calgary, AB, Canada, 28–30 August 2017. [Google Scholar]
- Li, H.; Sarathy, R.; Zhang, J. The role of emotions in shaping consumers’ privacy beliefs about unfamiliar online vendors. J. Inf. Priv. Secur. 2008, 4, 36–62. [Google Scholar] [CrossRef]
- Kansal, P. Online privacy concerns and consumer reactions: Insights for future strategies. J. Indian J. Bus. Res. 2014, 6, 190–212. [Google Scholar] [CrossRef]
- Shaughnessy, K.; Rocheleau, J.N.; Kamalou, S.; Moscovitch, D.A. the effects of social anxiety and online privacy concern on individual differences in internet-based interaction anxiety and communication preferences. Cyberpsychology Behav. Soc. Netw. 2017, 20, 212. [Google Scholar] [CrossRef] [PubMed]
- Hayes, B.E.; Perander, J.; Smecko, T.; Trask, J. Measuring perceptions of workplace safety: Development and validation of the work safety scale. J. Saf. Res. 1998, 29, 145–161. [Google Scholar] [CrossRef]
- Dinev, T.; Hart, P. An extended privacy calculus model for e-commerce transactions. Inf. Syst. Res. 2006, 17, 61–80. [Google Scholar] [CrossRef]
- Wang, S.T.; Lin, R.L. Perceived quality factors of location-based apps on trust, perceived privacy risk, and continuous usage intention. Behav. Inf. Technol. 2017, 36, 2–10. [Google Scholar] [CrossRef]
- Dunn, E.W.; Aknin, L.B.; Norton, M.I. Spending money on others promotes happiness. Science 2008, 319, 1687–1688. [Google Scholar] [CrossRef]
- Ryan, R.M.; Huta, V.; Deci, E.L. Living well: A self-determination theory perspective on eudaimonia. J. Happiness Stud. 2008, 9, 139–170. [Google Scholar] [CrossRef]
- Adams, D.A.; Nelson, R.R.; Todd, P.A. Perceived usefulness, ease of use, and usage of information technology: A replication. MIS Q. 1992, 16, 227–247. [Google Scholar] [CrossRef]
- Baumeister, R.F.; Leary, M.R. The need to belong: Desire for interpersonal attachments as a fundamental human motivation. Psychol. Bull. 1995, 117, 497–529. [Google Scholar] [CrossRef]
- Deci, E.L. Intrinsic Motivation; Springer Publishing: New York, NY, USA, 1975. [Google Scholar]
- Martela, F.; Ryan, R.M.; Steger, M.F. Meaningfulness as satisfaction of autonomy, competence, relatedness, and beneficence: Comparing the four satisfactions and positive affect as predictors of meaning in life. J. Happiness Stud. 2018, 19, 1261–1282. [Google Scholar] [CrossRef]
- Abdelmotaleb, M.; Mohamed Metwally, A.B.E.; Saha, S.K. Exploring the impact of being perceived as a socially responsible organization on employee creativity. Manag. Decis. 2018, 56, 2325–2340. [Google Scholar] [CrossRef]
- Caruana, A.; Money, A.H.; Berthon, P.R. Service quality and satisfaction—The moderating role of value. Eur. J. Mark. 2000, 34, 1338–1353. [Google Scholar] [CrossRef]
- Wu, Y.; Wu, Y.; Wu, S. Development and challenges of social enterprises in Taiwan—From the perspective of community development. Sustainability 2018, 10, 1797. [Google Scholar] [CrossRef]
- Meneghel, I.; Salanova, M.; Martínez, I.M. Feeling good makes us stronger: How team resilience mediates the effect of positive emotions on team performance. J. Happiness Stud. 2016, 17, 239–255. [Google Scholar] [CrossRef]
- Li, K.; Wang, X.; Li, K.; Che, J. Information privacy disclosure on social network sites: An empirical investigation from social exchange perspective. Nankai Busi. Rev. Int. 2016, 7, 282–300. [Google Scholar] [CrossRef]
- King, J. Privacy, Disclosure, and Social Exchange Theory. UC Berkeley, 2018. [Google Scholar]
- Hayat, P. Smart Cities: A Global Perspective. Ind. Q 2016, 72, 177–191. [Google Scholar] [CrossRef]
- Berry, L.L.; Seiders, K.; Grewal, D. Understanding service convenience. J. Mark. 2002, 66, 1–17. [Google Scholar] [CrossRef]
- Seiders, K.; Voss, G.B.; Godfrey, A.L.; Grewal, D. SERVCON: Development and validation of a multidimensional service convenience scale. J. Acad. Mark. Sci. 2007, 35, 144–156. [Google Scholar] [CrossRef]
- Chen, S.; Li, J. Factors influencing the consumers’ willingness to buy in e-commerce. In Proceedings of the 2009 International Conference on E-Business and Information System Security, Wuhan, China, 23–24 May 2009. [Google Scholar]
- Thomas, R.; Millar, M. The effects of material and experiential discretionary purchases on consumer happiness: Moderators and mediators. J. Psychol. 2013, 147, 345–356. [Google Scholar] [CrossRef]
- Carter, T.J.; Gilovich, T. I am what I do, not what I have: The differential centrality of experiential and material purchases to the self. J. Pers. Soc. Psychol. 2012, 102, 1304–1317. [Google Scholar] [CrossRef]
- Guevarra, D.A.; Howell, R.T. To have in order to do: Exploring the effects of consuming experiential products on well-being. J. Consum. Psychol. 2015, 25, 28–41. [Google Scholar] [CrossRef]
- Eken, S.; Sayar, A. A smart bus tracking system based on location-aware services and QR codes. In Proceedings of the IEEE International Symposium on Innovations in Intelligent Systems and Applications, Alberobello, Italy, 23–25 June 2014; pp. 299–303. [Google Scholar]
- Tsaur, S.H.; Yen, C.H.; Hsiao, S.L. Transcendent experience, flow and happiness for mountain climbers. Int. J. Tour. Res. 2013, 15, 360–374. [Google Scholar] [CrossRef]
- Colwell, S.R.; Aung, M.; Kanetkar, V.; Holden, A.L. Toward a measure of service convenience: Multiple-item scale development and empirical test. J. Serv. Mark. 2008, 22, 160–169. [Google Scholar] [CrossRef]
- Lien, C.H.; Cao, Y.; Zhou, X. Service quality, satisfaction, stickiness, and usage intentions: An exploratory evaluation in the context of WeChat services. Comput. Hum. Behav. 2017, 68, 403–410. [Google Scholar] [CrossRef]
- Nam, T.; Pardo, T.A. Smart city as urban innovation: Focusing on management, policy, and context. In Proceedings of the 5th International Conference on Theory and Practice of Electronic Governance, Tallinn, Estonia, 26–29 September 2011; pp. 185–194. [Google Scholar]
- Martínez-Ballesté, A.; Pérez-Martínez, P.A.; Solanas, A. The pursuit of citizens’ privacy: A privacy-aware smart city is possible. IEEE Commun. Mag. 2013, 51, 136–141. [Google Scholar] [CrossRef]
- Wang, Y.; Huang, Y.; Louis, C. Towards a framework for privacy-aware mobile crowdsourcing. In Proceedings of the International Conference on Social Computing, Alexandria, VA, USA, 8–14 September 2013; pp. 454–459. [Google Scholar]
- Angner, E. Subjective well-being. J. Socio-Econ. 2010, 39, 361–368. [Google Scholar] [CrossRef]
- Diener, E.; Emmons, R.A.; Larsen, R.J.; Griffin, S. The satisfaction with life scale. J. Pers. Assess. 1985, 49, 71–75. [Google Scholar] [CrossRef]
- Watson, D.; Clark, L.A.; Tellegen, A. Development and validation of brief measures of positive and negative affect: The PANAS scales. J. Pers. Soc. Psychol. 1988, 54, 1063–1070. [Google Scholar] [CrossRef]
- Derdikman-Eiron, R.; Indredavik, M.S.; Bratberg, G.H.; Taraldsen, G.; Bakken, I.J.; Colton, M. Gender differences in subjective well-being, self-esteem and psychosocial functioning in adolescents with symptoms of anxiety and depression: Findings from the Nord-Trøndelag health study. Soc. Psych. Psych. Epid 2011, 52, 261–267. [Google Scholar] [CrossRef]
- Kroll, C. Different things make different people happy: Examining social capital and subjective well-being by gender and parental status. Soc. Indic. Res. 2011, 104, 157–177. [Google Scholar] [CrossRef]
- Siedlecki, K.L.; Salthouse, T.A.; Oishi, S.; Jeswani, S. The relationship between social support and subjective well-being across age. Soc. Indic. Res. 2014, 117, 561–576. [Google Scholar] [CrossRef]
- Shier, M.L.; Graham, J.R. Mindfulness, subjective well-being, and social work: Insight into their interconnection from social work practitioners. J. Soc. Work Educ. 2011, 30, 29–44. [Google Scholar] [CrossRef]
- Lee, A.; Browne, M.O. Subjective well-being, sociodemographic factors, mental and physical health of rural residents. Aust. J. Rural. Health 2008, 16, 290–296. [Google Scholar] [CrossRef]
- Ross, C.E.; Van Willigen, M. Education and the subjective quality of life. J. Health Soc. Behav. 1997, 38, 275–297. [Google Scholar] [CrossRef] [PubMed]
- Visvizi, A.; Lytras, M.D.; Damiani, E.; Mathkour, H. Policy making for smart cities: Innovation and social inclusive economic growth for sustainability. J. Sci. Tech. Police Manag. 2018, 9, 126–133. [Google Scholar] [CrossRef]
- Baron, R.M.; Kenny, D.A. The moderator-mediator variable distinction in social psychological research: Conceptual, strategic, and statistical considerations. J. Abnorm. Soc. Psychol. 1986, 51, 1173–1182. [Google Scholar] [CrossRef]
© 2019 by the authors. Licensee MDPI, Basel, Switzerland. This article is an open access article distributed under the terms and conditions of the Creative Commons Attribution (CC BY) license (http://creativecommons.org/licenses/by/4.0/).