Article

Building Consumer-Oriented CSR Differentiation Strategy

1
Scientific Laboratory of Economic Behaviors, School of Economics & Management, South China Normal University, Guangzhou 510006, China
2
Dept. of Business Administration, Guangzhou College of Technology and Business, Foshan 528000, China
3
School of Management and Economics, Beijing Institute of Technology, Beijing 100081, China
4
Sustainable Development Research Institute for Economy and Society of Beijing, Beijing 100081, China
*
Author to whom correspondence should be addressed.
Sustainability 2019, 11(3), 664; https://doi.org/10.3390/su11030664
Submission received: 5 January 2019 / Revised: 20 January 2019 / Accepted: 23 January 2019 / Published: 28 January 2019

Abstract

:
In a fierce competitive industry, firms conducting a corporate social responsibility (CSR) differentiation strategy can build a relative advantage. However, there is lack of literature to discuss the approach to identifying companies’ CSR differentiation conditions. Based on the theoretical foundations of consumers’ responses to CSR differentiation strategies, this paper proposes a consumer-oriented approach to identify CSR differentiation by using the best–worst scaling approach. In the context of the mobile phone industry, CSR activities were prioritized according to the extent to which they were valued by consumers. Consumers’ perceptions of the CSR activities of Huawei and Apple were also assessed in this study. Finally, the CSR differentiation conditions between the two companies was evaluated. The findings include the following: (1) the consumer priorities for different CSR activities vary greatly, and it is essential for firms to adopt a CSR differentiation strategy; (2) it is feasible to adopt a proper CSR premium in product pricing to build a socially responsible company; and (3) the lack of CSR communication between companies and consumers leads to consumers’ perceived distortion. The results provide implications for firms’ CSR practice.

1. Introduction

To date, corporate social responsibility (CSR) has been recognized and conducted by more and more firms [1,2]. Driven by practices of business, society and policy makers, the role of CSR will be given more attention in the near future [3]. Corporate stakeholders play an important role in moving this trend forward [4]. As an important member of the stakeholders’ group, consumers usually require companies to undertake certain social responsibilities while pursuing economic interests, and respond according to their CSR performance [5,6], finally reflected in supporting or boycotting companies and their products and services. There is a strong positive relationship between CSR and customer outcomes [7]. Consumers’ responses to CSR stimulate some enterprises to invest more resources into CSR with the intention to obtain better market returns through appropriate CSR activities. However, due to the distance barrier of communication and perception between consumers and companies, consumers have difficulties in perceiving CSR activities of companies. It is even a challenge to distinguish the differences among companies’ CSR activities. In short, CSR activities have different influences on consumers and are restricted by consumers’ perceptions for these activities. Therefore, to develop and make a full use of CSR’s positive impact on consumers, it is necessary for a company to distinguish itself from competitors by virtue of differentiated CSR.
Companies are currently in a strong competitive environment. CSR can be used as a differentiation strategy to cope with competitive pressures [8,9,10]. Kotler (2003) has defined differentiation as “the act of designing a set of meaningful differences to distinguish the company’s offerings from competitors’ offerings” [11]. Differentiation strategy means that a company chooses one or several characteristics that are considered important by customers in an industry and puts itself in a unique position to satisfy these characteristics. Differentiation strategy in practice is viewed as something distinctive that a company’s products are perceived by at least some consumers. The degree of differentiation of a company’s product is ultimately determined by consumers’ perceptions. To realize CSR differentiation, it is necessary to understand the difference in the degree of influence of different CSR activities on consumers. However, most related studies adopt a Likert scale method to directly measure the impact level of all CSR activities on consumers. This method requires an overly high discrimination capability for respondents. They may feel that it is difficult to judge when they are facing more than a dozen or more similar items. Data obtained from such surveys is of poor quality and the results are naturally doubtful. In addition, the extant literature has rarely discussed the approach to identify companies’ CSR differentiation conditions.
The objectives of this study are: (1) to propose a consumer-oriented approach to identify CSR differentiation between a company and its competitors in CSR implementation; (2) to prioritize a set of CSR activities from the consumer perspective in the context of the mobile phone industry; (3) to evaluate the CSR differentiation conditions between two companies in the mobile phone industry from the consumer perspective. The theoretical bases of this paper are consumers’ CSR responses and differentiation strategy, and the methodological bases are best–worst scaling and system analysis.
Almost all world-renowned mobile phones firms compete extremely fiercely in the Chinese market, with Huawei, Apple and Samsung having the better performances. These three enjoy high reputations and have large shares in the Chinese market. Currently, almost every adult in China has routine mobile phone use during daily life. They usually have knowledge of mobile phone manufacturers. Apple and Huawei are especially popular and have production bases in China. Thus, the mobile phone industry and these two cases, in particular, are selected as the research background due to their representativeness among consumers. In this study, Huawei is the benchmark firm and Apple is the control case. This arrangement provides the advantages of typical selection of industries and firms, a large number of qualified respondents, and a more accurate CSR perception from consumers.
The rest of this paper is structured as follows. In Section 2, a literature review regarding the CSR construct and best–worst Scaling is conducted. The approach to identify CSR differentiation is proposed in Section 3. In Section 4, CSR measurement and survey design are described. In Section 5, data collection and preliminary testing work are provided. The data analysis and results are presented in Section 6. The theoretical contributions, managerial implications and limitations of this study are discussed in Section 7.

2. Literature Review

2.1. CSR Construct and Differentiation Strategy

The CSR construct has undergone a lasting evolution and has been combined with issues in practice, such as human rights, labor rights, environmental protection, consumer protection and fighting corruption, and different definitions place different degrees of emphasis on these points [12,13,14]. More than 35 CSR definitions have been discussed in the literature [15]. Yet, none of these has been commonly accepted. This study is inclined to the definition by the European Commission (2001), that is, “a concept whereby companies integrate social and environmental concerns in their business operations and in their interaction with their stakeholders on a voluntary basis” [16]. This definition relates CSR to the triple bottom line theory [17] and the stakeholder theory [18], both of which have become important theoretical foundations. In the process of CSR conceptualization, stakeholder theory is one of most used theories to interpret CSR. According to this theory, firms should not only be responsible for the interests of shareholders, but also take into account of the interests of employees, customers, suppliers, the local community and other groups.
Due to the inconsistent agreement on the concept of CSR and the wide range of domains, scholars have proposed different measurements in certain contexts. For example, Turker (2009) proposes a four-dimensional structure of CSR from the corporate perspective, including CSR for social and non-social stakeholders (i.e., society, natural environment, future generations and non-governmental organizations), employees, customers and governments, and designs a scale through the systematic scale development process [19]. Öberseder, Schlegelmilch and Murphy (2013) offer a conceptualization of CSR from both corporate and consumer points of view: consumers, employees, shareholders, suppliers, the environment, society, local communities, governments, media, and competitors [20]. They argue that consumers pay different priorities to CSR in different fields, that is, the most important domains are employees, consumers and environment, followed by suppliers, society and local community. Öberseder et al. (2014) develop a comprehensive and validated scale of consumers’ perceptions of CSR (CPCSR) useful to both researchers and managers, which covers seven domains, i.e., consumers, employees, environment, suppliers, local community, society and shareholders [21]. In addition to the Öberseder et al. (2014) scale, there have been two scales associated with CSR and consumer behavior. Wagner, Bicen and Hall (2008) measure consumers’ perceptions of corporate social irresponsibility (CSIR) in the retail context [22], and Webb, Mohr and Harris (2008) measure socially responsible purchase and disposal (SRPD) behaviors [23]. However, the two scales are not comprehensive and only focus on the individual dimensions of CSR.
Overall, our research has extended the consumers’ perception on CSR based on prior research. For example, Öberseder, Schlegelmilch and Murphy (2013) discussed corporate practices and consumer perceptions related to CSR using qualitative data from interviews [20]. The conclusions from this study are more subjective due to using a small number of cases. Öberseder et al. (2014), Wagner, Bicen and Hall (2008), and Webb, Mohr and Harris (2008) made contributions to the measurements of CSR from the consumers’ perspective [21,22,23]. All these prior studies did not take into account the comparative importance of CSR activities from the consumers’ perspective. Unlike past studies focusing on measuring CSR perceptions, this study uses a new approach (i.e., best–worst scaling) to prioritize CSR activities according to the extent to which they were valued by consumers.
According to Porter (1985), there are three generic strategies (i.e., cost leadership, differentiation and focus) [24]. There is a strong interaction between cost minimization strategies, product differentiation strategies, and market focus strategies. The focus strategy is usually formed by the low-cost strategy and product differentiation strategies. The three generic strategies can be summarized as two basic strategies, i.e., cost leadership and differentiation. In terms of CSR practice, because of the conflict of high investment and better CSR performance, the low-cost strategy is not the best choice for firms. The best strategy is to conduct the differentiation strategy, which can help firms to win relative advantage. The CSR differentiation strategy not only improves reputation, but also attracts consumers to learn more about firms’ products or services.

2.2. Best–Worst Scaling

Best–worst scaling (BWS), also known as maximum difference scaling, is a contemporary method for the prioritization of items proposed by Louviere, and developed and applied in numerous works [25,26]. It can be seen as an extension of the paired comparison techniques for the simultaneous presentation of several items together to respondents. The choice is implemented by respondents who select which of several presented items is the best and worst. This method can effectively avoid the weakness of identifying items by using the Likert scale method. In BWS, the “best/worst” choice question consisting of several objects is called a task. A set of questions consisting of multiple tasks is called the MaxDiff problem. To ensure randomness, multiple versions of the MaxDiff problem are designed to correspond to different respondents. The BWS questionnaire design should meet four conditions: equal number of occurrences of each object, equal number of occurrences of two objects at the same time, equal frequency of occurrence of objects at each position in the task, and the ability for all objects to be connected. Professional software can be used to easily make the required questionnaire that meets the requirements. Sawtooth Software is the most authoritative and easy-to-use tool to generate BWS questionnaires. In the MaxDiff module of the software, the questionnaire of multiple versions can be automatically generated by entering an object list and relevant parameters.
BWS has been widely used and developed in many fields, such as social science [26]. It has been applied in the evaluation of corporate ethics and supply chain sustainability. For example, Auger, Devinney and Louviere (2007) investigate the differences in the attitudes towards social and ethical issues among more than 600 consumers across six countries using BWS [27]. Costanigro, Deselnicu and McFadde (2016) assess consumer priorities for the nine CSR activities in milk production using BWS [28]. Rezaei et al. (2016) propose a supplier selection life cycle approach integrating traditional and environmental criteria using BWS [29]. Ahmadi, Kusi-Sarpong and Rezaei (2017) assess the social sustainability of supply chains using BWS [30]. Ahmad et al. (2017) evaluate the external forces affecting the sustainability of the oil and gas supply chain using BWS [31].
There are three ways to measure consumers’ perceptions on comparative importance of CSR activities, including the direct Likert scale method, the indirect Likert scale method, and the comparison approaches. The direct Likert scale method directly measure consumers’ perception weight. Based on the measurement results of overall performance and each item performance, the indirect Likert scale method usually uses the regression analysis approach to get the weight for each CSR activity. Relying on the direct Likert scale method, the indirect method is more complex and needs a lot of data process work. The comparison approaches usually include Analytic Hierarchy Process (AHP) and BWS. AHP is conducted by comparing each pair of CSR activities, while BWS can be accurately used to make multi-object comparisons. From the above discussion, we can find that the direct Likert scale method is easy to use but has a high requirement of discrimination capability for respondents. BWS has better performance for accurately measuring consumers’ perceptions of the comparative importance and finding the weights for each CSR activity.

3. Approach to Identify CSR Differentiation

3.1. General Procedure of the Approach

The purpose of differentiation is to create the maximum difference between the added-buyer-value (and hence the premium) and the cost increased by uniqueness. The cost of operational differentiation varies with different value activities, and companies should choose the activities that contribute the most to the consumer value compared with its cost. Therefore, to build CSR differentiation, it is necessary to first know the value of different CSR activities, i.e., the consumer priorities for CSR activities, and then take them as the weights to comprehensively evaluate CSR differentiation in combination with the consumers’ perceptions for CSR activities of different companies.
The general approach to identify CSR differentiation proposed in this paper follows the following steps:
  • Determine proper CSR activities as CSR measurement indicators from the consumer perspective.
  • Design the questionnaire: using BWS to measure the consumer priorities for CSR activities, and using a Likert scale to measure the consumers’ comparative perceptions for CSR activities of two comparative companies.
  • Collect data and conduct preliminary testing.
  • Analyze the data and evaluate CSR differentiation.

3.2. The Method of Evaluating CSR Differentiation Degree

The hierarchical Bayesian algorithm and the count analysis method are two typical approaches to analyze data from BWS questionnaires. Compared with the former, which is complex and time-consuming, the latter is more convenient and simpler to calculate. When each object can appear at least three times, there is no significant difference between the results obtained by the hierarchical Bayesian algorithm and the count analysis method. In this study, each object in this questionnaire appears four times (see Section 4.2). Thus, the count analysis method was appropriate to select for data analysis. The count analysis method counts the number of times that each object is selected as “best” and “worst”, respectively, and then subtracts the value of the latter from the value of the former to get the preference score for each object.
Let Aij denote the consumer priority for CSR activity j in sample i, which is the difference between CSR activity j being selected as the most important number and the least important number. Let Bij denote the consumer’s comparative perception degree of CSR activity j in sample i. Let C denote the CSR differentiation degree of two companies. n is the sample size and m is the number of CSR activities. The assessment process is as follows:
  • For each sample, count each Aij and get Bij.
  • Use equation C = 1 n 1 n 1 m [ ( 4 + A i j ) · B i j ] to calculate C. Originally, A i j [ 4 , 4 ] . In order to conform to the normal comparison habit, the value range of A i j is adjusted to [0,8] by adding 4.
  • Calculate the upper bound and lower bound of C, and calculate the ratio of C to the upper bound or the lower bound, so as to observe the difference degree of CSR differentiation of two companies easily.

4. CSR Activities and Questionnaire Design

4.1. Consumer-Oriented CSR Activities

Referring to the work from Öberseder, Schlegelmilch and Murphy (2013), Öberseder et al. (2014) and some relevant Chinese literature, and considering the situation in the mobile phone industry [20,21], 13 CSR activities of four dimensions (see Table 1) are determined as the measurement indicators of CSR in this study.
In general, consumers attach the most importance to CSR related to their own interests, that is, the consumer domain. Because the rights and interests of consumers have not been respected properly in China, CSR to consumers is even more urgent. This study measures CSR to consumers from the following aspects: set fair prices for products; protect consumer privacy; deal with customer complaints and return requests promptly; and provide credible business and product information.
The concept of sustainable development is highly valued by the world’s major countries. ISO26000 and environmental protection law have detailed requirements on environmental protection. In China, environmental pollution damages the air, water and soil on which people depend. The good news is that the government has begun to tackle the problem. Now, consumers attach increasing importance to the environmental domain. Consumers will put pressure on companies with more severe environmental pollution. This study measures CSR to the environment from the following aspects: reduce and avoid pollution; invest in research and development regarding environmental protection; and waste product recycle.
Failure to fulfill CSR to employees may lead to conflicts between employees and companies, which will damage the company’s operation and cause a bad social impact. Consumers themselves are also employees of certain companies, and naturally they care a lot about CSR to employees. ISO26000 and SA8000 have detailed requirements for CSR to employees. This study measures CSR to employees from the following aspects: set decent working conditions; develop, support and train employees; and offer reasonable remuneration.
Consumers also attach more importance to the local community and society. In China, there is a wide gap between the rich and the poor, and a wide range of vulnerable groups exists. Consumers expect companies to do what they can to help vulnerable groups, participate in social public activities, serve local communities and promote the harmonious development of society. This study measures CSR to the local community and society from the following aspects: sponsoring local community and social public activities; create jobs for people in the region; and care for vulnerable groups.
This study does not consider CSR to shareholders and suppliers. The reasons include, first, CSR to shareholders and suppliers is difficult to perceive by consumers. Second, CSR to shareholders and suppliers produces no direct effect on consumers. Third, most of the extant Chinese literature on related research has not included supplier domain. In addition, according to Öberseder, Schlegelmilch and Murphy (2013), consumers attach little importance to CSR to media, government, competitors and other stakeholders [20]. Therefore, media domain, government domain and competitor domain are not considered in this study.

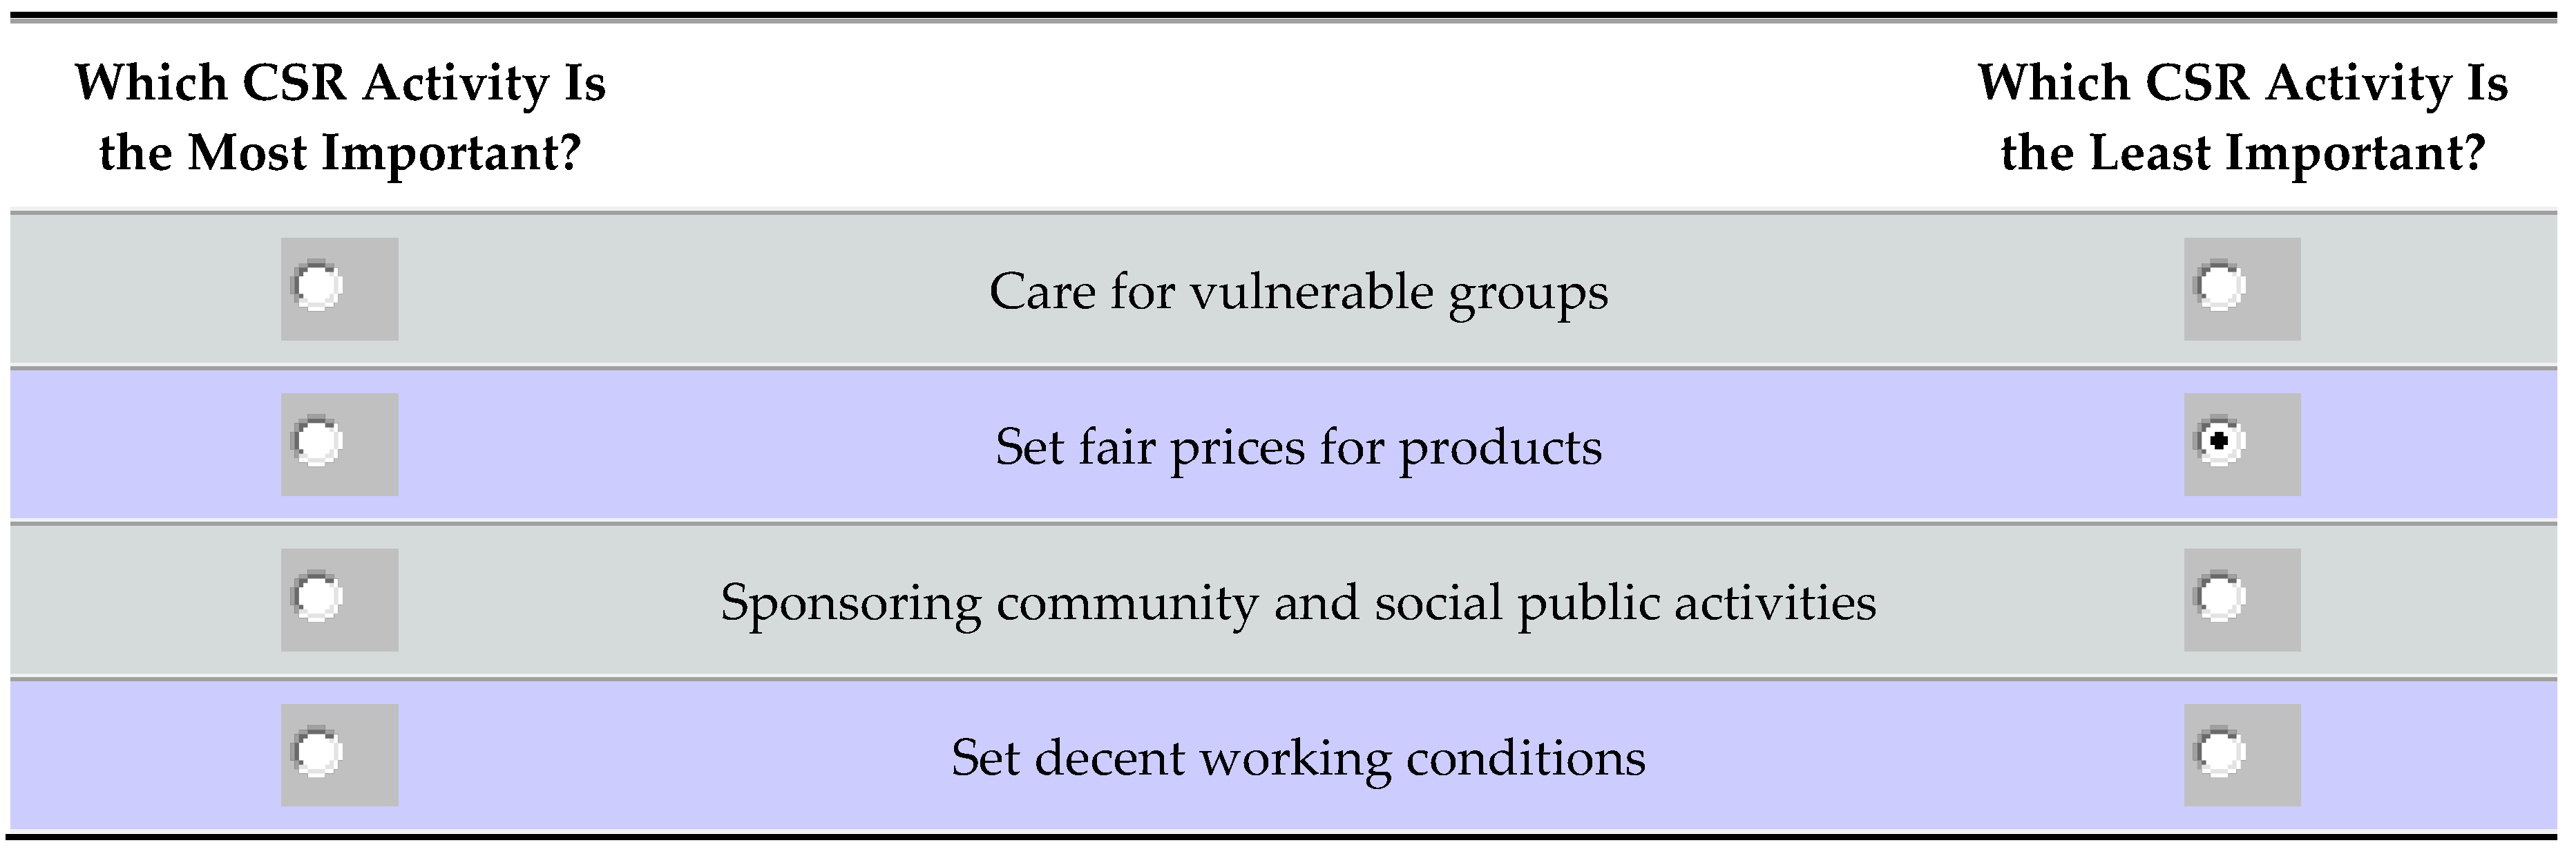
4.2. Questionnaire Design

The questionnaire includes three sections. The first part of the questionnaire was designed with BWS and the second was designed with the Likert scale method. The first part measured the consumer priorities for CSR activities. It was generated by Sawtooth Software SSI Web 6.4.6 (Sawtooth Software, Provo, UT, USA), and the main input parameters were thirteen objects (CSR activities in Table 1). Four objects formed a task (task example shown in Figure 1), thirteen tasks were a set, and the number of questionnaire versions was eight. The respondents were asked to select the most important CSR activity and the least important CSR activity in each task. The second part measured the consumers’ comparative perceptions of CSR activities, and used the relative comparative method to measure the consumer’s perception difference between Huawei and Apple in each CSR activity. The question was “How do you think Huawei’s performance in this CSR activity compared to Apple’s?”. Respondents marked their responses from −3 (much worse) to 3 (much better), with 0 indicating no difference in perception. The third part investigated respondent’s demographic information, including gender, age, education and monthly income.

5. Data Collection and Testing

5.1. Sample and Data Collection

We conducted pre-test and formal investigation in Guangzhou, China. The pre-test and related analysis work were conducted from October 2017 to November 2017. The respondents of the pre-test were invited from amongst co-authors’ friends and colleagues with knowledge of the firms’ CSR activities. Fifty questionnaires were collected at this stage. During the pre-test, we also had in-depth communication with respondents. The reliability and validity of the questionnaire were analyzed according to the survey results, and the questionnaire design was optimized based on the feedback of pre-test respondents. Subsequently, eight versions of the online questionnaire were produced using the website wjx.cn, which specializes in online questionnaires. The formal investigation was conducted from December 2017 to February 2018. The participants included college students, the co-authors’ circle of friends, and passers-by. College students were randomly selected in class. To encourage them to actively reply questions on our survey, we gave them small gifts as rewards. We also sent our survey to co-authors’ circle of friends via WeChat, a Chinese multi-purpose messaging and social media app developed by Tencent (Shenzhen, China). They were free to accept or refuse our survey. If they chose to respond on time, they were given CNY 6 as a reward (about USD 1). Passers-by were selected in a super shopping mall in Guangzhou, and also received a small gift if they filled in the survey. A total of 691 questionnaires were obtained, of which 34 questionnaires were excluded because of invalid responses, such as too much missing data and too many of the same answers. A total of 657 responses were valid for final analysis, resulting in a 95% validity rate. The demographic characteristics of the respondents are shown in Table 2.

5.2. Reliability and Validity Analysis

The first part of the questionnaire “the consumer priorities for CSR activities”, uses a non-Likert-style BWS survey. There is no need to do quantitative reliability and validity analysis. The reliability and validity analysis mainly are done for the second part of the questionnaire, “the consumers’ comparative perceptions degree of CSR activities”.
Cronbach’s alpha is used to measure the reliability of the scale. The Cronbach’s alpha coefficient of 13 CSR activities is 0.917, consumer dimension 0.769, environmental dimension 0.762, employee dimension 0.823, community and society dimension 0.811. Meanwhile, in the purification item check, except for the corrected item total correlation (CITC) of the first item, which is 0.453 (still greater than 0.35), the CITC of the remaining 12 items are greater than 0.5, indicating that all items can be kept. The above data show that the questionnaire has a good reliability.
There are several methods for validity analysis: content validity, criterion validity and structural validity. The results obtained by different methods reflect different aspects of validity. Content validity refers to whether the designed item can represent the content or subject to be measured, which is generally evaluated by logical analysis and statistical analysis. Since this study does not involve hypothesis testing between constructs, it is appropriate to use the content validity analysis method. In terms of logical analysis, the questionnaire in this study refers to relatively mature domestic and foreign studies, and is based on the opinions of relevant experts, so the logic is good. In terms of statistical analysis, the correlation analysis results are obtained by single-item and total correlation analysis. The results show that the correlations of each dimension are significant, and the correlation between each dimension and the score is also significant (p < 0.01), indicating the questionnaire used in this study is very effective.

6. Results

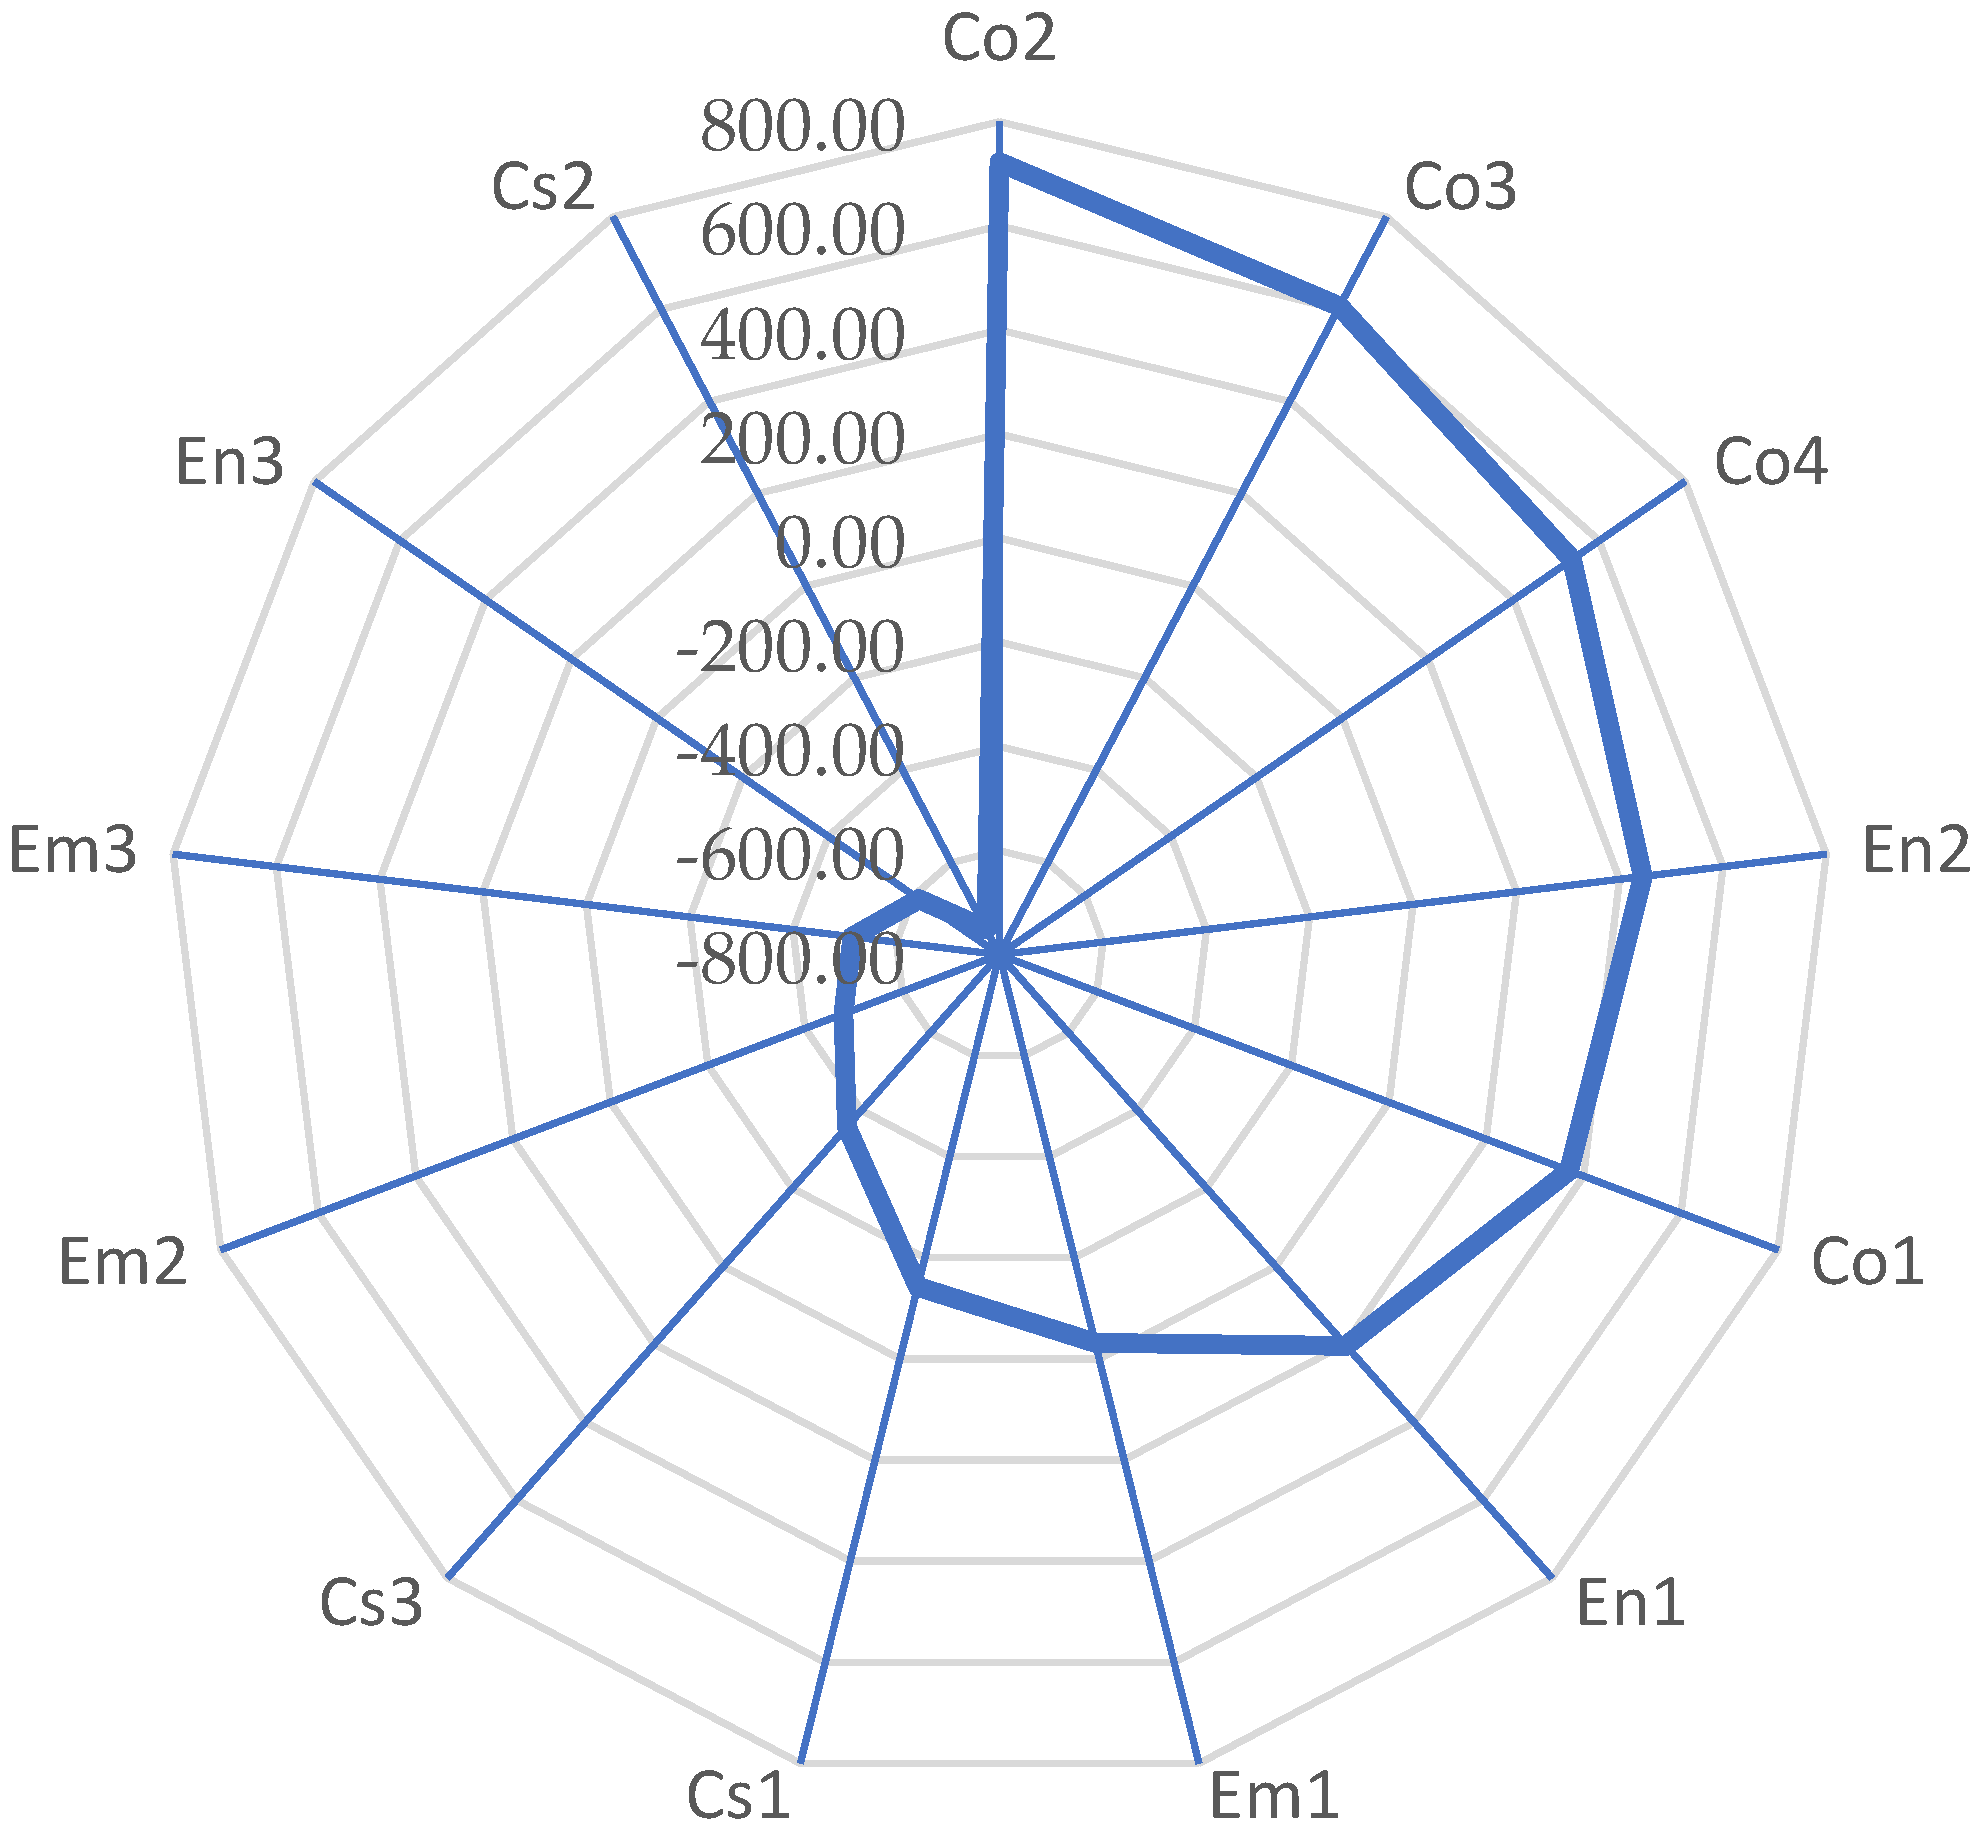
6.1. Ranking of Consumer Priorities for CSR Activities

According to the count analysis method of BWS, the scores and rankings of CSR activities are shown in Table 3 and Figure 2.
The first CSR activity ranking (that is, what consumers consider most important) is the activity “Protect customer privacy”, the second is the activity “Deal with customer complaints and return requests promptly”, and the third is the activity “Provide credible business and product information”. These three CSR activities belong to the consumer domain, with scores of 722, 606 and 536, respectively, so the fulfillment of CSR to consumer has the most impact on consumers. It can also be found that the gap among the top three CSR activities’ scores is not small, indicating that there is still a certain difference among the three activities from the consumers’ point of view. What consumers value most is the activity “Protect customer privacy”, which shows that the harm brought about by the leakage or illegal use of customer personal information should not be underestimated.
Ranked fourth is the activity “Invest in research and development regarding environmental protection” of the environmental domain with a score of 445. As far as the reality is concerned, there is considerable domestic and foreign legislation and propaganda on environmental protection, and the general public has an increasingly stronger awareness of environmental protection. Consumers attach great importance to the development of environmental protection technologies, so as to achieve the long-term stability of corporate environmental protection problems. Companies that ignore environmental protection will be punished in the consumer market.
The activity “Set fair prices for products” of the consumer domain ranks fifth, with a score of 370, which is significantly lower than the scores of the other three activities in the consumer domain. This shows that in the minds of consumers, the fairness of product pricing is not as important as people think compared to the other three consumer activities. This gives the company a signal that an appropriate CSR premium is acceptable to consumers in product pricing.
The sixth is the activity “Reduce and avoid pollution” of the environmental domain, with a score of 204. Compared with the fourth activity “Invest in research and development regarding environmental protection”, there is a big gap. This result indicates that in fulfilling CSR to the environment, consumers are more likely to expect companies to invest in research and development regarding environmental protection, and eliminating pollution from the source is more important than generally reducing and avoiding pollution.
Ranked seventh is the activity “Set decent working conditions” of employee domain, with a score of −32. This indicates that the times consumers chose the activity to be the least important are slightly greater than the times it was chosen to be the most important. This ranking is still important, because the other identity of the consumer is also the employee of a certain company. The empathy determines they cannot ignore the safe and comfortable working environment and conditions.
Ranked eighth is the activity “Sponsoring local community and social public activities” of the community and society domain, with a score of −143. Ranked ninth is the activity “Care for vulnerable groups”, also belonging to the community and society responsibility, with a score of −357, which is a large difference compared to the eighth-ranked activity, indicating that this activity is not very important to most consumers. The two activities belong to charitable responsibility, and it is surprising that their rankings are so low on the list.
Ranked tenth is the activity “Develop, support and train employees” of employee responsibility, with a score of −479. Ranked eleventh is the activity “Provide reasonable remuneration for employees” of the employee domain, with a score of −515. Consumers do not attach much importance to these two activities.
The activity “Waste product recycle”, belonging to the environmental domain, ranks the second-lowest with a score of −612. As far as we know, the waste mobile phone contains toxic and harmful substances such as lead, chromium and mercury, which, if not handled properly, will pose a huge threat to the environment and human health. The possible reasons why the recycling of waste mobile phones has not received much attention from consumers are as follows: (1) the financial interest obtained by consumers from the recycling of waste mobile phones is not great; (2) many mobile phone manufacturers have not carried out recycling activities of waste mobile phone; (3) consumers are worried that their privacy will be revealed after their mobile phones are recycled; (4) some consumers have weak environmental awareness; and (5) there is a lack of national policies and regulations on recycling of waste products.
The last ranking is the activity “Create jobs for people in the region” of the community and society domain, with a score of −745. This may be because businesses and local communities are inherently symbiotic. Setting up a company or factory in a place requires the support of the local community, which also drives the development of the local economy. In this process, it is an economic and natural choice for companies to provide jobs to local residents, so consumers generally do not value this CSR activity.
The above rankings largely support the discussion from Öberseder, Schlegelmilch and Murphy (2013), which notes that consumers attach more importance to CSR related to consumers, environment and employees [20]. Compared with their study, the comparison accuracy degree of this study reaches the activity level.

6.2. CSR Differentiation Evaluation

The second part of the questionnaire surveyed the consumers’ comparative perceptions of Huawei and Apple in fulfilling various CSR activities. The statistical results are shown in Table 4.
Regarding “Set fair prices for products”, the number of times the option “2” is chosen, meaning Huawei performed better than Apple in this CSR activity, is the most, accounting for 27.4% of the total, indicating that respondents clearly perceive that Huawei performs better than Apple in “Set fair prices for products”. However, in the remaining 12 CSR activities, the percentage choosing the option “0”, meaning no difference between Huawei and Apple is perceived, is about 40%. This indicates the differences between Huawei’s CSR activities and Apple’s CSR activities are not fully reflected. It can also be found that for each CSR activity, the number of times the options “1”, “2” and “3” are chosen is significantly higher than that of the options “−1”, “−2” and “−3”, which, to some extent, indicates that consumers believe that Huawei performs better than Apple in these CSR activities.
According to the evaluation method given above, the CSR differentiation degree of Huawei and Apple is calculated quantitatively, C = 25. In order to appreciate the size of this value intuitively, it is necessary to calculate the value range of CSR differentiation degree. Considering that the value range of comparative perception is [−3, 3], the CSR differentiation degree of the two companies is calculated, respectively, when the comparative perceptions are all −3 and 3. When the comparative perceptions are all −3, Cmin = −156; when the comparative perceptions are all 3, Cmax = 156, so the value range of CSR differentiation degree is [−156, 156]. The ratio of CSR differentiation degree between the two companies can now be calculated, namely, 25/156 × 100% = 16%. According to this result, it can be concluded that from the perspective of consumers, Huawei’s various CSR activities are somewhat differentiated from Apple, and Huawei’s overall performance in CSR activities is still better than Apple’s, but the degree of differentiation is not high as expected.
Table 3 shows that a considerable number of respondents do not perceive a difference between Huawei and Apple in CSR activities, possibly due to two reasons: one is that the two are too similar to evaluate; the other is that the respondents do not know the real situation and feel hard to judge. Further research has been carried out on this. Six members of the project team collected CSR activities carried out in recent years by the two companies on official websites of Huawei and Apple, and compiled them into documents. After carefully reading these materials and a formal discussion, the comparative perceptions of CSR activities of the two companies in the state of complete information were determined, as shown in Table 5.
Converting the score of each CSR activity in Table 3 to a non-negative number by adding the absolute value of the maximum negative number, the weighted average is calculated according to the perceptions in Table 5 and the non-negative scores (weights) of the various CSR activities. Then, this is converted into the ratio of CSR differentiation degree, which is 9.4% under complete information.
Comparing the results in Table 5 with Table 4 and the two ratios, it can be found that: (1) the degree of “0” in Table 5 decreases significantly, indicating that consumers can basically perceive the gap between the two companies and make appropriate choices when they understand the CSR activities carried out by the companies; (2) the ratio of CSR differentiation degree under complete information is much lower than that under incomplete information and, of course, the former is more accurate. This, on one hand, indicates that the CSR differentiation degree of the two companies is not great and, on the other hand, indicates that the two companies have insufficient CSR communication with consumers. Thus, the consumers do not know much about the CSR performance of the two companies.

7. Discussion and Conclusions

This study highlights the importance of CSR differentiation to companies, and proposes a rigorous approach to identify CSR differentiation, which lays a firm foundation for companies to implement CSR differentiation strategy.
This study offers three contributions to extant literature. First, unlike most extant literature that discusses the concept and significance of CSR differentiation, this study first proposes an approach to identify CSR differentiation from the consumer’s view. The findings extend the extant literature. Second, this paper measures the consumer priorities for CSR activities using BWS, and obtains more detailed prioritization of CSR activities than the extant literature. Third, this paper takes into account the influence of competitors on CSR and puts forward the concept of the consumers’ comparative perceptions of CSR activities, which simplifies the measurement of consumer perception.
The following important managerial implications are obtained:
  • Although CSR covers a wide range of fields, CSR activities are of a certain order of importance for consumers. Therefore, companies should formulate appropriate CSR implementation strategies on the basis of taking into account the values they recognize, the CSR practice of competitors, the consumers’ priorities degree to CSR activities, and the type of consumers, so as to obtain better response from consumers.
  • Due to asymmetric information, CSR conducted by companies may not be well understood by consumers. Therefore, companies should not only do well, but also communicate with consumers on their CSR performance. Companies need to develop appropriate CSR communication strategies for consumers, and display their CSR advantages through traditional media, network media, marketing activities, product package labels (this is especially important), etc., so as to establish the virtuous advantages compared with competitors known by ordinary consumers.
  • Relevant literature shows that consumers have certain sensitivity to the motivation of companies to fulfill CSR, and profit-driven motivation has a negative influence [32,33]. Therefore, CSR communication of companies must demonstrate the motivation to serve the society in good faith and should not be exaggerated or falsified. If consumers identify the motivation to pursue profits, the effect may be counterproductive. The controversy over Chen Guangbiao’s philanthropy in China, which was exposed in the media a few years ago, is a sobering example. Chen Guangbiao’s benevolence has been repeatedly questioned by the media as fake, which has negatively affected his company’s image. The trumpeting of good deeds has played a counterproductive effect.
  • The activity “Set fair prices for products” ranks fifth out of 13 CSR activities, and it is at the bottom of the four activities of CSR to consumers. Obviously, this activity is not as important as people think. Therefore, it is feasible for a socially responsible company to adopt an appropriate CSR premium in product pricing according to CSR performance status.
There are some limitations to this study. For example: the samples in this study were not completely randomly selected; the results indicate that the samples of middle and high-income respondents, and middle-aged respondents, are relatively small; and the conclusions may be limited to the mobile phone industry. Future studies will explore the impact mechanism of CSR differentiation on consumer response through empirical or experimental studies. In addition, the selection of case companies in this study (such as Huawei and Apple) is not of typical significance. The key is that the approach in this paper is effective and applicable.

Author Contributions

Conceptualization, J.L. and S.S.; methodology, J.L. and F.Z.; software, J.L. and F.Z.; validation, S.S.; formal analysis, J.L. and F.Z.; investigation J.L. and S.S.; resources, J.L. and S.S.; data curation, F.Z.; writing—original draft preparation, J.L. and S.S.; writing—review and editing, S.S.; supervision, J.L. and S.S.; project administration, J.L.; funding acquisition, J.L.

Funding

This research was funded by the National Social Science Fund of China, grant number18BGL099.

Conflicts of Interest

The authors declare no conflict of interest.

References

  1. Li, X.; Zheng, C.; Liu, G.; Sial, M. The Effectiveness of Internal Control and Corporate Social Responsibility: Evidence from Chinese Capital Market. Sustainability 2018, 10, 4006. [Google Scholar] [CrossRef]
  2. Romani, S.; Grappi, S.; Bagozzi, R.P. Corporate socially responsible initiatives and their effects on consumption of green products. J. Bus. Ethics 2016, 135, 253–264. [Google Scholar] [CrossRef]
  3. Kudłak, R.; Szӧcs, I.; Krumay, B.; Martinuzzi, A. The future of CSR-Selected findings from a Europe-wide Delphi study. J. Clean. Prod. 2018, 183, 282–291. [Google Scholar] [CrossRef]
  4. Hu, Y.; Chen, S.; Wang, J. Managerial Humanistic Attention and CSR: Do Firm Characteristics Matter? Sustainability 2018, 10, 4029. [Google Scholar] [CrossRef]
  5. Sen, S.; Bhattacharya, C.B. Does doing good always lead to doing better? Consumer reactions to corporate social responsibility. J. Mark. Res. 2001, 38, 225–243. [Google Scholar] [CrossRef]
  6. Bhattacharya, C.B.; Sen, S. Doing Better at Doing Good: When, why, and how consumers respond to corporate social initiatives. Calif. Manag. Rev. 2004, 47, 9–24. [Google Scholar] [CrossRef]
  7. Abbas, M.; Gao, Y.; Shah, S. CSR and Customer Outcomes: The Mediating Role of Customer Engagement. Sustainability 2018, 10, 4243. [Google Scholar] [CrossRef]
  8. Dupire, M.; M’Zali, B. CSR Strategies in Response to Competitive Pressures. J. Bus. Ethics 2016, 148, 603–623. [Google Scholar] [CrossRef]
  9. McWilliams, A.; Siegel, D. Corporate Social Responsibility: A Theory of the Firm Perspective. Acad. Manag. Rev. 2001, 26, 117–127. [Google Scholar] [CrossRef]
  10. Siegel, D.S.; Vialiano, D.F. An Empirical Analysis of the Strategic Use of Corporate Social Responsibility. J. Econ. Manag. Strateg. 2007, 16, 773–792. [Google Scholar] [CrossRef] [Green Version]
  11. Kotler, P. Marketing Management, 11th ed.; Prentice Hall: Upper Saddle River, NJ, USA, 2003; p. 315. [Google Scholar]
  12. Asif, M.; Searcy, C.; Zutshi, A.; Fischer, O.A.M. An integrated management systems approach to corporate social responsibility. J. Clean. Prod. 2013, 56, 7–17. [Google Scholar] [CrossRef]
  13. Liao, P.C.; Liao, J.Q.; Wu, G.; Wu, C.L.; Zhang, X.L.; Ma, M.C. Comparing international contractors’ CSR communication patterns: A semantic analysis. J. Clean. Prod. 2018, 203, 353–366. [Google Scholar] [CrossRef]
  14. Whait, R.B.; Christ, K.L.; Ortas, E.; Burritt, R.L. What do we know about tax aggressiveness and corporate social responsibility? An integrative review. J. Clean. Prod. 2018, 204, 542–552. [Google Scholar] [CrossRef]
  15. Dahlsrud, A. How corporate social responsibility is defined: An analysis of 37 definitions. Corp. Soc. Responsib. Environ. Manag. 2008, 15, 1–13. [Google Scholar] [CrossRef]
  16. European Commission. Green Paper: Promoting an European Framework for Corporate Social Responsibility. Brussels, Belgium, 2001; p. 6. Available online: http://europa.eu/rapid/press-release_DOC-01-9_en.pdf (accessed on 24 June 2018).
  17. Elkington, J. Cannibals with Forks: The Triple Bottom Line of 21st Century Business; Capstone Publishing Ltd.: Oxford, UK, 1999; pp. 25–30. [Google Scholar]
  18. Freeman, R.E. Strategic Management: A Stakeholder Approach; Pitman: Boston, MA, USA, 1984; pp. 1–120. [Google Scholar]
  19. Turker, D. Measuring Corporate Social Responsibility: A Scale Development Study. J. Bus. Ethics 2009, 85, 411–427. [Google Scholar] [CrossRef]
  20. Öberseder, M.; Schlegelmilch, B.B.; Murphy, P.E. CSR practices and consumer perceptions. J. Bus. Res. 2013, 66, 1839–1851. [Google Scholar] [CrossRef] [Green Version]
  21. Öberseder, M.; Schlegelmilch, B.B.; Murphy, P.E.; Gruber, V. Consumers’ Perceptions of Corporate Social Responsibility: Scale Development and Validation. J. Bus. Ethics 2014, 124, 101–115. [Google Scholar] [CrossRef]
  22. Wagner, T.; Bicen, P.; Hall, Z.R. The dark side of retailing: Towards a scale of corporate social irresponsibility. Int. J. Retail Distrib. Manag. 2008, 36, 124–142. [Google Scholar] [CrossRef]
  23. Webb, D.J.; Mohr, L.A.; Harris, K.E. A re-examination of socially responsible consumption and its measurement. J. Bus. Res. 2008, 61, 91–98. [Google Scholar] [CrossRef]
  24. Porter, M.E. Competitive Advantage; Free Press: New York, NY, USA, 1985; pp. 10–80. [Google Scholar]
  25. Lipovetsky, S.; Conklin, M. Best-Worst Scaling in analytical closed-form solution. J. Choice Model. 2014, 10, 60–68. [Google Scholar] [CrossRef]
  26. Louviere, J.; Lings, I.; Islam, T.; Gudergan, S.; Flynn, T. An introduction to the application of (case 1) best–worst scaling in marketing research. Int. J. Res. Mark. 2013, 30, 292–303. [Google Scholar] [CrossRef] [Green Version]
  27. Auger, P.; Devinney, T.M.; Louviere, J.J. Using Best–Worst Scaling Methodology to Investigate Consumer Ethical Beliefs Across Countries. J. Bus. Ethics 2007, 70, 299–326. [Google Scholar] [CrossRef]
  28. Costanigro, M.; Deselnicu, O.; Mcfadden, D.T. Product differentiation via corporate social responsibility: Consumer priorities and the mediating role of food labels. Agric. Hum. Values 2016, 33, 597–609. [Google Scholar] [CrossRef]
  29. Rezaei, J.; Nispeling, T.; Sarkis, J.; Tavasszy, L. A supplier selection life cycle approach integrating traditional and environmental criteria using the best worst method. J. Clean. Prod. 2016, 135, 577–588. [Google Scholar] [CrossRef]
  30. Ahmadi, H.B.; Kasi-Sarpong, S.; Rezaei, J. Assessing the social sustainability of supply chains using Best Worst Method. Resour. Conserv. Recycl. 2017, 126, 99–106. [Google Scholar] [CrossRef]
  31. Ahmad, W.N.; Rezaei, J.; Sadaghiani, S.; Tavasszy, L.A. Evaluation of the external forces affecting the sustainability of oil and gas supply chain using Best Worst Method. J. Clean. Prod. 2017, 153, 242–252. [Google Scholar] [CrossRef]
  32. Becker-Olsen, K.L.; Cudmore, B.A.; Hill, R.P. The impact of perceived corporate social responsibility on consumer behavior. J. Bus. Res. 2006, 59, 46–53. [Google Scholar] [CrossRef] [Green Version]
  33. Vlachos, P.A.; Tsamakos, A.; Vrechopoulos, A.P.; Avramidis, P.K. Corporate social responsibility: Attributions, loyalty, and the mediating role of trust. J. Acad. Mark. Sci. 2009, 37, 170–180. [Google Scholar] [CrossRef]
Figure 1. An example in the survey.
Sustainability 11 00664 g001
Figure 2. Radar map of the scores of the CSR activities.
Sustainability 11 00664 g002
Table 1. Corporate social responsibility (CSR) activities measurements.
CSR DomainsCodesCSR Activities
ConsumersCo1Set fair prices for products
Co2Protect consumer privacy
Co3Deal with customer complaints and return requests promptly
Co4Provide credible business and product information
EnvironmentEn1Reduce and avoid pollution
En2Invest in research and development regarding environmental protection
En3Waste product recycle
EmployeesEm1Set decent working conditions
Em2Develop, support and train employees
Em3Offer adequate remuneration
Local community and societyCs1Sponsoring local community and social public activities
Cs2Create jobs for people in the region
Cs3Care for vulnerable groups
Table 2. Demographic characteristics of respondents.
DemographicsNumberPercentage (%)
SexMale34151.90
Female31648.10
Age18–25 years16725.42
26–35 years27942.47
36–45 years9214.00
46–55 years8412.78
>55 years355.33
EducationJunior high school274.11
High school7411.26
Undergraduate34252.05
Graduate21432.58
Monthly incomeNo income12418.87
<5000 yuan18127.54
5000–10,000 yuan22533.49
10,000–20,000 yuan8913.55
>20,000 yuan386.64
Table 3. Scores and rankings of CSR activities.
CSR DomainsCSR ActivitiesTimes to Be the Most ImportantTimes to Be the Least ImportantScoresRanking
Consumer responsibilityCo1885−5153705
Co21161−4397221
Co3985−3796062
Co4964−4285363
Environment responsibilityEn1672−4682046
En2988−5434454
En3310−922−61212
Employee responsibilityEm1542−574−327
Em2420−899−47910
Em3345−860−51511
Local community and society responsibilityCs1522−665−1438
Cs2375−1120−74513
Cs3372−729−3579
Table 4. Consumers’ comparative perceptions of CSR activities of Huawei and Apple.
CSR ActivitiesMuch Worse
−3
Worse
−2
Some-What Worse
−1
No Difference
0
Some-What Better
1
Better
2
Much Better
3
Co1Times17316983153180124
Percentage (%)2.594.7210.5012.6323.2927.4018.87
Co2Times1140572569412772
Percentage (%)1.676.098.6838.9614.3119.3310.96
Co3Times1047922601318631
Percentage (%)1.527.1514.0039.5719.9413.094.72
Co4Times9161302331428443
Percentage (%)1.372.4419.7935.4621.6112.796.54
En1Times810533521347525
Percentage (%)1.221.528.0753.5820.4011.423.81
En2Times12361012671029445
Percentage (%)1.835.4815.3740.6415.5314.316.85
En3Times1126952921475729
Percentage (%)1.673.9614.4644.4422.378.684.41
Em1Times1015149272938335
Percentage (%)1.522.2822.6841.4014.1612.635.33
Em2Times7168130710410240
Percentage (%)1.072.4412.3346.7315.8315.536.09
Em3Times8134730412011550
Percentage (%)1.221.987.1546.2718.2617.507.61
Cs1Times47113327911612942
Percentage (%)7.151.675.0242.4717.6619.636.39
Cs2Times10147422014712270
Percentage (%)1.522.1311.2633.4922.3718.5710.65
Cs3Times12123724918712238
Percentage (%)1.831.835.6337.9028.4618.575.78
Table 5. Perceptions of CSR activities of Huawei and Apple under complete information condition.
CSR ActivitiesComparative PerceptionCSR ActivitiesComparative Perception
Co13Em12
Co2−2Em22
Co3−1Em31
Co40Cs12
En11Cs22
En2−1Cs32
En3−2

