Infrastructure Operation Efficiency and Influential Factors in Developing Countries: Evidence from China


Abstract
1. Introduction
2. Literature Review
3. Methods and Data
3.1. Super-Efficiency SBM Model
3.2. Variable Selection
3.2.1. Selection of Inputs and Outputs for Operation Efficiency Measurement
- OutputExpressway mileage operated by expressway companies.
- InputsThe main business cost is the direct input cost, generated during the process of providing the vehicle access service. It includes the cost of the toll collection equipment, the cost of maintenance business, the depreciation of road production, the road administration expenditure, etc. This cost is the largest reduction in the profit and loss account. Thus, when the output is certain, the key to improving the efficiency is to control the cost of the main business effectively.
3.2.2. Selection of Factors Affecting Operation Efficiency
- The asset–liability ratio reflects the capital structure of companies. Due to the debt incurred by the construction link, the repayment of principal and interest becomes a relatively large expenditure burden. De-leveraging is regarded as the primary and core task of supply-side reform in the transportation sector [27]. The expressway industry is capital intensive. Debt financing, such as bank loans, is an important capital source for expressway companies. On the one hand, debt financing can improve the corporate governance structure and play a positive role in governance. On the other hand, too much debt will increase the burden of the company. This paper used the proportion of liabilities to total assets to calculate the asset–liability ratio.
- 2.
- The degree of market competition. According to the theory of industrial organization, market competition is undoubtedly crucial for market performance. Wang, J et al. researched the reformation of infrastructure in many countries and concluded that the introduction of competition in the telecommunications industry in America has achieved great success [28]. As for the expressway industry, the competition faced by expressway companies mainly comes from getting the franchise before the expressway companies enter the operation market and other modes of transportation during operation. Expressways are all built according to the planning of the road network. Generally, there is no parallel road; consequently, there is no competition relationship between two companies operating different expressways. That is, once the expressway operation company obtains the franchise of the expressway, the company will operate in a monopolized way. During this process, the competition faced by expressway companies mainly comes from other modes of transport. In particular, the high-speed railway has brought great convenience to the city traffic and has a certain influence on expressways. Since the competition of the franchise cannot be measured in detail, this paper used railway density as an agent variable to represent the influence of market competition on the operation efficiency.
- 3.
- The level of regional economic development. We assumed that the level of economic development affects the operation efficiency by affecting the management philosophy and technical level of the expressway company. Regions with more developed economies, stronger entrepreneurial management ability and more advanced technology will be adopted by enterprises. At the same time, these companies will have a more perfect external market environment. We used regional gross domestic product (GDP) to indicate the level of regional economic development.
- 4.
- Scale. The expressway industry has a significant scale effect, and scale expansion is one of the most important ways to improve the efficiency of industry [17]. We selected the expressway mileage operated by expressway companies as the agent variable and assumed that the more expressways the company operates, the higher the efficiency.
- 5.
- The structure of property rights. Mixed ownership reform is becoming an important measure to improve performance. It is expected that private property rights would stimulate the incentive mechanism. This paper used the sum of the proportion of state-owned shares and state-owned legal person shares in the top ten shareholders of the companies to indicate the structure of property rights.
3.3. Data Collection
4. Results
4.1. Results of Efficiency Calculation
4.2. Results of the Fixed-Effects Regression
5. Discussion
6. Research Conclusions and Policy Implications
6.1. Research Conclusions
6.2. Policy Implications
Author Contributions
Funding
Acknowledgments
Conflicts of Interest
References
- Transforming Our World: The 2030 Agenda for Sustainable Development. Available online: https://www.fmprc.gov.cn (accessed on 21 July 2018).
- Wang, L.; Xue, X.; Zhao, Z.; Wang, Z. The impacts of transportation infrastructure on sustainable development: Emerging trends and challenges. Int. J. Environ. Res. Public Health 2018, 15, 1172. [Google Scholar] [CrossRef] [PubMed]
- Collier, P.; Kirchberger, M.; Söderbom, M. The Cost of Road Infrastructure in Low- And Middle-Income Countries. World Bank Econ. Rev. 2016, 30, 522–548. [Google Scholar] [CrossRef]
- Hulten, C.R. Infrastructure Capital and Economic Growth: How Well You Use It May Be More Important Than How Much You Have. Nber Working Papers; National Bureau of Economic Research: Cambridge, MA, USA, 1996; pp. 1–37. [Google Scholar]
- Helm, D.; Mayer, C. Infrastructure: Why it is under Provided and Badly Managed. Oxf. Rev. Econ. Policy 2016, 32, 343–359. [Google Scholar] [CrossRef]
- Ansar, A.; Budzier, A.; Lunn, D. Does Infrastructure Investment Lead to Economic Growth or Economic Fragility? Evidence from China. Oxf. Rev. Econ. Policy 2016, 32, 360–390. [Google Scholar] [CrossRef]
- Qin, S.; Rong, C. China’s Transportation Infrastructure Supply and Demand Mismatch and Public-Private Cooperation Dilemma and its Countermeasures—Based on the Perspective of Supply-Side Structural Reform. Yunnan Soc. Sci. 2017, 4, 64–69. [Google Scholar]
- Zheng, S.Q.; Xu, K.; He, Q.; Fang, S.Z.; Zhang, L. Investigating the sustainability performance of ppp-type infrastructure projects: A case of China. Sustainability 2018, 10, 4162. [Google Scholar] [CrossRef]
- The Statistical Bulletin of the Development of the Transportation Industry in 2017. Available online: http://zizhan.mot.gov.cn/zfxxgk/bnssj/zhghs/201803/t20180329_3005087.html (accessed on 7 August 2018).
- National Statistics Summary Table of Toll Road in 2017. Available online: http://zizhan.mot.gov.cn/zfxxgk/bnssj/glj/201808/t20180824_3062127.html (accessed on 1 September 2018).
- Xu, H.; Wang, Y.; Jia, R. Research on Efficiency of Toll Road Dual-Track Operation System Based on Three Stage DEA and Tobit Regression Model. China J. Highw. Transp. 2017, 30, 125–132. [Google Scholar] [CrossRef]
- Bai, P.; Xu, H. Evaluation on Resource Allocation of Toll-Road Infrastructure Industry in China. Price Theory Pract. 2017, 2, 146–149. [Google Scholar]
- Wang, B.; Li, Q. Performance Evaluation and Dynamic Analysis of Listed Companies in the Expressway Industry. Co. Econ. 2014, 175–179. [Google Scholar] [CrossRef]
- Wang, J. Study on Optimizing Market Structure for Promoting Economic Performance in Toll-Road Industry. Ph.D. Thesis, Chang’an University, Xi’an, China, 2013. [Google Scholar]
- Zhu, Y. Quantitative Analysis of the Administrative Monopoly and Efficiency of Toll Road Industry. Stat. Decis. 2015, 104–107. [Google Scholar] [CrossRef]
- Pang, R.; Liu, B.; Wang, T. Location, Firm Scale, Stock Right Structure and Cost Efficiency: Empirical Study on 19 Listed Highway Companies. J. Cent. Univ. Financ. Econ. 2008, 51–56. [Google Scholar]
- Yang, G.; Liu, W.; Zheng, H. A Review of Data Envelopment Analysis Methods (DEA). J. Syst. Eng. 2013, 28, 840–860. [Google Scholar]
- Tone, K. A Slacks-Based Measure of Efficiency in Data Envelopment Analysis. Eur. J. Oper. Res. 2001, 130, 498–509. [Google Scholar] [CrossRef]
- Tone, K. A slacks-based measure of super-efficiency in data envelopment analysis. Eur. J. Oper. Res. 2002, 143, 32–41. [Google Scholar] [CrossRef]
- Jin, G.; Shen, K. Revaluation and Deconstruction of Technical Efficiency in Service Industry: Managerial Inefficiency or Environmental Inefficiency—Evidence from Telecommunication Industry in China. Ind. Econ. Res. 2018. [Google Scholar] [CrossRef]
- Ran, Q.; Zhou, H. Research on Agricultural Total Factor Energy Efficiency under Environmental Constraints: Based on SBM—TOBIT Model. Econ. Probl. 2017, 103–109. [Google Scholar] [CrossRef]
- Ma, F.; Wang, W.L.; Sun, Q.P.; Liu, F.; Li, X.D. Integrated Transport Efficiency and Its Spatial Convergence in China’s Provinces: A Super-SBM DEA Model Considering Undesirable Outputs. Appl. Sci. 2018, 8, 1698. [Google Scholar] [CrossRef]
- Xi, X.; Liang, J.; Yang, J. Does Local Fiscal Competition Improve the Efficiency of Public Infrastructure Investment? East China Econ. Manag. 2017, 31, 114–123. [Google Scholar] [CrossRef]
- Ouyang, Y.; Zhang, G. Research on the Impact of Infrastructure Supply and Efficiency on “Made in China”. Manag. World 2016, 97–109. [Google Scholar] [CrossRef]
- Cheng, G. Data Envelopment Analysis: Methods and MaxDEA Software; Intellectual Property Publishing House: Beijing, China, 2014; pp. 120–181. ISBN 9787513027182. [Google Scholar]
- Wang, J.; Xu, H. Estimation of Administrative Monopoly in Toll Road Industry and Corresponding Elimination Strategies. J. Xi’an Jiaotong Univ. (Soc. Sci.) 2012, 32, 75–80. [Google Scholar] [CrossRef]
- The Core Task of the Supply-Side Reform of the Transportation Industry is De-Leveraging. Available online: http://jjsb.cet.com.cn/show_480843.html (accessed on 1 December 2018).
- Wang, J.; Xiao, X.; Tang, Y. The Establishment of Regulatory Agencies and Their Operational Mechanisms in China’s Monopoly Industries; Commercial Press: Beijing, China, 2008; pp. 236–243. ISBN 9787100058186. [Google Scholar]
- Zhang, J. The Governance Efficiency of Debt Financing—A new Empirical Analysis Design. J. Shanxi Financ. Econ. Univ. 2006, 28, 117–121. [Google Scholar] [CrossRef]
- Yang, J.; Yang, J. Administrative Monopoly Political, Patronage and the Extra-Cost of the State-Owned Firms. Econ. Res. J. 2015, 50, 50–61. [Google Scholar]


| Variables | Indicator | Data Source |
|---|---|---|
| Output | Expressway Mileage Operated by Expressway Companies | Companies’ Annual Reports |
| Inputs | The Main Business Cost | Wind Database |
| Salary | Wind Database | |
| Interest Expense | Wind Database | |
| Management Expenses | Wind Database | |
| Total Assets | Wind Database |
| Factor | Indicator | Symbol | Data Source |
|---|---|---|---|
| Capital Structure | Asset–Liability Ratio | Capital | Companies’ Annual Reports |
| Market Competition | Railway Density | Market | Wind Database |
| Regional Economic Development | GDP | GDP | Wind Database |
| Scale | Expressway Mileage Operated by Expressway Companies | Scale | Companies’ Annual Reports |
| Property Rights Structure | The Sum of the Proportion of State-Owned Shares and State-Owned Legal Person Shares in the Top Ten Shareholders of the Companies | State | Companies’ Annual Reports |
| Variables | Sample | Average | Standard Error | Minimum | Maximum |
|---|---|---|---|---|---|
| Capital | 121 | 47.539 | 16.103 | 16.490 | 80.230 |
| Market | 110 | 0.021 | 0.006 | 0.012 | 0.035 |
| GDP | 121 | 28089.360 | 18713.190 | 5800.250 | 75130.160 |
| Scale | 121 | 541.183 | 405.496 | 55.700 | 2137.000 |
| State | 121 | 55.396 | 15.102 | 6.840 | 87.230 |
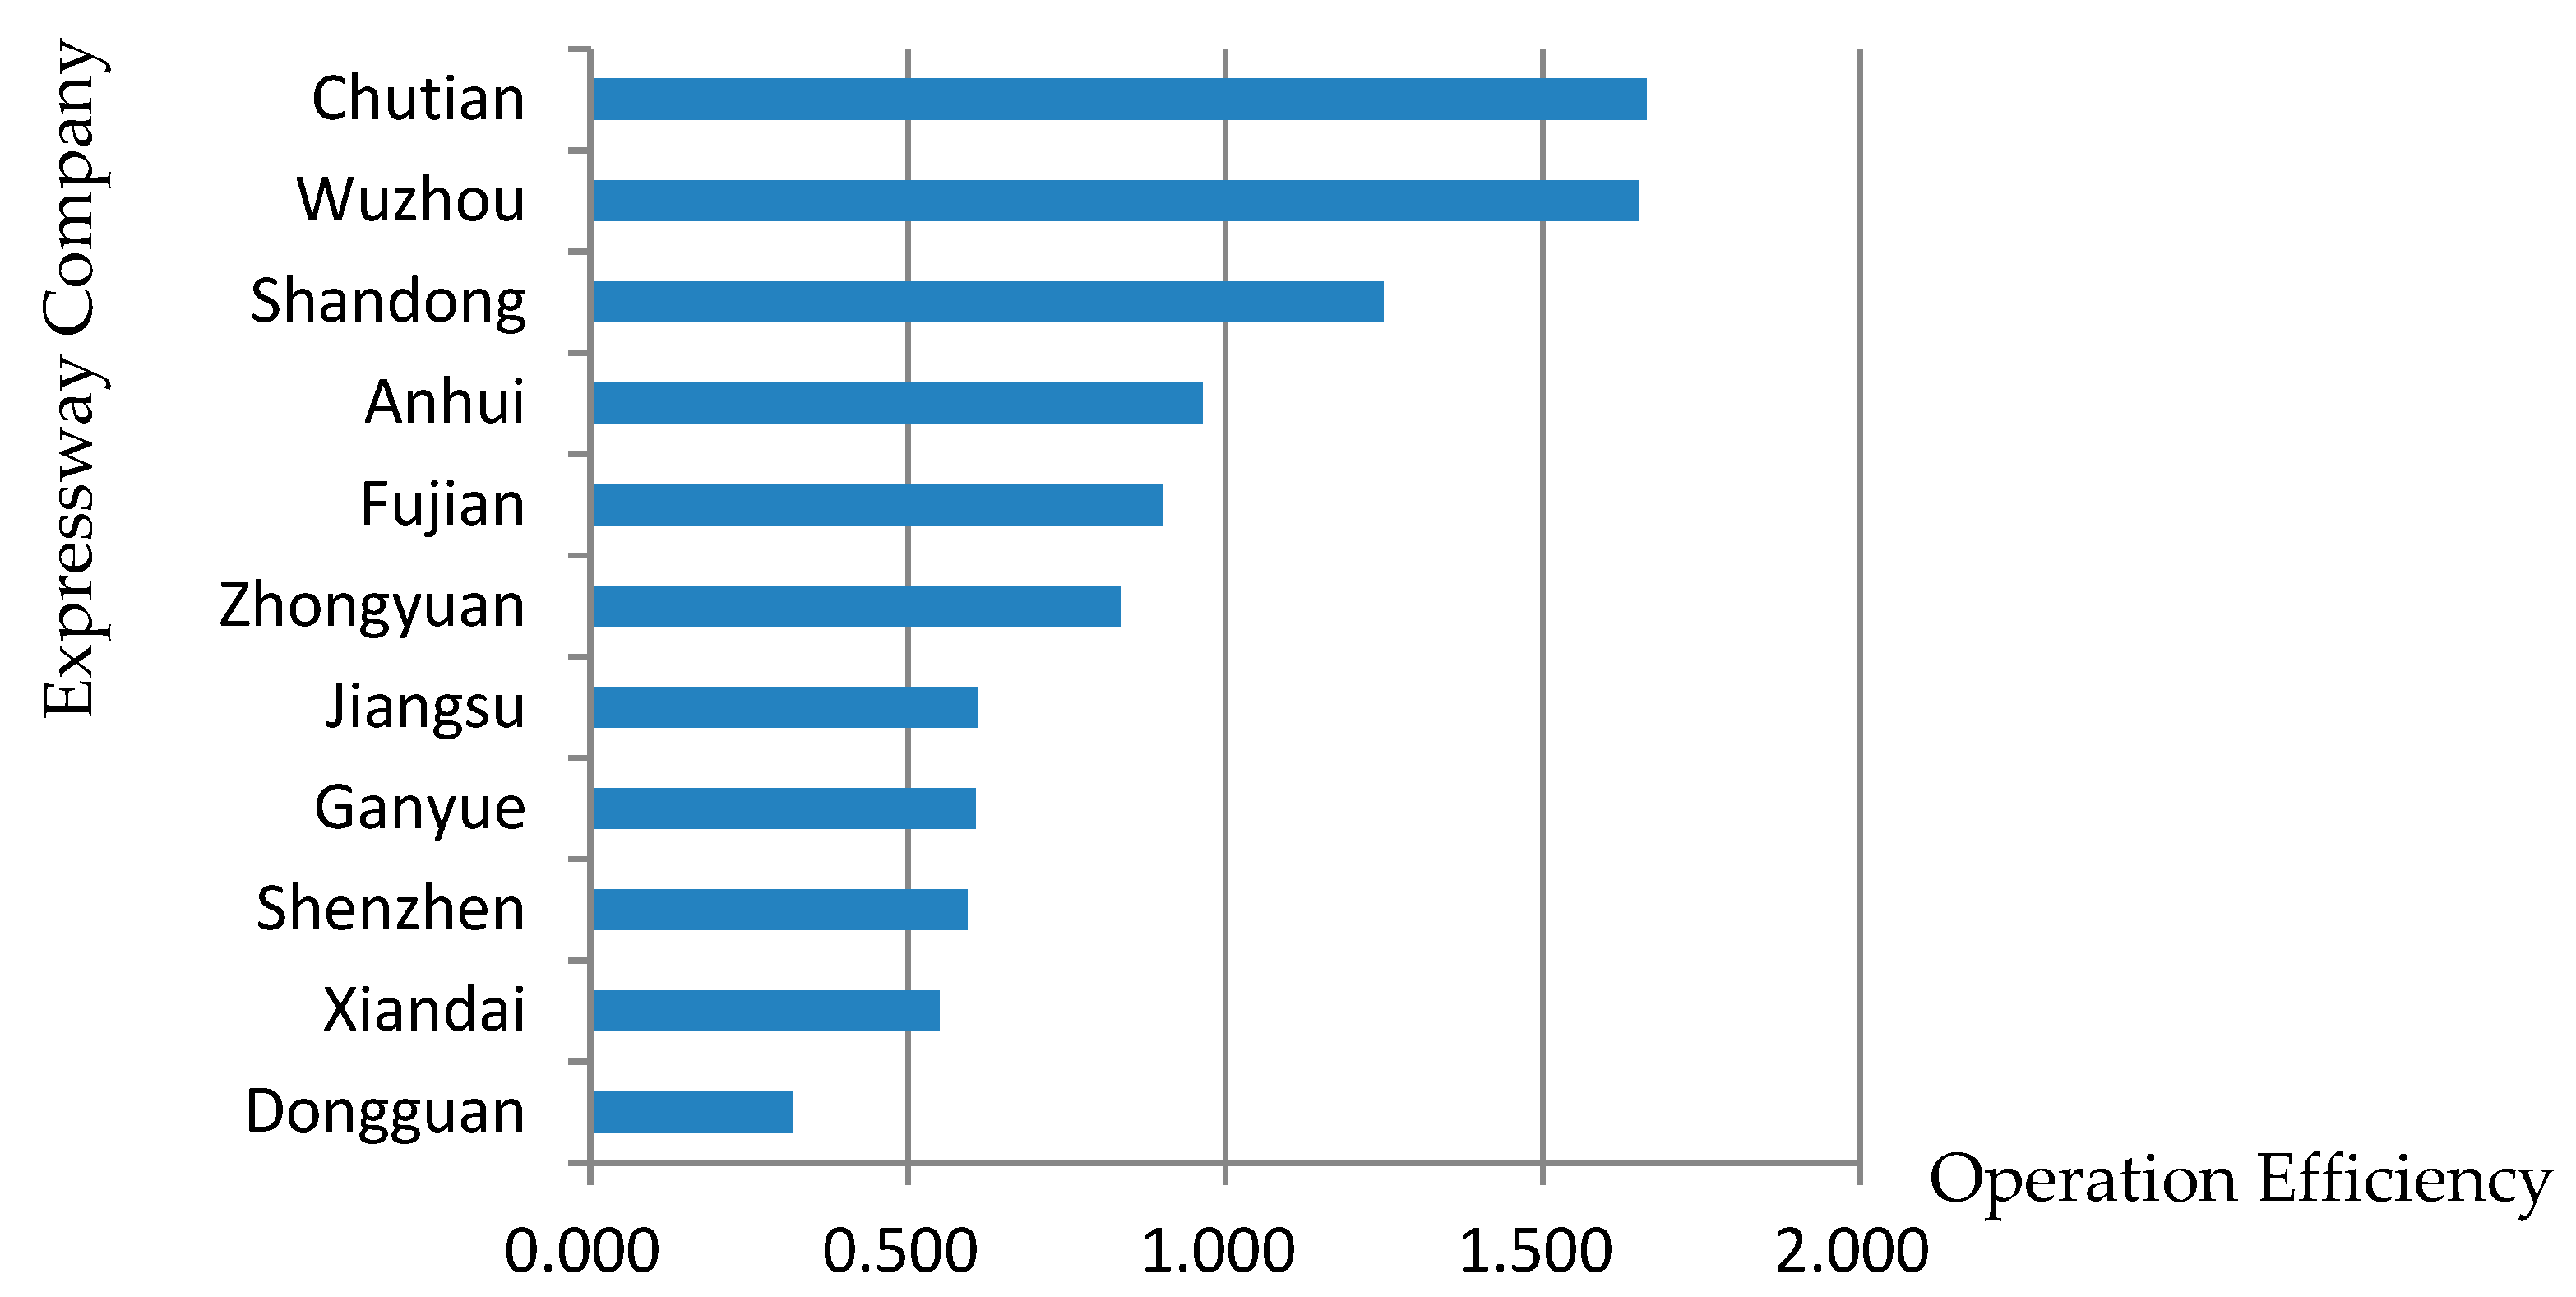
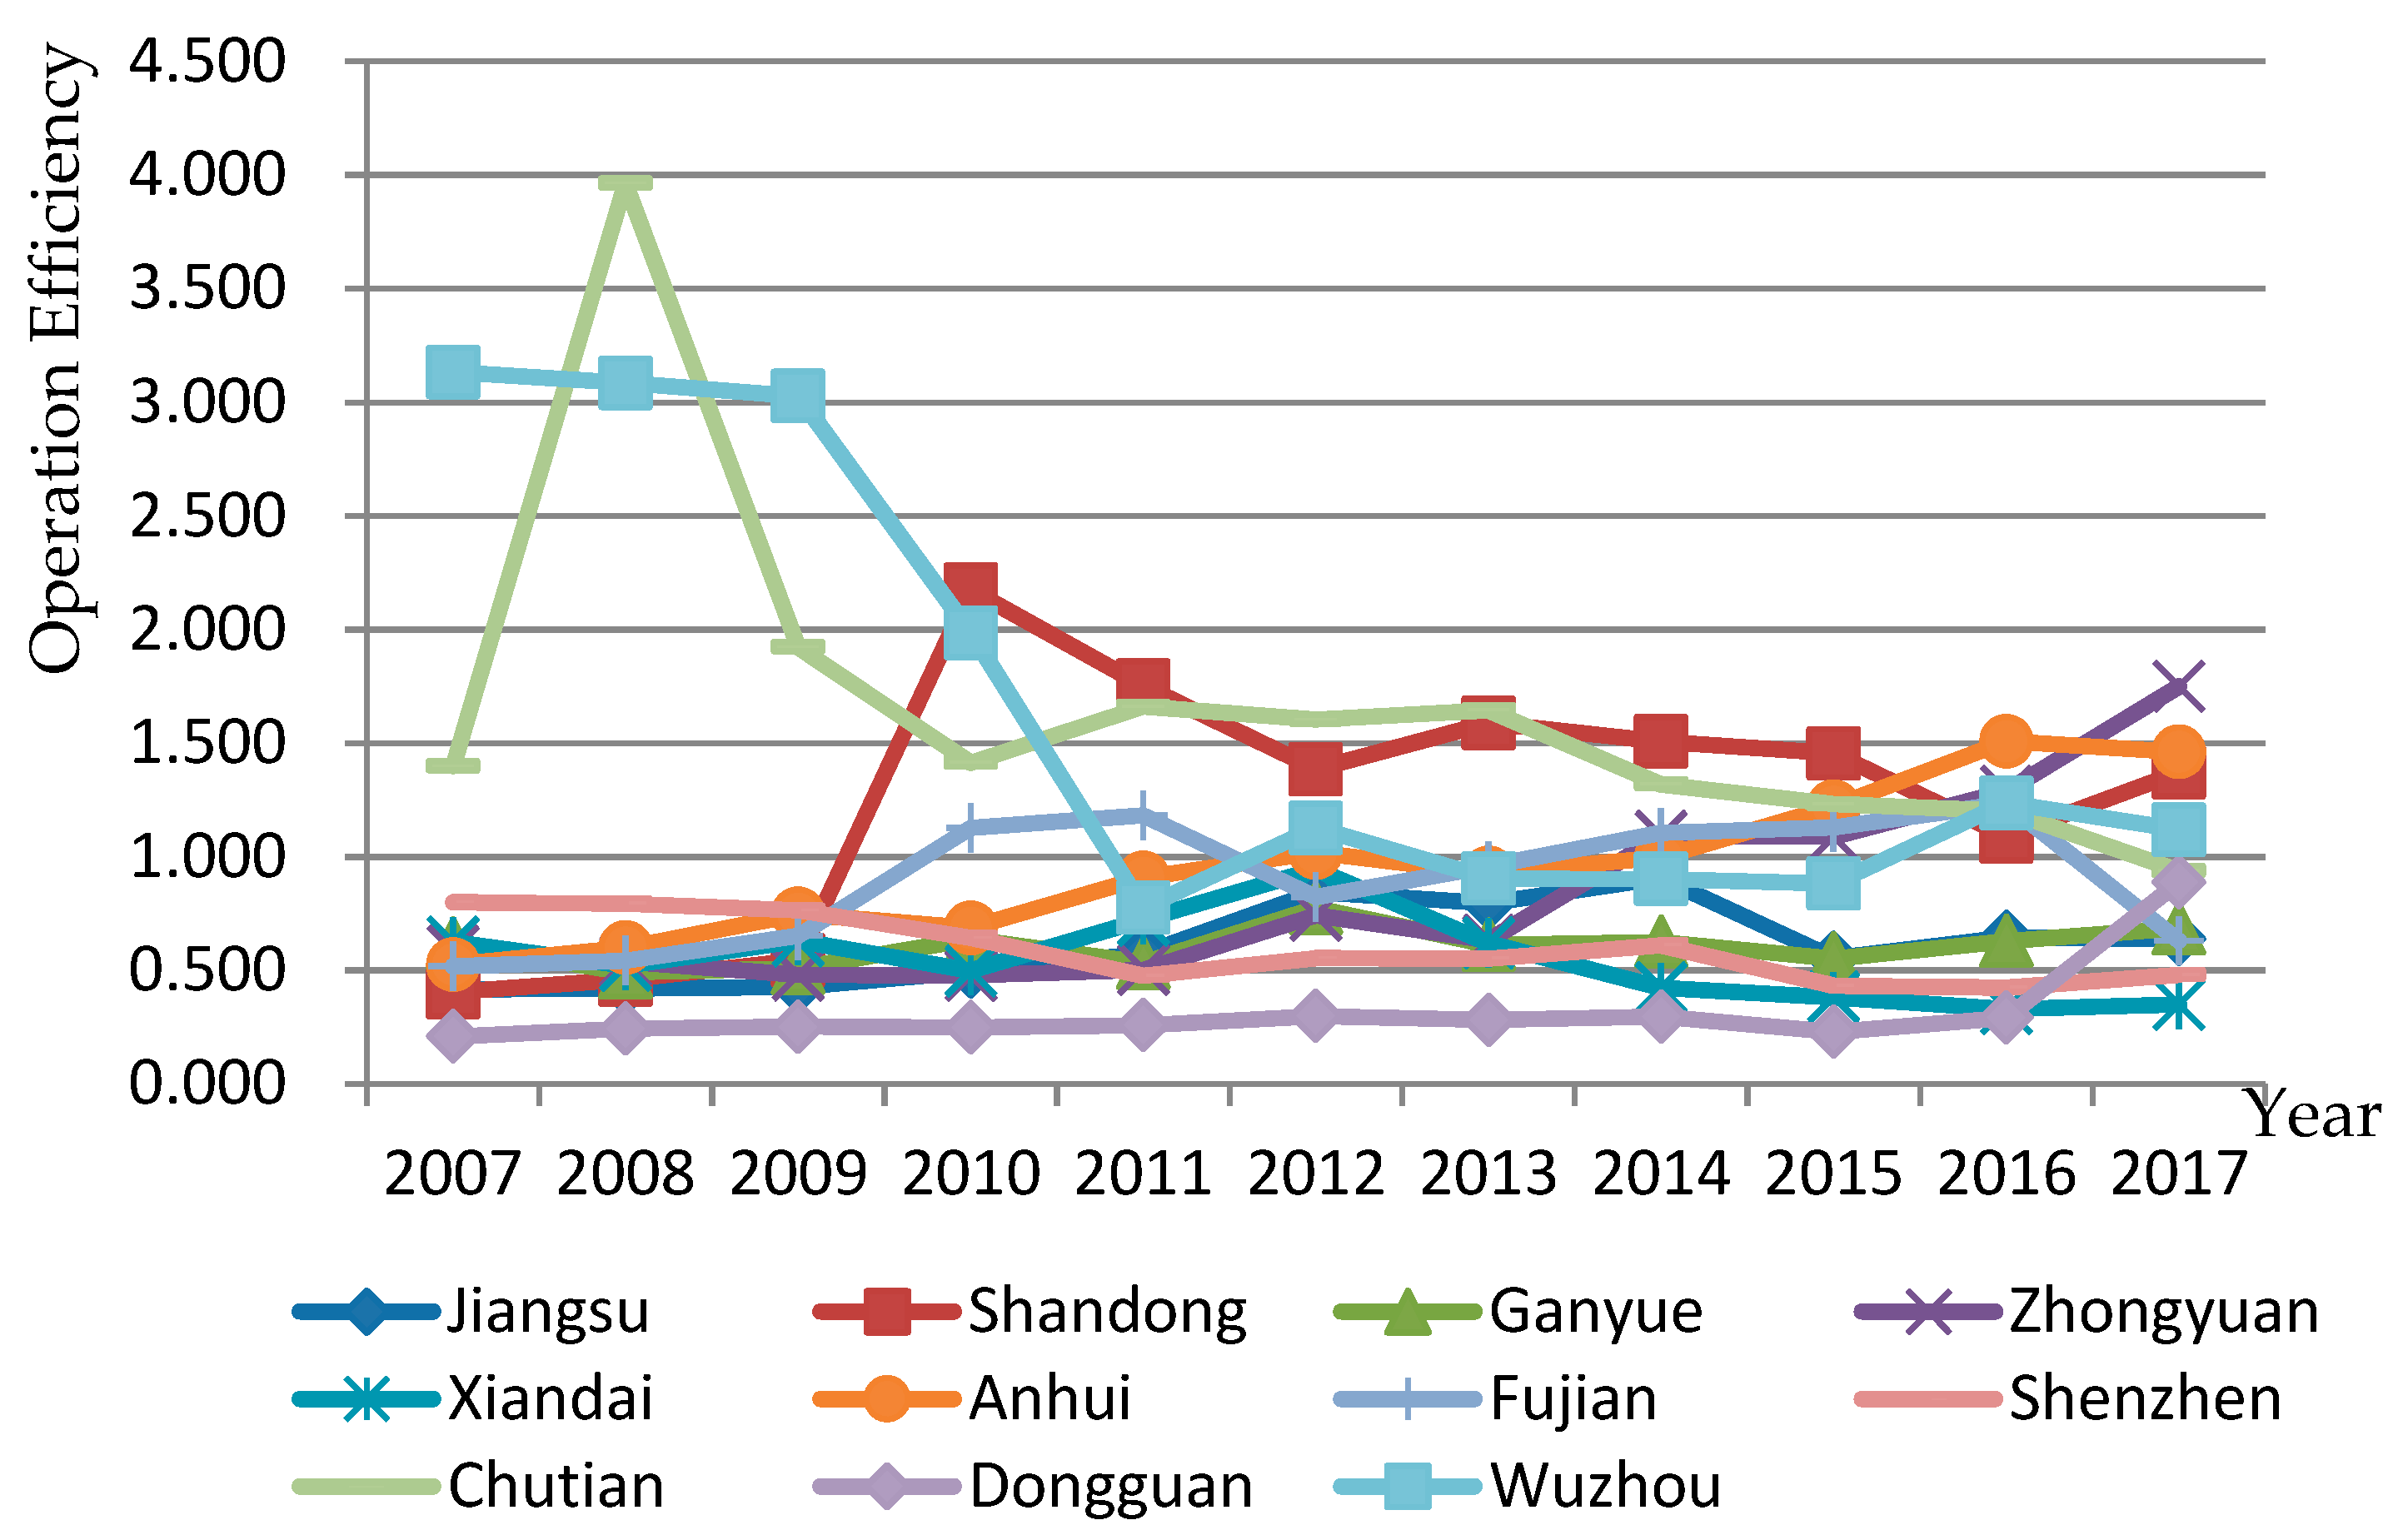
| Company | 2007 | 2008 | 2009 | 2010 | 2011 | 2012 | 2013 | 2014 | 2015 | 2016 | 2017 | Average |
|---|---|---|---|---|---|---|---|---|---|---|---|---|
| Jiangsu | 0.417 | 0.420 | 0.427 | 0.495 | 0.574 | 0.845 | 0.796 | 0.907 | 0.554 | 0.646 | 0.638 | 0.611 |
| Shandong | 0.405 | 0.460 | 0.545 | 2.174 | 1.754 | 1.386 | 1.589 | 1.507 | 1.456 | 1.091 | 1.372 | 1.249 |
| Ganyue | 0.616 | 0.491 | 0.510 | 0.637 | 0.533 | 0.774 | 0.613 | 0.626 | 0.552 | 0.629 | 0.685 | 0.606 |
| Zhongyuan | 0.585 | 0.540 | 0.480 | 0.478 | 0.503 | 0.742 | 0.632 | 1.090 | 1.089 | 1.288 | 1.750 | 0.834 |
| Xiandai | 0.625 | 0.522 | 0.630 | 0.498 | 0.722 | 0.944 | 0.621 | 0.423 | 0.382 | 0.330 | 0.350 | 0.550 |
| Anhui | 0.525 | 0.600 | 0.748 | 0.687 | 0.907 | 1.019 | 0.928 | 0.998 | 1.221 | 1.508 | 1.462 | 0.964 |
| Fujian | 0.518 | 0.543 | 0.653 | 1.127 | 1.182 | 0.823 | 0.959 | 1.106 | 1.129 | 1.235 | 0.630 | 0.901 |
| Shenzhen | 0.800 | 0.794 | 0.764 | 0.643 | 0.476 | 0.554 | 0.552 | 0.611 | 0.432 | 0.424 | 0.480 | 0.594 |
| Chutian | 1.398 | 3.963 | 1.922 | 1.414 | 1.661 | 1.604 | 1.645 | 1.318 | 1.231 | 1.202 | 0.938 | 1.663 |
| Dongguan | 0.209 | 0.245 | 0.252 | 0.250 | 0.259 | 0.299 | 0.282 | 0.297 | 0.230 | 0.292 | 0.888 | 0.318 |
| Wuzhou | 3.133 | 3.085 | 3.028 | 1.985 | 0.777 | 1.127 | 0.905 | 0.903 | 0.882 | 1.237 | 1.119 | 1.653 |
| Average | 0.839 | 1.060 | 0.905 | 0.944 | 0.850 | 0.920 | 0.866 | 0.889 | 0.832 | 0.899 | 0.938 | 0.904 |
| Variable | Coefficient | Standard Error | t | p |
|---|---|---|---|---|
| Capital | −0.0277407 *** | 0.0035922 | −7.72 | 0.000 |
| Market | 3.55675 | 19.51976 | 0.18 | 0.856 |
| GDP | 2.69 × 10⁻⁶ | 9.40 × 10⁻⁶ | 0.29 | 0.775 |
| Scale | 0.0008667 *** | 0.0002189 | 3.96 | 0.000 |
| State | 0.009363 * | 0.0051982 | 1.80 | 0.075 |
| Cons | 1.083034 *** | 0.4033918 | 2.68 | 0.009 |
© 2019 by the authors. Licensee MDPI, Basel, Switzerland. This article is an open access article distributed under the terms and conditions of the Creative Commons Attribution (CC BY) license (http://creativecommons.org/licenses/by/4.0/).
Share and Cite
Wei, X.; Xu, H.; Zhang, B.; Li, J. Infrastructure Operation Efficiency and Influential Factors in Developing Countries: Evidence from China. Sustainability 2019, 11, 655. https://doi.org/10.3390/su11030655
Wei X, Xu H, Zhang B, Li J. Infrastructure Operation Efficiency and Influential Factors in Developing Countries: Evidence from China. Sustainability. 2019; 11(3):655. https://doi.org/10.3390/su11030655
Chicago/Turabian StyleWei, Xiao, Haicheng Xu, Beiqi Zhang, and Jianlong Li. 2019. "Infrastructure Operation Efficiency and Influential Factors in Developing Countries: Evidence from China" Sustainability 11, no. 3: 655. https://doi.org/10.3390/su11030655
APA StyleWei, X., Xu, H., Zhang, B., & Li, J. (2019). Infrastructure Operation Efficiency and Influential Factors in Developing Countries: Evidence from China. Sustainability, 11(3), 655. https://doi.org/10.3390/su11030655