Article

Risk Assessment Using Fuzzy TOPSIS and PRAT for Sustainable Engineering Projects

Department of Production and Management Engineering, Democritus University of Thrace, 12 Vas. Sofias st., 67100 Xanthi, Greece
*
Author to whom correspondence should be addressed.
Sustainability 2019, 11(3), 615; https://doi.org/10.3390/su11030615
Submission received: 13 December 2018 / Revised: 21 January 2019 / Accepted: 22 January 2019 / Published: 24 January 2019
(This article belongs to the Special Issue Circular Economy, Ethical Funds, and Engineering Projects)

Abstract

:
In this study, we propose a safety risk assessment process using the fuzzy extension of the technique for order of preference by similarity to ideal solution (TOPSIS) for assigning priorities to risks in worksites, in order to promote the health, safety and well-being of workers, issues that are embedded within the concept of sustainability, specifically belonging to the social sphere of sustainability. The multicriteria method works in cooperation with a simple quantitative risk analysis and assessment process, the proportional risk assessment technique (PRAT), the functionality of which is based on real data. The efficiency of this approach is validated through treating a construction project example in Greece, and the results are compared with real fatal and non-fatal accidents data for the years 2014–2016. This integrated multicriteria approach can be used by risk managers as a tool for assessing safety risks and making informed decisions about the manner that a constraint budget would be spent in order to maximize health and safety in workplace.

1. Introduction

Preserving the health, safety and well-being of labor on work sites is a key concern worldwide as part of the effort to increase the productivity and promote the sustainable growth of business. The World Health Organization (WHO) [1], refers to sustainable development as a strategy to “meet the needs of the present world population without causing adverse effect on health and on the environment, and without depleting or endangering the global resource base, hence without compromising the ability of future generations to meet their needs.” Recently, the U.S. Occupational Safety and Health Administration (OSHA) [2] recognized that actions for ensuring occupational health and safety can be integrated into sustainability efforts and benefit from sustainability movement dynamics in order to make work sites safer and healthy.
In addition, reduced accidents costs can save private and state budget resources that can be used more efficiently in sectors that need them more. Reports of the International Labor Organization (ILO) state that in the region of Europe and Central Asia, for the period 2009–2015, there were 64,230,125 workdays lost in the manufacturing sector due to injuries caused by accidents in the workspace and 44,723,674 workdays lost in the construction sector, as well [3].
Moreover, the European Agency for Safety and Health at Work [4] and the ILO [3] reported that, according to estimates, the cost of work-related injuries and illnesses worldwide is up to 3.9% of gross domestic product (GDP), namely about €2680 billion. As for the European Union (EU), injuries and illnesses related to the workplace costs 3.3% of its GDP, namely €476 billion annually, a part of which could be saved using more efficient health and safety practices, and thus, redirected to help treating many serious economic and societal problems.
Today, OSH issues are considered to be very important for organizations for economic (e.g., decrease lost working days), environmental (e.g., environmental hazards for employees), and social issues (e.g., ethical working conditions). Actually, the idea of sustainability has been utilized as a frame for OSHA and also for the Occupational Safety and Health (OSH) standards and techniques [5]. So far, the majority of OSH topics have been associated with organizations’ compliance with legislation requirements, while a great part of the literature has recently incorporated OSH issues into the concept of social responsibility of organizations, which should go beyond the law by adopting voluntary OSH standards. However, the voluntary trend of organizations has lately gained ground in the context of the social responsibility of organizations to contribute to sustainable development [5,6]. This is integrated into the context of organizations as a commitment to OSH issues beyond the law which should be achieved through voluntary OSH standards (e.g., OSHAS 18001, ISO 45001). By this logic, the concept of sustainability is utilized as a frame to classify current OSH standards and techniques.
The main contribution of this study is the integration of the fuzzy extension of the most popular compromise programming multicriteria method, the technique for order of preference by similarity to ideal solution (TOPSIS), with a proven efficient quantitative technique for risk assessing and analysis, the proportional risk assessment technique (PRAT). The proposed process aims to be a useful tool for making informed decisions and assist systematic knowledge transfer between managers and engineers and practitioners. This study is organized into six sections: (1) the introduction, (2) the review of recent scientific literature, (3) the description of the fuzzy TOPSIS method, (4) the description of the proposed approach, (5) the application and results discussion, and (6) the conclusions.

2. Literature Review

In recent years there has been rising interest in the research field of occupational health and safety hazards assessment. Marhavilas and Koulouriotis [7] developed the ‘‘proportional risk assessment technique’’ (PRAT) and a ‘‘decision matrix technique’’, for quantification of risks, and applied them to a Greek aluminum extrusion company. Marhavilas and Koulouriotis [8] used an assessment approach using both stochastic and deterministic processes, and applied it in the largest Greek industry, the Public Power Corporation (PPC) and Aneziris et al. [9] proposed a model for construction projects risk quantification. Aminbakhsh, Gunduz, and Sonmez [10] used an approach for robust construction risks assessment while allocating budget. Marhavilas et al. [11] proposed an approach based on time-series harmonic analysis of accidents in the workplace. Guo and Haimes [12] proposed a framework for precursor analysis to assist the development of a precursor monitoring and decision support system. A great recent review on quantitative risk analysis is presented in Goerlandt et al. [13]. In the study of Dehdasht et al. [14] used the Decision Making Trial and Evaluation Laboratory (DEMATEL) method in association with Analytical Network Process (ANP) for risk assessment, specifically in oil and gas construction projects. Also, [15] and [16] used ANP and fuzzy systems for e-procurement risk factors estimation in a manufacturing company. The study of Jo et al. [17] analyzed data from accidents in Korean construction sector between years 2011 and 2015, in order to provide crucial information for defining policies to reduce construction accidents. Ghodrati, Yiu, Wilkinson, and Shahbazpour [18] proposed models to predict the safety outcome in the construction industry. Wu et al. [19] used neutrosophic sets for modifying operators that used with multiple attribute decision-making methods to assess risks in engineering construction projects.
In addition, great reviews of research directions and contributions in the occupational safety and health field with applications in the construction industry were undertaken by [20], and [21]. Recently, [5] conducted a comprehensive review to map the field of the interaction of sustainability and health-safety management systems, and provides an analytic description of the usage of occupational health and safety management standards in work sites. Finally, [22] proposed a framework for incorporating the fuzzy extension of a popular multicriteria decision making method, such as AHP, with a quantitative method for prioritizing risks in the workplace.
TOPSIS, was introduced by Hwang, C.L., and Yoon [23] as a multicriteria method for ranking and selection of alternatives using distance measures. The fuzzy-TOPSIS which is the extension of classic TOPSIS to fuzzy logic, has been introduced by [24], including ratings and weightings description by triangular fuzzy numbers. There is a wide range of applications for TOPSIS. Jozi and Majd [25], used TOPSIS for identifying risks from pollutants in the steel production process. Mahdevari, Shahriar, and Esfahanipour [26] proposed a process based on fuzzy TOPSIS for assessing health and safety risks and produce balanced budget plans, and Jozi, Shoshtary, and Zadeh [27] used AHP and TOPSIS for prioritization of hazardous factors identified by a Delphi method application in a construction project. Cococcioni, Lazzerini, and Pistolesi [28] proposed a multi-objective learning evolutionary algorithm for the classification of workers according to their risk perception for assigned tasks. TOPSIS is used for selecting the best Pareto-optimal solution. The TOPSIS method is used to select the best Pareto-optimal solution, among those generated by a non-dominated sorting artificial bee colony (NSBC) algorithm.

3. The Technique for Order of Preference by Similarity to Ideal Solution (TOPSIS) and Fuzzy TOPSIS Methods

3.1. TOPSIS Method

The functionality of the TOPSIS method is based on the consideration of two ideal solutions, the positive and the negative one. Then, the method works to find the shortest distance from the positive ideal solution and the longest distance from the negative ideal solution. TOPSIS belongs to the compromise programming methods, as its main principle is that the feasible solution sets’ ranking depends on both their proximity to the positive ideal solution (PIS) (Equation (1)) and the negative ideal solution (NIS) (Equation (2)) [29].
L P I S =   ( j = 1 m ( | f j + f j ( x ) | ) 2 ) 1 2
L N I S =   ( j = 1 m ( | f j f j ( x ) | ) 2 ) 1 2
where x A , and m = number of alternatives,
Taking into consideration the fact that in TOPSIS the Euclidean distance measure is applied ( p = 2 ) for the calculation of the distance from the positive ideal solution and the negative ideal solution, this comprises a special case of the compromise programming methods.
The method’s model can further be simplified by expressing the distances from the optimal and the worst points of the analysis for the closeness coefficient of each alternative in a function form, as shown for the benefit criteria ( f t + ) and the cost criteria ( f k ) respectively (Equations (3) and (4)).
f j + = { X = max ( o r   min ) f t ( x ) ( o r   f k ( x ) ) ,   t ( o r   k )   ϵ B ( a n d   K )   }
f j = { X = min ( o r   max ) f t ( x ) ( o r   f k ( x ) ) ,   t ( o r   k )   ϵ B ( a n d   K )   }
The basic concept of this method is based on the monotonicity (increasing or decreasing) of each criterion, implying the easiness of defining the positive ideal solution and the negative ideal solution. Therefore, the alternatives’ ranking depends on their distance from the best and the worst points of the analysis. The shorter the distance from the optimal solution and the farther the distance from the worst solution, the better the alternative.
The closeness coefficient ( c i ), for the alternatives’ ranking, is measured according to Equation (5) based on their distance from the positive ideal solution ( S i + ) and the negative ideal solution ( S i ) [23,29].
C i = S i S i + + S i ,   0 C i 1
However, the uncertainty that real-world problems involve, increase the complexity of the decision making process, and as a result exact numeric values cannot represent decision maker’s preferential system. For this reason, the use of linguistic variables introduced, to facilitate decision making ranking process.

3.2. Fuzzy TOPSIS Method

Initial efforts for extending the TOPSIS method to fuzzy sets were made by the study of Rebai [30] in which proposed the first fuzzy extension of TOPSIS method to rank alternatives using types of non-cardinal measures for measuring attributes’ performance in a framework named “BBTOPSIS”. However, the fuzzy extension of the TOPSIS method, used in the present study was, firstly, introduced by [24] to express the uncertainty existing in multicriteria decision support methods and specifically in the experts’ judgements. Given the fact that the TOPSIS method aims at the alternatives ranking based on their distance from the PIS and NIS, these two points have to be identified first. Hereafter, each alternative’s distance is measured from PIS and NIS and the alternative with the smallest distance from the PIS and the largest distance from the NIS is considered the best [29].
At first, as the analysis alternatives have been evaluated according to their severity and probability through the use of linguistic variables, they converted into fuzzy numbers according to the selected fuzzy scale. The normalization process is applied so as fuzzy numbers ranging between 0 to 1 (Equations (6) and (7)).
r ˜ i j   = ( l i j u j + , m i j u j + , u i j u j + ) , 0 C i 1
r ˜ i j   = ( l j u j + , l j m j + , l j l j + ) ,   l j = min i l i j   j
The normalized fuzzy decision matrix, in case of m alternatives and n criteria, is constructed as follows:
R ˜   = [ r ˜ i j ] m × n ,   u j + = max i u i j   j +
where r ˜ i j refers to the normalized values of ( l i j , m i j , u i j )
The weighted normalized value v ˜ i j is the product of the multiplication of weights ( w ˜ j ) with the normalized fuzzy decision matrix r ˜ i j . The weighted normalized decision matrix is obtained as:
V ˜   = [ w ˜ j r ˜ i j ] = [ v ˜ i j ] m × n i = 1 , 2 , , m   j = 1 , 2 , , n
Thereafter the fuzzy PIS and NIS are estimated as:
A + = ( v ˜ 1 + , v ˜ 2 + , , v ˜ n +   ) = { max i v i j | ( i = 1 , 2 , , m ; j = 1 , 2 , , n ) }
( ( A = ( v ˜ 1 , v ˜ 2 , , v ˜ n   ) = { min i v i j | ( i = 1 , 2 , , m ; j = 1 , 2 , , n ) }
Finally each alternative’s distance from the PIS ( d i + ) and NIS ( d i ) points is calculated to be ranked using the closeness coefficient C i as follows:
d i + = j = 1 n d ( v ˜ i j , v ˜ j + )
d i = j = 1 n d ( v ˜ i j , v ˜ j )
Given that, the distance between two triangular fuzzy numbers (TFN) is obtained as
d v ( m , ˜ n ˜ ) = 1 3 [ ( l 1 l 2 ) 2 + ( m 1 m 2 ) 2 + ( u 1 u 2 ) 2 ] C i = d i ( d i + + d i ) With   d i + ,   d i 0   a n d   C i [ 0 , 1 ]

4. The Proposed Approach

The proposed risk assessment framework, works as follows: the well-known multicriteria compromise programming method, the fuzzy TOPSIS, is used for corresponding the decision maker’s values and opinions regarding the importance of safety risk factors. In cooperation with this, PRAT [7] has been selected, due to its simplicity and effectiveness, to handle the real accidents’ data and evaluate safety risks. This TOPSIS-PRAT mixed approach aims to provide to the risk manager a tool that can produce results using real-world accident data and the decision maker’s value system and specific experience, as well. The flowchart of the proposed approach is shown in Figure 1.
As illustrated, after identifying the safety risk factors for a given project, calculations for TOPSIS and PRAT realized separately. Next, the integrated fuzzy TOPSIS and PRAT (IFTPR) index is constructed as a part of the risk management process. Finally, the risk factors are ranked according to their merged index score, and the risk manager makes the decision about the tolerance of the total risk of the project. Figure 2 focuses on showing in more detail the cooperation framework of the two approaches.
Note that indexes P, S, Fr, R, TFN, PIS, NIS, Ci and the scores TPS and IFTPR are explained in details in the next Section 5.

5. Application in a Construction Project

The proposed method was applied in a construction project of a total building renovation in the region of Halkidiki, Greece. The project was the reconstruction of a luxurious 5-star hotel with about 200 rooms, suites and bungalows. In addition, the facilities include a large swimming area with a complex of pools, and many rooms with private gardens and exclusive pools, as well.
The building area is up to 10,000 m2 including foyers, halls, a conference center and a fitness room. More specifically, the building was initially constructed in the 1980s and with only some minor improvements of the furniture had been used since then. It is worth mentioning that reconstruction activities included strengthening the stability of the building, a complete replacement of all electromechanical installations and the plumbing networks, as well. Furthermore, all the window frames of the building were replaced while its energy efficiency was upgraded. In addition, decoration and furnishings were also completely renewed. According to the TOPSIS methodology, an expert site manager is needed for making the prerequisite judgments that the method uses to build its output rankings of the safety risk factors. In our case, the supervising project manager of the construction company plays the role of the decision maker for making the judgements required by the multicriteria method employed.
For validating the functionality of the method, we used real accident data for the years 2014, 2015 and 2016 from the Hellenic Statistical Authority (ELSTAT), which is an independent authority being the national statistics representative of Greece in the service of the EU and in any other international organization. These data are collected constantly every year from ELSTAT and conform to the ESAW methodology [31,
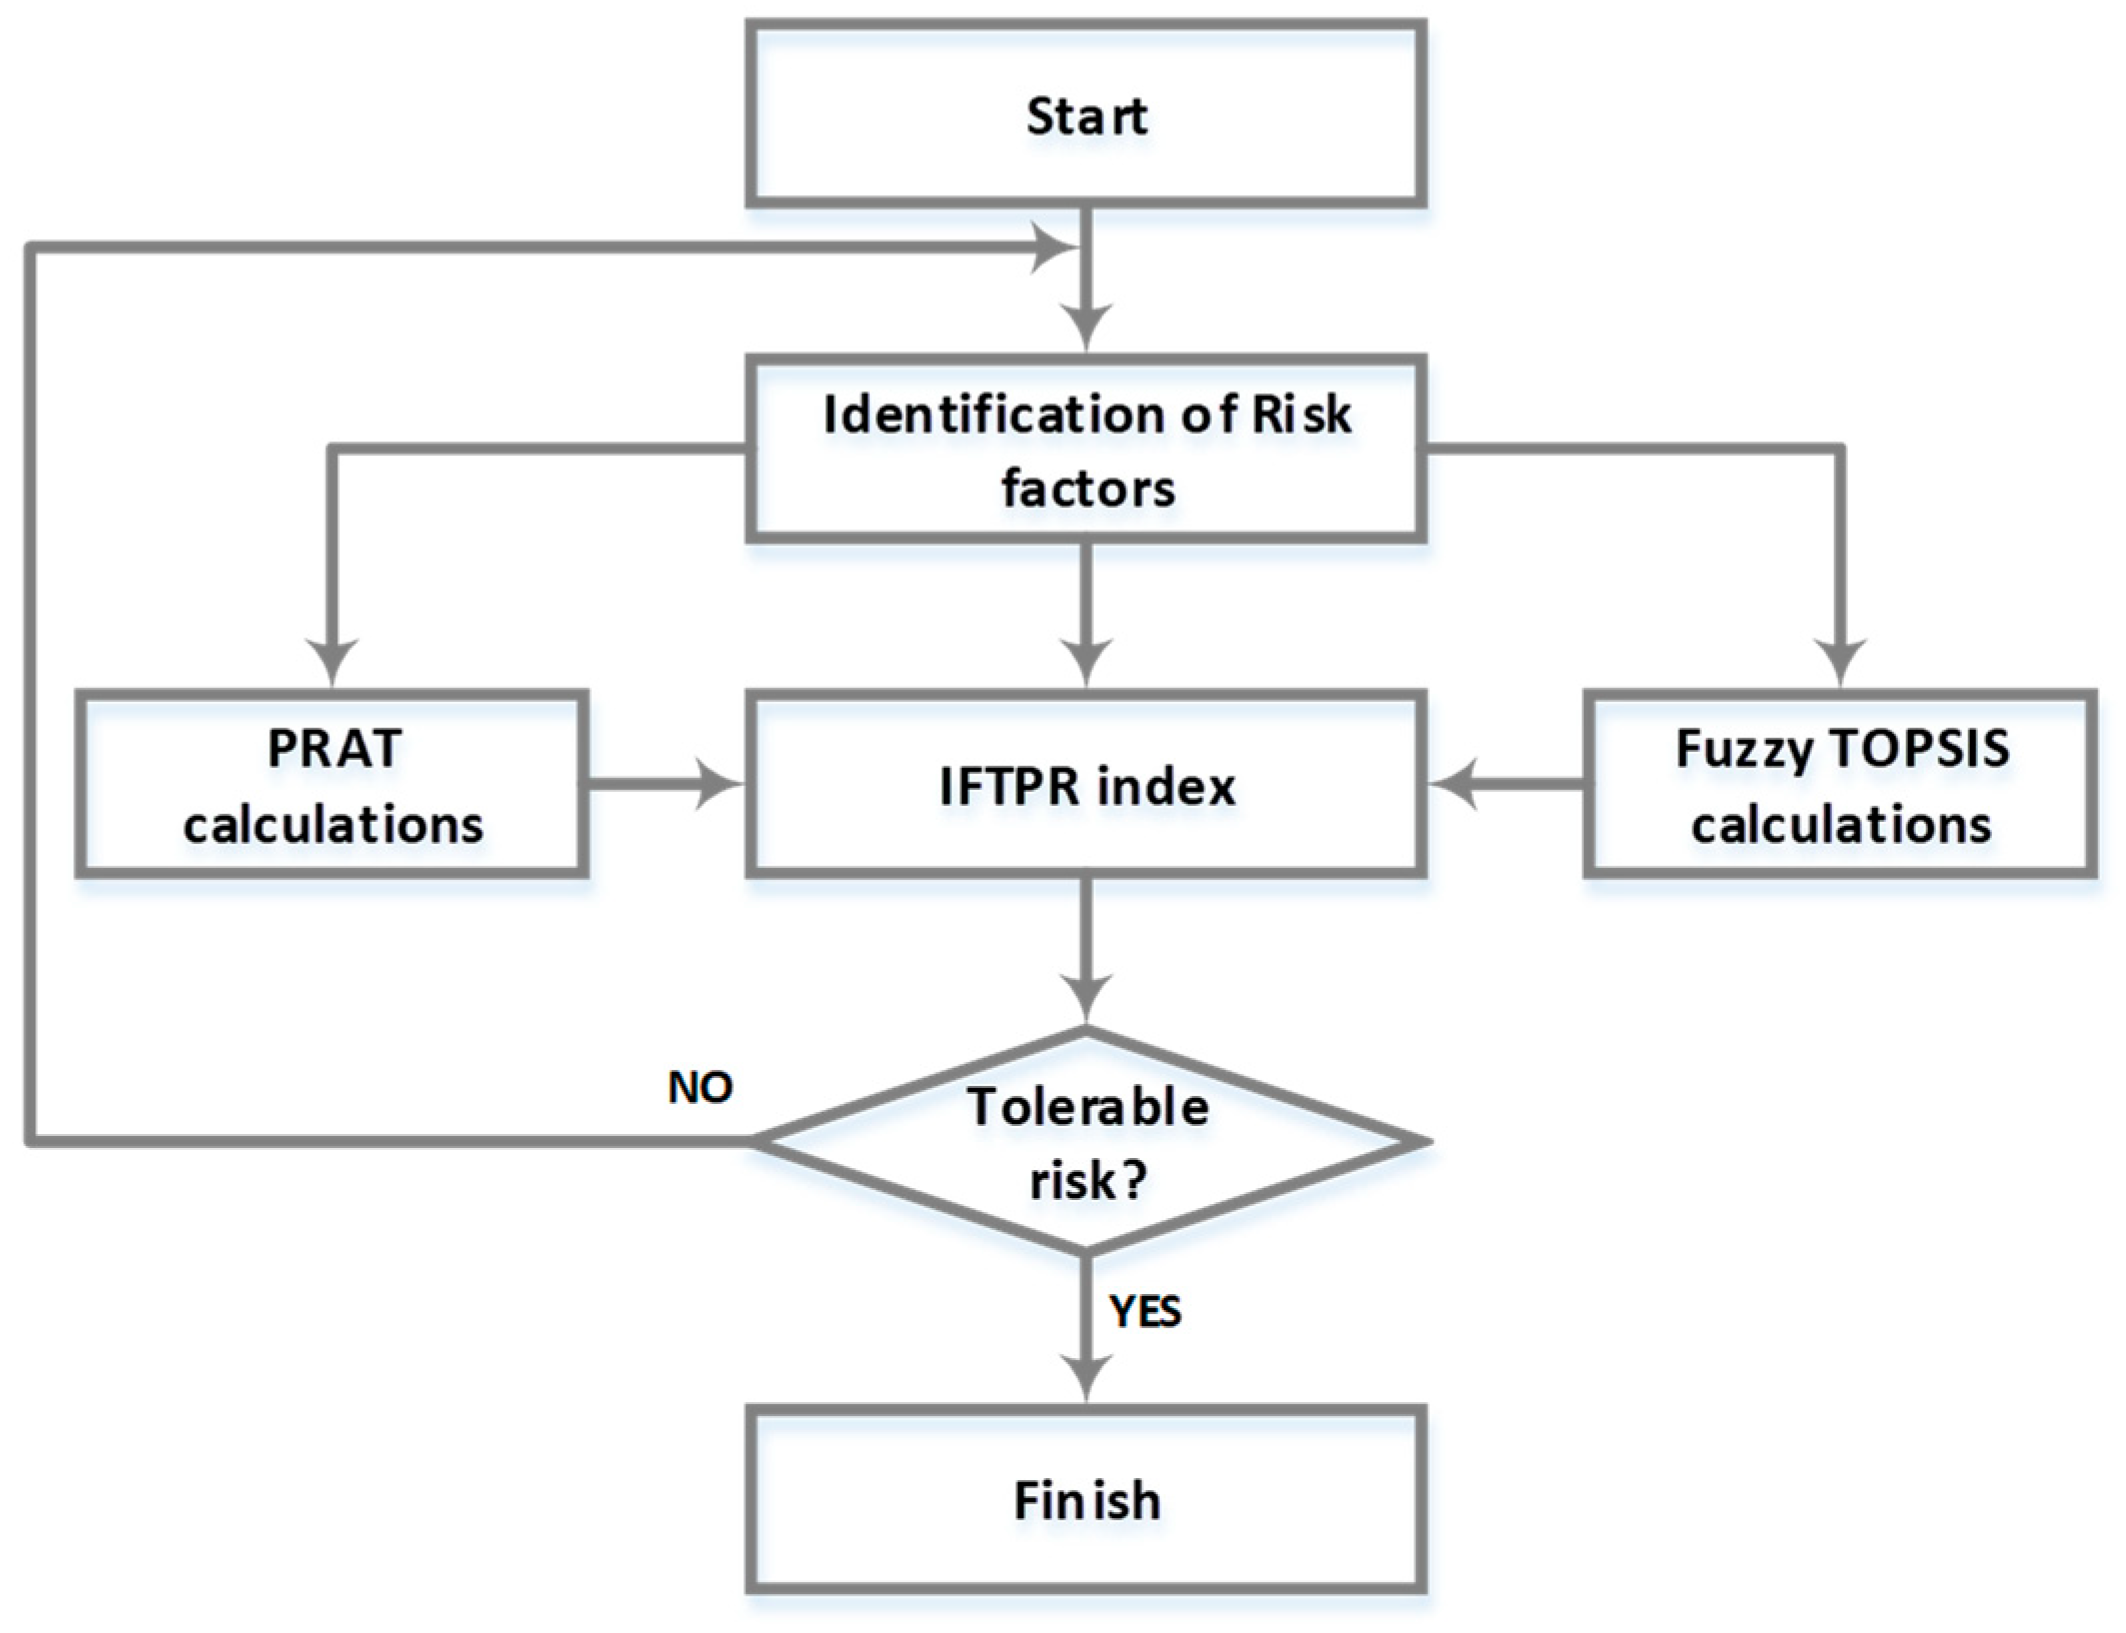
32]. The main goal of our approach is to create a hybrid ranking of risk factors consisting of the ranking of the most frequent and severe safety risk factors using the real data and PRAT method, and the preferential system corresponding to the judgements of the expert using the fuzzy TOPSIS method.
The present study aims to provide project managers a tool for ranking risks and consequently, lead to efficient accident preventing investments, in order to minimize total risk.

5.1. TOPSIS Method Calculations

The nine risk factors included in this study (Table 1) are these used by the ELSTAT’s methodology, which follows the European Statistics on Accidents at Work (ESAW) methodology [31,32]. After that, the linguistic variables’ scale defined according to the decision maker’s preferential system. Table 2 and Table 3 present the linguistic variables for evaluating the analysis criteria regarding severity and probability respectively.
Then the TFN scale is constructed expressing the smallest possible value (l), the most promising value (m), and the largest possible value (u) that describes each fuzzy event. In the present paper, the following fuzzy scale is applied (Table 4):
According to the TOPSIS process, the construction expert selected as the decision maker has to evaluate each factor of this analysis, and make judgements regarding their severity and probability. These judgements are presented in 
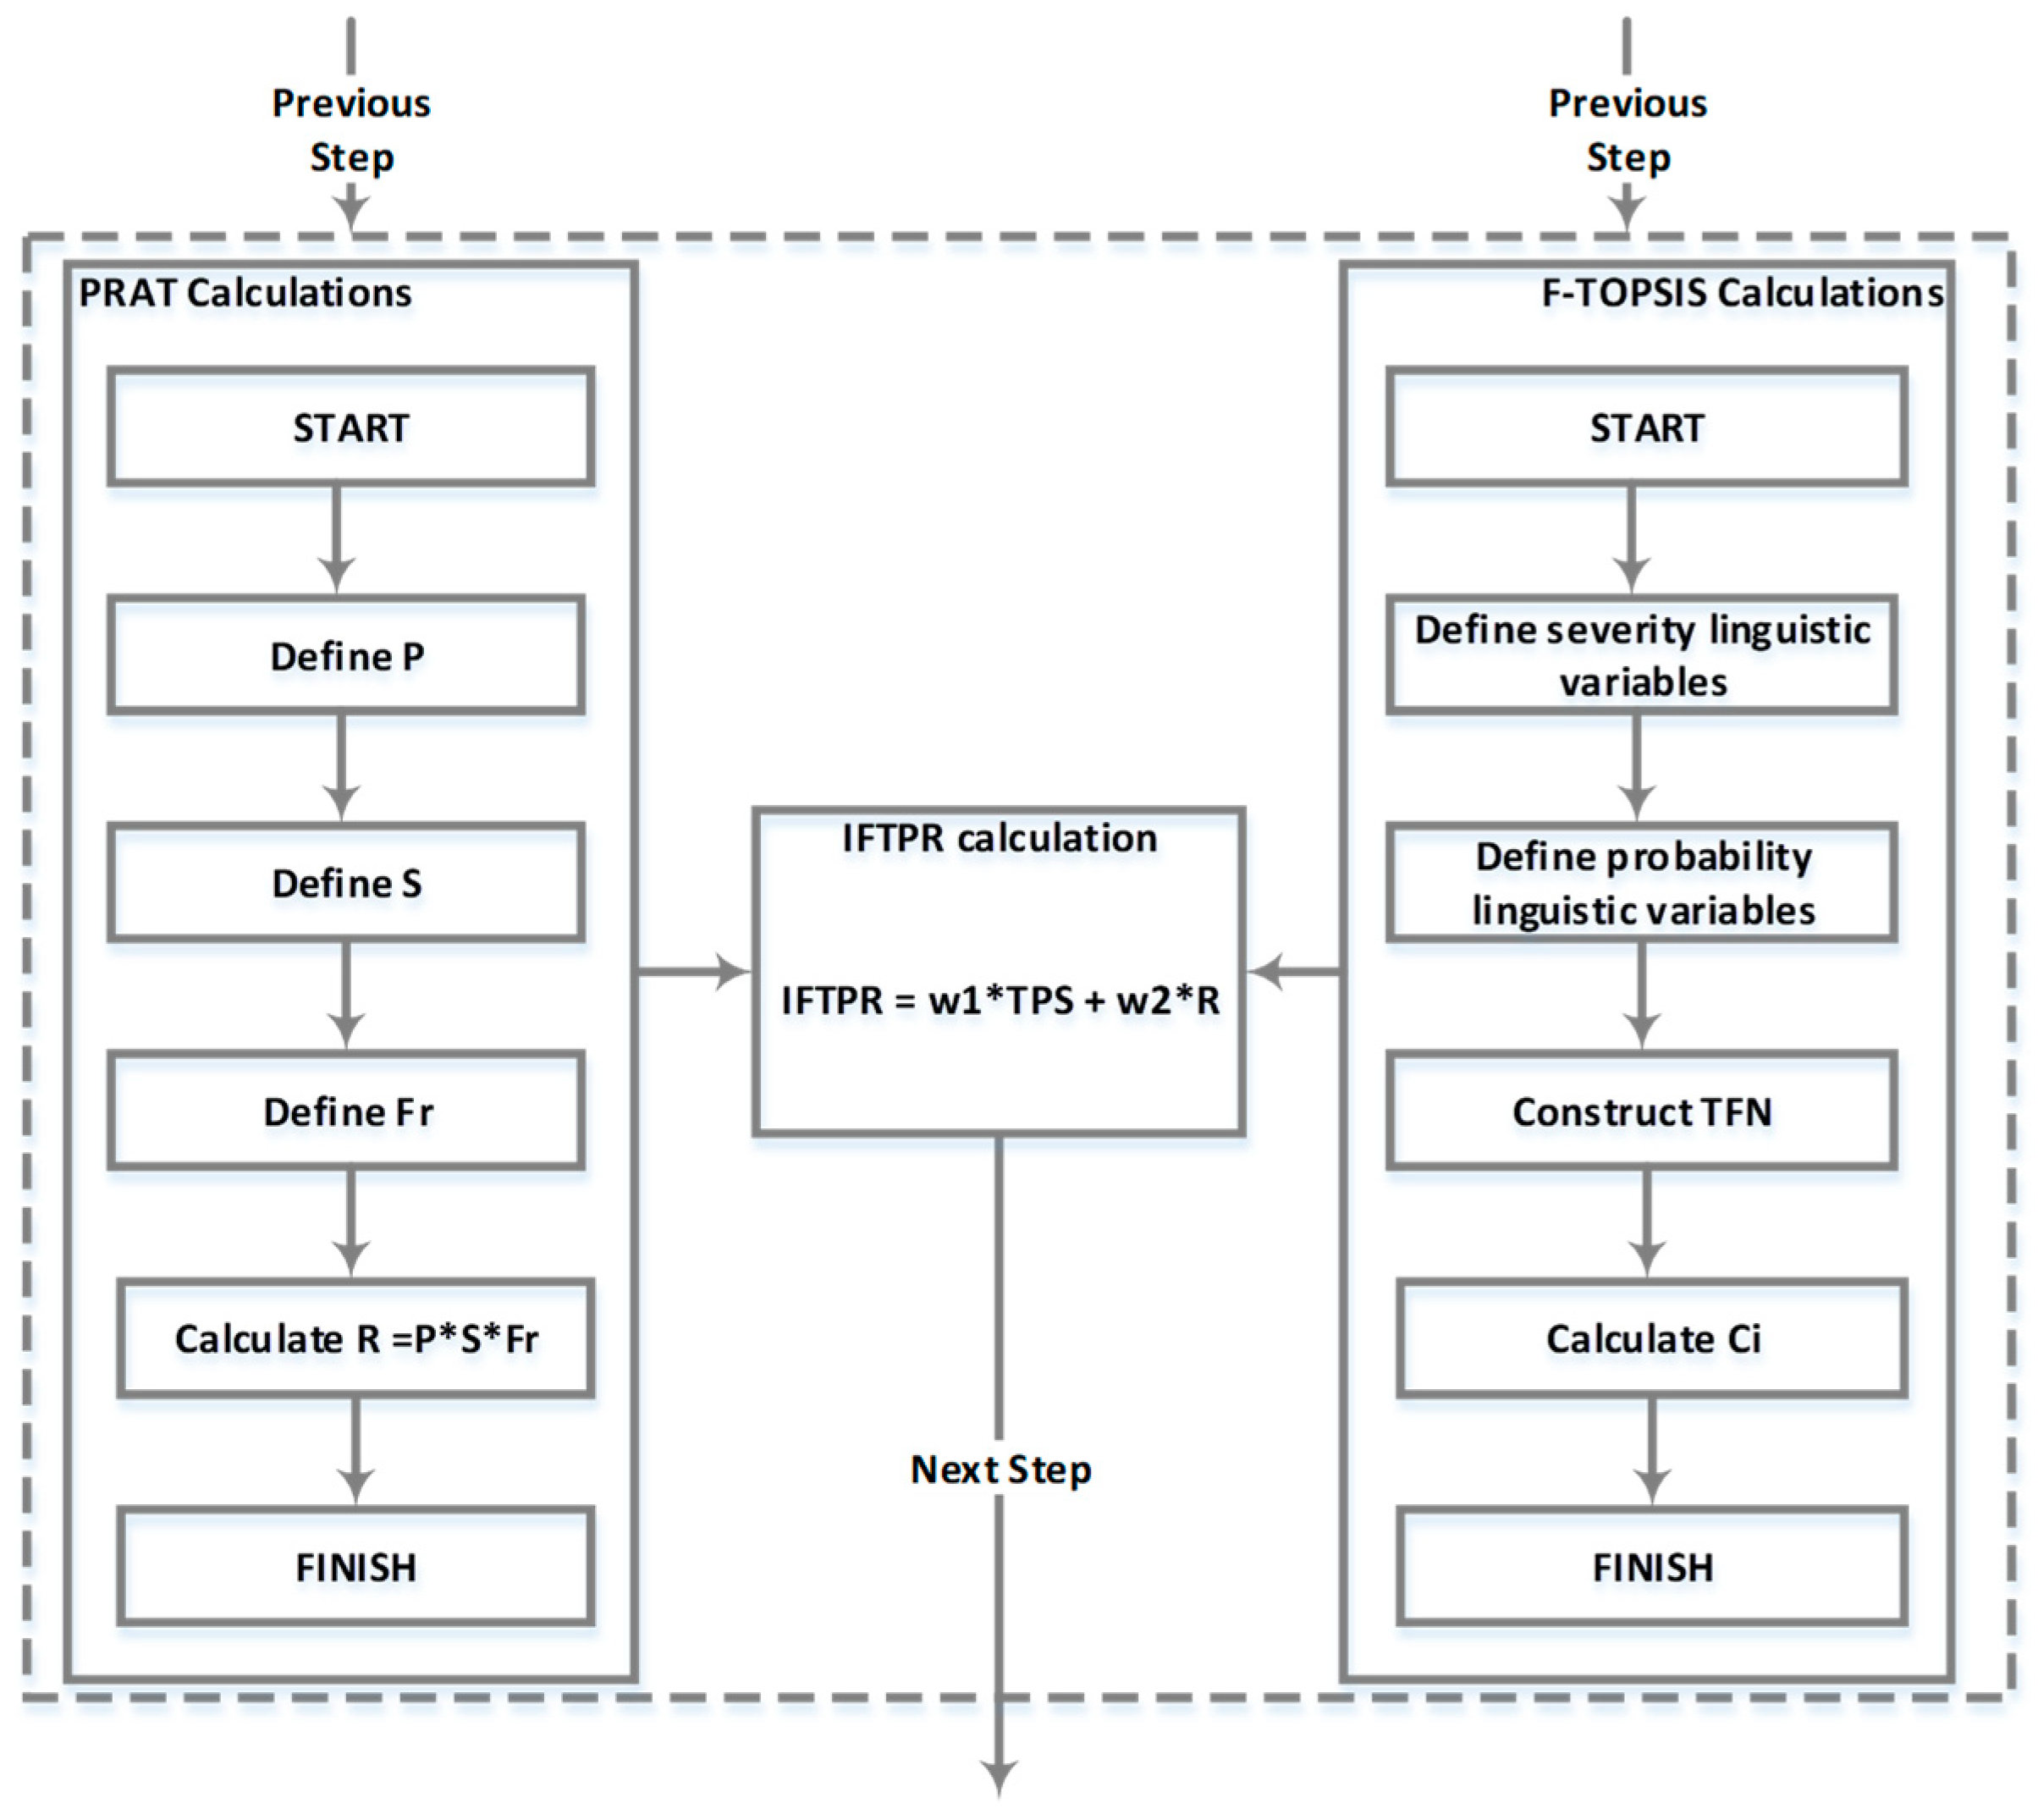
Table 5. Next, the total risk for each factor is estimated by multiplying the TFN probability with the TFN severity:
From Table 5 the PIS (0.385, 0.520, 0.638) and NIS (0.023, 0.040, 0.063) points are estimated according to Equations (10) and (11). Then, the closeness coefficient Ci is calculated with the use of Equations (12)–(14) (Table 6). Given the fact that the factors’ ranking is based on their risk, when the coefficient Ci is more close to 1 the factor is considered to be of high-risk and when the coefficient Ci is more close to 0 the factor is considered to be of low risk.

5.2. Proportional Risk Assessment Technique (PRAT) Method Calculations

In parallel, the risk estimation using the PRAT method proceeds. This simple process uses real accidents data included in Table 7 and Table 8. For each safety risk factor, a risk value (R) is calculated by:
R = P × S × Fr
where P is the probability of an accident type occurring, S is the severity of harm for a given risk factor, and Fr is the frequency of an accident type occurrence. According to Table 2, Table 3 and Table 9, these three factors, can take values in the scale of 1–10, besides the quantity R that can be expressed in the scale of 1–1000.
The real data included in Table 7 and Table 8 were used to define the values for P, S, and F factors, which are illustrated in Table 10.
In this analysis, the level of each factor is considered as follows:
For estimating the level of factor P, we use the average time for an accident to occur (Table 7, column 8), and for severity factor (S) we considered that if a risk factor resulted to at least one fatal incident for each year, it is assigned the highest level (10). The rest of the factors were assigned levels according to the expert’s experience. Regarding factor Fr, we have assigned different levels according to the “average time for a (fatal) accident to occur” (Table 8, column 8) data. For computing the values of the columns “Events/hour” and “Average time for an event (hours)” in Table 7, we have considered the working weeks being 48 per year, having 5 working days each, and 16 working hours per day, resulting in a total of D = 1 × 48 × 5 × 16 = 3840 hours/year. It is worth mentioning that the construction company uses two shifts per day, namely 16 working hours. After computing the R values, we sum these values for every factor. The normalized risk value for each factor defined by dividing each factor’s R value with the total (Table 10).

5.3. Integrated TOPSIS with PRAT

The IFTPR index consist of the TOPSIS score (TPS) with a weighting of w1 = 50%, and the risk value (R) calculated with PRA technique, with a weighting of w2 = 50%. Initially, we considered these factors (TPS and R) as equally important for computing the IFTPR.
IFTPR = 0.5 × TPS + 0.5 × R
The calculations leading to this index are shown in Table 11, while ranking of risk factors according to the IFTPR index are illustrated in the last column of Table 12. In addition, Table 12 summarizes rankings with solely fuzzy TOPSIS, PRAT, and real fatal and non-fatal accidents.

5.4. Results

Table 12 summarizes rankings with applying solely the Fuzzy TOPSIS, and PRAT methods and rankings extracted by the data of real fatal and non-fatal accidents.
According to the TOPSIS results (Table 6 and Table 12), the decision maker evaluates the F3 (horizontal or vertical impact with or against a stationary object) as the most important risk factor in the project. Next, he ranks F4 (Struck by object in motion-collision with), and third F1 (Contact with electrical voltage, temperature, hazardous substances), while F6 (Trapped, crushed, etc.) has ranked fourth. This ranking corresponding the decision maker’s previous experience is in accordance with the ranking from the real data of fatal accidents, which means that the manager is informed about the four most important risks that workers treat in their workplace in a construction project. As for the remaining five factors, the decision maker ranks F7 (Physical or mental stress), and then F8 (Bite, Kick, etc. (animal or human)), F2 (Drowned, buried, enveloped) and F5 (Contact with sharp, pointed, rough, coarse material agent), respectively. Note that the F9 (No information), although existing in the statistical data, cannot be evaluated by the decision maker. The rankings of the rest four factors illustrate that the manager has no clear view about how important these risks are, and so, a supplementary process is needed to support the decision maker’s opinion in order to make better informed decisions.
According to the PRAT results, most important factors are F3 and F4, followed by F1 and F6, which have a relative small difference from the first two factors. In the next three places are the F2, F8 and F5 factors, having clearly smaller risk value than the previous four factors. The next two factors are F7 and F9 that due to their relatively small frequency of appearance have the last two places in the list. Note that the PRAT ranking does not include the “No information” factor since it only exists for statistical reasons.
The cooperation of the fuzzy TOPSIS and PRAT methods results in clearly more efficient output than applying each method separately. Also, it can be stated that this ranking is an indicator about which safety measures should the manager chose with a priority when he allocates the constrained budget.
More specifically, the factors “Horizontal or vertical impact with or against a stationary object” (F3), “Struck by object in motion collision with” (F4), “Contact with electrical voltage, temperature, hazardous substances”(F1) and “Trapped, crushed etc.”(F6) are proved to be much more important risk sources than the other factors since they cause about 74.8% of the total accidents.
The next group of factors including “Bite, Kick etc.” (F8), “Drowned, buried, enveloped” (F2), “Physical or mental stress”(F7) and “Contact with sharp, pointed, rough, coarse material agent”(F5) are ranked to have smaller importance due to the small numbers of real accidents caused during the last three years. In addition, as illustrated by the given judgements, the decision maker has no such previous experience in the work site of a construction project since the rankings are extracted by fuzzy TOPSIS.
Grouping the risk factors in such a manner, illustrates that the decision maker is relatively experienced since he recognizes the four most important risk factors. As for the rest of them, probably because he rarely treats such a kind of risks, the ranking of the expert is quite different than reality. The informed ranking list after applying PRAT and merging with fuzzy TOPSIS results is, as expected, slightly different than the original constructed with the multicriteria method alone, and surely could be used for allocating constrained budget more efficiently to measures that can prevent accidents in the workplace. The contribution of merging these two powerful methods is that the ranking of the decision maker is modified and transformed to obtain facts about accidents that are closer to reality.

6. Conclusions

As OSHA [2] states in a recently published report “A building, no matter how energy efficient or healthy for occupants, is not sustainable if a construction worker is killed while building it”. Furthermore, an employer can really be considered as sustainable only if it ensures the safety and health of their employees [2]. Conforming to these statements, an assessment of risk factors in the workplace is a key aspect in every project. Accidents can surely lead to exceeding budget and time constraints and often can cause lengthy and costly trials and compensation payments for a company. On the other hand, investments in safety measures can reduce risks to a tolerable amount, but in order to do this, near optimal allocation of available budget is crucial. The main contribution of the proposed approach is the cooperation of the fuzzy extension of TOPSIS multicriteria method, the fuzzy TOPSIS, with a simple quantitative process (PRAT) the function of which is based on real accident data. The TOPSIS method is based in linear programming and works with distances from the positive and negative ideal solution. More specifically, it is considered an ideal and a non-ideal solution, and the process aims to find the shortest distance from the positive ideal solution and the longest distance from the negative ideal solution. This synergic framework is employed for assessment and prioritization of risks that construction workers often treat in their work sites. Generally, fuzzy TOPSIS is used to express the decision maker’s experience and PRAT to update knowledge and experience of the expert, using real accident data.
Regarding the implications of the present approach, in practice it can be a very useful framework for risk managers and management practitioners for supporting semi-automatic and fast safety risk prioritization that benefits both from the expertise of the manager, and from real data that the decision maker may not know when treating emergency instances, and then allocating constrained budget in such a manner as to maximize health and safety and minimize the total risk in the workplace. Also, the proposed approach can be used as a knowledge and experience transfer tool from more experienced risk managers to less experienced practitioners in order to assist them in learning how to make informed decisions. In addition, the framework of the present study, and more specific data, can be used to develop hybrid multicriteria methods with other existing quantitative techniques for specific sectors of an economy such as manufacturing and heavy industry where frequently serious accidents occur. Nevertheless, the present process could be improved in the future, by employing sensitivity analysis on the weights of TPS and R that fuzzy TOPSIS and PRAT contribute to the integrated index IFTPR in order to understand if there are some circumstances under which it is needed as a method to override others.

Author Contributions

Conceptualization, G.K.K., O.E.D., P.K.M., A.P.V., D.E.K.; methodology, G.K.K., O.E.D., P.K.M., A.P.V., D.E.K.; software, G.K.K., O.E.D., A.P.V.; validation, G.K.K., O.E.D., P.M., A.P.V., D.E.K.; formal analysis, G.K.K., O.E.D.; investigation, G.K.K., O.E.D.; resources, G.K.K.; data curation, O.E.D., writing—original draft preparation, G.K.K.; writing—review and editing, G.K.K., O.E.D., P.K.M., A.P.V., D.E.K.; visualization, G.K.K., O.E.D., P.K.M., A.P.V., D.E.K.; supervision, D.E.K.; project administration, G.K.K., D.E.K.; funding acquisition, D.E.K.

Funding

This research received no external funding.

Conflicts of Interest

The authors declare no conflict of interest.

References

  1. WHO Global Strategy on Occupational Health for All: The Way to Health at Work. Available online: https://www.who.int/occupational_health/publications/globstrategy/en/index3.html (accessed on 1 July 2018).
  2. OSHA Sustainability in the Workplace: A New Approach for Advancing Worker Safety and Health. Available online: https://www.osha.gov/sustainability/docs/OSHA_sustainability_paper.pdf (accessed on 1 July 2018).
  3. ILO Days Lost Due to Cases of Occupational Injury with Temporary Incapacity for Work by Economic Activity. Available online: http://www.ilo.org/ilostat/faces/oracle/webcenter/portalapp/pagehierarchy/Page27.jspx?indicator=INJ_DAYS_ECO_NB&subject=OSH&datasetCode=A&collectionCode=YI&_adf.ctrl-state=f16q5nvmt_4&_afrLoop=516942705047488&_afrWindowMode=0&_afrWindowId=f16q5nvmt_1#!%40 (accessed on 20 Jun 2018).
  4. EU-OSHA Work-Related Accidents and Injuries Cost EU €476 Billion a Year According to New Global Estimates. Available online: https://osha.europa.eu/en/about-eu-osha/press-room/eu-osha-presents-new-figures-costs-poor-workplace-safety-and-health-world (accessed on 20 June 2018).
  5. Marhavilas, P.; Koulouriotis, D.; Nikolaou, I.; Tsotoulidou, S. International Occupational Health and Safety Management-Systems Standards as a Frame for the Sustainability: Mapping the Territory. Sustainability 2018, 10, 3663. [Google Scholar] [CrossRef]
  6. European Commission Communication from the Commission Concerning Corporate Social Responsibility: A Business Contribution to Sustainable Development. Available online: https://eur-lex.europa.eu/LexUriServ/LexUriServ.do?uri=COM:2002:0347:FIN:EN:PDF (accessed on 26 September 2018).
  7. Marhavilas, P.K.; Koulouriotis, D.E. A risk-estimation methodological framework using quantitative assessment techniques and real accidents’ data: Application in an aluminum extrusion industry. J. Loss Prev. Process Ind. 2008, 21, 596–603. [Google Scholar] [CrossRef]
  8. Marhavilas, P.K.; Koulouriotis, D.E. Developing a new alternative risk assessment framework in the work sites by including a stochastic and a deterministic process: A case study for the Greek Public Electric Power Provider. Saf. Sci. 2012, 50, 448–462. [Google Scholar] [CrossRef]
  9. Aneziris, O.N.; Topali, E.; Papazoglou, I.A. Occupational risk of building construction. Reliab. Eng. Syst. Saf. 2012, 105, 36–46. [Google Scholar] [CrossRef]
  10. Aminbakhsh, S.; Gunduz, M.; Sonmez, R. Safety risk assessment using analytic hierarchy process (AHP) during planning and budgeting of construction projects. J. Saf. Res. 2013, 46, 99–105. [Google Scholar] [CrossRef] [PubMed]
  11. Marhavilas, P.K.; Koulouriotis, D.E.; Spartalis, S.H. Harmonic analysis of occupational-accident time-series as a part of the quantified risk evaluation in worksites: Application on electric power industry and construction sector. Reliab. Eng. Syst. Saf. 2013, 112, 8–25. [Google Scholar] [CrossRef]
  12. Guo, Z.; Haimes, Y.Y. Risk Assessment of Infrastructure System of Systems with Precursor Analysis. Risk Anal. 2016, 36, 1630–1643. [Google Scholar] [CrossRef]
  13. Goerlandt, F.; Khakzad, N.; Reniers, G. Validity and validation of safety-related quantitative risk analysis: A review. Saf. Sci. 2017, 99, 127–139. [Google Scholar] [CrossRef] [Green Version]
  14. Dehdasht, G.; Mohamad Zin, R.; Ferwati, S.M.; Mohammed Abdullahi, M.; Keyvanfar, A.; McCaffer, R. DEMATEL-ANP Risk Assessment in Oil and Gas Construction Projects. Sustainability 2017, 9, 1420. [Google Scholar] [CrossRef]
  15. Ramkumar, M.; Schoenherr, T.; Jenamani, M. Risk assessment of outsourcing e-procurement services: Integrating SWOT analysis with a modified ANP-based fuzzy inference system. Prod. Plan. Control 2016, 27, 1171–1190. [Google Scholar] [CrossRef]
  16. Ramkumar, M. A modified ANP and fuzzy inference system based approach for risk assessment of in-house and third party e-procurement systems. Strateg. Outsourc. Int. J. 2016, 9, 159–188. [Google Scholar] [CrossRef]
  17. Jo, W.B.; Lee, S.Y.; Kim, H.J.; Khan, M.R. Trend Analysis of Construction Industrial Accidents in Korea from 2011 to 2015. Sustainability 2017, 9, 1297. [Google Scholar] [CrossRef]
  18. Ghodrati, N.; Yiu, T.W.; Wilkinson, S.; Shahbazpour, M. A new approach to predict safety outcomes in the construction industry. Saf. Sci. 2018, 109, 86–94. [Google Scholar] [CrossRef]
  19. Wu, S.; Wang, J.; Wei, G.; Wei, Y. Research on Construction Engineering Project Risk Assessment with Some 2-Tuple Linguistic Neutrosophic Hamy Mean Operators. Sustainability 2018, 10, 1536. [Google Scholar] [CrossRef]
  20. Sousa, V.; Almeida, N.M.; Dias, L.A. Risk-based management of occupational safety and health in the construction industry—Part 1: Background knowledge. Saf. Sci. 2014, 66, 75–86. [Google Scholar] [CrossRef]
  21. Sousa, V.; Almeida, N.M.; Dias, L.A. Risk-based management of occupational safety and health in the construction industry—Part 2: Quantitative model. Saf. Sci. 2015, 74, 184–194. [Google Scholar] [CrossRef]
  22. Koulinas, G.K.; Marhavilas, P.K.; Demesouka, O.E.; Vavatsikos, A.P.; Koulouriotis, D.E. Risk analysis and assessment in the worksites using the fuzzy-analytical hierarchy process and a quantitative technique—A case study for the Greek construction sector. Saf. Sci. 2019, 112, 96–104. [Google Scholar] [CrossRef]
  23. Hwang, C.L.; Yoon, K. Multiple Attribute Decision Making Methods and Applications; Springer: Berlin, Germany, 1981; ISBN 978-3-642-48318-9. [Google Scholar]
  24. Chen, C.-T. Extensions of the TOPSIS for group decision-making under fuzzy environment. Fuzzy Sets Syst. 2000, 114, 1–9. [Google Scholar] [CrossRef]
  25. Jozi, S.A.; Majd, N.M. Health, safety, and environmental risk assessment of steel production complex in central Iran using TOPSIS. Environ. Monit. Assess. 2014, 186, 6969–6983. [Google Scholar] [CrossRef]
  26. Mahdevari, S.; Shahriar, K.; Esfahanipour, A. Human health and safety risks management in underground coal mines using fuzzy TOPSIS. Sci. Total Environ. 2014, 488–489, 85–99. [Google Scholar] [CrossRef]
  27. Jozi, S.A.; Shoshtary, M.T.; Zadeh, A.R.K. Environmental Risk Assessment of Dams in Construction Phase Using a Multi-Criteria Decision-Making (MCDM) Method. Hum. Ecol. Risk Assess. 2015, 21, 1–16. [Google Scholar] [CrossRef]
  28. Cococcioni, M.; Lazzerini, B.; Pistolesi, F. A semi-supervised learning-aided evolutionary approach to occupational safety improvement. In Proceedings of the 2016 IEEE Congress on Evolutionary Computation, CEC 2016, Vancouver, BC, Canada, 24–29 July 2016; pp. 3695–3701. [Google Scholar]
  29. Hwang, C.-L.; Lai, Y.-J.; Liu, T.-Y. A new approach for multiple objective decision making. Comput. Oper. Res. 1993, 20, 889–899. [Google Scholar] [CrossRef]
  30. Rebai, A. BBTOPSIS: A bag based technique for order preference by similarity to ideal solution. Fuzzy Sets Syst. 1993, 60, 143–162. [Google Scholar] [CrossRef]
  31. Eurostat European Statistics on Accident at Work (ESAW) Methodology. Available online: http://ec.europa.eu/eurostat/ramon/statmanuals/files/ESAW_2001_EN.pdf (accessed on 20 June 2018).
  32. Eurostat European Statistics on Accident at Work (ESAW) Summary Methodology. Available online: http://ec.europa.eu/eurostat/documents/3859598/5926181/KS-RA-12-102-EN.PDF/56cd35ba-1e8a-4af3-9f9a-b3c47611ff1c (accessed on 20 June 2018).
Figure 1. Flowchart of the proposed approach.
Sustainability 11 00615 g001
Figure 2. The fuzzy technique for order of preference by similarity to ideal solution (TOPSI)S and proportional risk assessment technique (PRAT) methods’ integration steps.
Sustainability 11 00615 g002
Table 1. The risk factors of the analysis and their codes.
Description of Risk FactorsCode
Contact with electrical voltage, temperature, hazardous substancesF1
Drowned, buried, envelopedF2
Horizontal or vertical impact with or against a stationary object (the victim is in motion)F3
Struck by object in motion collision withF4
Contact with sharp, pointed, rough, coarse material agentF5
Trapped, crushed etc.F6
Physical or mental stressF7
Bite, Kick etc. (animal or human) F8
Other contacts-modes of injury not listed in this classificationF9
Table 2. Probability-frequency scale, including ten gradation levels, in order to estimate the probability factor.
Probability Factor (P)Description of Undesirable EventFrequency of Events Occurring
10Unavoidable1 event during a time period of Δt << 103 h
9Almost assured1 event during a time period of Δt < 103 h
8Frequent1 event during a time period of Δt almost equal to 103 h
7Probable1 event during a time period of 103 < Δt < 10^4 h
6Probability slightly greater than 50%1 event during a time period of 104 < Δt < 105 h
5Probability 50%1 event during a time period of Δt almost equal to 105 h
4Probability slightly less than 50%1 event during a time period of 105 < Δt < 106 h
3Almost improbable (or remote)1 event during a time period of 106 < Δt < 107 h
2Improbable1 event during a time period of Δt almost equal to 107 h
1Impossible1 event during a time period of Δt > 107 h
Table 3. Gradation severity of harm factor in association with the undesirable event.
Severity of Harm Factor (S)Description of Undesirable Event
10Death
9Permanent total inefficiency
8Permanent serious inefficiency
7Permanent slight inefficiency
6Absence from work > 3 weeks, and return with health problems
5Absence from work > 3 weeks, and return after full recovery
4Absence from work > 3 days and < 3 weeks, and return after full recovery
3Absence from work < 3 days, and return after full recovery
2Slight injuring without absence from the work, and with full recovery
1No human injury
Table 4. Fuzzy scale for linguistic variables evaluation.
Probability Factor (P)Severity Factor (S)Triangular Fuzzy Scale
P10S10(0.80, 0.90, 1.00)
P9S9(0.75, 0.85, 0.95)
P8S8(0.70, 0.80, 0.85)
P7S7(0.55, 0.65, 0.75)
P6S6(0.50, 0.60, 0.65)
P5S5(0.35, 0.55, 0.60)
P4S4(0.25, 0.40, 0.45)
P3S3(0.20, 0.30, 0.35)
P2S2(0.15, 0.20, 0.25)
P1S1(0.00, 0.10, 0.15)
Table 5. Analysis factors’ evaluation.
FactorPTFN (P)STFN (S)TFN (P x S)
F1P5(0.35, 0.55, 0.60)S8(0.70, 0.80, 0.85)(0.245, 0.440, 0.510)
F2P5(0.35, 0.55, 0.60)S2(0.15, 0.20, 0.25)(0.053, 0.110, 0.150)
F3P7(0.55, 0.65, 0.75)S8(0.70, 0.80, 0.85)(0.385, 0.520, 0,638)
F4P7(0.55, 0.65, 0.75)S7(0.55, 0.65, 0.75)(0.303, 0.423, 0,563)
F5P3(0.20, 0.30, 0.35)S3(0.20, 0.30, 0.35)(0.040, 0.090, 0.123)
F6P6(0.50, 0.60, 0.65)S7(0.55, 0.65, 0.75)(0.275, 0.390, 0.488)
F7P5(0.35, 0.55, 0.60)S3(0.20, 0.30, 0.35)(0.070, 0.165, 0.210)
F8P6(0.50, 0.60, 0.65)S2(0.15, 0.20, 0.25)(0.075, 0.120, 0.163)
F9P2(0.15, 0.20, 0.25)S2(0.15, 0.20, 0.25)(0.023, 0.040, 0.063)
Table 6. The Ci estimation.
Factord+d−CiNormalized Ci
F10.1190.3690.75719.20%
F20.4150.0670.1383.50%
F30.0000.4801.00025.36%
F40.0860.3970.82320.87%
F50.4360.0460.0952.41%
F60.1310.3490.72718.44%
F70.3690.1150.2376.01%
F80.4010.0800.1664.21%
F90.4810.0000.0000.00%
3.943
Table 7. Non-fatal accidents at work by contact/mode of injury. (Source: Hellenic Statistics Authority, Press Release Survey on Accidents at Work (2014), (2015), (2016)).
Mode of Injury201420152016Total %Events/HourAverage Time for an Event (Hours)
F1Contact with electrical voltage, temperature, hazardous substances1121421322.88%0.033529.84
F2Drowned, buried, enveloped0110.01%0.00025760.00
F3Horizontal or vertical impact with or against a stationary object (the victim is in motion)15341702177837.44%0.43522.30
F4Struck by object in motion collision with980975102722.27%0.25893.86
F5Contact with sharp, pointed, rough, coarse material agent51455556112.17%0.14157.07
F6Trapped, crushed etc.4104224849.83%0.11428.75
F7Physical or mental stress4584084469.80%0.11398.78
F8Bite, Kick etc. (animal or human) 4459551.18%0.013772.91
F9Other contacts/modes of injury not listed in this classification4320.07%0.03351280.00
No information1391922534.36%0.050719.73
Sum419544594739100.0
Table 8. Fatal accidents at work by contact/mode of injury. (Source: Hellenic Statistics Authority, Press Release Survey On Accidents At Work (2014), (2015), (2016)).
Mode of Injury201420152016Total %Events/HourAverage Time for an Event (Hours)
F1Contact with electrical voltage, temperature, hazardous substances47310.14%0.0009822.86
F2Drowned, buried, enveloped4114.35%0.00121920.00
F3Horizontal or vertical impact with or against a stationary object (the victim is in motion)17171132.61%0.0005256.00
F4Struck by object in motion collision with11171732.61%0.0039256.00
F5Contact with sharp, pointed, rough, coarse material agent0010.72%0.003911520.00
F6Trapped, crushed etc.52710.14%0.0001822.86
F7Physical or mental stress1000.72%0.001211520.00
F8Bite, Kick etc. (animal or human) 2001.45%0.00015760.00
F9Other contacts/modes of injury not listed in this classification0000.00%0.00020.00
No information2177.25%0.00091152.00
Sum464547100.0
Table 9. Gradation of the frequency (or the exposure) factor in association with the undesirable event.
Frequency Factor (Fr)Description of Undesirable Event
10Permanent presence of damage
9Presence of damage every 30 s
8Presence of damage every 1 min
7Presence of damage every 30 min
6Presence of damage every 1 h
5Presence of damage every 8 h
4Presence of damage every 1 week (182.5 h)
3Presence of damage every 1 month (730 h)
2Presence of damage every 1 year (8760 h)
1Presence of damage every 5 years (43800 h)
Table 10. Classification of important hazard sources after PRAT.
Description of Risk FactorsProbability Factor (P)Severity of Harm Factor (S)Frequency Factor (Fr)Risk Value (R)Normalized
Risk Value
Table 7 and Table 8Table 7 and Table 8Table 7 and Table 8
Contact with electrical voltage, temperature, hazardous substancesF11010330014.08%
Drowned, buried, envelopedF281021607.51%
Horizontal or vertical impact with or against a stationary object (the victim is in motion)F31010440018.78%
Struck by object in motion collision withF41010440018.78%
Contact with sharp, pointed, rough, coarse material agentF510721406.57%
Trapped, crushed etc.F61010330014.08%
Physical or mental stressF71071703.29%
Bite, Kick etc. (animal or human)F810821607.51%
Other contacts/modes of injury not listed in this classificationF970000.00%
No information-101022009.39%
Sum 2130100.00%
Table 11. Calculations for the integrated fuzzy TOPSIS and PRAT (IFTPR) method ranking.
Description of Risk FactorsPRAT (R)F-TOPSIS (TPS)IFTPR (0.5 × R + 0.5 × TPS)
Contact with electrical voltage, temperature, hazardous substances14.08%19.20%16.64%
Drowned, buried, enveloped7.51%3.50%5.51%
Horizontal or vertical impact with or against a stationary object (the victim is in motion)18.78%25.36%22.07%
Struck by object in motion collision with18.78%20.87%19.83%
Contact with sharp, pointed, rough, coarse material agent6.57%2.41%4.49%
Trapped, crushed etc.14.08%18.44%16.26%
Physical or mental stress3.29%6.01%4.65%
Bite, Kick etc. (animal or human) 7.51%4.21%5.86%
Other contacts-modes of injury not listed in this classification0.00%0.00%0.00%
No Information9.39%0.00%4.69%
Table 12. Rankings of risk factors for the different approaches used.
Real Fatal Accidents DataReal Non Fatal Accidents DataFuzzy TOPSISPRATF-TOPSIS & PRAT
abdef
F3 (32.61%)F3 (37.44%)F3 (25.36%)F3 (18.78%)F3 (22.07%)
F4 (32.61%)F4 (22.27%)F4 (20.87%)F4 (18.78%)F4 (19.83%)
F1 (10.14%)F5 (12.17%)F1 (19.20%)F1 (14.08%)F1 (16.64%)
F6 (1.14%)F6 (9.83%)F6 (18.22%)F6 (14.08%)F6 (16.26%)
F2 (4.35%)F7 (9.80%)F7 (6.01%)F2 (7.51%)F8 (5.86%)
F8 (1.45%)F1 (2.88%)F8 (4.21%)F8 (7.51%)F2 (5.51%)
F5 (0.72%)F8 (1.18%)F2 (3.50%)F5 (6.57%)F7 (4.65%)
F7 (0.72%)F9 (0.07%)F5 (2.41%)F7 (3.29%)F5 (4.49%)
F9 (0.00%)F2 (0.01%)F9 (0.00%)F9 (0.00%)F9 (0.00%)

