Article

Effect of YouTube Marketing Communication on Converting Brand Liking into Preference among Millennials Regarding Brands in General and Sustainable Offers in Particular. Evidence from South Africa and Romania

by
Rodney Duffett
1,
Dana-Mihaela Petroșanu
2,*,
Iliuta-Costel Negricea
3 and
Tudor Edu
3
1
Marketing Department, Faculty of Business and Management Sciences, Cape Peninsula University of Technology, Keizersgracht and Tennant Street, Cape Town 8000, South Africa
2
Department of Mathematics-Informatics, Faculty of Applied Sciences, University Politehnica of Bucharest, Splaiul Independenței 313, 060042 Bucharest, Romania
3
Management-Marketing Department, Faculty of Management-Marketing, Romanian-American University, 1B Expozitiei Blvd., 1st district, 012101 Bucharest, Romania
*
Author to whom correspondence should be addressed.
Sustainability 2019, 11(3), 604; https://doi.org/10.3390/su11030604
Submission received: 24 December 2018 / Revised: 7 January 2019 / Accepted: 19 January 2019 / Published: 23 January 2019
(This article belongs to the Section Economic and Business Aspects of Sustainability)

Abstract

:
The omnipresent role of online information and communication technology (ICT) channels in the lives of Millennial consumers is universally recognised in industry and academia. The persistent usage of ICT platforms such as social media, especially digital video sharing conduits (e.g., YouTube), among the Millennial cohort has become an important marketing communication platform for organisations to reach this evasive target market. The extensive use of YouTube has generated billions of dollars in marketing communication income, but there is limited academic inquiry in terms of in developing economies, particularly regarding the effect of online usage and demographic factors among Millennials. This paper examines the effect of YouTube marketing communication on affective (attitudinal) responses, meaning brand liking and the impact on brand preference, among Millennials in two developing economies, Romania and South Africa, as well as the influence of usage and demographic factors on the affective (attitudinal) association. A survey was conducted among 400 Romanian and 400 South African respondents, and the hypothesised associations were evaluated via structural equation modelling (SEM) and multigroup SEM. The results of this paper reveal a favourable connection between brand liking and brand preference as a result of YouTube marketing communication, making a notable contribution to the limited YouTube inquiry on attitude-to-advertising theory in developing economies regarding brands in general and sustainable offers in particular. A number of the online usage and demographic factors were also found to have an effect on the brand liking and preference association, supporting in the reduction of the academic–practitioner gap, and assisting organisations in better understanding Millennials in the development of effective marketing communication campaigns on video sharing platforms.

1. Introduction

Digital video is one of the fastest growing social media, especially among Millennials (18–34-year olds), with an estimated 4.5 billion global users and an advertising spending forecast of $37 billion by 2022 (across all video sharing platforms). YouTube is predicted to account for nearly a quarter of free video advertising spending, and over 1 billion hours are watched on YouTube daily. Hence, YouTube has become a very important communication channel and is commissioning a greater portion of marketing communication budgets, expressly to reach the Millennial generation group, which stands to inherit $5 trillion from their Baby Boomer parents [1,2]. Thus, Millennials’ attitudes towards YouTube marketing communication are of great significance to organisations and their brands, since they may offer a greater understanding of future consumer behaviour predispositions considering their incremental growing spending power [2,3,4] and a number of this cohort members displaying a particular concern towards the environment [5]. Moreover, over 80% of Millennials watch YouTube on a monthly basis [6]; hence, organisations cannot ignore this digital video sharing platform to target this very lucrative cohort. However, Araújo et al. [7] disclosed that there was a dearth of research that considers quantitative analysis of online video advertising among Millennials; hence, further inquiry is necessary to understand this cohort’s affective (attitudinal) responses in terms of YouTube marketing communication.
There is disagreement regarding how to assess online advertising effectiveness. Social media metrics are proposed to be an effective measure, but click-through rates do not reveal the influence of social media marketing communication on consumer affective (attitudinal) responses, which require a different perspective to examine the aforementioned effectiveness. Social media marketing communication is mainly driven by consumer desire, so it is imperative to understand the behaviour motivator, in other words, consumer attitudes, which are main catalysts of marketing communication exposure [8,9]. Lutz [10] concluded that measuring attitudes was important, since they had an effect on consumers’ responses to marketing communication. In References [11,12], the authors disclosed that there were three stages in hierarchy-of-effect models, namely cognitive (awareness and knowledge), affective (liking and preference), and behavioural (buying intention and purchase). The authors of [13,14] asserted that emotional/affective responses were seen as a sequence of intense feelings that may result in immediate or future behavioural responses. Hence, this study considers whether brand liking can be converted into brand preference due to YouTube marketing communication.
A number of inquiries have examined consumers’ cognitive and behavioural responses, perceptions, and other aspects of YouTube marketing communication [7,15,16,17,18,19,20,21,22,23,24,25,26,27,28,29,30,31,32,33,34,35,36,37,38]. However, if the main goal of marketing communication is to create a favourable attitude-to-advertising (Aad) experience to increase purchase intentions, then a positive affective response to marketing communication (i.e., advertising) is a fitting measure of advertising effectiveness [11,12]. Several inquiries have considered various aspects of affective responses [14,39,40,41,42,43,44] towards various types of YouTube marketing communication. However, Dehghani et al. [19] reported that there was a lack of research and knowledge concerning YouTube as an advertising channel for marketers to use as an effective marketing communication medium in general, as well as in sustainability issues in particular, considering that many companies nowadays focus on issues outside of the traditional marketing mix in positioning endeavours, Corporate Social Responsibility (CSR) perspectives often playing a leading role [45]. Furthermore, none of these studies examined the association between liking and preference affective (attitudinal) responses in terms of the hierarchy-of-effects model, and it is important to reduce the academic–practitioner gap.
Additionally, most of the abovementioned research was conducted in developed economies, where Millennials have greater and superior access to sound information and communication technology (ICT) infrastructure. Furthermore, the growth of social media has begun to slow in many developed economies, whereas developing economies are still showing robust growth [46]. There is also limited academic inquiry in developing economies concerning video sharing users, whose attitudes and usage factors may be divergent compared to developed economies (such as the United States (US) and Western Europe economies) owing to differing cultural characteristics, poor ICT infrastructure, and slower Internet speeds (especially in Africa) [47,48,49]. Additionally, there are limited cross-country studies, and few have considered the effect of independent variables, such as usage and demographic factors, on YouTube marketing communication. Westenberg [37] noted that further YouTube research should use large sample sizes in different populations (countries). Rodriguez [32] indicated that social media (YouTube) were still growing and more research was required to understand the most effective conduits to initiate YouTube advertising. Bolton et al. [3] also agreed that previous social media research led to more questions than answers and advocated that few studies considered whether there were differences within the Millennial cohort. Balakrishnan and Manickavasagam [16] revealed that not much was known about the influence of different user patterns and demographics on consumer attitudes towards social media advertising, while the authors of [50] uncovered that social media frequent users were more predisposed to acquiring green offers. Hence, this empirical investigation study not only seeks to ascertain Millennials’ affective (attitudinal) responses based on YouTube marketing communication (i.e., conversion of brand liking into preference), but also considers the effect of usage and demographic factors in two developing economies from two continents, Europe and Africa, namely Romania and South Africa.
The remainder of the paper is organised as follows. Section 2, Materials and Methods, presents an analysis regarding YouTube and marketing communication, millennial cohort, attitudes, and research methods. Afterwards, Section 3 describes the results regarding usage and demographic factors along with hypothesis testing. Section 4, Discussion and Implications, analyses key findings, theoretical implications, managerial implications, as well as limitations and future research directions.

2. Materials and Methods

2.1. YouTube and Marketing Communication

YouTube is the second largest search engine after Google (the owner of YouTube); the third most frequented website; and the largest of the video content sharing and creation websites in the world [51]. YouTube is free in terms of membership, uploading, and/or viewing content, which means that this digital ICT platform attracts a huge audience. YouTube has 1.5 billion monthly users; two-thirds of the users are aged 18–44; over 400 hours of video are uploaded every minute; 1 billion hours of video content are viewed on a daily basis; and over 50% of YouTube uploaded files are viewed via mobile devices [6,52,53].
YouTube provides organisations and brands with an interactive ICT platform to share new and existing video content with consumers. YouTube, also dubbed the “content community” [54], is considered an important antecedent of the sharing economy or collaborative consumption realities as collective usage, with a significant impact on sustainability, is possible mainly through online social network interactions [55,56,57]. YouTube’s contribution to collaborative behaviour is ensured through the videos uploaded by organisations or individuals, among which a distinct percentage display social or environmental endeavours [58,59,60]. A personalised-brand YouTube channel assists in creating the brand’s online presence and provides users with a platform to view all of the brand’s video content in their own time, and analytics help to observe what video content is the most effective. Brands can optimise their efforts by paying for promotion and sharing popular video content to attain greater awareness and exposure among consumers, as well as an improved transparency regarding sustainability issues [61]. Organisations can also use YouTube paid promotion as a cost-effective and fast way to promote topical video content. YouTube offers several types of marketing communication, namely display, overlay, in-search discovery, sponsored cards, video (skippable or non-skippable), and bumper [6,52,53]. The different advertising forms are collectively considered in this study to provide a complete overview of YouTube as a marketing communication platform.
YouTube marketing communication effectiveness can be evaluated via analytics based on click-through view rates, completed video views and/or number of shares, and comments and likes [36,51,53]. However, YouTube’s marketing communication impact can also be assessed via a variety of cues, such as advertisement recall, engagement, understanding and feedback [32], and/or through consumer reviews, which express sentiment towards marketing communication and have influence on the audience’s future purchase behaviour. However, a majority of academic inquiries assess YouTube marketing communication effectiveness via qualitative in-depth interviews [34,37,62], content analysis [7,14,21,36], and/or attitudinal surveys [15,16,19,20,22,23,26,28,29,35,39,40,41,42,43,44,63]. This study has adopted the latter approach, using a cross-sectional approach to assess Millennials’ affective Aad responses regarding YouTube marketing communication.

2.2. Millennial Cohort

Cohort theory postulates that divergent population segments can be separated into distinguishing generational groups based on events that have transpired over a certain time period when they were born. Consequently, each cohort displays homogeneous values; attitudes, interests, opinions (lifestyle); needs; behaviour; and consumption patterns due to analogous events; technology innovation and development; and experiences, which occurred over a particular time period [64,65]. Hence, cohort theory is important to organisations and their brands, as they provide an opportunity to adapt marketing communication strategies to appeal to each of the cohort’s precise characteristics, needs, and wants. The Millennial cohort comprises those born between 1982 and 2002, being of huge interest to organisations due to its members’ incremental growing spending power [2,3,66].
This cohort is the first generation to grow up with computers; Internet access; download music, movies, and videos; mobile communication; instant messaging and social media; and use an array of interactive mobile devices (iPods, tablets, and smartphones) in the digital era. Consequently, this omnipresent environment (and its interaction with Millennials) has been described as a driving force of online purchases and has the greatest social media penetration in comparison to all previous generational groups. Three quarters of the working population will be composed of Millennials by 2025, and this cohort already has significant spending power ($600 billion on an annual basis). Additionally, Millennials will represent 35% of global daily consumer spending by 2030 and are set to inherit $5 trillion from their parents [2,3,4,6,67]. Moreover, many of these individuals display a particular concern towards sustainability through their direct actions [61] or through their active involvement in collaborative consumption [5]. Considering these perspectives, together with the fact that over 80% of Millennials watch YouTube on a monthly basis, organisations cannot ignore this digital video sharing platform to target this very lucrative cohort. Nevertheless, Araújo et al. [7] disclosed that there was a dearth of research considering quantitative analysis of online video advertising among Millennials. Thus, further inquiry is necessary to understand this cohort’s affective (attitudinal) responses in terms of YouTube marketing communication, translated into the potential conversion of brand liking into preference.

2.3. Attitudes

Aad can be defined as a consumer’s predisposition after exposure to a marketing communication stimulus, which results in a tendency to behave in a consistently favourable or unfavourable way [10]. Academia and practitioners generally agree that sequences of response stages occur, known as response hierarchy models, which range from awareness of a stimulus (e.g., brand), knowledge, interest, positive sentiments, and ultimately climax in a purchase. Moreover, each response hierarchy stage should be accomplished prior to behaviour or purchase. Hence, organisations frequently use these stages as objectives, which are also used as measures to assess marketing communication effectiveness [11,12]. A number of advertising models were proposed to examine the different hierarchical stages, but these models were established via traditional advertising. The hierarchy-of-effects model considers three stages, namely cognitive responses (awareness and knowledge), affective responses (liking and preference), and behavioural responses (conviction and purchase) [11,12].

2.3.1. YouTube Affective Response Hypotheses

MacKenzie and Lutz [68] and Shavitt, Lowrey, and Haefner [69] found that entertaining advertisements resulted in favourable attitudes towards products. Statista noted that YouTube was primarily developed for entertainment and information purposes [70]. Chungviwatanant et al. [39] confirmed that entertainment (affective responses) had a large positive effect on consumer attitudes towards skippable in-stream advertising on YouTube but advocated that more research was required to ascertain other factors’ influence on the affective response. Zhang and Mao [44] stressed that consumers’ general dislikes or likes of social media advertising were transferred to their attitudes and behaviour towards social media display advertising via advertisement clicks. Additionally, Nalewajek and Macik [58] posited that attitudes towards responsible consumption could be changed based on behavioural changes induced by social media. Araújo et al. [7] found that YouTube videos containing advertising resulted in greater liking among Brazilians in comparison to Americans (US) and British (UK) but indicated that there was a lack of inquiry that quantitatively analysed online video advertising among young consumers in developing and developed economies. This study aims to enrich the literature by investigating the impact of YouTube marketing communication on the affective (attitudinal) responses, namely whether this online environment can influence the transformation of brand liking into preference. Thus, hypothesis H1a was formulated:
  • H1a. Brand liking has a positive effect on brand preference among Millennials due to YouTube marketing communication.
Additionally, the growth of social media channels such as YouTube has started to slow in many developed economies as they begin to reach saturation, while the number of social media users is rapidly growing in developing economies with the improvement of ICT infrastructure, and the incremental growth of mobile devices—over half of YouTube content is viewed via mobile devices [6,51,70,53]. In Reference [16], Balakrishnan and Manickavasagam concurred that many studies had considered social media advertising in Western countries such as the US and Europe, whereas similar studies should be conducted in developing economies due to fast penetration of social media in these countries. Edu, Lotter, Negricea and Avram [71] established that young and educated Romanians and South Africans exhibited similar budget allocation in terms of data and voice and communication. Hence, the choice of these two developing economies is justified, the discussion leading to the building of the following hypotheses:
  • H1b. Brand liking has a positive effect on brand preference among Millennials owing to YouTube marketing communication in a European economy (Romania).
  • H1c. Brand liking has a positive effect on brand preference among Millennials due to YouTube marketing communication in an African economy (South Africa).
Considering the Internet download speed country ranking compiled by Cable Co [72] within the top 200 countries, in the first place, Singapore can be found, followed by 11 European countries, with Romania being ranked the fifth, while the first African country is Madagascar on the 22nd place, followed by Kenya on the 64th and South Africa on the 76th place. Moreover, according to the International Telecommunication Union [73], the percentage of individuals using the Internet is significantly higher in Europe compared to Africa (77.2% versus 22.1%—values for 2017), while in Romania, it is higher than in South Africa (59.5% versus 54%—values for 2016), although a constant narrowing of the gap between the two countries has been noticed since 2012. Hence, seeing these differences in individual Internet usage and download speed, a discrepancy in the importance attributed by individuals from the two countries to YouTube as a marketing communication means can be expected, leading to the proposal of hypothesis H1d:
  • H1d. Brand liking has a significantly larger positive effect on brand preference on European Millennials (Romania) than on African Millennials (South Africa) due to YouTube marketing communication.

2.3.2. YouTube Usage Factors’ Hypotheses

A majority of studies only consider YouTube usage factors as descriptive statistics, and not as independent variables to explain affective (attitudinal) response measures. The most frequently stated YouTube usage factors include: Access devices, online videos viewing frequency, length of YouTube viewership time, subscription numbers, and YouTube video sharing [16,17,23,25,26,39,42,50,74]. Regarding studies employing YouTube usage variables as independent variables, Chungviwatanant et al. [39] uncovered that a higher attitude score about a skippable in-stream ad was recorded in the case of people watching YouTube videos between 1 and 4 hours per week and using smart TVs in comparison with desktops, laptops, smart phones, and tablets. Additionally, Balakrishnan and Manickavasagan [16] established that people watching YouTube for less than 1 hour and more than 3 hours had an unfavourable attitude towards YouTube advertising. Furthermore, the authors of [75,76] maintained that there was heterogeneity within the Millennial cohort, and Bolton et al. [3] agreed that further research should establish if there were significant differences within the Millennial cohort in terms of social media usage. Thus, in order to develop the literature, this inquiry considers several YouTube usage factors. Due to the little research on YouTube usage factors employed as independent variables to explain affective (attitudinal) responses owing to YouTube marketing communication, the study builds on Duffett’s research [77] by applying four usage factors (access; length of usage; log-on frequency; log-on duration) employed in the investigation of the impact of Facebook advertising on the South African Generation’s Y affective attitudes, while the fifth usage factor (number of advertisements viewed on YouTube) was developed based on literature.
The first usage factor, means of accessing, was selected to investigate whether differences in the conversion of brand liking into preference could be explained based on how YouTube was accessed by Romanian and South African Millennials assessed together, as well as separately. Thus, hypotheses H2a, H2b, and H2c were proposed:
  • H2a. The effect of brand liking on brand preference varies according to how Millennials access YouTube.
  • H2b. The effect of brand liking on brand preference varies according to how Millennials access YouTube in Romania.
  • H2c. The effect of brand liking on brand preference varies according to how Millennials access YouTube in South Africa.
The second usage factor, measuring the number of years of YouTube usage, was chosen to assess potential differences that might occur in the transformation of brand liking into preference considering the user experience with this online platform in both contexts, grouped Millennials and distinct per each country. Hence, hypotheses, H3a, H3b, and H3c were proposed:
  • H3a. The effect of brand liking on brand preference diverges owing to the number of years Millennials use YouTube.
  • H3b. The effect of brand liking on brand preference diverges owing to the number of years Millennials use YouTube in Romania.
  • H3c. The effect of brand liking on brand preference diverges owing to the number of years Millennials use YouTube in South Africa.
The third usage factor, YouTube log-on frequency, was picked to comprehend if the potential change of brand liking into preference could be influenced by the intensity with which YouTube is accessed, the appraisal being envisaged for the combined Millennial group and for both countries individually. Thus, hypotheses, H4a, H4b, and H4c were proposed:
  • H4a. The effect of brand liking on brand preference differs as a result of Millennials’ YouTube log-on frequency.
  • H4b. The effect of brand liking on brand preference differs as a result of Millennials’ YouTube log-on frequency in Romania.
  • H4c. The effect of brand liking on brand preference differs as a result of Millennials’ YouTube log-on frequency in South Africa.
The fourth usage factor, YouTube log-on duration, was retained to appraise whether the time spent on YouTube could impact on the conversion of brand liking into preference in the case of Millennials, in general, and in the case of the individual Romanian and South African ones, in particular. Thus, hypotheses H5a, H5b, and H5c were drafted:
  • H5a. The effect of brand liking on brand preference varies due to Millennials’ YouTube log-on duration.
  • H5b. The effect of brand liking on brand preference varies due to Millennials’ YouTube log-on duration in Romania.
  • H5c. The effect of brand liking on brand preference varies due to Millennials’ YouTube log-on duration in South Africa.
The fifth usage factor, number of advertisements viewed on YouTube, was developed based on the log-on frequency and duration factors and variables related to YouTube content, aiming to test if the change of brand liking into preference could be explained by the number of advertisements watched on YouTube by Romanian and South African Millennials evaluated together, as well as separately. Hence, hypotheses H6a, H6b, and H6c were formulated:
  • H6a. The effect of brand liking on brand preference differs as a result of the number of advertisements Millennials view on YouTube.
  • H6b. The effect of brand liking on brand preference differs as a result of the number of advertisements Millennials view on YouTube in Romania.
  • H6c. The effect of brand liking on brand preference differs as a result of the number of advertisements Millennials view on YouTube in South Africa.

2.3.3. YouTube Demographic Factors’ Hypotheses

As mentioned previously, a majority of studies only consider YouTube demographic factors as descriptive statistics and not as independent variables to explain affective (attitudinal) response measures. The most frequently stated YouTube demographic factors include: Age, gender, income, population group and education [7,17,19,20,23,25,29,32,35,37,42,44,63,74]. Balakrishnan and Manickavasagam [16] established that little was known about the association of usage patterns and demographic factors on attitudes towards social media marketing communication. However, in a broader analysis, Taylor et al. [78] uncovered that women considered social network advertisements to be more entertaining than men, while in a narrower inquiry, Chungviwatanant et al. [39] ascertained that male respondents displayed more positive attitudes to skippable in-stream YouTube advertising, whereas female respondents showed greater irritation to the YouTube advertisements. Furthermore, such divergent results in terms of the influence of gender on Aad regarding various forms of YouTube marketing communication can also be found in the works of Araujo et al. [7], Rodriguez [32], and Todd and Melancon [79]. Considering these divergent perspectives, in an attempt to shed more light into the potential impact of gender on the affective (attitudinal) responses induced by YouTube communication, this paper focuses on probing gender’s influence on the conversion of brand liking into preference for Romanian and South African Millennials assessed together, as well as separately, thus hypotheses H7a, H7b, and H7c being formulated:
  • H7a. The effect of brand liking on brand preference owing to YouTube marketing communication differs as a result of Millennials’ gender.
  • H7b. The effect of brand liking on brand preference owing to YouTube marketing communication differs as a result of Millennials’ gender in Romania.
  • H7c. The effect of brand liking on brand preference owing to YouTube marketing communication differs as a result of Millennials’ gender in South Africa.
IGI [75] and Zambodla [76] maintained that Millennials should not be treated as a single target market segment, since younger members being in different life stages compared to the oldest cohort members prompted a different life outlook. Regarding young people, Taylor et al. [78], investigating three age groups (15–18 years old; 19–24 years old; 25+ years old), uncovered that individuals aged 19 to 24 appraised social network advertisements to be more informative compared to the other two age groups, with the authors inferring, based on the findings, more positive attitudes for such advertisements from this age group. Balakrishnan and Manickavasagan [16], investigating several age groups, concluded that respondents between 20 and 30 years old and those between 41 and 50 years old had a favourable attitude towards YouTube advertising. Although some evidence exists regarding the relationship between age and attitude towards social network advertising, there is a dearth of research on the impact of age on the affective (attitudinal) responses based on YouTube communication. To address this research gap, the present study, expanding on Duffett’s research [77] on the impact of Facebook advertising on the South African Generation’s Y affective attitudes, assesses three age groups (18–22 years old; 23–27 years old; 28–32 years old) as different outcomes are expected across age groups [78] because of the heterogeneity uncovered in the Millennial cohort [75,76].
Therefore, the following hypotheses are considered to reduce the aforementioned research gaps:
  • H8a. The effect of brand liking on brand preference due to YouTube marketing communication varies owing to Millennials’ age.
  • H8b. The effect of brand liking on brand preference due to YouTube marketing communication varies owing to Millennials’ age in Romania.
  • H8c. The effect of brand liking on brand preference due to YouTube marketing communication varies owing to Millennials’ age in South Africa.

2.4. Research Methods

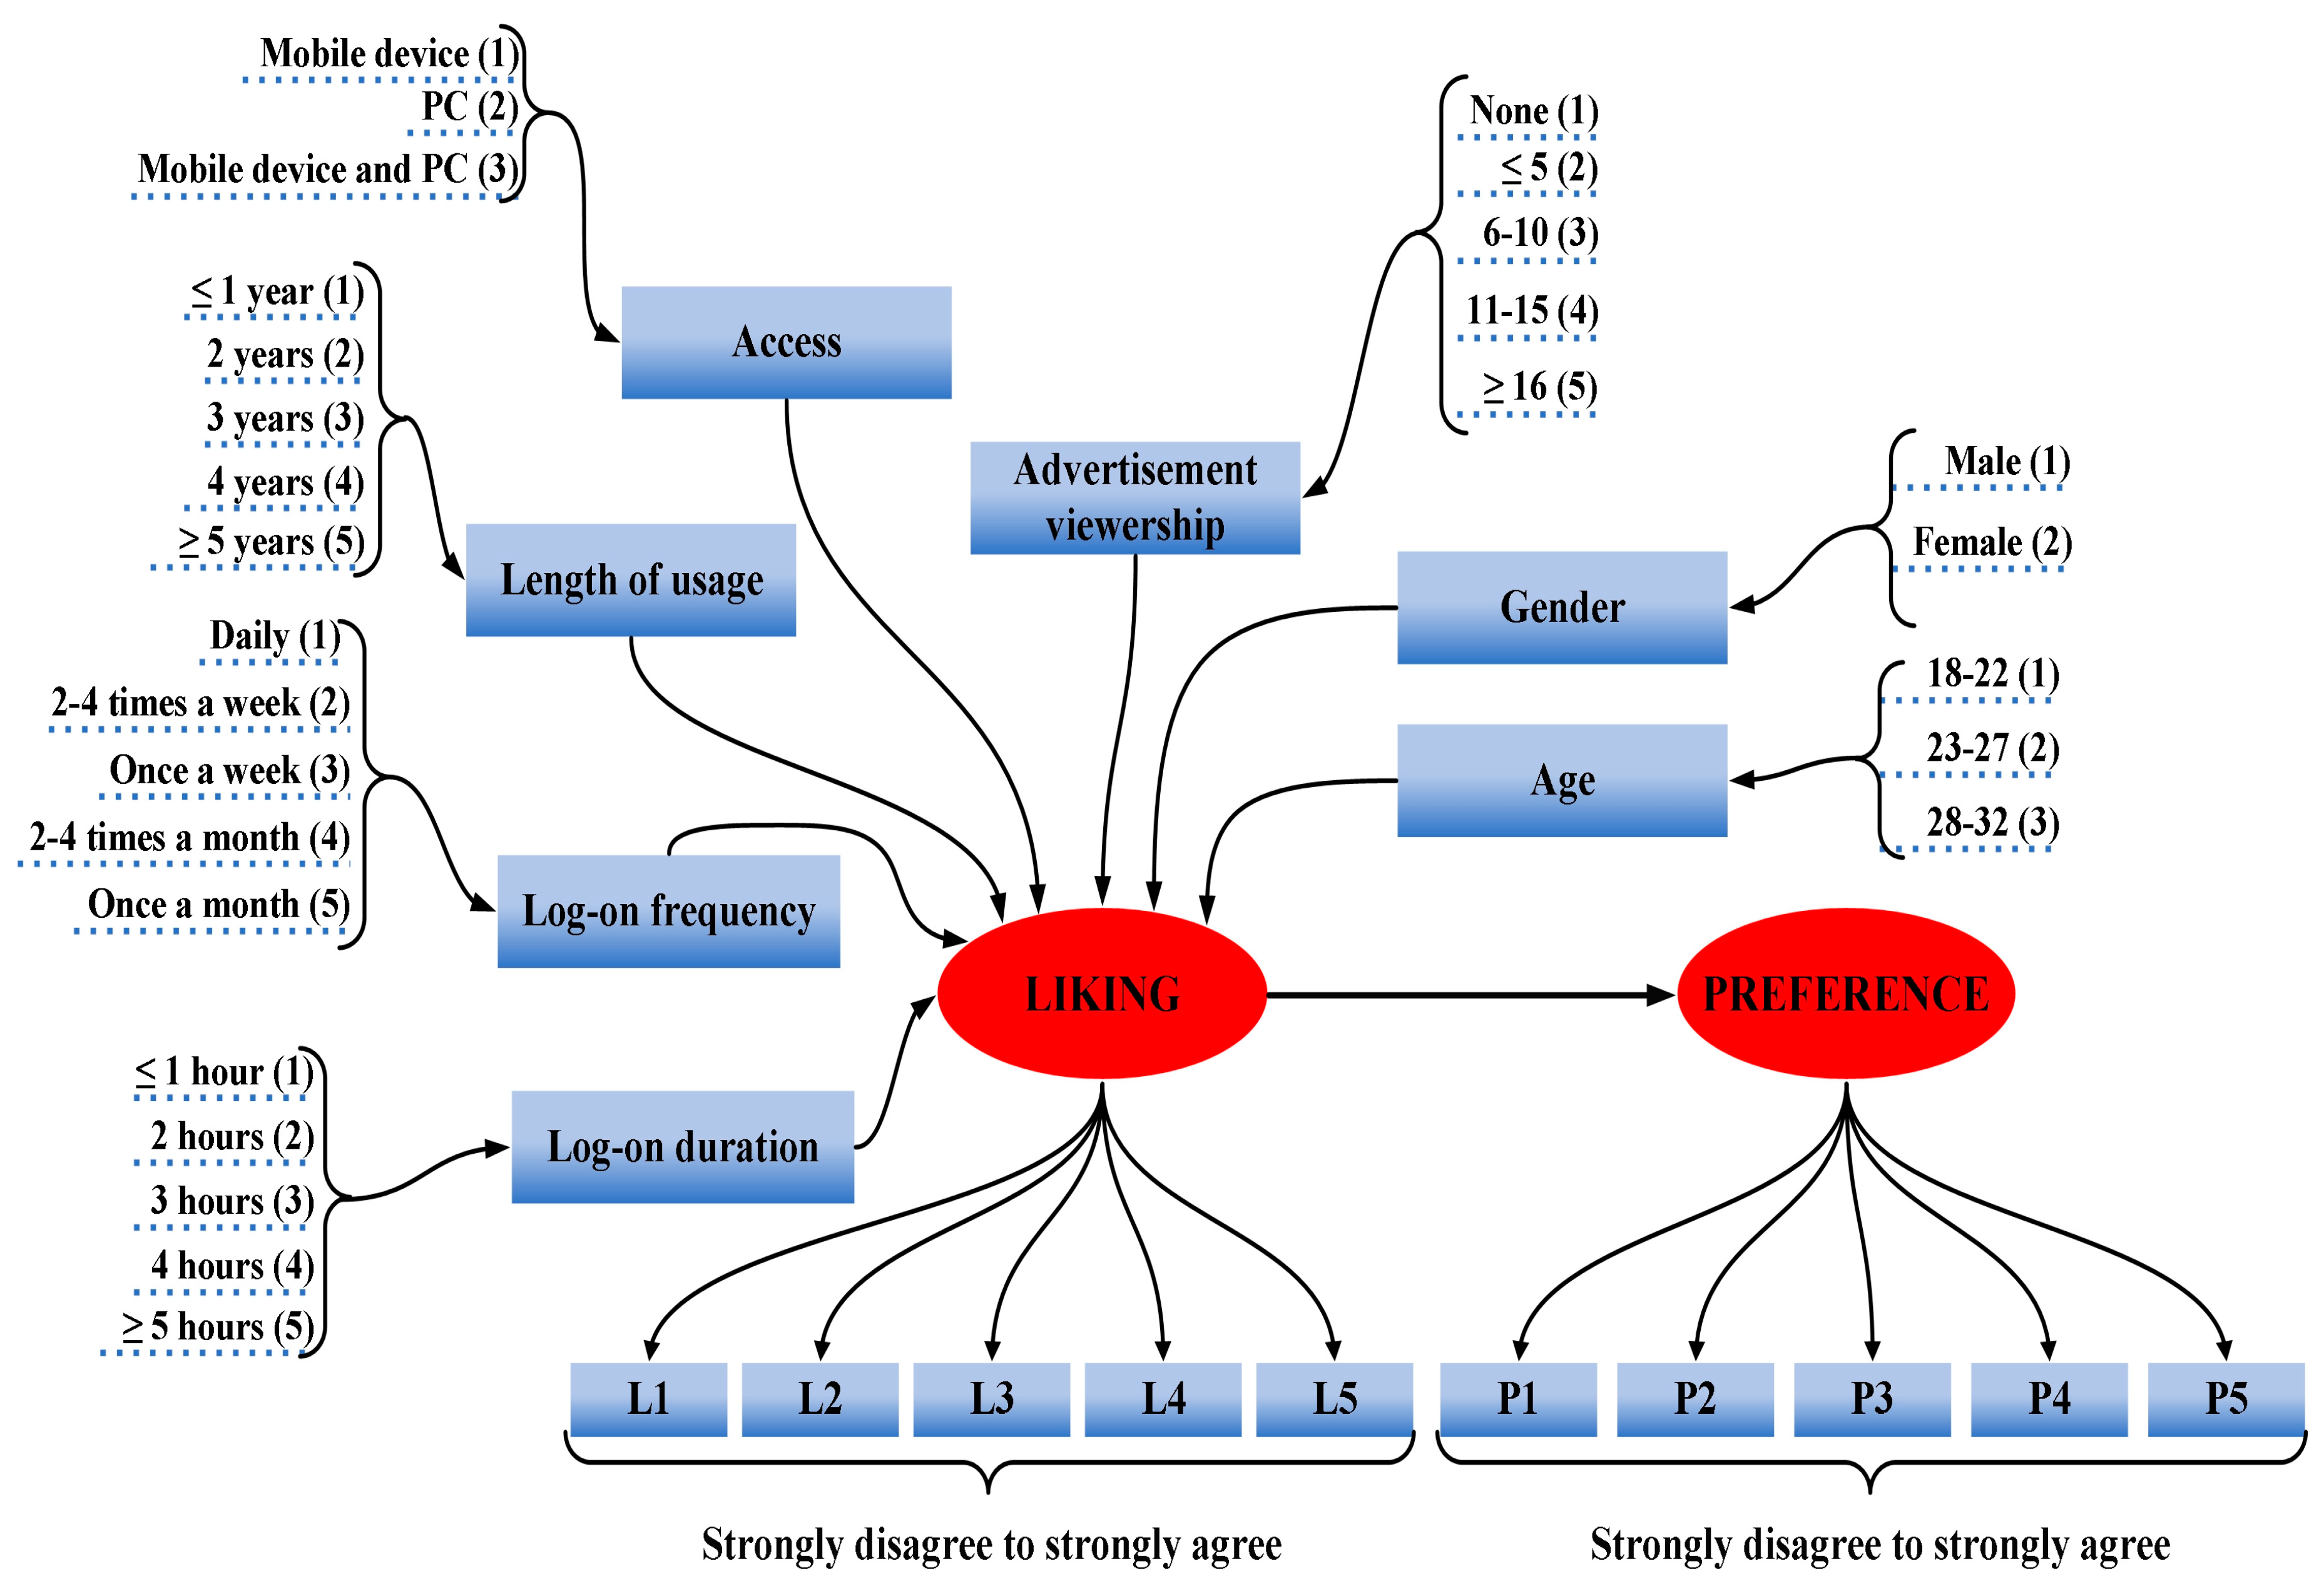
2.4.1. Variable Measurements

The research instrument was adapted from Duffett [77]. Thus, a self-administered questionnaire, comprising three main sections, was developed. The opening section collected data via one nominal and four ordinal scales, assessing in terms of Millennials’ YouTube usage the following factors (independent variables): How the video sharing platform was accessed (with three options: Mobile device; PC; mobile device and PC); the number of years that YouTube was used (with five options: ≤1 Year; 2 Years; 3 Years; 4 Years; ≥5 Years); frequency of log-on (with five options: Daily; 2–4 times a week; once a week; 2–4 times a month; once a month); duration spent per log-on (with five options: ≤1 Hour; 2 Hours; 3 Hours; 4 Hours; ≥5 Hours); and the number of advertisements viewed per log-on (with five options: None; ≤5; 6–10; 11–15; ≥16). The next section comprised the affective (attitudinal) measures, namely two five-item constructs for “liking” and “preference”. These affective (attitudinal) response measures were evaluated via five-point verbal Likert scales, which ranged from “strongly disagree” to “strongly agree”. The final section gathered data on the Millennial respondents’ demographic factors through one nominal scale for gender and one ordinal scale for age (with three options: 18–22 years old; 23–27 years old; 28–32 years old).
The questionnaire was drafted in English and translated in Romanian to ensure wording consistency [80]. Moreover, all scale options were easily retained for the Romanian sample and an exact translation was possible for all of them. Additionally, according to Babakus et al. [81], the five-point verbal Likert scales employed to inquire about the affective (attitudinal) response measures, inserted in the questionnaire through displaying all scale options, are an adequate solution to improve the quantity and quality of the collected data. Both versions of the questionnaire (English and Romanian) were piloted using 20 Millennial respondents from each country [80]. For Romania, the scale options were displayed in Romanian and English, the respondents being asked whether they observed word inconsistencies. Considering that no observations or recommendations were made regarding the questionnaire, a compatibility between the English and Romanian versions was assumed. Furthermore, considering the scale option number and wording compatibility, one can conclude that the two questionnaire versions can be deemed homogeneous according to de Jonge et al. [82], and, hence, suitable for a cross-country comparison.
Based on the formulated hypotheses and defined variable measurements, the conceptual model was built. Figure 1 presents the conceptual model of the proposed approach.

2.4.2. Sampling and Collection of Data

The research population included Romanian and South African Millennials (aged 18–32 years old), who had previously used YouTube and had perceived YouTube marketing communication. A sequential (also known as multistage) sampling technique was used to sample 800 Millennial respondents (400 in Romania and 400 in South Africa). Quota sampling was firstly used to secure a representative sample, in terms of gender and age, among South Africans and Romanians [83,84]. Next, only Millennial respondents were requested to voluntarily partake in the survey [19]. The questionnaires were distributed via online and paper means to collect the data and were self-administered, which allowed the respondents to be surveyed without assistance. Online data collection was used in Romania, whereas a face-to-face paper questionnaire was distributed, via snowball sampling, in South Africa, owing to the poor response rate of online studies in this country [15,85]. All responses were treated as confidential and the survey was completely anonymous, since no personal or contact particulars were requested. Informed consent was obtained from all Millennial respondents who participated in the research.

2.4.3. Data Analysis

Confirmatory factor analysis using SPSS and Amos was employed to establish reliability and convergent and divergent validity. Furthermore, Structural equation modelling (SEM) was used to assess the hypothesised association between the liking and preference measures, owing to YouTube marketing communication for the combined and Romanian and South African samples. Multigroup SEM was used to test the effect of the country, usage, and demographic factors of the abovementioned hypothesised associations. The path coefficients for liking and preference attitudinal responses, as a result of YouTube marketing communication, were used to establish if there was significance for each of the combined, Romanian, and South African samples. The country, usage, and demographic factors for the combined sample, Romanian, and South African path coefficients were assessed via multigroup SEM to ascertain if they were significant, assessing the measurement model prior to the factors’ impact evaluation [86].

3. Results

3.1. Usage and Demographic Factors

The sample comprised 800 Millennials living in Romania and South Africa, who were representative of gender and age in these developing economies [83,84]. Table 1 provides a complete overview of the usage and demographic factors of Millennial respondents for the combined, Romanian, and South African samples. One can find in the Supplementary Materials, comprehensive details, namely the document “YouTube Affective–Descriptive Statistics and Central Tendency”, containing the tables exported from the IBM SPSS Statistics Software, comprising the affective–descriptive statistics and the central tendency for the variables used in the study, the designed questionnaire used for collecting the data and the Sheet “Dataset” of the “The Centralised Dataset” Excel Workbook, containing the whole database.

3.2. Confirmatory Factor Analysis and Structural Equation Models and Hypothesis Testing
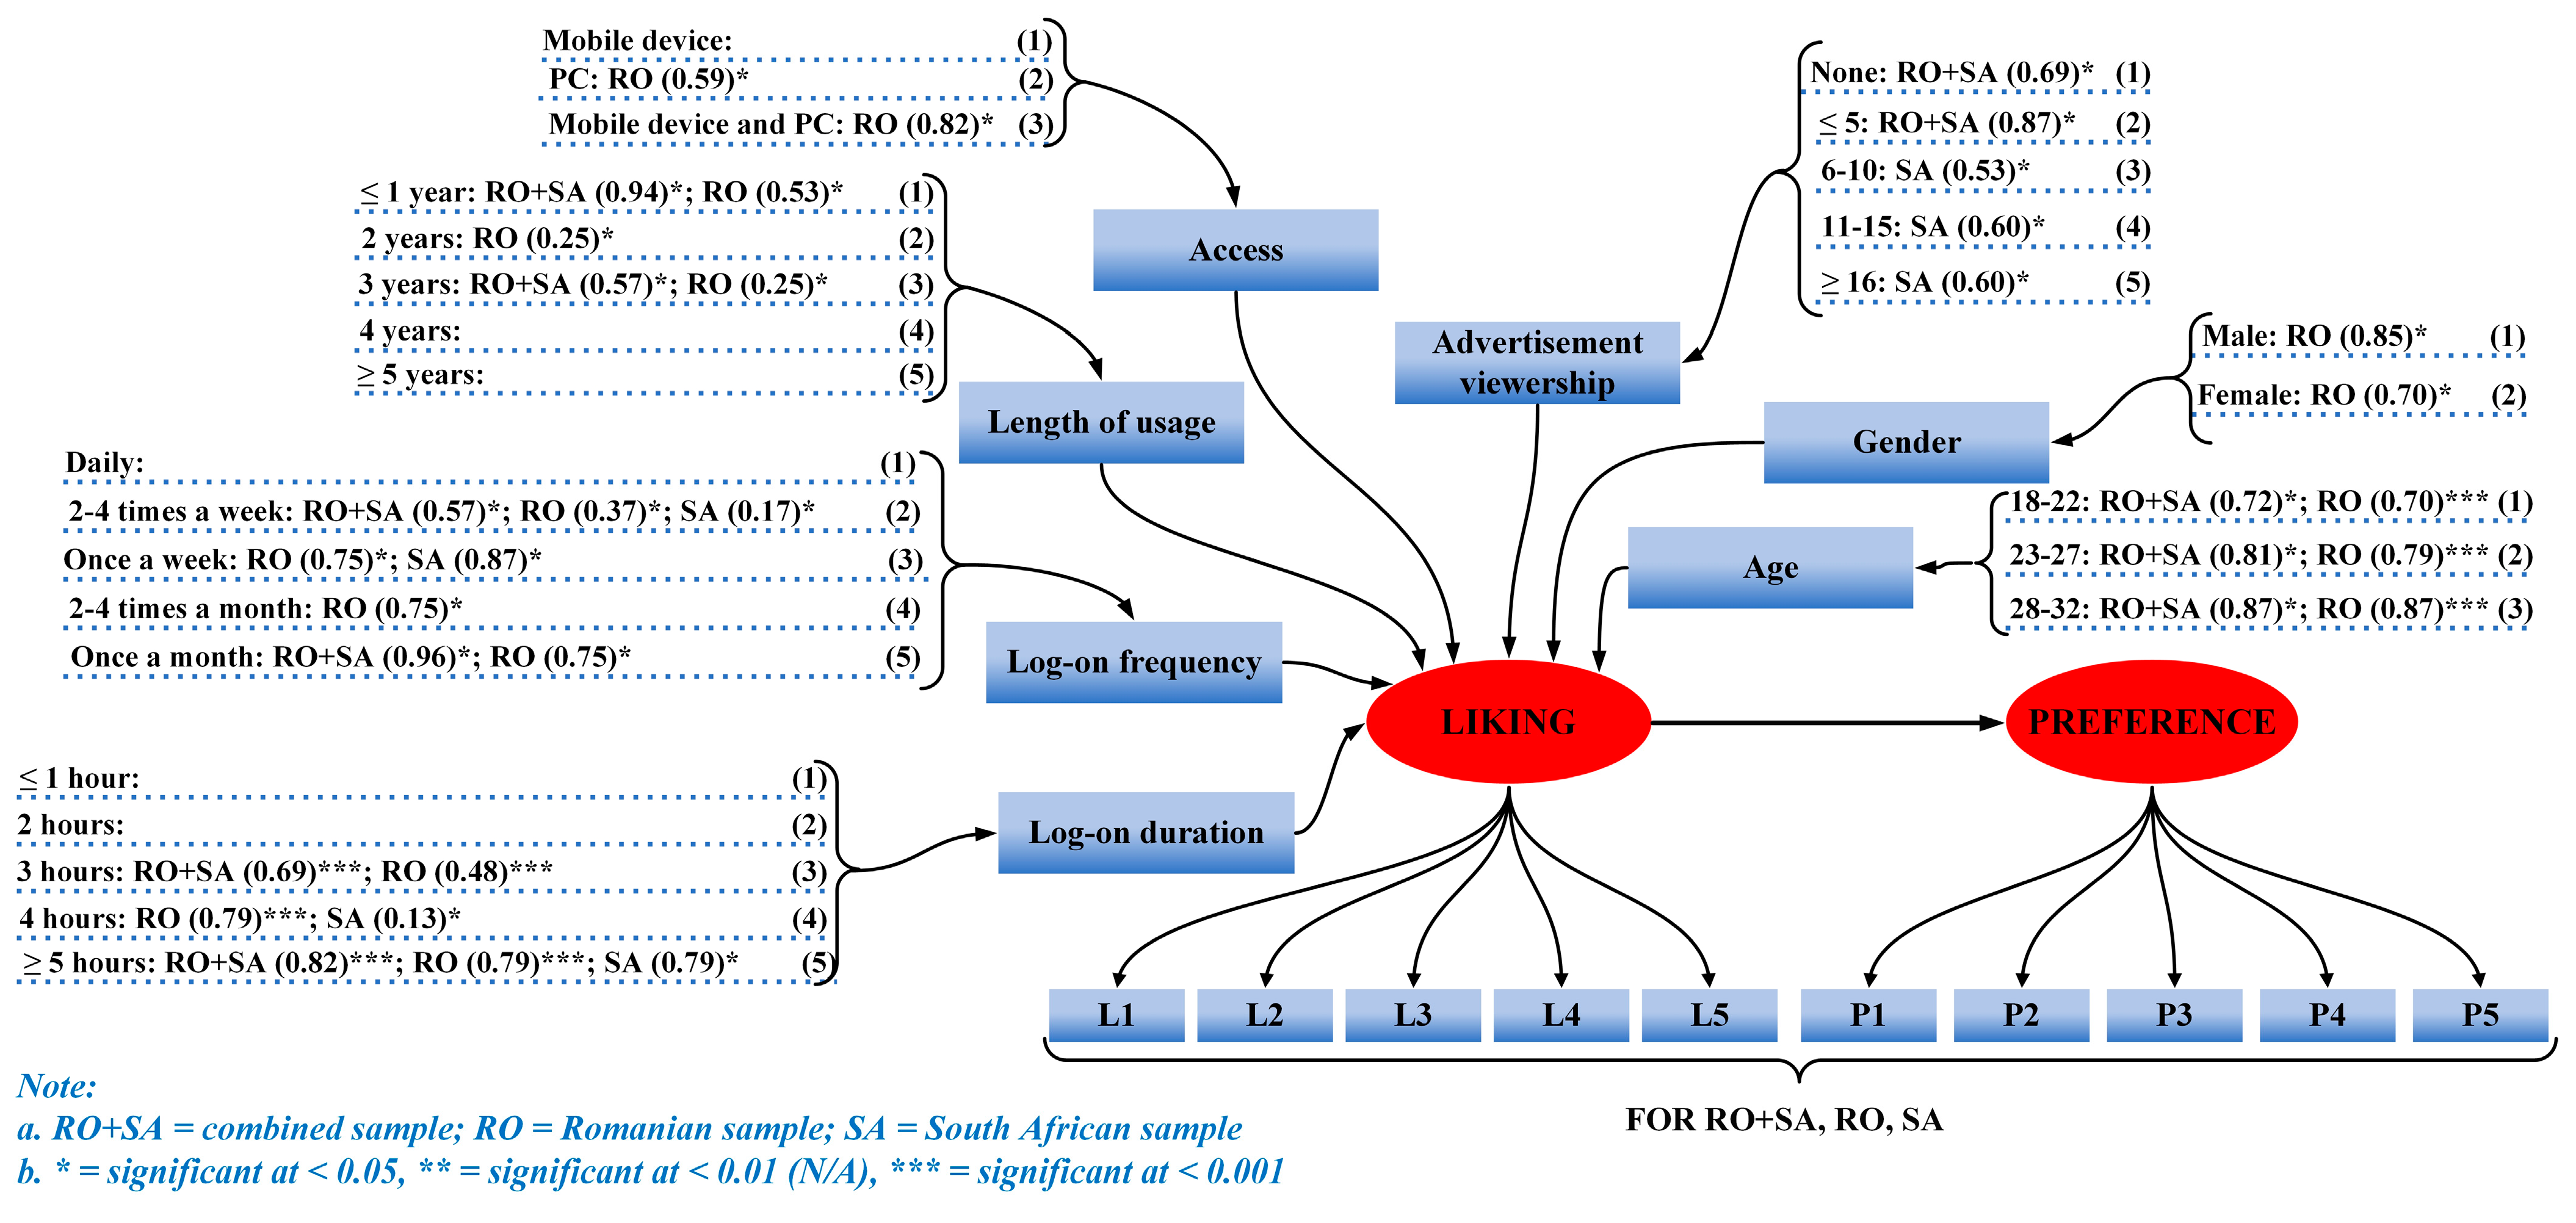
Using confirmatory factor analysis, the affective (attitudinal) response measures’ factor loadings, average variance extracted (AVE), Cronbach’s alpha (α), and composite reliability (CR) are displayed in Table 2.
The Cronbach’s α and CR reliability assessment values for the combined, Romanian, and South African samples were over 0.7 and 0.8, respectively, which is suggestive of acceptable reliability [87]. The liking and preference attitude factor loadings ranged from 0.511 to 0.958, and AVE values ranged from 0.508 to 0.793 for the combined, Romanian, and South African samples, which is indicative of convergent validity, since the values are over 0.5 [87]. The AVE square root values of the combined (0.836 and 0.822), Romanian (0.891 and 0.860), and South African (0.734 and 0.713) samples for liking and preference attitude constructs were larger than the correlation between the constructs for the combined (0.655), Romanian (0.672), and South African (0.430) samples, thereby indicative of discriminant validity [88].
The SEM goodness-of-fit measures and path coefficients, in the testing of the hypotheses, are considered below (Table 3).
The influences of YouTube usage characteristics and demographic factors on the affective (attitudinal) association were assessed using standardised coefficients. The results are presented in Figure 2 and Table 4.
Analysing the results depicted in Table 3 and Table 4, the following findings have been drawn:
  • H1: Likingpreference. The goodness-of-fit measures produced very good statistics, according to Hooper, Coughlan, and Mullen, as presented in Reference [89], goodness-of-fit threshold standards regarding SEM models, for the combined sample (χ2/df = 0.365; RMSEA = 0.000; NFI = 0.999; TLI = 1.000; CFI = 1.000; GFI = 0.999; and SRMR = 0.004), Romanian sample (χ2/df = 0.456; RMSEA = 0.000; NFI = 0.999; TLI = 1.000; CFI = 1.000; GFI = 0.997; and SRMR = 0.008), and South African sample (χ2/df = 0.218; RMSEA = 0.000; NFI = 0.998; TLI = 1.000; CFI = 1.000; GFI = 0.999; and SRMR = 0.084). The path coefficients showed that liking had a significantly favourable effect on preference owing to YouTube marketing communication among Millennials in all of the abovementioned scenarios, namely the combined sample (β = 0.80, p < 0.001), Romanian (β = 0.77, p < 0.001), and South African samples (β = 0.64, p < 0.001). The multigroup SEM goodness-of-fit measures were acceptable regarding the association between Romania and South Africa (χ2/df = 1.446; RMSEA = 0.024; NFI = 0.992; TLI = 0.992; CFI = 0.998; GFI = 0.990; and SRMR = 0.034). The comparison between Romania and South Africa showed a significantly larger favourable influence on preference in Romania (β = 0.75, p < 0.05) than in South Africa (β = 0.66, p < 0.05). Hence, H1a, H1b, H1c, and H1d were supported (Table 3). Additionally, the preference variance was explained by liking among Millennials owing to YouTube marketing communication in a large proportion in all scenarios, 64% for the combined sample (R2 = 0.64); 59% for the Romanian sample (R2 = 0.59); 41% for the South African sample (R2 = 0.41); and 56% for the Romanian sample (R2 = 0.56) versus 44% for the South African sample (R2 = 0.44) in the comparison between the two developing economies.
  • H2: Access—Likingpreference. The goodness-of-fit measures produced very good statistics for the Romanian sample (χ2/df = 1.634; RMSEA = 0.042; TLI = 0.977; NFI = 0.985; GFI = 0.971; CFI = 0.994, and SRMR = 0.034). The path coefficients indicated that liking had a significantly stronger positive effect on preference when Romanian Millennial respondents accessed YouTube via mobile devices and PC (β = 0.82, p < 0.05) compared to PC (β = 0.59, p < 0.05); thus, hypothesis H2b was supported. However, in terms of the combined and South African samples, the path coefficient revealed that liking did not have an effect on preference as a result of how Millennials accessed YouTube; therefore, hypotheses H2a and H2c were not supported (Table 3).
  • H3: Length of usage—Likingpreference. The goodness-of-fit measures produced acceptable statistics for the combined sample (χ2/df = 2.234; RMSEA = 0.039; TLI = 0.944; NFI = 0.977; GFI = 0.962; CFI = 0.987, and SRMR = 0.043) and Romanian sample (χ2/df = 2.122; RMSEA = 0.053; TLI = 0.965; NFI = 0.982; GFI = 0.962; CFI = 0.990, and SRMR = 0.048). The path coefficient indicated that liking had a significantly stronger positive effect on preference among Millennial respondents who used YouTube for 1 year or less (β = 0.94, p < 0.05) compared to those who used YouTube for 3 years (β = 0.57, p < 0.05) in the combined sample; and for 1 year or less (β = 0.53, p < 0.05) compared to those Romanian Millennials who used YouTube for 2 years (β = 0.25, p < 0.05) and 3 years (β = 0.25, p < 0.05), which supports hypotheses H3a and H3b. However, the path coefficient showed that liking did not have an effect on preference as a result of the number of years South African Millennial respondents had used YouTube; consequently, H3c was not supported (Table 3).
  • H4: Log-on frequency—Likingpreference. The goodness-of-fit measures produced adequate statistics for the combined sample (χ2/df = 1.137; RMSEA = 0.021; TLI = 0.985; NFI = 0.987; GFI = 0.982; CFI = 0.996, and SRMR = 0.074), Romanian (χ2/df = 2.519; RMSEA = 0.062; TLI = 0.951; NFI = 0.968; GFI = 0.942; CFI = 0.980, and SRMR = 0.020), and South African samples (χ2/df = 1.167; RMSEA = 0.021; TLI = 0.985; NFI = 0.987; GFI = 0.982; CFI = 0.996, and SRMR = 0.062). The path coefficient indicated that liking had a significantly greater positive effect on preference for Millennial respondents who logged on to YouTube once a month (β = 0.96, p < 0.05) than those who logged on to YouTube 2–4 times a week (β = 0.57, p < 0.05). in the combined sample and for South African Millennials who logged on to YouTube once a week (β = 0.87, p < 0.05) in comparison to those ones who logged on to YouTube 2–4 times a week (β = 0.17, p < 0.05). For the Romanian sample, the path coefficient indicated that liking had a significantly greater positive effect on preference among Romanian Millennial respondents who logged on to YouTube once a week (β = 0.75, p < 0.05), 2–4 times a month (β = 0.75, p < 0.05), and once a month (β = 0.75, p < 0.05) compared to those who logged on to 2–4 times a week (β = 0.37, p < 0.05), which supported hypotheses H4a, H4b, and H4c (Table 3).
  • H5: Log-on duration—Likingpreference. The goodness-of-fit measures produced satisfactory statistics for the combined sample (χ2/df = 2.111; RMSEA = 0.037; TLI = 0.953; NFI = 0.980; GFI = 0.989; CFI = 0.989, and SRMR = 0.015), Romanian (χ2/df = 3.305; RMSEA = 0.076; TLI = 0.909; NFI = 0.964; GFI = 0.930; CFI = 0.974, and SRMR = 0.036), and South African samples (χ2/df = 1.272; RMSEA = 0.026; TLI = 0.949; NFI = 0.954; GFI = 0.972; CFI = 0.988, and SRMR = 0.025). The path coefficient revealed that liking had a significantly larger positive effect on preference among Millennial respondents who spent 5 hours or longer (β = 0.82, p < 0.001) logged on to YouTube than those who spent 3 hours (β = 0.69, p < 0.001) logged on to YouTube on the combined sample; for Romanian Millennial respondents who spent 4 hours (β = 0.79, p < 0.001) and 5 hours (β = 0.79, p < 0.001) or longer logged on to YouTube compared to those who spent 3 hours (β = 0.48, p < 0.001) logged on to YouTube; and for 5 hours or longer logged on to YouTube (β = 0.79, p < 0.05) compared to those who spent 4 hours logged on to YouTube (β = 0.13, p < 0.05) for South African Millennials, which supported hypotheses H5a, H5b, and H5c (Table 3).
  • H6: Advertisement viewership—Likingpreference. The goodness-of-fit measures produced very good statistics for the combined sample (χ2/df = 1.848; RMSEA = 0.033; TLI = 0.961; NFI = 0.981; GFI = 0.977; CFI = 0.991, and SRMR = 0.033), and South African sample (χ2/df = 0.787; RMSEA = 0.001; TLI = 1.000; NFI = 0.974; GFI = 0.985; CFI = 1.000, and SRMR = 0.033). The path coefficient showed that liking had a significantly larger positive effect on preference by Millennialrespondents who watched 1–5 YouTube advertisements (β = 0.87, p < 0.05) compared to those who watched no YouTube advertisements (β = 0.69, p < 0.05) in the combined sample; and for South African Millennial respondents who watched 11–15 (β = 0.60, p < 0.05) and 16 or more (β = 0.60, p < 0.05) YouTube advertisements versus those who watched 6–10 (β = 0.53, p < 0.05) YouTube advertisements, which supported hypotheses H6a and H6c. However, the path coefficient showed that liking did not have an effect on preference due to the number of advertisements viewed on YouTube by Romanian Millennial respondents; therefore, H6b was not supported (Table 3).
  • H7: Gender—Likingpreference. The goodness-of-fit measures produced reasonable statistics for the Romanian sample (χ2/df = 2.844; RMSEA = 0.068; TLI = 0.958; NFI = 0.977; GFI = 0.958; CFI = 0.985, and SRMR = 0.035). The path coefficient revealed that liking had a significantly stronger positive effect on preference when Romanian Millennial male respondents (β = 0.85, p < 0.05) accessed YouTube compared to female respondents (β = 0.70, p < 0.05), which supported H7b. However, the path coefficients showed that liking did not have a positive impact on preference based on gender as a result of YouTube marketing communication for the combined and South African samples. Hence, hypotheses H7a and H7c were not supported (Table 3).
  • H8: Age—Likingpreference. The goodness-of-fit measures produced acceptable statistics for the combined sample (χ2/df = 1.910; RMSEA = 0.034; TLI = 0.977; NFI = 0.985; GFI = 0.979; CFI = 0.992, and SRMR = 0.032) and Romanian sample (χ2/df = 2.842; RMSEA = 0.068; TLI = 0.939; NFI = 0.970; GFI = 0.945; CFI = 0.980, and SRMR = 0.062). The path coefficient indicated that liking had a significantly stronger positive effect on preference by Millennial respondents who were aged 28–32 years (combined sample β = 0.87, p < 0.05; Romanian sample β = 0.87, p < 0.001) versus those aged 18–22 years (combined sample β = 0.72, p < 0.05; Romanian sample β = 0.70, p < 0.001) and 23–27 years (combined sample β = 0.81, p < 0.05; Romanian sample β = 0.79, p < 0.001), which supported hypotheses H8a and H8b. However, the path coefficient revealed that liking did not have an effect on preference owing to the age of South African Millennial respondents due to YouTube marketing communication; therefore, H8c was not supported (Table 3).
For a deeper understanding of the demographic variables’ impact on the two affective (attitudinal) responses, a generalised linear model (GLM) analysis of variance (ANOVA) was used to explore further the influence of the employed demographic characteristics (gender and age) on liking and preference. The post ad hoc Bonferroni pairwise comparison was used to locate the significant differences for liking and preference regarding gender and age [77] (Table 5).
Considering gender (p < 0.05, Table 5), Millennial male respondents (M = 2.88, SE = 0.0.64) displayed lower liking levels compared to female respondents (M = 3.37, SE = 0.058) in the combined sample as a result of YouTube marketing communication, whereas no significant difference was found for preference. South African Millennial male respondents (M = 3.10, SE = 0.067) exhibited lower preference levels compared to South African female respondents owing to YouTube marketing communication (M = 3.28, SE = 0.062), whereas no significant difference was found for liking. Romanian Millennial male respondents (M = 2.49, SE = 0.136) showed lower liking levels in comparison to Romanian female respondents (M = 2.76, SE = 0.133), whereas no significant difference was found for preference. These findings are interesting at least from two perspectives. Firstly, in all three cases (combined, Romanian, and South African samples), significant differences were found only in one affective response. Thus, in all three cases, male respondents displayed lower levels than females but regarding liking for the combined and Romanian samples, and preference for the South African sample. Secondly, the findings for the Romanian sample are opposite to the ones prompted by the structural equation model regarding the category, as the GLM analysis prompted that female respondents displayed higher levels of liking due to YouTube marketing communication, while the SEM one showed that the effect of liking on preference was stronger in the case of male respondents. Although significant differences were delivered by the GLM analysis, due to the fact that in none of the samples such differences were rendered by gender in both affective responses (liking and preferences), it cannot be concluded that gender would impact significantly on the conversion of brand liking into preference. Thus, the GLM findings do not reinforce the SEM results for the Romanian sample. However, the output comparison of the two statistical methods should be treated with caution, as the GLM one was used to uncover significant differences induced by gender in each affective category, while the SEM analysis was employed to uncover whether the effect of brand liking on brand preference due to YouTube marketing communication differed based on gender.
Evaluating age (p < 0.05, Table 5), YouTube Millennial users who were aged 28–32 years (M = 2.88, SE = 0.0.73) displayed higher preference levels compared to those aged 23–27 years (M = 2.71, SE = 0.0.67) for the combined sample as a result of YouTube marketing communication, whereas no significant difference was found for liking. No significant differences were found for liking and preference considering South African Millennial respondents’ age owing to YouTube marketing communication. Romanian Millennial respondents aged 28–32 years showed higher liking (M = 2.67, SE = 0.150) and preference (M = 2.60, SE = 0.162) levels compared to those aged 23–27 years (M = 2.44, SE = 0.137 and M = 2.29, SE = 0.149) due to YouTube marketing communication. These findings reinforce the results prompted by the SEM analysis for the South African and Romanian samples. For the South African sample, no significant differences were prompted by age, while for the Romanian one, significant differences were rendered by age in both affective responses, the 28–32 age group displaying higher levels of liking and preference compared to the 23–27 one. Thus, based on the result consistency for the Romanian sample in both affective categories, it can be concluded that age could explain the conversion of brand liking into brand preference. For the combined sample, the GLM findings partially reinforce the SEM-prompted ones as, again, the oldest group (28–32) displayed higher levels compared to the 23–27 group, but only for preference. Due to a lack of consistency in the results for both affective categories, the two statistical methods provided similar findings only for the age category, the matching of findings not rendering the same weight as for the Romanian and South African samples.

4. Discussion and Implications

4.1. Key Findings

The findings revealed that brand liking had a positive effect on brand preference for the combined, Romanian, and South African samples due to YouTube marketing communication, supporting the affective (attitudinal) association that was posited via response hierarchy models in terms of the traditional advertising. However, Romanian Millennials showed a more positive influence on the affective (attitudinal) association than the South African generational group, which indicates heterogeneity within the Millennial cohort. A reason for this finding could be attributed to the rapid ICT infrastructure development in Romania over the last decade, which has resulted in the fourth fastest broadband speed in the world, whereas South Africa’s ICT infrastructure development has lagged behind several other African economies [48,90]. Other authors [19,23,28,39,42,43,44] revealed that entertainment had a positive effect on consumer attitudes as a result of various forms of YouTube marketing communication. Expanding on this thought, Langley and van den Broek [91] exemplified that individuals would watch funny videos, consume products presented in the uploaded videos but will also lobby for sustainability improvements from the respective brands. However, this inquiry is one of the first studies that confirmed a favourable association between brand liking and brand preference due to YouTube marketing communication and has thus added to the Aad conceptual framework and cohort analysis in developing economies.
This research determined that PC and mobile devices resulted in greater positive influence on the abovementioned affective (attitudinal) association than PC only access owing to YouTube marketing communication among Romanian Millennials. The proliferation of mobile devices (particular smartphones) has resulted in the growth of social media, especially in developing economies. More than half of Millennial consumers use mobile devices to access YouTube; consequently, it is rational that the ubiquitous mobile devices have a positive influence on affective (attitudinal) responses [6,51,53,92]. However, the findings do not concur with the results of Chungviwatanant et al. [39], as they uncovered that a higher attitude score about a skippable in-stream ad was recorded in the case of people watching YouTube videos using smart TVs in comparison with desktops, laptops, smart phones, and tablets.
New Millennial YouTube users exhibited a greater positive effect on the affective (attitudinal) association than Millennials with more experience for the combined and Romanian samples. It is evident from the research that Millennials who had used YouTube for a greater number of years became habituated to marketing communication, whereas new users were more susceptible to commercial content. Sago [93] and Duffett [94] also established that the level of experience on the Internet and social media had an influence on consumer decisions and attitudes, while Roy [5] uncovered that frequent social media users would tend to display green product buying intentions at a higher rate than occasional users.
This study ascertained that lower Millennial log-on frequencies resulted in more positive affective (attitudinal) responses due to YouTube marketing communication for the combined, Romanian, and South African samples, which is in agreement with the findings of Duffett’s research [77] on social media Millennial consumers. Conversely, Westenberg [37] established that young Dutch YouTube users logged on daily, a favourable influence being displayed on their behaviour responses due to celebrity endorsers. Wang [35] agreed that active YouTube users exhibited more positive attitudes than passive users. As discussed previously, it is evident that Millennials, who logged on to YouTube more frequently, may ignore marketing communication, since they may have become too accustomed to this form of advertising.
The results indicated that Millennials who logged on for longer periods of time displayed a greater positive effect on affective (attitudinal) association than those who spent less time for the combined, Romanian, and South African samples as a result of YouTube marketing communication. These findings are in congruence with the results of Duffett’s studies [77,94] on different social media platforms. Conversely, Chungviwatanant et al. [39] established that respondents who spent less time per week viewing skippable in-stream advertising on YouTube displayed more positive consumer attitudes. Additionally, Balakrishnan and Manickavasagam [16] revealed that YouTube users who spent less than 1 hour and more than 3 hours displayed the greatest negative attitudes towards YouTube advertising. However, Li and Lo [27] established that the amount of time users spent watching online video advertisements increased brand recognition and the effectiveness of the message, but none of the abovementioned studies considered the effect of liking on preference.
The findings ascertained that Millennials who watched a greater number of YouTube advertisements displayed more favourable affective (attitudinal) responses for the combined and South African samples. This is a logical finding, since a higher number of advertisements watched would be indicative of a positive predisposition to the brands featured on YouTube. In Reference [95], Marthinus et al. did not find any significant difference in terms of the number of YouTube advertisements watched, but the study was conducted among high school students (Generation Z). On the other hand, there is a lack of inquiry on the affective (attitudinal) association regarding the number of advertisements watched on YouTube.
This study determined that males exhibited a greater positive influence on the affective (attitudinal) association than females owing to YouTube marketing communication among Romanian Millennials. Moreover, additional investigations on the influence of gender on each of the two affective responses indicated opposite significant differences, with females displaying higher levels than males but for only one category (namely, liking for the combined and Romanian samples, and preference for the South African one), thus not displaying consistency in both liking and preference. These divergent findings, rendered by two different statistical methods and between the two affective responses, reinforce the contradictions found in the literature about the impact of gender on attitude formation based on YouTube marketing communication. Rodriguez [32] found that gender did not have significant relationships with engagement cues and memorable YouTube advertising preferences. Todd and Melancon [79] established various differences between male and female respondents when they viewed live-stream broadcasters on digital video ICT platforms such as YouTube. Furthermore, Chungviwatanant et al. [39] established that male consumers showed more favourable attitudes to skippable in-stream advertising on YouTube, which is in agreement with a part of the findings of this study.
The inquiry found that older Millennials exhibited a more positive influence on the affective (attitudinal) association in comparison to younger Millennials as a result of YouTube marketing communication for the combined and Romanian samples. The results are integrally reinforced in the case of the Romanian sample through the findings prompted in the additional investigations by the impact of age on each of the two affective responses, the oldest group displaying higher liking and preference levels. For the combined sample, the results are partially confirmed, as the oldest age group showed only higher preference levels, while for the South African sample, nonsignificant results were uncovered. These finding are in agreement with the authors of [75,76], who opined that there is heterogeneity within the generational group due to different life stages and higher disposable income. Chungviwatanant et al. [39] also ascertained that older consumers displayed more positive attitudes to skippable in-stream advertising on YouTube. However, this is a pioneering study, which considers the effect of YouTube marketing communication on three age groups within the Millennial cohort in terms of the affective (attitudinal) response association, thereby reinforcing the heterogeneity perspective prompted by previous studies within the Millennial cohort.

4.2. Theoretical Implications

Several advertising models were posted to consider the various hierarchical stages, which track consumers’ progress through the purchase decision process, but traditional advertising was used to determine the effect of liking on preference in the development of these response hierarchy models [11,12]. Therefore, the appositeness of traditional advertising models concerning social media marketing communication is a major area of importance to academia and advertising practitioners since the exponential growth of social media and other online ICT platforms over the last decade. The existing literature shows research gaps that require additional inquiry regarding the effect of YouTube marketing communication on consumer attitudes, usage behaviour, and demographic factors in developing economies, and require the use of quantitative approaches and large sample sizes among different cohorts to reduce these gaps [3,7,16,19,32,39].
This inquiry used large samples in Romania and SA to quantitatively assess the effect of brand liking on brand preference among Millennials as a result of YouTube marketing communication, which confirm the cogency of the traditional response hierarchy model principles. Additionally, this study revealed that a number of usage and demographic factors, namely access, usage length, log-on duration, frequency of log-on, number of advertisements watched, gender, and age, had an influence on the combined and individual European and African Millennial groups. Therefore, these results make an important contribution to theoretical principles of affective (attitudinal) inquiry in terms of YouTube marketing communication, since there is a lack of investigation that examines usage and demographic factors as independent variables regarding the affective stages of response hierarchy models.

4.3. Managerial Implications

This study affirms that brand liking has a favourable effect on brand preference in both European and African developing economy contexts among Millennials. Therefore, organisations should endeavour to encourage liking among this young generational group, which will have a favourable effect on the affective hierarchical phase that will ultimately influence purchase decisions. Moreover, businesses can focus on environmental issues in order to develop positive attitudes necessary to lead to buying intention [50,91] by informing about problems, educating about solutions, and instilling green buying motivation [96]. Content is very important since it attracts online video viewers, and organisations should consistently upload entertaining, informative, and credible content, which could be emotional, by showing consumer experiences, or rational, by incorporating demonstrations, product features, and presentations [28,42].
Many organisations have used celebrities to generate content that serves as brand endorsements directed at very specific target markets. YouTube celebrities frequently interact with viewers, which not only serves as branded entertainment, but also as brand ambassadorships. Rasmussen [41] found that viewers formed a relationship with YouTube celebrities, who were favourably perceived as friends sharing opinions (an affective (attitudinal) response). The respondents also reported feelings of familiarity with the YouTube celebrities, who were seen as credible and trustworthy sources of information. This phenomenon is known as a parasocial interaction, whereby the audience acquires feelings of intimacy and attraction with increased celebrity interaction, and endeavours to acquire similar traits. Hence, organisations could approach YouTube celebrities to endorse their brands owing to the aforementioned positive benefits and the creation of affective (attitudinal) responses for a properly-targeted marketing communication (Micu et al. [97]).
Additionally, this research reveals that mobile devices; inexperienced consumers; low log-on frequencies; long log-on periods; a high number of YouTube advertisements; male; and older Millennial cohort members resulted in the most positive affective (attitudinal) responses in both the European and African developing economies. Hence, organisations should consider the use of YouTube metrics to aid organisations to target Millennials more accurately based on the affective (attitudinal) responses and most influential association with the usage and demographic factors revealed by this inquiry [53].

4.4. Limitations and Future Research Directions

This study has some limitations, which provide direction for further inquiry. The study was only conducted in Romania and South Africa, whereas other developing economies require inquiry to determine if they have similar or divergent affective predispositions, considering that consumers are continuously adapting to evolving technologies [98]. This inquiry did not examine specific types of YouTube or brand marketing communication, which provide another avenue for further research. The survey took a snapshot of the affective (attitudinal) responses, whereas further research could adopt qualitative and longitudinal methods. Further research could consider additional demographic factors as independent factors, such as education, income, and occupation [39]. A nonprobability sampling approach was used, so the results cannot be generalised to the Millennial population in the two researched developing economies. Future research could use a probability sampling technique, so that the findings could be generalised to the whole researched population. This study focused on a general affective (attitudinal) perspective and partially touched on sustainability realities in the matter. A future study should focus exclusively on YouTube sustainability issues to assess whether differences would be prompted between the general affective (attitudinal) perspective and the sustainability one. In addition, other social media platforms could be examined to ascertain if analogous affective (attitudinal) associations are present among the Millennial cohort.

Supplementary Materials

The following are available online at https://www.mdpi.com/2071-1050/11/3/604/s1: The document “YouTube Affective–Descriptive Statistics and Central Tendency”, containing the tables exported from SPSS, comprising the affective–descriptive statistics and the central tendency for the variables used in the study; the Sheet “Dataset” of the “The Centralised Dataset” Excel Workbook, containing the whole database; the document “(Liking and Preference) YouTube Questionnaire—RO+SA”, containing the questionnaire used for collecting the data.

Author Contributions

All authors contributed to the conceptualisation and methodology parts. Data curation was performed by R.D. and T.E., while formal analysis was done by D-M.P. and I.-C.N. All authors contributed to discussions and implications.

Funding

This research received no external funding. The APC was discounted integrally by the Multidisciplinary Digital Publishing Institute (MDPI).

Conflicts of Interest

The authors declare no conflict of interest.

References

  1. Foye, L. Global Ad Spend Will Reach $37bn in the Next Five Years. Available online: http://www.bizcommunity.com/Article/1/12/172893.html#more (accessed on 28 November 2018).
  2. Kim, J.Y. Rich and Poor: Opportunities and Challenges in an Age of Disruption. Available online: http://www.worldbank.org/en/news/speech/2018/04/10/rich-and-poor-opportunities-and-challenges-in-an-age-of-disruption (accessed on 28 November 2018).
  3. Bolton, R.N.; Parasuraman, A.; Hoefnagels, A.; Migchels, N.; Kabadayi, S.; Gruber, T.; Loureiro, Y.K.; Solnet, D. Understanding Generation Y and their use of social media: A review and research agenda. J. Serv. Manag. 2013, 24, 245–267. [Google Scholar] [CrossRef]
  4. Thomson, M. How Technology Is Driving the Millennial Retail Market. Available online: http://www.bizcommunity.com/Article/196/185/177113.html#more (accessed on 28 November 2018).
  5. Belk, R. You are what you can access: Sharing and collaborative consumption online. J. Bus. Res. 2014, 67, 1595–1600. [Google Scholar] [CrossRef]
  6. Smith, K. 39 Fascinating and Incredible YouTube Statistics. Available online: https://www.brandwatch.com/blog/39-youtube-stats/ (accessed on 28 November 2018).
  7. Araújo, C.S.; Magno, G.; Meira, W.; Almeida, V.; Hartung, P.; Doneda, D. Characterizing videos, audience and advertising in youtube channels for kids. In Lecture Notes in Computer Science (Including Subseries Lecture Notes in Artificial Intelligence and Lecture Notes in Bioinformatics); Elsevier: Oxford, UK, 2017. [Google Scholar]
  8. Bibhas, C.; Goswami, S.; Vineet, C. Investigating attitude towards online advertising on social media—An empirical study. Manag. Insight 2012, 8, 1–14. [Google Scholar]
  9. Peters, K.; Chen, Y.; Kaplan, A.M.; Ognibeni, B.; Pauwels, K. Social media metrics—A framework and guidelines for managing social media. J. Interact. Mark. 2013, 27, 281–298. [Google Scholar] [CrossRef]
  10. Lutz, R.J. Affective and Cognitive Antecedents of Attitude Toward the Ad: A Conceptual Framework. In Psychological Processes and Advertising Effects: Theory, Research and Application; Mitchell, A.A., Alwitt, L.F., Eds.; Lawrence Erlbaum Associates: Hillsdale, NJ, USA, 1985; pp. 45–63. [Google Scholar]
  11. Barry, T.M. The development of the hierarchy of effects: An historical perspective. Curr. Issues Res. Advert. 1987, 10, 251–295. [Google Scholar] [CrossRef]
  12. Belch, G.E.; Belch, M.A. Advertising & Promotion An Integrated Marketing Communications Perspective, 11th ed.; McGraw-Hill: New York, NY, USA, 2018; ISBN 9789814575119. [Google Scholar]
  13. Cohen, J.; Areni, C. Affect and Consumer Behavior. In Handbook of Consumer Behavior; Kassarjian, H.H., Robertson, T.S., Eds.; Prentice-Hall: Upper Saddle River, NJ, USA, 1991; pp. 188–240. [Google Scholar]
  14. Kujur, F.; Singh, S. Emotions as predictor for consumer engagement in YouTube advertisement. J. Adv. Manag. Res. 2018, 15, 184–197. [Google Scholar] [CrossRef]
  15. Purgat, M.; Filimon, N. Patterns of youtube uses in a cross-cultural context: An exploratory approach focused on gender and age. Adv. Sociol. Res. 2017, 22, 21–43. [Google Scholar]
  16. Balakrishnan, J.; Manickavasagam, J. User Disposition and Attitude towards Advertisements Placed in Facebook, LinkedIn, Twitter and YouTube. J. Electron. Commer. Organ. 2016. [Google Scholar] [CrossRef]
  17. Chiang, H.S.; Hsiao, K.L. YouTube stickiness: The needs, personal, and environmental perspective. Internet Res. 2015, 25, 85–106. [Google Scholar] [CrossRef]
  18. Chu, S.C.; Kamal, S.; Kim, Y. Understanding consumers’ responses toward social media advertising and purchase intention toward luxury products. J. Glob. Fash. Mark. 2013, 4, 158–174. [Google Scholar] [CrossRef]
  19. Dehghani, M.; Niaki, M.K.; Ramezani, I.; Sali, R. Evaluating the influence of YouTube advertising for attraction of young customers. Comput. Hum. Behav. 2016, 59, 165–172. [Google Scholar] [CrossRef]
  20. Göbel, F.; Meyer, A.; Ramaseshan, B.; Bartsch, S. Consumer responses to covert advertising in social media. Mark. Intell. Plan. 2017, 35, 578–593. [Google Scholar] [CrossRef]
  21. Gupta, H.; Lam, T.; Pettigrew, S.; Tait, R.J. Alcohol marketing on YouTube: Exploratory analysis of content adaptation to enhance user engagement in different national contexts. BMC Public Health 2018, 18, 141–150. [Google Scholar] [CrossRef] [PubMed]
  22. Hansen, S.S.; Jin, K.L.; Lee, S.-Y. Consumer—Generated Ads on YouTube: Impacts of Source Credibility and Need for Cognition on Attitudes, Interactive Behaviors, and EWOM. J. Electron. Commer. Res. 2014, 15, 254–266. [Google Scholar] [CrossRef]
  23. Hansson, L.; Stanic, N. Do Big Laughs and Positive Attitudes Sell? An Examination of Sponsored Content on Youtube, and How Entertainment and Attitude Influence Purchase Intentions in Millennial Viewers; Halmstad University: Halmstad, Sweden, 2017. [Google Scholar]
  24. Jordá, M.T.P. Advertising in the cartoons in youtube. Rev. Comun. Vivat Acad. 2016, 19, 57–72. [Google Scholar] [CrossRef]
  25. Khan, G.F.; Vong, S. Virality over youtube: An empirical analysis. Internet Res. 2014, 24, 629–647. [Google Scholar] [CrossRef]
  26. Lee, J.K.; Lee, S.Y.; Hansen, S.S. Source Credibility in Consumer-Generated Advertising in Youtube: The Moderating Role of Personality. Curr. Psychol. 2017, 36, 849–860. [Google Scholar] [CrossRef]
  27. Li, H.; Lo, H.Y. Do You Recognize Its Brand? The Effectiveness of Online In-Stream Video Advertisements. J. Advert. 2015, 44, 208–218. [Google Scholar] [CrossRef]
  28. Mansour, E.H.F.H. Young Saudi females and social media advertising. Khartoum Univ. J. Manag. Stud. 2016, 10, 58–73. [Google Scholar] [CrossRef]
  29. Mir, I.A.; Rehnam, K.U. Factors affecting consumer attitudes and intentions toward user-generated product content on YouTube. Manag. Mark. Chall. Knowl. Soc. 2013, 8, 637–654. [Google Scholar] [CrossRef]
  30. Moon, J.H. The Impact of Video Quality and Image Size on the Effectiveness of Online Video Advertising on YouTube. Int. J. Contents 2014, 10, 23–29. [Google Scholar] [CrossRef] [Green Version]
  31. Duffett, R.; Mucha, B.T.; Noruka, B. Usage characteristics effect on intention-to-purchase regarding YouTube advertising among University of Cape Town students. In Live Research, Transform Lives Conference; Cape Town, Cape Peninsula University of Technology: Cape Town, South Africa, 2014. [Google Scholar]
  32. Rodriguez, P.R. Effectiveness of YouTube advertising: A study of audience analysis; Rochester Institute of Technology: Rochester, NY, USA, 2017. [Google Scholar]
  33. Thomas, S.L.; Bestman, A.; Pitt, H.; Deans, E.; Randle, M.J.; Stoneham, M.; Daube, M. The Marketing of Wagering on Social Media: An Analysis of Promotional Content on YouTube, Twitter and Facebook; Victorian Responsible Gambling Foundation: Victoria, Australia, 2015. [Google Scholar]
  34. Viertola, W. To What Extent Does YouTube Marketing Influence the Consumer Behaviour of a Young Target Group; Metropolia University of Applied Sciences: Helsinki, Finland, 2018. [Google Scholar]
  35. Wang, C. Do People Purchase What They Viewed from YouTube? The Influence of Attitude and Perceived Credibility of User-Generated Content on Purchase Intention; The Florida State University: Tallahassee, FL, USA, 2015. [Google Scholar]
  36. Wendt, L.M.; Griesbaum, J.; Kölle, R. Product advertising and viral stealth marketing in online videos: A description and comparison of comments on YouTube. Aslib J. Inf. Manag. 2016, 68, 250–264. [Google Scholar] [CrossRef]
  37. Westenberg, W. The Influence of YouTubers on Teenagers: A Descriptive Research about the Role YouTubers Play in the Life of Their Teenage Viewers; University of Twente: Enschede, The Netherlands, 2016. [Google Scholar]
  38. Wu, K. YouTube Marketing: Legality of Sponsorship and Endorsement in Advertising. J. Lawbusinessethics 2016, 22, 59–92. [Google Scholar] [CrossRef]
  39. Chungviwatanant, T.; Prasongsukam, K.; Chungviwatanant, S. A study of factors that affect consumer’s attitude toward a “skippable in-stream ad” on YouTube. Au-Gsb E-J. 2016, 9, 83–96. [Google Scholar]
  40. Gupta, H.; Singh, S.; Sinha, P. Multimedia tool as a predictor for social media advertising—A YouTube way. Multimed. Tools Appl. 2017, 76, 18557–18568. [Google Scholar] [CrossRef]
  41. Rasmussen, L. Parasocial Interaction in the Digital Age: An Examination of Relationship Building and the Effectiveness of YouTube Celebrities. J. Soc. Media Soc. 2018, 7, 280–294. [Google Scholar]
  42. Yang, K.C.; Huang, C.H.; Yang, C.; Yang, S.Y. Consumer attitudes toward online video advertisement: YouTube as a platform. Kybernetes 2017, 46, 840–853. [Google Scholar] [CrossRef]
  43. Zaitceva, E. The Fight for Customers’ Attention: YouTube as an Advertising Platform; Kajaani University of Applied Sciences: Kajaani, Finland, 2018. [Google Scholar]
  44. Zhang, J.; Mao, E. From Online Motivations to Ad Clicks and to Behavioral Intentions: An Empirical Study of Consumer Response to Social Media Advertising. Psychol. Mark. 2016, 33, 155–164. [Google Scholar] [CrossRef]
  45. Edu, T.; Negricea, I.C. CSR Market Positioning Constructs: From Planning to Action. Evidence from Romanian Internet Service Providers. In The Dynamics of Corporate Social Responsibility; Aluchna, M., Idowu, S.O., Eds.; Springer: Cham, Switzerland, 2017; pp. 117–137. ISBN 978-33-1939-088-8. [Google Scholar]
  46. Poushter, J.; Bishop, C.; Chwe, H. Social Media Use Continues to Rise in Developing Countries but Plateaus Across Developed Ones. Digital divides remain, both within and across countries. Available online: http://www.pewglobal.org/2018/06/19/social-media-use-continues-to-rise-in-developing-countries-but-plateaus-across-developed-ones/ (accessed on 28 November 2018).
  47. Wang, X.; Yu, C.; Wei, Y. Social Media Peer Communication and Impacts on Purchase Intentions: A Consumer Socialization Framework. J. Interact. Mark. 2012, 26, 198–208. [Google Scholar] [CrossRef]
  48. Lesame, Z. Vision and Practice: The South African Information Society Experience. J. Multidiscip. Res. 2013, 5, 73–90. [Google Scholar]
  49. Petzer, D.J.; de Meyer, C.F. Trials and tribulations: Marketing in modern South Africa. Eur. Bus. Rev. 2013, 25, 382–390. [Google Scholar] [CrossRef]
  50. Roy, M. Impact of social medium on green choice behavior. J. Mark. Manag. 2014, 2, 95–111. [Google Scholar]
  51. Alexa Topsites. Available online: https://www.alexa.com/topsites (accessed on 28 November 2018).
  52. Stokes, R. eMarketing: The Essential Guide to Marketing in a Digital World, 6th ed.; Quirk Education and Red & Yellow: Cape Town, South Africa, 2017; ISBN 9788578110796. [Google Scholar]
  53. YouTube Analytics Basics. Available online: https://support.google.com/youtube/answer/1714323?hl=en (accessed on 28 November 2018).
  54. Kaplan, A.M.; Haenlein, M. Social media: Back to the roots and back to the future. J. Syst. Inform. Technol. 2012, 14, 101–104. [Google Scholar] [CrossRef]
  55. Hamari, J.; Sjoklint, M.; Ukkonen, A. The sharing economy: Why people participate in collaborative consumption. J. Assoc. Inf. Sci. Technol. 2016, 67, 2047–2059. [Google Scholar] [CrossRef]
  56. Minocha, S. Role of social software tools in education: A literature review. Educ. + Train. 2009, 51, 353–369. [Google Scholar] [CrossRef]
  57. Carroll, E.; Romano, J. Your Digital Afterlife: When Facebook, Flickr and Twitter Are Your Estate, What’s Your Legacy; New Riders: San Francisco, CA, USA, 2010; ISBN 978-0321732286. [Google Scholar]
  58. Nalewajek, M.; Macik, R. The role of social media in building awareness of responsible consumption. In Make Learn; ToKnowPress: Zadar, Croatia, 2013; pp. 837–844. [Google Scholar]
  59. Manetti, G.; Bellucci, M. The use of social media for engaging stakeholders in sustainability reporting. Account. Audit. Account. J. 2016, 29, 985–1011. [Google Scholar] [CrossRef] [Green Version]
  60. Bonson, E.; Bednarova, M. YouTube sustainability reporting: Empirical evidence from Eurozone-listed companies. J. Inform. Syst. 2014, 29, 35–50. [Google Scholar] [CrossRef]
  61. Strahle, J.; Graff, C. The role of social media for a sustainable consumption. In Green Fashion Retail; Strahle, J., Ed.; Springer: Singapore, 2017; pp. 225–247. ISBN 978-981-10-2440-5. [Google Scholar]
  62. Kilgour, M.; Sasser, S.L.; Larke, R. The social media transformation process: Curating content into strategy. Corp. Commun. 2015, 20, 326–343. [Google Scholar] [CrossRef]
  63. Duffett, R.; Okenda VO, E.; GM, M. Effect of YouTube advertising on knowledge: A study amongst UWC students. In Proceedings of the Celebration of Research Excellence Conference, Cape Town, South Africa, 29 November 2013. [Google Scholar]
  64. Moore, M. Interactive media usage among millennial consumers. J. Consum. Mark. 2012, 29, 436–444. [Google Scholar] [CrossRef]
  65. Schewe, C.D.; Meredith, G. Segmenting global markets by generational cohorts: Determining motivations by age. J. Consum. Behav. 2004, 4, 51–63. [Google Scholar] [CrossRef]
  66. McCrindle, M. Understanding Generation Y. Princ. Matters 2006, 55, 28–31. [Google Scholar] [CrossRef]
  67. Prensky, M. Digital Natives, Digital Immigrants. Horizon 2011, 9, 1–6. [Google Scholar] [CrossRef]
  68. MacKenzie, S.B.; Lutz, R.J. An Empirical Examination of the Structural Antecedents of Attitude toward the Ad in an Advertising Pretesting Context. J. Mark. 1989, 53, 48–65. [Google Scholar] [CrossRef]
  69. Shavitt, S.; Lowrey, P.; Haefner, J. Public attitudes toward advertising: More favorable than you might think. J. Advert. Res. 1998, 38, 7–22. [Google Scholar] [CrossRef]
  70. Statista. YouTube—Statistics & Facts. Available online: https://www.statista.com/topics/2019/youtube/ (accessed on 28 November 2018).
  71. Edu, T.; Lotter, W.A.; Negricea, I.C.; Avram, E.M. Current cross-cultural personal financial behaviour coordinates: Evidence from Romania and South Africa with a focus on young and educated individuals. Transform. Bus. Econ. 2014, 13, 833–852. [Google Scholar]
  72. Cable Co. Worldwide Broadband Speed League 2018. Available online: https://www.cable.co.uk/broadband/speed/worldwide-speed-league/ (accessed on 3 January 2019).
  73. International Telecommunication Union ICT Statistics 2016–2017. Available online: https://www.itu.int/en/ITU-D/Statistics/Pages/stat/default.aspx (accessed on 3 January 2018).
  74. Isaacs, C.A.; Maart, S.M.; Duffett, R.G. Effectiveness of company/brand YouTube advertising to create word-of-mouth: A study amongst South Peninsula High School learners. In Proceedings of the Celebration of Research Excellence Conference, Cape Town, South Africa, 29 November 2013. [Google Scholar]
  75. IGI. It’s Time to Stop Treating Millennials as a Single Target Segment. Available online: http://www.bizcommunity.com/Article/196/423/176038.html (accessed on 28 November 2018).
  76. Zambodla, N. Millennials Are Not a Homogenous Group. Available online: http://www.bizcommunity.com/Article/196/424/172113.html#more (accessed on 28 November 2018).
  77. Duffett, R.G. Effect of Gen Y’s affective attitudes towards facebook marketing communications in South Africa. Electron. J. Inf. Syst. Dev. Ctries 2015, 68, 1–27. [Google Scholar] [CrossRef]
  78. Taylor, D.G.; Lewin, J.E.; Strutton, D. Friends, fans, and followers: Do ads work on social networks?: How gender and age shape receptivity. J. Advert. Res. 2011, 51, 258–275. [Google Scholar] [CrossRef]
  79. Todd, P.; Melancon, J. Gender and live-streaming: Source credibility and motivation. J. Res. Interact. Mark. 2018, 12, 79–93. [Google Scholar] [CrossRef]
  80. Chong, A.Y.L.; Chan, F.T.; Ooi, K.B. Predicting consumer decisions to adopt mobile commerce: Cross country empirical examination between China and Malaysia. Decis. Support Syst. 2012, 53, 34–43. [Google Scholar] [CrossRef]
  81. Babakus, E.; Mangold, W.G. Adapting the SERVQUAL scale to hospital services: An empirical investigation. Health Serv. Res. 1992, 26, 767–786. [Google Scholar]
  82. De Jonge, T.; Veenhoven, R.; Arends, L. Homogenizing responses to different survey questions on the same topic: Proposal of a scale homogenization method using a reference distribution. Soc. Indicat. Res. 2014, 117, 275–300. [Google Scholar] [CrossRef] [PubMed]
  83. Statistics South Africa 2016. Community Survey. Available online: http://www.statssa.gov.za/?page_id=6283 (accessed on 28 November 2018).
  84. Romania in Figures—Statistical Abstract. Available online: http://www.insse.ro/cms/sites/default/files/field/publicatii/romania_in_figures.pdf (accessed on 28 November 2018).
  85. Du Toit, J.; Kraak, A.; Favish, J.; Fletcher, L. From study to work: Methodological challenges of a graduate destination survey in the Western Cape, South Africa. Assess. Eval. High. Educ. 2014, 39, 853–864. [Google Scholar] [CrossRef]
  86. Hair, J.F.J.; Black, W.C.; Babin, B.J.; Anderson, R.E.; Tatham, R.L. Multivariate Data Analysis; Prentice Hall: Englewood Cliffs, NJ, USA, 2010; ISBN 978-1-292-02190-4. [Google Scholar]
  87. Hair, J.F.; Ringle, C.M.; Sarstedt, M. PLS-SEM: Indeed a Silver Bullet. J. Mark. Theory Pract. 2011, 19, 139–151. [Google Scholar] [CrossRef]
  88. Fornell, C.; Larker, D.F. Evaluating Structural Equation Models With Unobservable Variable Sand Measurement Error. J. Mark. Res. 1981, 18, 39–50. [Google Scholar] [CrossRef]
  89. Hooper, D.; Coughlan, J.; Mullen, M.R. Structural equation modelling: Guidelines for determining model fit. Electron. J. Bus. Res. Methods 2008, 6, 53–60. [Google Scholar] [CrossRef]
  90. Speedtest Global Index. Available online: www.speedtest.net/global-index (accessed on 28 November 2018).
  91. Langley, D.; van den Broek, T. Exploring social media as a driver of sustainable behaviour: Case analysis and policy implications. In Proceedings of the Internet Politics and Policy Conference, Oxford, UK, 16–17 September 2010. [Google Scholar]
  92. Marinkovic, V.; Kalinic, Z. Antecedents of customer satisfaction in mobile commerce. Exploring the moderating effect of customization. Online Inf. Rev. 2017, 41, 138–154. [Google Scholar] [CrossRef]
  93. Sago, B. Factors influencing social media adoption and frequency of use: An examination of Facebook, Twitter, Pinterest and Google+. Int. J. Bus. Commer. 2013, 3, 1–14. [Google Scholar] [CrossRef]
  94. Duffett, R.G. Effect of instant messaging advertising on the hierarchy-ofeffects model amid teenagers in South Africa. Electron. J. Inf. Syst. Dev. Ctries 2016, 72, 1–21. [Google Scholar] [CrossRef]
  95. Marthinus, J.; Sobotker, D.; Duffett, R.G. The effect of YouTube advertising on liking in terms of usage characteristics amongst learners at Westerford High School. In Proceedings of the Live Research, Transform Lives Conference, Cape Town, South Africa, 27 November 2014. [Google Scholar]
  96. Reilly, A.; Weirup, A. Sustainability initiatives, social media activity, and organizational culture: An exploratory study. J. Sustain. Green Bus. 2012, 1, 1. [Google Scholar]
  97. Micu, A.; Micu, A.E.; Geru, M.; Lixandroiu, R.C. Analyzing user sentiment in social media: Implications for online marketing strategy. Psychol. Mark. 2017, 34, 1094–1100. [Google Scholar] [CrossRef]
  98. Căruțașu, G.; Coculescu, C.; Stănică, J.L.; Pîrjan, A. An analysis of the main Characteristics and Implementation Requirements of the Advanced Metering Infrastructure Systems in Romania. Database Syst. J. 2017, 7, 34–45. [Google Scholar]
Figure 1. Conceptual model of the proposed approach.
Sustainability 11 00604 g001
Figure 2. Significant standardised coefficients.
Sustainability 11 00604 g002
Table 1. YouTube usage and demographic factors’ descriptive statistics.
Analysed Aspects Concerning
YouTube’s Usage and Characteristics
Combined Sample
(n = 800)
Romania
(n = 400)
South Africa
(n = 400)
UsageCharacteristicn%n%n%
AccessMobile device12115.15012.57117.8
PC17021.3317.712130.2
Mobile device and PC50963.631979.820852.0
Length of usage≤1 year9211.5246.06817.0
2 years12215.2256.29724.2
3 years13116.4266.510526.3
4 years9211.5358.85714.2
≥5 years 36345.429072.57318.3
Log-on frequencyDaily33942.425964.78020.0
2–4 times a week20025.09223.010827.0
Once a week11514.4266.58922.2
2–4 times a month 9311.6194.87418.5
Once a month536.641.04912.3
Log-on duration≤1 hour30438.016040.014436.0
2 hours 26533.115037.511528.7
3 hours10312.9389.56516.3
4 hours 607.5123.04812.0
≥5 hours 688.54010.0287.0
Advertisement viewership #None24931.115538.89423.5
≤5 32841.016842.016040.0
6–10 13016.34912.28120.3
11–15 496.1123.0379.2
≥16445.5164.0287.0
GenderMale 37747.117944.819849.5
Female42352.922155.220250.5
Age (years)18–22 26633.213132.813533.7
23–2730337.914837.015538.8
28–3223128.912130.211027.5
Table 2. YouTube marketing communications affective (attitudinal) responses—confirmatory factor analysis, factor loadings, average variance extracted (AVE), composite reliability (CR) and Cronbach’s alpha.
Affective (Attitudinal) Responses Factor LoadingsAVECRCronbach’s α
LikingTotalSARomTotalRomSATotalRomSATotalRomSA
Like brands more (1)0.8580.7390.8490.6990.7930.5390.9200.9500.8510.9060.9260.795
Adds to enjoyment (2)0.8770.7840.907
Likeable and pleasant (3)0.8770.8010.911
Entertaining and fun (4)0.7110.7930.820
Like advertised products (5)0.8440.5110.821
Preference
Look for advertised products (1)0.7990.6720.8760.6770.7390.5080.9120.9340.8360.8930.9460.757
Relevant to interests (2)0.8580.7200.936
Stimulate brand preference (3)0.9170.8590.958
Gain interest in products (4)0.7480.6560.853
Prefer promoted brands (5)0.7810.6320.814
Note: Rom = Romania, SA = South Africa.
Table 3. Hypothesis testing, structural equation modelling (SEM) goodness-of-fit measures and significant outcomes. Root mean square error of approximation (RMSEA); Tucker Lewis index (TLI); Normed-fit index (NFI); Goodness-of-fit index (GFI); Comparative fit index (CFI); Standardised root mean square residual (SRMR).
Hypothesisχ2/dfRMSEATLINFIGFICFISRMRSignificanceSupport
H1a0.3650.0001.0000.9990.9991.0000.004p < 0.001Yes
H1b0.4560.0001.0000.9990.9971.0000.008p < 0.001Yes
H1c0.2180.0001.0000.9980.9991.0000.084p < 0.001Yes
H1d1.4460.0240.9920.9920.9900.9980.034p < 0.05Yes
H2a1.5790.0270.9850.9820.9890.9970.039-No
H2b 1.6340.0420.9770.9850.9710.9940.034p < 0.05Yes
H2c1.0830.0140.9900.9740.9840.9980.041-No
H3a2.2340.0390.9440.9770.9620.9870.043p < 0.05Yes
H3b2.1220.0530.9650.9820.9620.9900.048p < 0.05Yes
H3c1.3070.0280.9430.9510.9670.9860.040-No
H4a1.1370.0210.9850.9870.9820.9960.074p < 0.05Yes
H4b2.5190.0620.9510.9680.9420.9800.020p < 0.05Yes
H4c1.1670.0210.9850.9870.9820.9960.062p < 0.05Yes
H5a2.1110.0370.9530.9800.9890.9890.015p < 0.001Yes
H5b3.3050.0760.9090.9640.9300.9740.036p < 0.001Yes
H5c1.2720.0260.9490.9540.9720.9880.025p < 0.05Yes
H6a1.8480.0330.9610.9810.9770.9910.033p < 0.05Yes
H6b2.8910.0690.9340.9730.9500.9820.056-No
H6c0.7870.0011.0000.9740.9851.0000.033p < 0.05Yes
H7a1.0850.0100.9990.9950.9931.0000.017-No
H7b2.8440.0680.9580.9770.9580.9850.035p < 0.05Yes
H7c0.4270.0001.0000.9930.9961.0000.016-No
H8a1.9100.0340.9770.9850.9790.9920.032p < 0.05Yes
H8b2.8420.0680.9390.9700.9450.9800.062i < 0.001, p < 0.05Yes
H8c1.2910.0270.9680.9550.9710.9890.061-No
Table 4. Influence of YouTube usage characteristics and demographic factors on the affective (attitudinal) association.
Independent VariablesCombined (n = 800)Romania (n = 400)South Africa (n = 400)
Usage CharacteristicsβSigβSigβSig
CountrySouth Africa (1)0.66p < 0.05--
Romania (2)0.75
AccessMobile device (1)0.84-0.58p < 0.05
(3) – (2)
0.76-
PC (2)0.790.590.57
Mobile device and PC (3)0.800.820.65
Length of usage≤1 year (1)0.94p < 0.05
(1) – (3)
0.53p < 0.05
(1) – (2 and 3)
0.74-
2 years (2)0.830.250.78
3 years (3)0.570.250.49
4 years (4)0.350.920.35
≥5 years (5)0.900.920.89
Log-on frequencyDaily (1)0.88p < 0.05
(5) – (2)
0.89p < 0.05
(3, 4, and 5) – (2)
0.96p < 0.05
(3) – (2)
2–4 times a week (2)0.570.370.17
Once a week (3)0.870.750.87
2–4 times a month (4)0.700.750.55
Once a month (5)0.960.750.74
Log-on duration≤1 hour (1)0.77p < 0.001
(5) – (3)
0.73p < 0.001
(4 and 5) – (3)
0.66p < 0.05
(5) – (4)
2 hours (2)0.870.860.33
3 hours (3)0.690.480.75
4 hours (4)0.560.790.13
≥5 hours (5)0.820.790.79
Advertisement viewership #None (1)0.69p < 0.05
(2) – (1)
0.73-0.30p < 0.05
(4 and 5) – (3)
≤5 (2)0.870.830.78
6–10 (3)0.560.550.53
11–15 (4)0.850.520.60
≥16 (5)0.910.520.60
Sociodemographic characteristics
GenderMale (1)0.81-0.85p < 0.05
(1) – (2)
0.66-
Female (2)0.790.700.58
Age (years)18–22 (1)0.72p < 0.05
(3) – (1 & 2)
0.70p < 0.001
(3) – (1 and 2)
0.68-
23–27 (2)0.810.790.52
28–32 (3)0.870.870.95
Note a: p = statistical significance level. Note b: (X) – (Y) = comparison between statistically significant categories.
Table 5. Influence of YouTube demographic factors on affective attitude responses—liking (Lk) and preference (Pf)—generalised linear model (GLM) ANOVA.
Independent VariablesTotal (n = 800) Romania (n = 400)South Africa (n = 400)
Sociodemographic Characteristics n%pn%pn%p
GenderMale (1) 37747.10.002 * (Lk)
(2) – (1)B
0.062 (Pf)
17944.80.003 * (Lk)
(2) – (1)B
0.495 (Pf)
19849.50.145 (Lk)
0.018 * (Pf)
(2) – (1)B
Female (2)42352.922155.220250.5
Age (years)18–22 (1)26633.20.071 (Lk)
0.037 * (Pf)
(3) – (2)B
13132.80.005 * (Lk)
(3) – (2)B
0.012* (Pf)
(3) – (2)B
13533.70.722 (Lk)
0.938 (Pf)
23–27 (2)30337.914837.015538.8
28–32 (3)23128.912130.211027.5
Note a: * = Significant difference at p < 0.05. Note b: ** = Significant difference at p < 0.001. Note c: A = Bonferroni correction pairwise comparisons mean difference is significant at the 0.001 level. Note d: B = Bonferroni correction pairwise comparisons mean difference is significant at the 0.05 level.

