Abstract
To facilitate organizational change and improve corporate sustainability, this study identifies change agents and factors driving sustainability integration in the core business of companies. The survey on corporate sustainability management in Austria, with focus on smaller large-sized companies (revenue of €50–300 million, at least 250 employees), fills the research gap between studies commonly concentrating on the largest companies and on SMEs. Companies mainly established integrated cross-departmental sustainability management teams, which required change in the routines of employees and change agents to drive the projects. Possible locations of these change agents were identified. We drafted a process model that visualizes how change agents multiply their impact on the organizational level through interaction. The main sustainability implementation drivers are rooted in personal and organizational values, e.g., organizational culture and personal interest; the main inhibiting factors are the lack of resources or locked-up resources, originating from organizational inertness and other barriers to change. Companies can reduce the barriers by, e.g., providing extra resources in role and routine adaption phases and creating incentives to use sustainability-related skills. Austrian companies focus on established environmental and energy management topics. To implement themes that do not necessarily bring financial return, adopting paradox perspective on tensions between conflicting objectives might be useful.
1. Introduction
Increasing resource use and environmental impacts that are associated with an increasing global population and accelerating development have made it obvious that “business as usual” is not good enough to achieve a sustainable future [1,2]. Planetary boundaries that define safe operating spaces for humanity are already being crossed as a result of our activities [3]. Many researchers have reached the consensus that the sustainable development of economy and society cannot occur without the sustainable development of organizations; thus, companies should integrate sustainability at the core of their organization [4,5,6].
Sustainability, corporate sustainability management and corporate social responsibility (CSR) management have become catch phrases in the business world in recent years [7]. Although the variety of activities that company managers view as sustainability projects is very broad, without reconsidering the core meaning of sustainable development and the fundamental function of organizations, sustainable development work will continue to suffer from ‘reductionism’, ‘problem displacement’ and ‘problem shifting’ in terms of time, space and knowledge transfer [8] (p. 72). In line with this corporate challenge, researchers work on topics such as strategic thinking for sustainable development [8], strategic sustainability [9] and integration of sustainability in core business [4,10], organizational design and organizational change for sustainability [11,12,13] and sustainable business models [1,5,6,14,15]. Several studies have shown that companies have to integrate sustainability in all levels and in all departments of the company, meaning that corporate architectures and culture must change as well [10,11,16,17]. In some cases, companies will not be able to contribute to sustainable development without changing the underlying business logic.
Consequently, the question arises: How can such sustainability integration processes take place, and what are the favorable conditions for this to occur? Siebenhüner and Arnold [18] found in their case studies that in the absence of ready-made structures for sustainability management, individuals play an important role for sustainability implementation in the company. Furthermore, sustainability-oriented learning and successive change processes are initiated when sustainability-related requirements are “anchored in personnel and cultural attributes of the company,” supported with structures and learning mechanisms [18] (p. 350). Based on this, our study was primarily developed to identify the individuals or ‘change agents’ in companies, who drive the advancement of sustainability management and, thus, the organizational change for sustainability. However, given the multiplicity of actors and factors that interact and simultaneously form sustainability management strategies, it was important to maintain a holistic view on companies in this process. Hence, additional drivers and barriers for sustainability integration and change, as summarized by, for example, Aguinis and Glavas [19], Engert, Rauter and Baumgartner [20] and Lozano [13], were included while drafting the research design. Finally, as both human and non-human factors were identified in the existing literature that are essential for sustainability management and sustainability integration in organization, the following research question was developed:
RQ: “Who or what drives the integration of sustainability in the core business of the company?”
To ensure a holistic view on companies and their environment, this research question was addressed by exploring three descriptive aspects:
- Change agents: persons and organizational departments involved in and responsible for sustainability management.
- Motivation/Drivers: internal and external influential factors, stakeholder requests and impact of sustainability management on the company.
- Outcomes: themes currently addressed in companies and themes, which are considered relevant for the future.
These three descriptive aspects encompass a high number of items, which were highlighted in the literature as useful predictors of company behavior in sustainability management (explained in Section 2). Primary data to answer the research question was collected using surveys of the persons responsible for sustainability management in Austrian companies. This method enabled us to test the relevance of large number of items from the literature. The possibility to benchmark our results against the results of the largest German companies [21] and the results of companies in ten other countries [22] was an additional benefit from choosing this method.
Previous studies have generally placed a focus on sustainability management in the largest companies or selected large companies, whereas other research streams have been devoted to small and medium enterprises (SMEs) and their experiences, such as the study by Witjes, Vermeulen and Cramer [23], or the literature review by Ortiz-Avram et al. [24]. In contrast, the presented corporate sustainability management survey places a focus on companies that fall within the gap between the two previously mentioned size categories, i.e., smaller large-sized companies. Consequently, the upper sample cut-off point excluded the largest Austrian companies identified in a preliminary analysis of a company database (for more details, see Section 3); and the lower cut-off point excluded SMEs using the European Commission definition (i.e., companies with fewer than 250 employees and annual revenues of up to €50 million) [25]. These two criteria are used in the European Union (EU) as firm size proxies to distinguish SMEs from large companies.
As a result, the sample of smaller large-sized companies includes around two-thirds of large companies in an Austrian context, with revenues falling between €50–300 million and at least 250 employees. Companies of this size have enough resources for more formal sustainability management and decision-making for sustainability, unlike SMEs [26] (p. 30). At the same time, their practices are still expected to be less centralized and standardized compared to those of the largest companies, which allows employees to reflect on the management processes and their own motivation.
In our study we found that smaller large-sized Austrian companies need change agents to drive sustainability activities and control/motivate other employees, since sustainability projects include diverse organizational units in all project phases. Project phases were also used to demonstrate how change agents can leverage their impact on organizational level. The top factors promoting sustainability implementation are rooted in personal and organizational values, for example, organizational culture, corporate philosophy or personal interest. However, the lack of resources for sustainability implementation is inhibiting the sustainability implementation, as organizational inertness and other barriers to change keep managers from redistributing the resources in favor of sustainability management. Change in routines, role extension and even dual roles challenge employees in sustainability implementation processes. We propose handful of strategies to reduce the barriers to organizational change for sustainability, and to broaden the range of sustainability activities.
This work contributes to the research linking organizational architectures and corporate sustainability performance and outcomes [11], adds propositions for developing a sustainable organization [27] and provides primary data collected from sustainability professionals [10]. It also presents additional knowledge about corporate sustainability implementation using survey data, as proposed in previous studies [28].
This paper is structured as follows: Section 2 includes a summary of the most relevant concepts and empirical findings from previous studies used to design the survey. The methods are described in Section 3. Results are aligned with the three descriptive aspects of sustainability integration in core business in Section 4. The main results of each descriptive aspect and their roles in the bigger picture of sustainability integration in core business are discussed in Section 5, while Section 6 presents concluding remarks about this study and recommendations for future research.
2. Theoretical Background
Sustainability management and its integration in organizations can be analyzed from different perspectives. These include sustainability/CSR management [19], strategic management [8,20,27], organizational development and change [10,11,12,13], change agents and leadership, organizational learning [18], stakeholder engagement [29,30,31], sustainable organization [17,27], sustainable business models [1,5,6,32] and business case for sustainability [33,34]. Internal and external company environment influences the choice of persons or organizational units to be responsible for sustainability management, and needs to be carefully noted. Thus, an integrated perspective is needed, looking first at individuals and organizational units that act as change agents for sustainability, then at their motivation and drivers to act, including the internal and external factors, and, finally, at the outcomes of their activities. The subsections of the theory section are organized according to the three descriptive aspects of the research question; each subsection concludes with implications on the survey design.
2.1. Change Agents
2.1.1. Change Agents and Management
Individual commitment is one of the drivers for sustainability implementation in organizations. Siebenhüner and Arnold observed that change agents play a leading role in sustainability-related learning and change processes, even if they were not in executive functions [18] (p. 348). Change agents are persons that “generate, implement and adopt change within and outside organizations” [35] (p. 218). It is important to distinguish between company management and sustainability champions or change agents, since these are not necessarily the same persons [36]. If these are different persons, both corporate management and change agents or champions are playing important, but differing roles in the sustainable development of organizations. For example, Visser and Crane [36] identified four types of change agents in companies and their personal motivation to act as change agents: ‘Experts’, which derive meaning in sustainability work from developing and offering specialist input; ‘Facilitators’, which do so from empowering other people; ‘Catalysts’, which do so from influencing the company’s leadership; and ‘Activists’, which do so from improving life of other members of society [36]. Before change agents act, choose the tools and support sustainability integration in the company, strategic decisions for sustainability have to be made by the management [23] (p. 530).
To build upon sustainability processes successfully, new leadership competences and complementary management and organizational models need to be developed and applied [37] (p. 9). If no readymade sustainability management structures are in place, individuals play important roles in sustainability-related organizational learning and initiating changes to improve sustainability [18]. Heiskanen, Thidell and Rodhe [35] summarized the most important competencies of sustainability change agents. These are competences for systems-thinking, interpersonal competences/emotional intelligence (e.g., competences to resolve conflicts, motivate and inspire others), anticipatory competences (e.g., anticipate consequences), strategic competences (e.g., planning, organizational change and decision-making), subject-specific competences, normative competence/responsibility, and action skills (e.g., initiative, confidence, decision-making, dealing with uncertainty) [35] (p. 219).
Siebenhüner and Arnold [18] found in their case studies on top performers that change agents are mainly located in management positions in medium-sized companies and located in sustainability and R&D departments in large companies. The Corporate Responsibility Barometer for Belgium (all size companies, all sectors) in 2015 showed that CSR managers are mainly located in strategy departments (14%), but might as well be sitting in HR, environment, PR/communication, Quality management or CSR departments (9–14%) [26] (p. 29). Companies with dedicated CSR person outscore companies without such persons in all five CSR domains rated in this study. In comparison to previous study in Belgium in 2011, the gap between these companies has even increased [26,38].
Kiron et al. [39] highlighted eight key lessons on the integration of corporate sustainability into business strategy in their eight-year study, which was based on over 60,000 survey responses and the results of 150 interviews with executives and thought leaders. Two of the key lessons related directly to the organizational unit and management. The first key lesson identified was to get the board of directors to support sustainability strategies. The unclear financial impact of sustainable business practices, lack of expertise, other priorities and short-term perspectives were shown to stand in the way of recognizing the long-term gains of sustainability integration into business strategies. Only 48% of companies reported that CEOs engaged with sustainability, and merely 30% of the boards had strong supervising roles regarding sustainability efforts, even though 86% of survey respondents agreed that the board should play a strong role in the company’s sustainability efforts [39].
Input for survey design: In this study, persons responsible for sustainability management and change agents driving the sustainability integration were identified. Support from management and staff was examined at all hierarchical levels of the company.
2.1.2. Sustainability Management and Organizational Units
The second key lesson from the study by Kiron et al. [39] is related to organizational units. This lesson indicates that companies should set up the organization in a way that they can reach their sustainability ambitions, and thus, integrate sustainability into the organization, e.g., form cross-functional teams, set clear targets and key performance indicators. Interactions between the organizational units and levels of hierarchy are seen as catalysts for sustainability-related learning processes and, correspondingly, sustainability outcomes [18].
Schaltegger et al. [21] conducted a corporate sustainability survey on the largest German companies and found that the level of involvement of company organizational units depended on the ecological or social focus of the project. With respect to social themes, the most frequently involved departments were those of CSR/sustainability, HR/personnel and management, whereas the CSR/sustainability and manufacturing, R&D, procurement/purchase and PR/communication departments were involved for ecological topics. Top management and PR/communication departments were highly involved in sustainability management, showing not only their strategic relevance, but also their importance with respect to the company’s communication and reputation [21]. The International Corporate Sustainability Barometer includes surveys on the largest companies in eleven countries: Spain, Belgium, UK, France, Germany, USA, Japan, Switzerland, Hungary, Korea and Australia. In all countries, companies have on average rated organizational units as promoting for sustainability implementation, or at least as being neutral to it [22] (p. 26). Overall, the international results showed strikingly similar practices in sustainability management in developed countries [21].
The departments that were identified as the least concerned and least involved in sustainability management in German companies were the departments of finance and financial and management accounting [21]. These departments need to be involved in sustainability management to integrate sustainability in economic corporate decisions [21] (p. 34). In a follow-up study in which the role of accountants was explored, Schaltegger and Zvezdov [40] showed that sustainability accounting was mainly done by CSR/sustainability managers or middle managers. Financial accountants could act as gatekeepers, (selectively) providing the information to the higher-level decision-makers. They could also provide their expertise in translating the results from sustainability accounting into management language or even be willing to support sustainability accounting process and act as mediators [40] (p. 351).
Input for survey design: In this study, the project management phases were used to identify the roles of various organizational units. The organizational unit impact on and involvement in sustainability management was examined.
2.2. Motivation and Drivers
The second descriptive aspect identified for sustainability integration was the motivation for sustainability management and drivers for its integration in the company. Aguinis and Glavas [19] offered an extensive overview of the existing empirical and conceptual research on CSR management. They summarized the predictors, mediators and outcomes of CSR management on institutional, organizational and individual levels. In this study, these three levels were slightly adjusted so they could be used for the analysis of the drivers and factors motivating sustainability management (see Figure 1).
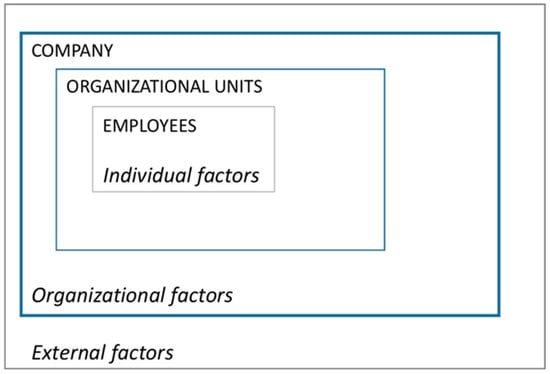
Figure 1.
Levels of analysis used to address the research question.
The starting point, which was relevant for each level of analysis, was the study by Engert, Rauter and Baumgartner [20], in which the internal and external drivers and factors supporting and hindering sustainability integration in strategic management were summarized (Table 1). In addition to the CSR and (strategic) sustainability management literature, the literature on organizational change for sustainability was reviewed to finalize the questions on motivation/drivers included in the survey design. Organizational change requires overcoming various barriers during iterative stages of change [13]. Hence, barriers to organizational change were considered along with drivers and motivation, since these influence the company’s efforts to improve sustainability.

Table 1.
Integrating corporate sustainability in strategic management; adapted from the results of a literature review by Engert et al. [20].
2.2.1. Individual and Organizational Factors
Since the individual’s attitudes and beliefs were not within the scope of the study, the individual was viewed from the ‘macro perspective’, i.e., as a part of the organizational unit and the company. Aguinis and Glavas [19] used institutional, organizational and individual levels to classify the factors identified from an extensive CSR literature review, while the study by Engert et al. [20] was referenced to obtain the strategic viewpoint and emphasis. Based on a synthesis of the results from these studies, questions about individual and organizational factors, such as the concern for CSR, CEO support and company’s alignment of mission and vision, were included in the survey design. In a domestic context, case studies in Austria have shown that legal regulations, leadership, organizational culture, employee interest and willingness to implement projects are drivers for business models for sustainability [14] (p. 151). These results were tested in part with the current quantitative study.
Multiple studies identify organizational culture as an important factor for sustainability implementation. In order for companies to become more sustainable, their sustainability activities need to actually fit the organizational culture, and be considered as authentic by the employees and credible by the stakeholders [17]. A study by Berson, Oreg and Dvir [41], in which the connection between CEO values, organizational culture and firm outcomes was studied, emphasized that organizational culture is formed by the subsequent CEO and is likely to reflect the leader’s personal value system. However, Linnenluecke and Griffiths [16] argued that more internal mechanisms are in place that influence the company’s success of becoming a more sustainable organization, given the existing subcultures and organizational rigidity. The constructivist view from previous studies on organizational culture was applied in the current analysis (i.e., that organizational culture itself cannot be managed, but the social interactions that construct organizational culture can be influenced) [17] (p. 106).
To include the internal mechanisms that could possibly hinder organizational change, the study of Lozano [13] on barriers to change was considered while developing the survey design (see Table 2). Lozano [13] explained the dynamics of organizational change as ‘Orchestrated Change for Corporate Sustainability,’ determined by the status quo, corporate sustainability drivers, strategies, barriers to change, institutional framework, transition period and corporate sustainability institutionalization.
Table 2.
Barriers to organizational change for sustainability extracted from the literature, and strategies to overcome barriers. Adapted from Lozano [13] (p. 280–282).
The company’s size, scope, structure and industry influence the sustainability management practices, as the drivers and barriers influence sustainability integration [20]. However, although these were not directly included in the analysis, they have to be considered when interpreting the results for practical application in individual companies.
Input for survey design: In this study, the list of internal and external factors was included in the survey design to test the results of the studies presented above. More organizational variables, including organizational culture, and factors derived from barriers of change, were included.
2.2.2. Stakeholder Requests and External Drivers
Aguinis and Glavas [19] identified factors, such as activist group pressure, economic conditions and institutional and stakeholder pressures, that influenced the CSR management practices at the institutional level. Stakeholders and related external factors have been among the main themes in the CSR management literature and, thus, have been seen as an important aspect to analyze the motivation and drivers of sustainability implementation.
Considering what others “require, expect or desire” in a company context is typically understood as a task of stakeholder management [30] (p. 43). Stakeholder theory, coined by Edward Freeman, has taken on many forms since it was created: a version that is instrumental (places a focus on expected returns) versus moral (‘right thing to do’); one that places a focus on making trade-offs versus avoiding trade-offs; and one that places a focus on a decision-making organization or stakeholder engagement [31] (pp. 43–44). Even though these forms of the theory have often been used to explain CSR management outcomes, the results of an extensive qualitative study conducted with sixteen Danish companies show that these did not sufficiently address CSR strategy-making. Thus, the stakeholder influence should be analyzed in context of other influencers, e.g., top management, employees [30]. The results of the study by Trapp show that companies mainly listen to external stakeholders during the strategy-making process, and that the CSR strategy is managerial exercise, involving the top management, employees, experts and consultants [30].
In line with the limited scope of this research, four further studies were considered as being of relevance for the survey design. Customers, regulators and investors are considered to be the most influential stakeholders in Belgian companies [26]. Over the past years, requests from customers and employees have lost their negative connotation in Belgian companies, and are now perceived as opportunities to develop new products or services [38]. In case studies conducted with Austrian companies, competition and customer demand do not appear to be the main external drivers for the transformation towards sustainability, unlike what authors of one study had expected [14] (p. 149). These factors were, therefore, included for validation in the survey. Regarding stakeholder involvement, the largest companies in Germany benefit from NGOs and media/public as their external stakeholders for sustainability implementation, since these help them build up and preserve the legitimacy of their motives for sustainability management. Financial markets have gained importance with regard to corporate sustainability; this is also reflected in the positive ratings of competitors, shareholders and rating agencies by surveyed companies. Suppliers, insurance agencies and banks are not considered to be helpful for the promotion of sustainability management [21].
Input for survey design: In this study, the stakeholder influence on sustainability implementation was analyzed, and other contextual factors were added, such as customer demand, competition in the market, innovation in the sector and cooperation.
2.2.3. Impact as Motivation for Sustainability Management
Possible answers to the research question were synthesized from scholarly work [13,18,20,21,33,42], including business case drivers as formulated by Schaltegger, Lüdeke-Freund and Hansen [34]. They argued that each company only has a limited number of business cases for sustainability, and, therefore, these should be actively created and managed. The following items were selected after examining the impacts frequently discussed in the research literature:
- Cost reduction
- Cost increase
- Risk reduction
- Sales increase
- Reputational benefit
- Employer attractiveness
- Business model innovation
- Radical innovation processes
- Collaboratively developed innovation with stakeholders
The top five reasons why companies in Belgium implemented corporate responsibility management measures were (i) positive impact on their reputation, (ii) building relationship with stakeholders, (iii) employee motivation, (iv) contribution to innovation of products/services, and (v) obtaining support to comply with regulations [26] (p. 13). A study conducted on the largest German companies showed that companies implement measures that improve efficiency, manage risks and improve the company’s reputation [21]. Innovation is rarely the driver for sustainability measures; even though sustainability-oriented innovations are the key to solving damaging problems in the production processes and with products, and the key to directing sustainability management towards the market [21].
Input for survey design: In this study, companies were offered to rate the impacts of sustainability management on the involved companies; these impacts were derived from business case drivers and the related literature.
2.3. Outcomes and Themes
Since company managers have varying degrees of understanding in terms of what can be categorized under ‘sustainability themes,’ the outcomes of sustainability integration in the company were approached with three perspectives; (i) themes relevant to companies, (ii) globally relevant themes requested by external stakeholders, and (iii) sustainability management approaches used in the company. In this section, the underlying concept of sustainability management approaches is first presented, and the section is finalized with the summary of the trends in sustainability themes as collected from previous studies.
2.3.1. Sustainable Business Model Archetypes
Companies should tackle the source of unsustainability instead of correcting the outcomes of this unsustainability with add-on activities. The business model is a useful concept that can be used to describe the underlying business logic. Sometimes it is necessary to change that underlying business logic so that companies can truly become more sustainable [1,14]. Bidmon and Knab [43] examined business models and societal transitions. They stated that many companies tend to hold on to existing business models and consider it impossible to transition to alternatives. In other cases, companies have found a way to use well-known business models in new technological niche contexts to disseminate a technology, for example, by offering leasing PV technology [43] (p. 912). Therefore, it is interesting to study whether companies consider applying new business models or at least taking new approaches, as opposed to conducting ‘business as usual,’ when managing sustainability. Bocken, Short, Rana and Evans [1] offered eight “Sustainable business model archetypes” that categorized useful mechanisms and solutions for business model innovation for sustainability (p. 48).
Technological
- Maximize material and energy efficiency
- Create value from ‘waste’
- Substitute with renewables and natural processes
Social
- Deliver functionality rather than ownership
- Adopt a stewardship role
- Encourage sufficiency
Organizational
- Re-purpose the business for society/environment
- Develop scale-up solutions
Even though the development of these archetypes was mainly based on information from the manufacturing industry, these seem to be applicable in various contexts if some additions are made, for example, banking as in study by Yip and Bocken [44]. Hence, the archetypes are considered to be an appealing choice to address the question of which “sustainability management approaches” Austrian companies consider when developing their strategies.
The archetypes were applied empirically by Ritala et al. [32], who explored the shift to more sustainable business models by analyzing press releases from S&P 500 companies over period of nine years. The codes in press releases show evidence for ‘substitution with renewables and natural processes’ (28.53%), ‘maximizing material and energy efficiency’ (27.42%) and ‘creating value from waste’ (22.11%) most frequently. There is little support for archetypes ‘deliver functionality rather than ownership’, ‘encourage sufficiency’ and ‘develop scale up solutions’ [32]. It was expected that Austrian companies would have similar preferences for sustainability management approaches.
Input for survey design: In this study, managers could report about sustainability management approaches (derived from Sustainable business model archetypes [1]) that they have used in the last five years or planned to use in the near future.
2.3.2. Themes from Other Studies
The largest German companies strongly engage with the themes of (further) education, energy consumption, occupational safety, employment and emissions, waste and wastewater. These themes, plus that of ‘diversity’, represent the six themes that are the most frequently requested by their external stakeholders [21]. The importance of themes related to social aspects and personnel has increased recently, in both company engagement and stakeholder requests for, e.g., diversity and equality [21].
A CSR survey conducted with businesses and their stakeholders in Hong Kong showed that environmental performance, health and safety, good governance, human resource management and employment practices are the main concerns for businesses and their stakeholders [29]. In a study using text mining on the Forbes 2000 companies’ sustainability reports, the main sectors of the process industry show almost identical trends, additionally emphasizing the impact of community investment [45]. Average values from study on the largest companies in eleven countries show that stakeholders most often have requests on occupational health and safety, workplace/employment, energy consumption, diversity and equal opportunities, training and development, emissions/waste/waste water and consumer protection [22] (p. 50).
The top five challenges in 2015 reported by Belgian companies (all sizes, all sectors) were economic instability, worker’s rights, stakeholder dialogue, human health and diseases and climate change [26] (p. 13). The last three were new to the top list as compared to the study from 2011 [38]. As the top five challenges in ten years, Belgian companies identified economic instability, stakeholder dialogue, climate change, shortage of skilled workers and resource depletion [26] (p. 13). In 2012, ten out of the eleven countries of the International Corporate Sustainability Barometer expected energy/greenhouse gas emissions, water, transport, materials and resources to be the most relevant environmental issues in five to ten years [22]. Social issues ranged from those related to diversity and equal opportunity, work-life balance and safety and health to those related to employee generation, human rights, supply chain management, training and employee qualifications [22] (p. 22). Since the international study identified striking similarities on how the largest companies from developed EU and non-EU countries manage sustainability issues, Austrian companies are expected to provide similar results on these topics. The planetary boundaries for human development as defined by Rockström et al. [3] were included in the survey design to test the company representatives’ recognition of these.
Input for survey design: In this study, companies were offered to evaluate stakeholder requests with respect to the list of globally important topics, such as Sustainable Development Goals (SDGs) and planetary boundaries. Company representatives were given the opportunity to share the themes which they expected to be important for the company’s sustainability management over the next five to ten years.
The descriptive thematic aspects and specific topics were prioritized during the survey design to limit its length and detail and maximize the rate of voluntary company participation (Figure 2).

Figure 2.
Three descriptive aspects of the research question, and topics used in the analysis.
The main empirical studies that were partly used as survey design input, and therefore, could be used to benchmark our results, are summarized in the Table 3.
Table 3.
The empirical studies that were mainly used to benchmark our survey results.
3. Methods
3.1. Survey Development
A survey was chosen as an appropriate method to gain an initial overview of the CSR management practices in smaller large-sized companies in Austria. In order to benchmark some of the results, the survey was based on one of the most well-known CSR studies in German-speaking countries: the Corporate Sustainability Barometer from Leuphana University Lüneburg on the largest German companies and the extended study with participants from eleven countries [21,22]. The survey questions were revised, focusing on the top management and roles of organizational units, motivation and drivers behind sustainability implementation and sustainability management approaches (see Section 2). The overview of survey questions is found in Appendix A.
3.2. Sample and Data Collection Procedure
Given that the authors of most of the previous studies concentrated either on the largest/selected companies or on SMEs, the focus of this study was placed on the remaining unexplored group of companies, the so-called “smaller large-sized companies”. The Compass Group database on Austrian companies was searched to identify companies for the study (data export date: 28 June 2017). First, SMEs were excluded from the company list; these are companies with fewer than 250 employees and up to €50 million in revenues in the previous (reported) financial year [25]. Revenue is the best financial company size proxy available for sampling company databases. A list of 1160 large companies was subsequently compiled. Second, all subsidiaries were removed if the parent company was on the list to avoid double entries (i.e., group’s strategy). This left 938 companies on the list for further consideration.
Finally, to apply consistent sample selection criteria, the revenues and numbers of employees were also used to identify and remove the largest companies (in an Austrian corporate context) from the sample. Once the remaining companies had been sorted by descending revenues, large differences in size could be observed (Figure 3). The distribution of companies (in terms of size) becomes smoother as the revenues drop below €350–250 million, as this is the range below which about two-thirds of large companies can be found (Figure 4). Hence, for the purpose of this study, the cutoff point was set at €300 million, excluding the top 300 largest companies from the sample and leaving 638 companies with revenues of €50–300 million to be contacted for the survey.
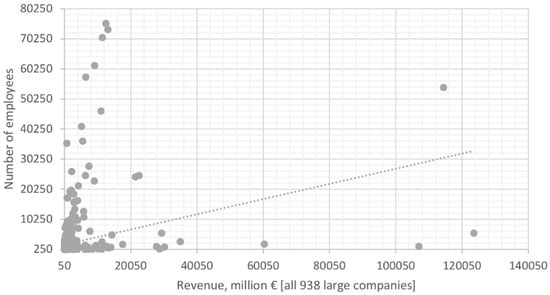
Figure 3.
Number of employees in all 938 large Austrian companies according to company revenue for 2016 (or the most recent data), after removing subsidiaries.
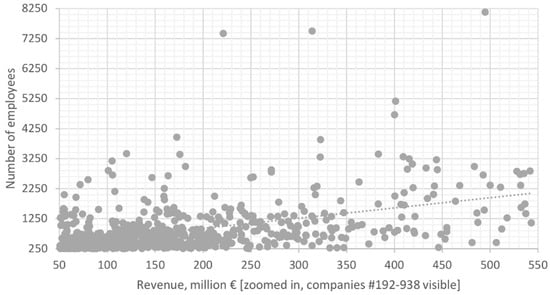
Figure 4.
Number of employees in all large companies according to company revenue for 2016 (or most recent data), zoomed in. Companies with maximum revenue of €550 million in 2016 (or most recent year) visible, i.e., #192-938 in the list when ranked by descending revenues.
The revenue, rather than total assets, in this case was also the best available proxy extracted from the company database, and this has also been used for sample selection in similar studies, for example, that of Hörisch, Johnson and Schaltegger [46]. Furthermore, revenue and the number of employees is used by the EU as a criterion to distinguish SMEs from larger companies.
The survey was carried out from October until mid-December 2017 using an online tool with a personalized access code for each company. The invitation e-mails were sent to the company contact addresses or to sustainability contact address, if these were mentioned on the homepage. To increase the number of responses, the companies received a reminder e-mail, reiterating the invitation to participate. During the invitation process, 32 companies could not be contacted because the contact details were invalid, and forty reported sharing the same CSR strategy with another company on the list, which had not been identified in the initial ownership analysis (“doubles”). After this initial phase, 566 companies were sent a valid access code which allowed them to fill out the survey (Table 4). In total, 57 companies participated in the survey. A dataset of 51 valid surveys (i.e., 9.01% response rate) were identified after removing empty entries and companies that had revenues that were too high. The latter had been falsely selected because the revenue data in the database was outdated. Additionally, fifty companies declined participation due to company policy (n = 7), lack of time (n = 23), nothing to report (n = 4) or named no particular reason (remainder), whereas 34 companies opened the survey link, but never completed the survey.
Table 4.
Data collection statistics.
3.3. Data Analysis Procedure
Results are presented using descriptive statistics. In some cases, the use of a five-point ordinal scale enabled the respondent to assign a positive or negative value to the listed items. The results of the preliminary data analysis showed that using mean values in this case kept the authors from making any meaningful statements on the rated items, and the use of frequency tables on with high-/low-end evaluations was more reasonable. Given the heterogeneous profiles of the companies, relatively small sample size and ordinal scales used in the most of the questions, the results of the cluster analysis and correlation analysis turned out to be insignificant. However, some group comparisons were possible and significant.
Histograms were used to determine whether the data distribution would allow the use of mean rank comparisons in non-parametric tests. The Kruskal-Wallis test was then performed to conduct a multiple pairwise analysis of variance between more than two groups in certain cases, namely, when the answers were expected to have different distributions between groups based on hypotheses developed from existing literature and the results of the descriptive analysis [47] (p. 232). The null hypothesis of the Kruskal-Wallis test is that the group distributions were the same. Asymptotic significances (two-sided tests) are displayed with a significance level of 0.05. A Dunn-Bonferroni post hoc method was used for this test, adjusting the significance levels for multiple tests [48].
4. Results
In the first section of the results, the results of the analyses of the variety of the companies are presented. In the second section, the results are structured according to the three aspects used to address the research question: the change agents, motivation/drivers and outcomes/themes of sustainability integration in company.
4.1. Companies Reached in the Survey
4.1.1. Company Size
The surveyed companies had 250–7385 employees and €51–293 million in revenues in 2016 (or the most recent data), and thus covered the range of companies targeted quite well (see Figure 5 and Figure 6). The revenues and numbers of employees grew in an approximately linear manner. Three outliers with large numbers of employees and relatively low revenues were identified among the survey responses. These three companies operated respectively in integrated facility services, integrated services such as catering and safety and the theatre business, and could have many part-time employees and lower revenues due to specific aspects of their business. The revenue per employee ranged from €94,148 to 569,226 with a median of €205,000 and mean of €221,628. When the three outliers were omitted, the mean increased to €233,067.
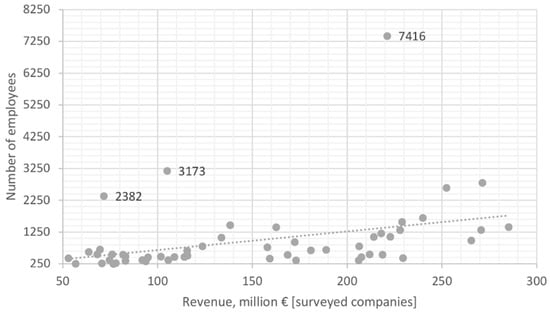
Figure 5.
Surveyed companies. Number of employees compared to revenue in 2016 (or the most recent data). The three outliers are integrated services and theatre businesses.
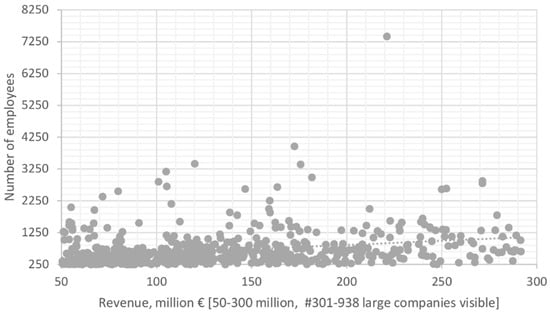
Figure 6.
Targeted smaller large-sized Austrian companies. Number of employees compared to revenue in 2016 (or the most recent data).
4.1.2. Sector
Considering the limited number of responses, the distribution of the companies across the sectors reached in survey represents the distribution across the sectors within the population relatively well (see Table A2 in Appendix B). The ÖNACE 2008, Austrian version of the “Statistical Classification of Economic Activities in the European Community” [49], was used for the categorization.
4.1.3. Types of Companies
Groups of type of core business activities were analyzed based on the expectation that these also have different types of sustainability management processes (Table 5). Based on this categorization, the manufacturing and servicing group was slightly underrepresented, and there was lack of responses from holdings/banks/insurance companies. The results of the hierarchical cluster analysis did not reveal any other useful groupings for the analysis of the results.
Table 5.
Grouping based on core business as reported by survey respondents.
4.2. Change Agents and Organizational Units
4.2.1. Survey Respondents and Existence of CSR Department/Team
The survey was addressed to the persons responsible for sustainability management in the company and, therefore, reached persons in the top management (17.6%) or CSR/sustainability (incl. EHS/environment/ occupational safety) employees (17.6%) (in further text CSR/sustainability). An equal number of answers came from people working in quality control, personnel/HR and other (multiple) departments (11.8% each) (Table 6).
Table 6.
Organizational units of respondents reached by the survey.
In multiple questions about the organizational departments, 78.4–86.3% of the companies rated the CSR/sustainability department’s involvement in sustainability activities. Since respondents from such departments answered the survey questions in only in 17.6% of cases, one of three propositions could explain the observed variation:
- The CSR “team” is embedded in other organizational units;
- The CSR lead is in another (holding) company; therefore, the influence is rated in some cases, but a separate organizational unit does not exist in the company;
- The representative of the CSR department was not willing or not allowed to answer the survey, and thus, a representative of another department responded.
4.2.2. Impact of Organizational Units
Companies could rate the impact of organizational units on sustainability implementation using a scale with both positive and negative values (1 = inhibiting–5 = promoting impact). The use of average values could cancel out opposite valuations by company representatives; thus, the summary of sustainability promoting (values 4–5) and inhibiting (values 1–2) organizational units is presented (Table 7).
Table 7.
Impact of organizational units on sustainability implementation in the company. Rated as promoting (values 4–5) or inhibiting sustainability implementation (values 1–2) by the percentage of companies.
The positive impact was most frequently assigned to top management and CSR/sustainability departments; four out of five companies agreed on the statement. PR/communication, procurement/purchasing, marketing, strategic planning and HR/personnel department had positive impacts on sustainability implementation in about three out of five companies. These could be the departments where the change agents are located, driving the sustainability management activities.
The ratings were not so unanimous for most inhibiting organizational units. The finance department was frequently seen as inhibiting sustainability implementation (35.5% inhibiting), whereas 19.6% of companies rated this department as promoting. Similar contradictions can be seen in the ratings of the financial and management accounting (27.5% inhibiting vs. 19.6% promoting), procurement/purchasing (23.5% vs. 62.7%), employee council (15.7% vs. 39.2%) and logistics/distribution (13.7% vs. 43.1%) departments. These findings are probably related to the roles and workloads that each department have in sustainability management. The implications of these findings are discussed in Section 5.
Since the companies had different core businesses, the roles of the organizational units were expected to vary according to the core business activities. This hypothesis was tested using a Kruskal-Wallis test and the Dunn-Bonferroni post hoc method [47,48]. The results show statistically significant differences with respect to how the companies valued the impacts of organizational units, based on their own core business (Gp1, n = 24: manufacturing, Gp2, n = 11: service, Gp3, n = 9: manufacturing and service, Gp4, n = 7 retail). The hypothesis that service and manufacturing companies should differ the most was not supported. Instead, most of the differences were found between service and retail companies, and, additionally, some differences were found between retail-manufacturing and retail-manufacturing and service companies. The summary of the test results and the pairwise comparisons of groups can be seen in Table A3 and Table A4 in Appendix C. The answers varied for the eight organizational units: R&D, manufacturing, logistics/distribution, quality control, investor relations, finance, financial and management accounting and strategic planning. Similar group differences also appeared when the question on organizational unit involvement in sustainability implementation was evaluated. Given the small sample size, more detailed statements about these differences could not be made. Further data on few group comparisons are not presented but are available upon request. Nevertheless, the group division based on the core business shows that authors of past studies may have ignored or summed up significant and contradictory values given by different business groups.
4.2.3. Involvement of Organizational Units
CSR/sustainability, top management, marketing, strategic planning and procurement/purchasing were shown to be moderately/strongly involved in sustainability implementation (Table 8). These are also between the departments with the most positive impact on sustainability (discussed above). The finance and financial and management accounting departments were identified as inhibitors of sustainability implementation. Our data show that these two departments are usually not involved at all or only moderately involved in promoting sustainability (company answers quite evenly distributed), but strongly involved in 5.9% of companies.
Table 8.
Organizational units that are the most strongly involved in sustainability implementation (1 = not involved to 5 = strongly involved, values 4–5) by the percentage of companies.
4.2.4. Country Comparison
If the differences among the groups are put aside for a moment, and the average values for the whole sample are calculated, the results can be compared with those of the Sustainability Barometer study on the largest companies in Germany [21]. Even though these two studies lie five years apart, and target companies of different sizes and origin (largest in Germany vs. smaller large-sized companies in Austria), the average values of the values assigned to the organizational units are remarkably close in both comparisons.
In Figure 7, which reviews the impact of various organizational units on sustainability management, it can be seen that PR/corporate communication, investor relations and legal department/compliance are rated slightly higher in Germany than in Austria. In Austria, 49% of the companies reported having no investor relations department. This could be related to differences in company size; the need for these departments is not firmly established in Austrian companies. The necessity for these departments and their involvement grows as the size of companies increases. Likewise, involvement of the organizational units was rated similarly both by Austrian and German companies (Figure 8), whereas the personnel department/HR, PR/corporate communication and top management scored higher in the German companies. These similarities could indicate that more inert and stable company structures develop with time, and more homogenous processes appear after the companies have reached a certain size.
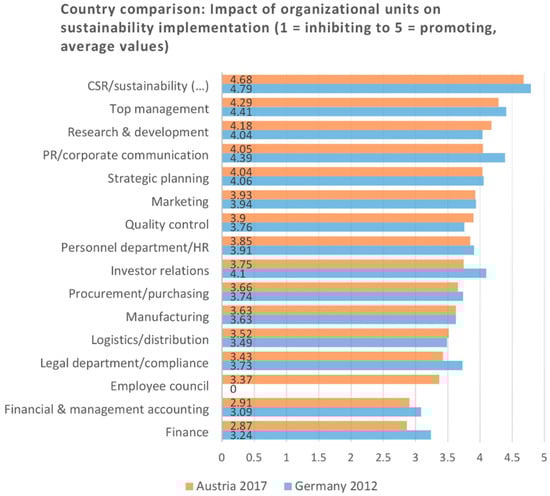
Figure 7.
Impact of organizational units on sustainability implementation. Comparison between results from the largest companies in Germany [21] (p. 32) and results from the smaller large-sized companies in Austria in 2017.
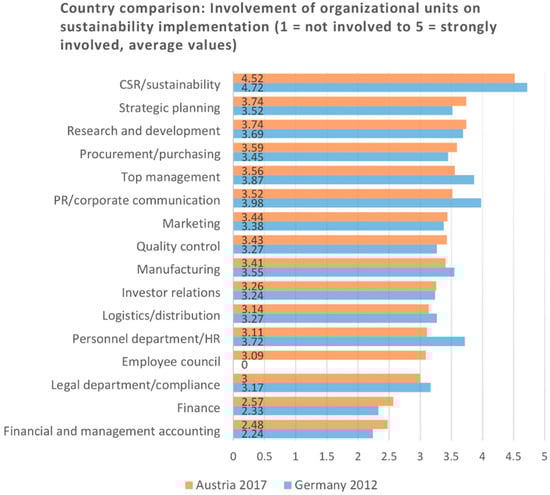
Figure 8.
Involvement of organizational units in sustainability implementation. Comparison between results from the largest companies in Germany [21] (p. 32) and results from the smaller large-sized companies in Austria in 2017.
4.2.5. Project Phases and Organizational Units
Project management phases often overlap in practice. However, to identify the main role of each organizational unit in sustainability management, the companies in the survey were enabled to assign just one main phase/task of project management to each organizational department (Figure 9).
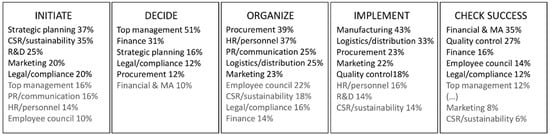
Figure 9.
Project phases in which organizational units are involved most frequently (each organizational unit could be assigned just to one project phase) by percentage of companies.
The majority of the company representatives reported that multiple departments initiated the projects, and top management and financial department staff decided on them. The phases following the decision-making depended greatly on the project at hand, and the majority of companies assigned multiple organizational units to each of the project phases, which seems logical when the interdisciplinary nature of the sustainability projects is considered. Nevertheless, it also implies that all these organizational units needed to be ready to contribute to sustainability efforts.
While strategic planning and R&D were described as important in the initiation phase, showing the strategic relevance of sustainability management, marketing seems to have been assigned a universal role throughout the project management process—from its initiation to its implementation and checking success. However, this does not necessarily indicate that sustainability management was being greenwashed. The marketing department, for example, has existed in almost every company from the early days of organized business, and its staff members deal with customer requests and market trends (including sustainability). In 35% of the companies, financial and management accounting departments evaluate the success of project. It would be interesting to determine in a future study how many non-financial sustainability measures are included in this process.
4.2.6. Managerial Support
The CEO was actively supporting the implementation of sustainability activities in about four out of five companies (82.4%, 42 companies), and the (other) chief officer or head of department was actively supporting these activities in slightly more than half of the companies (54.9%, 28 companies). In many cases, a team of two or three people at the top level (shown in Table 9) headed these activities. In one out of ten companies, there was no active support for sustainability activities from the top management level. The high number of companies with management support in the sample could have been due to a non-response bias; the companies that did not have the support of management may have chosen to decline participation in the survey, or were not allowed to participate.
Table 9.
Top management (employees) that actively support sustainability implementation by number of companies and percentage from surveyed sample.
When company representatives were asked to specify which persons in the top management actively supported sustainability implementation, a whole range of persons were named. These persons belonged to nearly every department in the companies. The head of sustainability, EHS and environmental management staff were most frequently named, but procurement/purchasing and quality management staff, authorized officers, corporate communication and chief financial officers were also repeatedly named. If we examine which types of departmental employees are actively involved in sustainability management in detail, the roles of each department in these processes become clearer (Table 10). Clearly, sustainability is a topic that can be relevant to any organizational unit, and thus, employees should be ready to engage in it.
Table 10.
Type of personnel actively supporting implementation of sustainability management.
The head of the department supported sustainability activities in the CSR/sustainability department in 58.8% of companies; non-supervisory staff, in 9.8% companies; and –specialists, in 7.8% of companies. These results would correspond with the idea companies tend to have a head of CSR/sustainability leading a cross-departmental team or specialist unit instead of having a distinct CSR/sustainability department.
4.3. Motivation, Drivers and Barriers
4.3.1. Factors Promoting and Inhibiting Sustainability Implementation
The promoting factors that were assigned the highest values for sustainability implementation were related to the organization itself and people in it (Table 11). The appropriate corporate philosophy, personal interests of employees, organizational culture and support from top management confirm and support the ideas of those who have to carry out interdisciplinary sustainability management tasks. In other words, the sustainability implementation is easier when the sustainability values are aligned with personal and organizational values. Even the customer demand for more sustainable products and services could be seen as internalized values of customers. More detailed valuations are presented in Figure 10.
Table 11.
Summary of factors most often recognized as promoting or inhibiting sustainability implementation. (1 = inhibiting to 5 = promoting, values 4–5 represented) by percentage of companies.
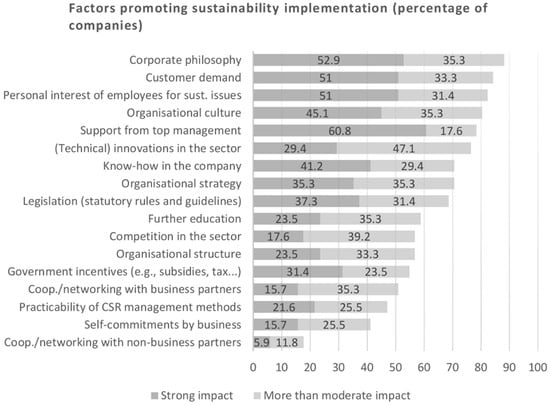
Figure 10.
Factors promoting sustainability implementation. (1 = no impact to 5 = strong impact, values 4 and 5 represented) by percentage of companies.
Companies had the chance to rate inverted positive factors as negative factors in the second part of a question. These positive and negative ratings were mainly consistent with each other. Around half of the companies rated the lack of personnel capacities, finance, top management support and know-how as strongly inhibiting sustainability implementation (see Figure 11). These results indicate that the lack of available resources for sustainability management in the company hindered sustainability implementation. Even the lack of governmental incentives can be viewed as a lack of financial resources. It was found that 17.6% of companies do not find that the lack of support from top management and lack or organizational strategy is inhibiting sustainability implementation. Perhaps the sustainability strategy is not linked to the business strategy in these companies.
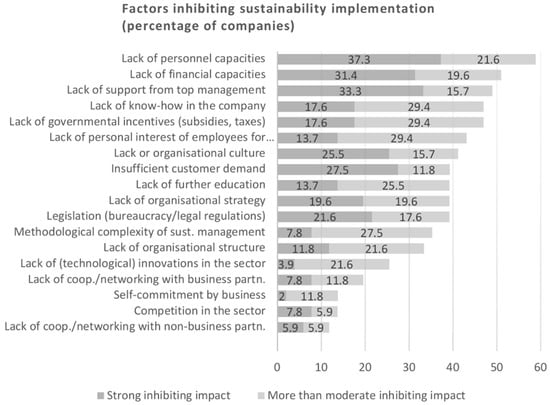
Figure 11.
Factors inhibiting sustainability implementation. (1 = no impact to 5 = strong impact, values 4 and 5 represented) by percentage of companies.
4.3.2. Stakeholders Promoting and Inhibiting Sustainability Implementation
The summary of company ratings on stakeholders (Table 12) shows that the investors and media were judged as having a positive impact on sustainability implementation in about 70% of companies. Company representatives mostly shared the opinion that certain stakeholders helped the sustainability implementation and certain ones hindered it. Competitors and NGOs seemed to play more diverse roles for the companies in question, and the assigned roles probably depended on the company’s contextual factors. For example, if company had a stable market position, competitors would potentially have been seen less as threat and more as source of new ideas or, if company faced large environmental challenges, it might not have been happy about being placed in the spotlight by an environmental NGO.
Table 12.
Summary of stakeholders promoting/inhibiting sustainability implementation in a company. (1 = inhibiting to 5 = promoting, values 1–2 and 4–5 summarized) by percentage of companies.
These results are consistent with those of studies conducted in other countries, which were identified in Section 2. For example, investors, members of the media and public, scientific organizations, competitors and NGOs were also assigned high valuations in study conducted in Germany in 2012 [21]. For a closer comparison, see Figure 12.
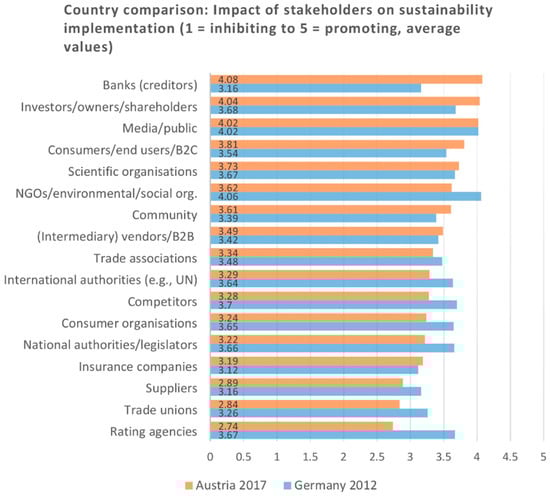
Figure 12.
Impact of stakeholders on the implementation of sustainability in the company (1 = inhibiting to 5 = promoting), average values from a study on the largest German companies [21], compared to the results from smaller large-sized companies in Austria.
While Austrian companies rated banks, investors and consumers more positively in 2017 than large German companies did in 2012, the rating agencies, trade unions, consumer organizations and national authorities are a few of the stakeholders that have received higher ratings in Germany. The differences are partly explainable by the different historical and cultural importance of these stakeholders, and partly by the size factor. For example, for nearly a half of the Austrian companies rating agencies have not yet become a relevant stakeholder.
4.3.3. Impact of Sustainability Management in the Company
Companies report the reputational benefit (58.8%), employer attractiveness (37.3%) and cost reduction (29.4%) as the top three impacts of the implementation of sustainability in the company (values 4–5, where 5 is strong) (Figure 13). The companies reached the highest consensus regarding these impact factors. Only 3.9% companies saw no impact on the reputational benefit, and 9.8% of companies saw neither an impact on employee attractiveness nor cost reduction (9.8%). The companies did not reach such a strong agreement on the other effects. While 27.4% believed that implementing sustainability impacted radical innovation processes, 21.6% saw no impact. In addition, 17.6% of the companies saw no impact on business model innovation, 17.6% saw no sales increase, 15.7% saw no cost increase and 13.7% saw no collaboratively developed innovation with stakeholders.
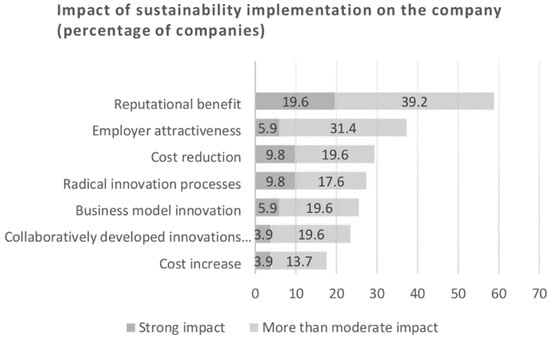
Figure 13.
Impact of implementing sustainability (1 = no impact to 5 = strong impact, values 4 and 5) by percentage of companies.
4.4. Themes Managed
4.4.1. Sustainability Management Approaches
Companies could report on the extent to which they had used the sustainability management approaches adapted from Bocken et al. [1] in the last five years or planned to do so in the next five. The most popular approaches were ‘maximizing energy efficiency’, ‘creating value from waste’ and ‘substituting with renewable and natural processes’. When the full integration or at least partial implementation in the organization is considered, these reach 94.1%, 92.1% and 78.5%, respectively (Figure 14).
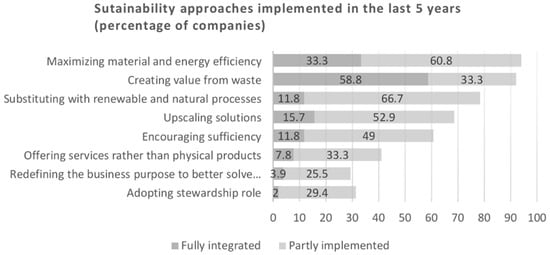
Figure 14.
Sustainability management approaches that have been fully integrated and partly implemented in the last five years by percentage of companies. Adapted from Bocken et al. [1].
The strong identification observed with these approaches could be related to the topics of material and energy use. These topics involve comparatively straightforward, cost-saving activities carried out by energy management and environmental management departments, which were established in companies long before the sustainability trend began. Around half of the companies have also partly implemented the ‘upscaling solutions’ and ‘encouraging sufficiency’ approaches, that are associated with the product or service itself. The findings on these popular approaches match those of the study by Ritala et al. [32].
Approaches that did not seem to have a primary focus in the companies were ‘redefining the business purpose to better solve the social/environmental problems’, ‘offering services rather than physical products’ and ‘adopting stewardship role.’ Nevertheless, these were partly implemented at least in one-fourth to one-third of the companies surveyed, showing some differences in comparison to study of Ritala et al. [32]. Lower popularity of these approaches could be related to less straightforward implementation as compared to energy and material efficiency measures, complications when core business is challenged, and credibility of company motives in the eyes of customers.
Looking in the near future, no large differences were seen in results compared to company current efforts. Companies have planned to concentrate on approaches related to maximizing energy and material efficiency also in the next five years (see Figure 15). More companies consider ‘adopting a stewardship role’ for the future, but otherwise, the degree of popularity of the approaches remains relatively similar (Figure 16).
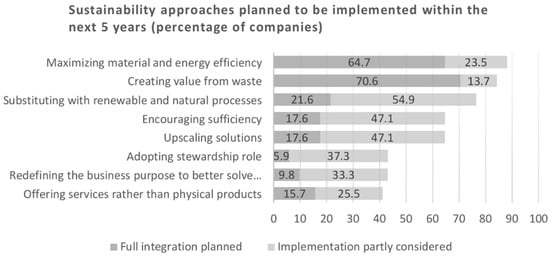
Figure 15.
Sustainability management approaches that will be fully integrated or partly implemented within the next five years by percentage of companies. Adopted from Bocken et al. [1].
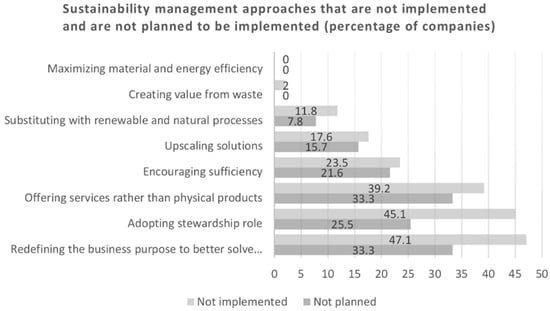
Figure 16.
Sustainability management approaches not implemented and not considered for the next five years by percentage of companies.
4.4.2. Themes Requested by Stakeholders
Economic themes were perceived in around half of the companies as being always or mostly requested by their external stakeholders, for example, innovation and infrastructure (58.9%) and secure jobs and economic growth (52.9%) (Figure 17). Health and pollution by used materials, chemicals and toxins are topics that are related to workplace safety and environmental regulations and is well established in Austrian companies. Climate compatibility, air pollution and use of renewable energy are EU-wide priorities [50] and are seen as important themes by four to five out of ten of the surveyed companies. The social themes education, gender equality and reduced inequality were also regarded as important (in one-third to one-fourth of the companies).
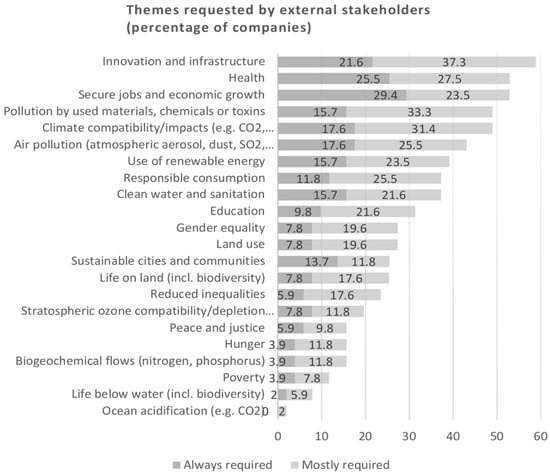
Figure 17.
Themes that were mostly or always required to be managed by external stakeholders. List based on SDGs and planetary boundaries.
4.4.3. Themes Expected to Be Relevant in the Future
Respondents were asked to name environmental and social themes that they believed would be important for their company over the next five to ten years. Many of the companies named similar environmental themes, but struggled to name social ones. The most frequently named themes were saving raw materials, energy efficiency and renewable energy, waste and waste avoidance, carbon footprint and climate change, and these themes were also mentioned in the study conducted with the Sustainability Barometer in Germany by Schaltegger et al. [21]. The most frequently mentioned social themes were the working conditions, and especially health and safety in workplace, education and training, secure jobs, flexible working hours, fair remuneration, age-equitable workplace and equal rights. For more detailed review of these themes, see Appendix D.
5. Discussion
The aim of this research was to identify a set of actors and factors that drive sustainability integration in the core business. This was done using the survey of sustainability managers and other persons responsible for sustainability issues in smaller large-sized companies in Austria. Previous studies on drivers of sustainability implementation and barriers to organizational change were used as input for the survey design. Particular focus was put on organizational units and individuals in them. The sample of smaller large-sized companies was seen as interesting for this research purpose, as companies of this size have enough resources for formalized decision-making for sustainability, yet they have largely remained unexplored, as researchers mainly focus on SMEs or the largest companies. This offered a possibility to determine, if there is an additional company size threshold within the large company group, influencing sustainability management practices (discussed in Section 5.4). This section is structured according to the three descriptive aspects: change agents and organizational units (findings summarized in Table 13), motivation and drivers (Table 14), and outcomes and themes (Table 15), used to answer the research question.
Table 13.
Summary of highlights and propositions: Change agents and organizational units.
Table 14.
Summary of highlights and propositions: Motivation and drivers.
Table 15.
Summary of highlights and propositions: Outcomes and themes.
5.1. Change Agents and Organizational Units
1. The survey respondents were identified as change agents in integrated cross-departmental sustainability management teams, and their interactions are catalysts of sustainability-oriented learning. The survey was addressed to the person responsible for sustainability management in the company. It was filled out by single persons or, in some cases, diversified cross-departmental teams (indicated in the responses). Opinions were captured from employees that represented various organizational units and management levels. After CSR/sustainability (incl. EHS/environment/occupational safety), the most often named organizational units were top management, HR, Quality control and combination of multiple departments. Three from these units were also between the top five locations for CSR managers in Belgian companies [26].
Top management staff and CSR/sustainability employees took part in the survey in 35.2% of cases. Interestingly, as many as 80% of companies provided answers about the CSR/sustainability departments during the survey, which raises the question of why the survey did not reach CSR/sustainability department in all cases. Three possible answers to this question were proposed. First, sustainability management is integrated in existing organizational units, and respondents used “CSR/sustainability department” answer in remaining questions to report on the cross-departmental CSR/sustainability “team.” Second, the CSR/sustainability department was located in a holding company and, thus, the respondent was someone in the daughter company who has a good overview of sustainability activities. Third, due to company policies, the targeted employees were not allowed to fill out the survey, and another representative completed the task.
Whether companies have added sustainability management activities to the list of operational activities performed by other organizational units for specific reasons or due to limited resources is still unclear. Either way, a variety of organizational units und hierarchical levels are involved in sustainability management in Austrian companies, and, according to Siebenhüner and Arnold [18], these interactions are catalysts for sustainability-oriented learning processes that in turn drive sustainability integration in the organization.
The answers about the type of personnel from the CSR/sustainability department actively supporting sustainability implementation show that in 58.8% of companies, the head of the CSR/sustainability department actively supported sustainability implementation; in 9.8%, non-supervisory staff; and in 7.8%, specialists. Low numbers of non-supervisory employees and specialists could reflect the CSR/sustainability department function as executive department or head of cross-departmental teams, outsourcing the necessary human resources with subject-specific knowledge from other departments.
2. The support and involvement of the top management was identified as a success factor. The CEO supported sustainability implementation actively in four out of five cases. In more than a half of these cases, other chief officer supported this managerial exercise. In contrast, one out of ten companies had no active top management support for sustainability management, which in previous studies have been identified as barrier to organizational change [13]. Half of the companies saw this lack of support from top management as an important inhibiting factor to sustainability implementation, whereas the existence of support was seen as a highly promoting factor. These findings are in line with those of Kiron et al. empirical study [39] that showed sustainability strategies with actively involved management to be the more successful ones. Whether the employees had to comply with sustainability goals set by their manager, or if these were encouraged to engage with sustainability themes according to their interest, the effect is the same: the employees of the company are exposed to and engaged in sustainability themes. This, in turn, could remove organizational change barriers such as misunderstanding and a lack of awareness by increasing participation and information flow, and thus, lead to changes in attitudes [13], increased sustainability-oriented learning [18] and changes in organizational culture [17,20,27], all of which enforce further changes that promote sustainability.
3. The organizational units that have a significant impact and involvement in sustainability implementation could be the location of (new) change agents for sustainability. Out of six departments that had a positive impact on sustainability implementation most frequently, five were also strongly involved in sustainability implementation. The top departments and organizational units that had a positive impact on sustainability implementation were the top management, CSR/sustainability, PR/corporate communication, procurement/purchasing, marketing, strategic planning and HR/personnel departments (three to four out of five companies). These departments could, hence, be the ones where change agents are located. The company representatives mainly agreed on the ratings given departments, except in case of procurement/purchasing; one-fifth of the company representatives claimed that this department inhibited sustainability implementation. This could be due to diverse nature of procurement changes that come with the efforts to increase sustainability; while some actions visibly decrease the costs, or the positive outcome is more predictable/guaranteed, the procurement will be supporting the changes. In turn, initiatives that at first require increased spending and show results in the long-term will be more likely hindered or less supported, making change agents see procurement as inhibiting factor.
4. The financial departments play a dual role. Less agreement was observed between companies when it came to rating departments that inhibit sustainability implementation. The main “inhibitors” were finance (35.3% of companies) and financial and management accounting (27.5%), and these were also assigned positive values by around one-fifth of companies. Both departments were involved in sustainability management to varying degrees, ranging from ‘not at all’ to ‘strongly involved.’ Sustainability projects have often uncertain (or delayed) payoffs. Schaltegger and Zvezdov [40] argued that employees in finance and financial and management accounting departments who have controlling functions might choose to make selective reports to decision-makers based on their own understanding and justification for the need of such sustainability projects (i.e., act as gatekeepers). Nevertheless, these two departments could assist in translating sustainability accounting information into management language for decision-makers, mediating sustainability management [40] and thus play a dual role in companies.
5. An increase of workload contributes to changes in roles, and various effects are explained by organizational inertia perspective. In cases of procurement/purchasing and logistics/distribution, these departments were also rated as both positive and negative. These departments clearly had to implement sustainability criteria as part of their daily operations, such as making sustainability assessments of suppliers or ensuring carbon neutral deliveries. We propose that the observed differences in ratings may be explained by how much change due to sustainability implementation had taken place already. As sustainability-oriented requirements are introduced, these can be interpreted as extra work. Employees of these departments might be reluctant to alter their routines, slowing down the process of meeting social and environmental challenges in the company, thus, getting the negative rating. However, when the new requirements have been integrated in the routines, the departments can positively contribute to sustainability implementation. We can related this transition from inhibiting to promoting effect back to the U-shaped effect in firm performance by changes [51]. The organizational inertia perspective explains the employees’ reluctance to change, since low level/beginning of change is accompanied by increased coordination costs, organizational conflicts and decreases in performance, as employees have to stop performing old routines and establish new ones [51]. Later on, when the level of change has increased beyond a critical point, i.e., the old routines have been disrupted and the new ones have been established, the effect of change becomes positive. Companies can then enjoy smoother processes of sustainability management. Thus, we propose that companies should recognize the level of change/adaptation within the organizational unit to support this process correspondingly, e.g., with extra resources for a period of time to balance out the negative effect on performance and reduce the risk of negative connotation of sustainability-related changes.
6. Sustainability projects require change agents. Multiple organizational units are typically involved in the project initiation phase, and the top management and finance department staff make a decision on the project in half of the cases. In later stages of project organization and implementation, the tasks are managed again in multiple departments. This type of project management, which takes place across many departments, in turn implies two things. The first is that personnel throughout the organization have to be ready to invest their time and effort to support sustainability issues, and, second, that there is a need for person(s) who coordinates the efforts across the organizational units. These persons have to keep the project objectives on the table and motivate/discipline the colleagues in order to get the work done; thus, the term ‘change agents’ for these persons seems appropriate. While it is expected that most change agents are the team-leaders of sustainability projects (and those who responded to this survey, as described above), these are not necessarily the only change agents that promote sustainability in the company, driving sustainability-oriented learning and change.
7. Change agents multiply their impact through interactions. Survey results and previous studies confirm the obvious: companies need proactive employees which invest their efforts in sustainability projects. However, the discussion in the literature on how change agents trigger the change in whole organization remains fragmented. A process model was drafted to visualize the mechanisms and better understand how change agents could disseminate sustainability-related knowledge, experience and even values within the company, changing the organizational culture to promote sustainability (Figure 18). This model was based on our synthesis of all survey answers about organizational units and personnel involved in sustainability management, project phases, and motivation and drivers for sustainability implementation (Section 4.2 and Section 4.3) in light of previous studies.
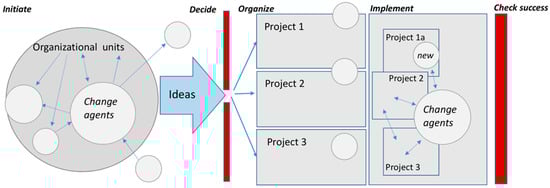
Figure 18.
Change agents and sustainability project phases. Change agents exchange information with internal and external actors, facilitating sustainability-oriented learning and organizational culture change.
During initiation phase, change agents exchange their ideas and experiences with other organizational units (blue arrows for information flow). An exchange can also take place with external stakeholders, such as investors, NGOs, or consultants. Even in cases where the company does not benefit from this dialogue directly, change agents from other organizations, such as NGOs, may choose to monitor and exercise their influence on the company, for example, through press releases. Pool of ideas for sustainability projects grows through all these interactions.
After all the ideas have been gathered, evaluated and decided upon, the projects are set up. Change agents then “own” or champion sustainability projects and do not let these projects lose their relevance when shared with multiple departments or when the project lasts longer period of time. The projects can be treated as unrelated or related and have one or more change agents as drivers. In the implementation phase, teams and tasks can start to overlap when the same organizational units take part in multiple projects or one project is managed by multiple units. Since the projects are diverse, new persons may be involved in the implementation process, and the awareness for sustainability themes increases. As persons search for necessary information and expertise to carry out the projects, their interactions with other personnel drive sustainability-related learning processes, and the chance that new change agents appear also increases. In the best-case scenario, the company becomes so responsive to the requirements of sustainability that sustainability thinking and learning grows into an organizational culture, reducing barriers to organizational change and sustainability can be integrated in the basic logic of business activities.
Even though each company has a choice of appropriate structural provisions to initiate and diffuse sustainability-related learning processes, Siebenhüner and Arnold emphasized that such learning mechanisms must be in place to enable successful collective learning and organizational change [18] (p. 347). Project phases is one example of such learning mechanisms, and in combination with the collected data on change agents, they have enabled us to draft a process model illustrating how change agents can contribute to the sustainability-related learning and organizational change processes.
5.2. Motivation and Drivers
1. The top five factors that were the most frequently recognized as drivers of sustainability implementation are rooted in personal and organizational values. Corporate philosophy and organizational culture contain set of organizational values by definition. Customer demand, personal interest of employees and support from top management represent personal values expressed in attitudes and behaviors, or in case of top management a combination of organizational and personal values. To be seen as promoting factors for sustainability implementation, this implies, of course, that these values, upon which persons in companies act, are values that support sustainable development.
These results that place strong emphasis on personnel-related factors sum up and reinforce the factors from previous studies [14,17,18,20,28,39]. It is clear, that sustainability managers and change agents can better introduce changes for sustainability in companies when company values, personal values and sustainability values are aligned. However, Hahn et al. argued that even conflicting organizational and personal identities and values can help companies change to promote sustainability via cognitive organizational reorientation, organizational creativity and organizational learning [52] (p. 237). Nevertheless, based on our survey results that support value alignment, we propose that majority of companies may be able to deal better with sustainability strategy planning and implementation when companies first have integrated sustainability values on a normative level: corporate vision, mission statement other company documents used for the guidance in decision-making and daily business [53] (p. 264). Since CEOs have strong influence on normative level, they have to be especially aware of their own value system [41]. Transposing study on CEOs, organizational culture and firm outcomes by Berson et al. [41] to the context of sustainability, if a CEO recognizes own bias towards stability, but needs a change for sustainability in the company, then consulting with or even hiring another executive with different mindset is advised [41] (p. 628).
2. The factors that were identified as most strongly inhibiting sustainability implementation could be summarized as “lack of available resources.” Companies most often rated the lack of personnel capacities, financial capacities, top management support, know-how and governmental incentives as moderately/strongly inhibiting factors, closely followed by the lack of personal interest by the employees. We propose that this perception of ‘lack of resources’ is related to organizational inertness [51] and barriers to organizational change [13], and therefore, ‘locked-up resources’ will be more appropriate term in many companies. For example, as companies have distributed resources among the departments, adding additional task of sustainability management might drain resources from another part of the company. The sustainability manager could even question some of the core business activities. Hence, implementing sustainability creates a high degree of uncertainty among personnel about how changes would alter the allocation of resources in the company, influencing them on the individual and on the organizational level. Derived from the research on barriers to organizational change by Lozano [13] (summarized in Table 2 in Section 2), we propose that companies have to align vision and strategies with sustainability goals, hence addressing the resource distribution. Furthermore, sustainability managers have to identify employees that have political power on the organizational level, and inform and involve these individuals in decision-making to reduce uncertainty and unwillingness to embrace the change. On the individual level, companies have to create and communicate clear career opportunities for the personnel that might be or feel threatened by organizational change for sustainability.
3. Most stakeholders act as sustainability promoters, especially investors and media/public. Suppliers and trade unions are often seen as inhibitors. Our results show that investors (70.6% companies) and media/public (68.6%) are the main promoting stakeholders for sustainability implementation in smaller large-sized companies, followed by scientific organizations, consumers, community and competitors and NGOs. Comparing the average values of stakeholder impact with those of International Corporate Sustainability Barometer [22], three from these top factors (NGOs, media/public and community) can be also found on the top of the list for the eleven reporting countries. The results of our study mainly correspond to the results of the study on the largest German companies in terms of how they rated their stakeholder impact [21]. Some variation, such as the more positive valuation of NGOs, international authorities and rating agencies in the German study, can be explained by the differences in institutional framework as discussed by Preuss et al. [56] and the fact that these stakeholders play increasing roles as the company size increases.
In 15–20% of companies in our sample, NGOs and competitors were also seen as inhibitors of sustainability implementation. We propose that this could be in cases where NGOs heavily criticize companies, having an impact on reputation and revenues, or when competitors start price wars, thereby reducing the profit available for reinvestment. However, most frequently, companies rated the suppliers as inhibitors of sustainability implementation (29.4%) and trade unions (25.5%). Suppliers might be resistant to accepting sustainability requirements, passed down the supply chain. In Belgium, companies had managed to implement various sustainability measures in supply chains just in 20–37% of cases [26]. Trade unions could be protecting its members and sectors to maintain stability in the sector. Preuss et al. have examined trade unions across Europe, and they find different patterns of trade unions and CSR interaction depending on the country [56]. In general, trade unions seem to favor CSR, but might be skeptical about its implementation, as they consider CSR to be too vague and too general, and it is frequently used as a corporate marketing tool. CSR can also threaten the trade union role in social dialogue and in dialogue with stakeholders, explaining why trade unions might choose to slow down, or at least not support, the CSR adoption. Given all these results, it is worthwhile to remember, that stakeholder requirements and engagement alone are not good predictors of CSR outcomes [30]; therefore, the contexts of other drivers and motivations should always be considered.
4. The impact of sustainability management serves as motivation. Companies most often recognized strong or moderate impact from sustainability implementation on reputational benefit, employer attractiveness and cost reduction. Put another way, these are clearly motivational factors for why companies manage sustainability. The results agree with the findings from the international study [22], where companies reported on the business case drivers that are most common the reason to implement sustainability measures. As the use of business cases puts the focus on financial returns, and in that way disqualifies many more activities, companies should rethink their perspective for viewing sustainability projects to be able to promote sustainable development [52].
5. Companies should overcome the focus on financial constraints, and adopting paradox perspective and increasing strategic agility is an example of one of the strategies. Taking a step back and observing the survey results as a whole, there is much focus on themes of financial sustainability, financial aspects of sustainability, and financial barriers to implementing sustainability. Sustainability management practices are aligned with traditional management practices; hence, sustainability management themes that do not bring visible or immediate returns are not attractive. To solve this problem, Hahn et al. proposed that managers should learn about the paradox of occasionally conflicting yet interrelated environmental, social and economic objectives in the company [52], i.e. adopt paradox perspective. Then managers should accept these tensions and work through them while striving to meet these objectives simultaneously [52] (p. 235) [54]. Simultaneously striving to meet these objectives instead of trying to remove the tensions will increase certainty during the process and avoid forcing an alignment of social and environmental aspects with the financial perspective [52] (p. 237). Hence, ‘Unfreezing’ or reconfiguring some of the resources required for sustainability management should become easier. One approach that could help companies manage corporate sustainability while using this paradoxical lens is to increase strategic agility as an organizational capability as proposed by Ivory and Brooks [55]. Strategic agility is achieved with organizational practices and processes that increase strategic sensitivity, collective commitment and resource fluidity (i.e., meta-capabilities). This means that companies are able to quickly respond, seize opportunities and change direction. These changes would be in line with the findings of research by Griffiths and Petrick, who argued that traditional organizational architectures are not suitable for the changes necessary to achieve social and ecological sustainability, and that companies will have to experiment with structures and systems [11] (p. 1583).
5.3. Outcomes and Themes
1. Our findings show that companies focus on established environmental and compliance themes. Top management has to create incentives to change this focus. Most companies could identify themselves using approaches ‘maximizing material and energy efficiency’, ‘creating value from waste’ and ‘substituting with renewables and natural processes’ from sustainable business model archetypes [1]. The approaches that require change in the core business are less popular as current sustainability management practices. The responses indicated that the tendencies for the short-term (i.e., next five years) will remain the same. One reason why these themes are currently in focus could be better understanding of company’s impact and responsibilities (e.g., from legal requirements) and more evident solutions, objectives, measures of success and costs as compared to social themes, e.g., equality in workplace. Another reason for preferences of environment themes could be the fact that environmental management departments have been implemented in companies for a longer period of time, and thus, departments easily identify these themes and have clear incentives to work on these. Companies are obviously inert regarding their strategies and processes. As the design of the reward system in companies gives a clear signal to its employees about the priorities of the company, we propose that this should be adjusted for sustainability goals, especially social aspects of sustainability. If no reward is put in place for using sustainability-related skills, then also respective trainings and workshops on cultural change will not have lasting effects on the company [11] (p. 1577).
2. Stakeholders often require global sustainability themes. Surveyed Austrian companies seem to be receiving similar requests from stakeholders regarding the sustainability themes as other countries around the world. As in the studies conducted in Belgium [26,38] and in Germany [21], stakeholders require innovation and infrastructure, health, secure jobs, reduced pollution and themes related to the climate. International study on the largest companies in eleven countries has shown that companies tend to focus on themes that are required by stakeholders [22]. When companies expressed their beliefs about the social and environmental themes that would be relevant to their company for the next five to ten years, most companies did not name any specific social theme, but they could always name an environmental theme. Some of the companies, however, were able to identify highly relevant social themes, such as an age-equitable workplace. Hence, our proposition is that companies should have at least equal interest in the themes that will be relevant for the company in the future as they do for the stakeholder requests.
5.4. The Role of Company Size Thresholds and Core Business Activities
This additional section summarizes the most interesting findings from our survey about the impact of company size and type of core business activities on sustainability implementation (presented in Table 16).
Table 16.
Summary of highlights and propositions: Company size and core business activities.
1. Common quantitative sampling strategies need to be questioned: group differences based on core business. As companies represent diverse sectors, the best way to account for different company activities was to create groups based on ‘type of core business activities,’ (i.e., manufacturing, service, manufacturing and service, retail, holdings/banks/insurance companies). This grouping turned out to be relevant. When the company representatives had to reflect on the impact and involvement of the organizational units in sustainability management, significant differences could be identified, particularly between service and retail companies. The limited sample size did not enable more detailed statements about these differences. However, seeing these between-group differences in the data forced us to reconsider whether the results from previous studies presented as average values are valid, if company sector or type of business activities have not been taken into account. If these between-group differences are large, averaging them can lead to spurious inferences. To address this issue, this data from our survey was presented in terms of the percentage of companies that had assigned the highest/lowest valuation to the items.
2. Established and inert structures can be identified during a country comparison after a certain company size has been reached. For the lack of better data from past studies, only average values that do not account for sectors or types of business activities of companies could be used for the comparison with the current study. Smaller large-sized Austrian companies’ valuations of impact and involvement of organizational units on sustainability implementation were strikingly similar to those of the largest German companies in 2012 [21], even though company size differences are immense, and our study was conducted five years later. Some variation in valuations that are visible in these comparisons, such as the more positive impact of the legal department/compliance and investor relations department in Germany, can be explained by the differences in company size. About half of the Austrian companies did not have such departments, and these departments become more important as company size increases.
These findings support the size threshold proposed by Siebenhüner and Arnold [18], who mostly observed radical organizational changes in medium-sized companies and incremental changes in large companies. Therefore, companies that have reached large-size threshold can use similar strategies to push for organizational change and promote sustainability. The change of organizational structures is a challenge of all large companies, and there is no additional size threshold between smaller large-sized companies and large companies.
3. Company size is not always the most important explanatory variable. Our survey results were mainly benchmarked against the results from large companies in other countries, sometimes including the data from SMEs [21,22,26,29]. This dataset showed many similarities between sustainability management in smaller large-sized companies in Austria and companies in other developed countries. Hence, company size is not always the main variable explaining the different outcomes of sustainability management. For example, Hörisch et al. [46] researched SMEs and large companies within the same study and found that knowledge of sustainability management tools is a better explanatory variable for the implementation of sustainability management tools than company size, and has three times as much impact. Given this example, it is clear that for further statements on company size as a determinant for sustainability management, more detailed studies are necessary.
6. Conclusions
Our survey on smaller large-sized companies represent two thirds of underexplored large Austrian companies, and aimed to answer the question “Who or what drives the integration of sustainability in the core business of the company?” Three descriptive aspects were used to maintain a holistic view on the companies: change agents, motivation and drivers and the outcomes of sustainability management. These findings can be used to develop better sustainability management strategies and enhance the organizational change for sustainability. The main findings of this research confirm certain propositions extracted from the literature. Sustainability issues have to be integrated in operational management and considered in all activities, routines and processes in order to develop sustainable organization [27] (pp. 88–90). Austrian companies involve various departments and management levels in sustainability implementation processes; this is exactly what is advised in the literature to facilitate sustainability-oriented learning and change [10,18,27]. Such processes need change agents that coordinate the sustainability efforts between the organizational units and motivate the colleagues. The possible locations in companies of the change agents were determined during the study. Based on all the results, we drafted a process model to visualize the mechanisms by which change agents can multiply their impact to induce the change on organizational level through interactions.
Rauter et al. emphasized the leadership aspect in small and medium-sized Austrian companies, where knowledge and values of leaders or founders have been shown to influence strategic agendas [14] (p. 152). Sustainability managers in the smaller large-sized Austrian companies rate the variables that are rooted in personal and organizational values as the main driving factors for sustainability implementation, for example, organizational culture, corporate philosophy or personal interest for sustainability. Combining these results, we see that integrating sustainability on the normative level has to be priority of companies, which then enables change agents to act [53]. The main inhibiting factors to sustainability implementation were related to the lack of resources. However, in many cases this could actually mean locked-up resources, since organizational inertness, characteristic for large companies [51], and barriers to change [13] can explain the failure of companies to redistribute the resources in favor of sustainability management. Given that the existing organizational structures and routines will only support the sustainability outcomes that can be observed today [11], the structures and routines will have to be adjusted to promote more inclusive and comprehensive sustainability theme management in companies. Employees of finance and financial and management accounting departments are already challenged with their role extensions or even dual roles in sustainability implementation processes. Considering the diversity of sustainability projects, all company employees should be aware that they might have to engage with sustainability management activities. To increase their readiness to contribute, companies should provide incentives, e.g., further education courses and clearer career opportunities, adjusting the incentive system to reward the use of sustainability-related skills, or providing extra resources in the role and routine adjustment phases.
We tested sustainable business model archetypes in a new context [1], and saw that Austrian companies have mainly implemented established environmental management measures. These are often very straightforward and result in a business case as preferred by decision-makers in companies. To broaden the management view and remove financial constraints as priority criteria for selecting sustainability activities, managers are advised to adopt paradox perspective. This perspective requires acceptance of the tensions between the interrelated economic, environmental and social objectives in company, and working through these tensions while also seeing sustainability management activities as ends in and of themselves. One strategy that can help companies to meet the ever-increasing environmental and social challenges is to increase strategic agility, i.e., the ability of the company to continuously adjust its strategies and seize opportunities.
There were a few limitations to our study. First, the small sample size did not allow us to perform detailed statistical tests such as exploratory cluster analyses. Because the survey was conducted to gain a picture of overall practices in smaller large-sized Austrian companies, a focus was not placed one type of core business (e.g., service); hence, corporate context cannot be considered and analyzed in more detail. Since company size is a common sampling criterion used in quantitative studies, it is advisable for future researchers to test the robustness of the results once the type of core business activities has been considered (e.g., manufacturing, retail, banking). Second, even though the e-mails inviting participants to take part in the study encouraged the respondents that face challenges in sustainability management to take part in the survey, companies that consider themselves to be doing well are probably overrepresented in the study. Third, due to the tradeoff between length of the survey and the response rate, only a limited number of questions could be included in the survey design to cover each of the descriptive aspects while drawing a holistic picture of sustainability management in companies.
A few propositions for further research emerge from this study. Qualitative studies, such as case studies or event studies, could be useful to understand how change agents emerge in companies and how they form an opinion about the sustainability values present in the company. The various roles of sustainability change agents could be conceptualized in certain contexts by using multiple case studies, as has been performed in the area of innovation management. Another interesting question is whether companies are aware of the benefits from having sustainability management integrated in the existing organizational departments, or whether the integration is done due to limited resources. What types of measures could be used to motivate company employees to alter their routines and to perform the “extra” work needed to include sustainability aspect in their practices? This and other questions remain to be answered. Further syntheses of research streams that address organizational inertness, such as agile organizations, sustainable human resource management, or lean management in the context of sustainability management, are proposed.
Author Contributions
Conceptualization, A.L.K. and R.J.B.; Data curation, A.L.K.; Supervision, R.J.B.; Writing—original draft, A.L.K.; Writing—review and editing, R.J.B.
Funding
The authors acknowledge the financial support by the University of Graz.
Acknowledgments
We thank all companies that participated for investing their time in this survey. We thank Stefan Schaltegger, Dorli Harms and their team in Centre for Sustainability Management, Leuphana University Lüneburg, for their efforts in the survey redesign and technical support provided during data collection. Additionally, we thank the colleagues of our institute, and especially Romana Rauter, for providing valuable input and feedback that helped us develop the concept of this study, and Sara Crockett for proofreading.
Conflicts of Interest
The authors declare no conflict of interest.
Appendix A
Table A1.
Summary of survey questions.
Table A1.
Summary of survey questions.
| Section | Measurement Scale |
|---|---|
| Company information | |
| Core business of the company | Self-description, text |
| Organizational unit where respondent works | |
| Number of employees | Ordinal variable |
| Revenue in previous financial year | Ordinal variable |
| Motivation and drivers | |
| Impact of stakeholders on sustainability implementation | 1 = inhibiting to 5 = promoting |
| What impact …(a) promoting factors/(b) inhibiting factors (similar lists) have on sustainability implementation | 1 = no impact to 5 = strong impact |
| How big is the impact of sustainability management in your company? (e.g., costs increase, costs decrease, reputation) | 1 = no impact to 5 = strong impact |
| Sustainability issues managed | |
| (Global) Issues that external stakeholders request to manage | 1 = never required to 5 = always required |
| Issues expected to be relevant in the future for the company (5–10 years) | 4 Topics can be named |
| Sustainability management approaches based on Sustainable Business Model Archetypes (Bocken et al. 2014)—Implementation in the last 5 years | Not implemented to fully implemented in the whole organization |
| Sustainability management approaches (Bocken et al. 2014)—Implementation planned in 5 years | Not considered, partly, fully integrated, not applicable |
| Organizational units | |
| Impact of organizational units on sustainability implementation | 1 = inhibiting to 5 = promoting |
| Impact of organizational units on sustainability implementation | 1 = inhibiting to 5 = promoting |
| How are organizational units involved in implementation | 1 = not involved to 5 = strongly involved |
| In what way organizational units are involved | Initiates, decides, organizes, implements, checks success, org. unit does not exist |
| Who of the management board actively supports implementation of sustainability | CEO, other chief officer, assistant (name) |
| Who inside the organizational units actively supports implementation of sustainability | Vice head of department, non-supervisory/staff, specialist, not applicable |
| Percentage of working time that organizational unit uses for sustainability management | 20% and less, 20–40%, (…) of all working time, all persons |
Appendix B
Table A2.
Sector of the companies that took part in the survey, based on the Compass Database and OENACE 2008 classification [49]. Sector weights in sample compared to weights in population (i.e., the 638 targeted companies). Highlighted sectors were not represented within this sample.
Table A2.
Sector of the companies that took part in the survey, based on the Compass Database and OENACE 2008 classification [49]. Sector weights in sample compared to weights in population (i.e., the 638 targeted companies). Highlighted sectors were not represented within this sample.
| Sector | Sample | Sample Weights, % | Population | Population Weights, % |
|---|---|---|---|---|
| (A) Agriculture, forestry and fishing | 2 | 3.9 | 2 | 0.3 |
| (B) Mining and quarrying | 0 | 0 | 2 | 0.3 |
| (C) Manufacturing | 22 | 43.1 | 236 | 37.0 |
| (D) Electricity, gas, steam and air conditioning supply | 0 | 0 | 2 | 0.3 |
| (E) Water supply; sewage, waste management and remediation activities | 1 | 2 | 2 | 0.3 |
| (F) Construction | 4 | 7.8 | 34 | 5.3 |
| (G) Wholesale and retail trade; repair of motor vehicles and motorcycles | 7 | 13.7 | 125 | 19.6 |
| (H) Transportation and storage | 1 | 2 | 18 | 2.8 |
| (I) Accommodation and food service activities | 2 | 3.9 | 5 | 0.8 |
| (J) Information and communication | 2 | 3.9 | 13 | 2.0 |
| (K) Financial and insurance activities | 1 | 2 | 52 | 8.2 |
| (L) Real estate activities | 2 | 3.9 | 10 | 1.6 |
| (M) Professional, scientific and technical activities | 6 | 11.8 | 93 | 14.6 |
| (N) Administrative and support service activities | 0 | 0 | 22 | 3.4 |
| (O) Public administration and defense; compulsory social security | 0 | 0 | 1 | 0.2 |
| (P) Education | 0 | 0 | 3 | 0.5 |
| (Q) Human health and social work activities | 1 | 2 | 16 | 2.5 |
| (R) Arts, environment and recreation | 0 | 0 | 1 | 0.2 |
| (S) Other service activities | 0 | 0 | 1 | 0.2 |
| Total | 51 | 100 | 638 | 100 |
Appendix C
Tests on group differences based on the core business of the company. The tables below include examples of the group differences that could be observed during the analysis. Due to the small sample, it is not possible to make more precise statements.
Table A3.
Test on groups differences when evaluating the impact of organizational units on sustainability implementation. Summary table of Kruskal-Wallis test statistics.
Table A3.
Test on groups differences when evaluating the impact of organizational units on sustainability implementation. Summary table of Kruskal-Wallis test statistics.
| Test Statistics a,b | ||||||||
|---|---|---|---|---|---|---|---|---|
| Research and Development | Manufacturing | Logistics/Distribution | Quality Control | Investor Relations | Finance | Financial and Management Accounting | Strategic Planning | |
| Chi-Square | 11.065 | 13.688 | 16.334 | 14.185 | 8.095 | 13.543 | 8.532 | 12.625 |
| df | 3 | 3 | 3 | 3 | 3 | 3 | 3 | 3 |
| Asymp. Sig. | 0.011 | 0.003 | 0.001 | 0.003 | 0.044 | 0.004 | 0.036 | 0.006 |
| a. Kruskal Wallis Test | ||||||||
| b. Grouping Variable: Groups based on core business | ||||||||
Table A4.
Impact of organizational units on sustainability implementation. Summary of pairwise comparisons for Kruskal-Wallis post hoc test with the Dunn-Bonferroni method.
Table A4.
Impact of organizational units on sustainability implementation. Summary of pairwise comparisons for Kruskal-Wallis post hoc test with the Dunn-Bonferroni method.
| Organizational Unit | Sample1-Sample2 | Test Statistic | Std. Error | Std. Test Statistic | Sig. | Adj.Sig. | Asymptotic Significances (2-Sided Test) |
|---|---|---|---|---|---|---|---|
| R&D | Retail-Service | 20.974 | 6.943 | 3.021 | 0.003 | 0.015 | 0.011 |
| R&D | Retail-Manufacturing and Service | 19.373 | 7.237 | 2.677 | 0.007 | 0.045 | 0.011 |
| Manufacturing | Retail-Service | 24.468 | 7.003 | 3.494 | 0.000 | 0.003 | 0.003 |
| Logistics/distribution | Retail-Service | 25.468 | 7.010 | 3.633 | 0.000 | 0.002 | 0.001 |
| Logistics/distribution | Manufacturing and Service-Service | 18.682 | 6.517 | 2.867 | 0.004 | 0.025 | 0.001 |
| Logistics/distribution | Manufacturing-Service | −16.765 | 5.279 | -3.176 | 0.001 | 0.009 | 0.001 |
| Quality control | Retail-Manufacturing and Service | 20.595 | 7.275 | 2.831 | 0.005 | 0.028 | 0.003 |
| Quality control | Retail-Service | 25.429 | 6.979 | 3.643 | 0.000 | 0.002 | 0.003 |
| Investor relations | No significance after Bonferroni correction | 0.044 | |||||
| Finance | Retail-Manufacturing | 21.292 | 6.128 | 3.474 | 0.001 | 0.003 | 0.004 |
| Finance | Retail-Service | 22.545 | 6.898 | 3.269 | 0.001 | 0.006 | 0.004 |
| Financial management and accounting | Retail-Service | 19.370 | 6.894 | 2.810 | 0.005 | 0.030 | 0.036 |
| Strategic planning | Retail-Manufacturing | 17.262 | 6.169 | 2.798 | 0.005 | 0.031 | 0.006 |
| Strategic planning | Retail-Service | 23.792 | 6.943 | 3.427 | 0.001 | 0.004 | 0.006 |
Appendix D
Table A5.
Environmental themes relevant for companies in five to ten years, categorized.
Table A5.
Environmental themes relevant for companies in five to ten years, categorized.
| Categories | Themes Named | Frequency |
|---|---|---|
| Raw materials | Save raw materials/resources, use secondary raw materials | 10 |
| Sustainable material sourcing | 3 | |
| Products | Sustainable products | 3 |
| Life cycle of goods | 2 | |
| Energy efficiency, Energy | 11 | |
| Circular economy | 1 | |
| Energy | Sustainable electricity sourcing, use of renewable energy | 6 |
| Energy self sufficiency | 2 | |
| Electricity demand due to increased technological intensity | 5 | |
| Waste | Waste, waste sorting and avoidance | 6 |
| Electronic waste | 1 | |
| Reduce plastic waste | 1 | |
| Climate change | Climate compatibility, climate protection, climate change | 6 |
| Pollution, CO2 | CO2 pollution, carbon footprint | 8 |
| Air pollution | 3 | |
| Water pollution | 1 | |
| Pollution from materials, chemicals, toxins | 2 | |
| Soil residues, fertilization | 2 | |
| Transport | Green transport | 3 |
Table A6.
Social themes relevant for Austrian companies in five to ten years, as named by respondents. Sorted by frequency.
Table A6.
Social themes relevant for Austrian companies in five to ten years, as named by respondents. Sorted by frequency.
| Themes Named | Frequency |
|---|---|
| Working conditions, Health and safety | 8 |
| Education and training, incl. Sustainability education | 6 |
| Secure jobs | 6 |
| Family-career friendly work hours, work-life balance | 5 |
| Fair remunerations | 4 |
| Age-equitable workplaces | 4 |
| Equal rights | 4 |
| Employee protection | 2 |
| Industry 4.0 | 2 |
| Wellbeing & resilience, mental health | 2 |
| Inclusion of migrants | 2 |
| Employee loyalty | 2 |
| Human rights | 2 |
| Competent personnel | 2 |
| Generational management | 1 |
| Income gap | 1 |
| Pollution load | 1 |
| Innovation and infrastructure | 1 |
References
- Bocken, N.M.P.; Short, S.W.; Rana, P.; Evans, S. A literature and practice review to develop sustainable business model archetypes. J. Clean. Prod. 2014, 65, 42–56. [Google Scholar] [CrossRef]
- Millar, C.; Hind, P.; Millar, C.; Hind, P.; Millar, C.; Magala, S. Sustainability and the need for change: Organisational change and transformational vision. J. Organ. Chang. Manag. 2012, 25, 489–500. [Google Scholar] [CrossRef]
- Rockström, J.; Steffen, W.; Noone, K.; Persson, Å.; Chapin, F.S.; Lambin, E.F.; Foley, J.A. A safe operating environment for humanity. Nature 2009, 461, 472–475. [Google Scholar] [CrossRef] [PubMed]
- Broman, G.I.; Robèrt, K.-H. A Framework for Strategic Sustainable Development. J. Clean. Prod. 2015, 140, 1–15. [Google Scholar] [CrossRef]
- Schaltegger, S.; Hansen, E.G.; Lüdeke-Freund, F. Business Models for Sustainability: Origins, Present Research, and Future Avenues. Organ. Environ. 2016, 29, 3–10. [Google Scholar] [CrossRef]
- Stubbs, W.; Cocklin, C. Conceptualizing a “Sustainability Business Model”. Organ. Environ. 2008, 21, 103–127. [Google Scholar] [CrossRef]
- Rowe, M. Reputation, Relationships and Risk: A CSR Primer for Ethics Officers. Bus. Soc. Rev. 2006, 111, 441–455. [Google Scholar] [CrossRef]
- Baumgartner, R.; Korhonen, J. Strategic thinking for sustainable development. Sustain. Dev. 2010, 75, 71–75. [Google Scholar] [CrossRef]
- Kurucz, E.C.; Colbert, B.A.; Lüdeke-Freund, F.; Upward, A.; Willard, B. Relational leadership for strategic sustainability: Practices and capabilities to advance the design and assessment of sustainable business models. J. Clean. Prod. 2017, 140, 189–204. [Google Scholar] [CrossRef]
- Sroufe, R. Integration and organizational change towards sustainability. J. Clean. Prod. 2017, 162, 315–329. [Google Scholar] [CrossRef]
- Griffiths, A.; Petrick, J.A. Corporate architectures for sustainability. Int. J. Oper. Prod. Manag. 2001, 21, 1573–1585. [Google Scholar] [CrossRef]
- Ingham, M.; Havard, C. CSR as Strategic and Organizational Change at “Groupe La Poste”. J. Bus. Ethics 2017, 146, 563–589. [Google Scholar] [CrossRef]
- Lozano, R. Are companies planning their organisational changes for corporate sustainability? An analysis of three case studies on resistance to change and their strategies to overcome it. Corp. Soc. Responsib. Environ. Manag. 2013, 20, 275–295. [Google Scholar] [CrossRef]
- Rauter, R.; Jonker, J.; Baumgartner, R.J. Going one’s own way: Drivers in developing business models for sustainability. J. Clean. Prod. 2014, 140, 144–154. [Google Scholar] [CrossRef]
- Dentchev, N.; Rauter, R.; Jóhannsdóttir, L.; Snihur, Y.; Rosano, M.; Baumgartner, R.; Nyberg, T.; Tang, X.; van Hoof, B.; Jonker, J. Embracing the variety of sustainable business models: A prolific field of research and a future research agenda. J. Clean. Prod. 2018, 194, 695–703. [Google Scholar] [CrossRef]
- Linnenluecke, M.K.; Griffiths, A. Corporate sustainability and organizational culture. J. World Bus. 2010, 45, 357–366. [Google Scholar] [CrossRef]
- Baumgartner, R.J. Organizational culture and leadership: Preconditions for the development of sustainable corporation. Sustain. Dev. 2009, 17, 102–113. [Google Scholar] [CrossRef]
- Siebenhüner, B.; Arnold, M. Organizational learning to manage sustainable development. Bus. Strategy Environ. 2007, 16, 339–353. [Google Scholar] [CrossRef]
- Aguinis, H.; Glavas, A. What We Know and Don’t Know About Corporate Social Responsibility: A Review and Research Agenda. J. Manag. 2012, 38, 932–968. [Google Scholar] [CrossRef]
- Engert, S.; Rauter, R.; Baumgartner, R.J. Exploring the integration of corporate sustainability into strategic management: A literature review. J. Clean. Prod. 2016, 112, 2833–2850. [Google Scholar] [CrossRef]
- Schaltegger, S.; Hörisch, J.; Windolph, S.E.; Harms, D. Corporate Sustainability Barometer 2012. Praxisstand und Fortschritt des Nachhaltigkeitsmanagements in den größten Unternehmen Deutschlands; Center for Sustainability Management e.V.: Lüneburg, Deutschland, 2012; ISBN 978-3-942638-26-5. [Google Scholar]
- Schaltegger, S.; Harms, D.; Hörisch, J.; Windolph, S.E. International Corporate Sustainability Barometer: A Comparative Analysis of 11 Countries; Center for Sustainability Management: Lüneburg, Germany, 2013; pp. 1–56. ISBN 9783942638388. [Google Scholar]
- Witjes, S.; Vermeulen, W.J.V.; Cramer, J.M. Exploring corporate sustainability integration into business activities. Experiences from 18 small and medium sized enterprises in The Netherlands. J. Clean. Prod. 2017, 153, 528–538. [Google Scholar] [CrossRef]
- Ortiz-Avram, D.; Domnanovich, J.; Kronenberg, C.; Scholz, M. Exploring the integration of corporate social responsibility into the strategies of small- and medium-sized enterprises: A systematic literature review. J. Clean. Prod. 2018, 201, 254–271. [Google Scholar] [CrossRef]
- European Commission. Available online: http://ec.europa.eu/growth/smes/business-friendly-environment/sme-definition_en (accessed on 1 May 2017).
- Swaen, V.; Louche, C.; Van Liedekerke, L.; Vawalleghem, D. 2015 Corporate Responsibility Barometer for Belgium. On the Road towards a Sustainable Economy in Belgium. Available online: https://theshift.be/uploads/media/5616351256256/2015CRBarometer_ENG.pdf?production-36f0f2b (accessed on 1 November 2017).
- Baumgartner, R.J.; Rauter, R. Strategic perspectives of corporate sustainability management to develop a sustainable organization. J. Clean. Prod. 2017, 140, 81–92. [Google Scholar] [CrossRef]
- Engert, S.; Baumgartner, R.J. Corporate sustainability strategy–bridging the gap between formulation and implementation. J. Clean. Prod. 2016, 113, 822–834. [Google Scholar] [CrossRef]
- Welford, R.; Chan, C.; Man, M. Priorities for corporate social responsibility: A survey of businesses and their stakeholders. Corp. Soc. Responsib. Environ. Manag. 2008, 15, 52–62. [Google Scholar] [CrossRef]
- Trapp, N.L. Stakeholder involvement in CSR strategy-making? Clues from sixteen Danish companies. Public Relat. Rev. 2014, 40, 42–49. [Google Scholar] [CrossRef]
- De Gooyert, V.; Rouwette, E.; van Kranenburg, H.; Freeman, E. Reviewing the role of stakeholders in Operational Research: A stakeholder theory perspective. Eur. J. Oper. Res. 2017, 262, 402–410. [Google Scholar] [CrossRef]
- Ritala, P.; Huotari, P.; Bocken, N.; Albareda, L.; Puumalainen, K. Sustainable business model adoption among S&P 500 firms: A longitudinal content analysis study. J. Clean. Prod. 2018, 170, 216–226. [Google Scholar] [CrossRef]
- Kurucz, E.C.; Colbert, B.A.; Wheeler, D. The Business Case for Corporate Social Responsibility. In The Oxford Handbook of Corporate Social Responsibility; Crane, A., McWilliams, A., Matten, D., Moon, J., Siegel, D., Eds.; Oxford University Press: Oxford, UK, 2008; pp. 83–112. ISBN 9780199211593. [Google Scholar]
- Schaltegger, S.; Freund, F.L.; Hansen, E.G. Business cases for sustainability: The role of business model innovation for corporate sustainability. Int. J. Innov. Sustain. Dev. 2012, 6, 95–119. [Google Scholar] [CrossRef]
- Heiskanen, E.; Thidell, Å.; Rodhe, H. Educating sustainability change agents: The importance of practical skills and experience. J. Clean. Prod. 2016, 123, 218–226. [Google Scholar] [CrossRef]
- Visser, W.; Crane, A. Corporate Sustainability and the Individual: Understanding What Drives Sustainability Professionals as Change Agents. SSRN eLibrary 2010, 1–36. [Google Scholar] [CrossRef]
- Broman, G.; Robèrt, K.H.; Collins, T.J.; Basile, G.; Baumgartner, R.J.; Larsson, T.; Huisingh, D. Science in support of systematic leadership towards sustainability. J. Clean. Prod. 2017, 140, 1–9. [Google Scholar] [CrossRef]
- Business & Society Belgium. 2011 Barometer of Social Responsibility. Sustainable Development Firmly Rooted in Companies in Belgium. Available online: http://www.csr360gpn.org/uploads/files/resources/BSB_Barometer2011_EN_DEF.pdf (accessed on 1 November 2017).
- Kiron, D.; Unruh, G.; Reeves, M.; Kruschwitz, N.; Rubel, H.; ZumFelde, A.M. Corporate Sustainability at A Crossroads. MIT Sloan Manag. Rev. 2017, 58, 1–27. [Google Scholar]
- Schaltegger, S.; Zvezdov, D. Gatekeepers of sustainability information: Exploring the roles of accountants. J. Account. Organ. Chang. 2015, 11, 333–361. [Google Scholar] [CrossRef]
- Berson, Y.; Oreg, S.; Dvir, T. CEO values, organizational culture and firm outcomes. J. Organ. Behav. 2008, 29, 615–633. [Google Scholar] [CrossRef]
- Naidoo, M.; Gasparatos, A. Corporate Environmental Sustainability in the retail sector: Drivers, strategies and performance measurement. J. Clean. Prod. 2018, 203, 125–142. [Google Scholar] [CrossRef]
- Bidmon, C.M.; Knab, S.F. The three roles of business models in societal transitions: New linkages between business model and transition research. J. Clean. Prod. 2018, 178, 905–916. [Google Scholar] [CrossRef]
- Yip, A.W.H.; Bocken, N.M.P. Sustainable business model archetypes for the banking industry. J. Clean. Prod. 2018, 174, 150–169. [Google Scholar] [CrossRef]
- Liew, W.; Adhitya, A.; Srinivasan, R. Sustainability trends in the process industries: A text mining-based analysis. Comput. Ind. 2014, 65, 393–400. [Google Scholar] [CrossRef]
- Hörisch, J.; Johnson, M.P.; Schaltegger, S. Implementation of Sustainability Management and Company Size: A Knowledge-Based View. Bus. Strategy Environ. 2015, 24, 765–779. [Google Scholar] [CrossRef]
- Pallant, J. SPSS Survival Manual: A Step by Step Guide to Data Analysis Using IBM SPSS, 6th ed.; Allen & Unwin: Crows Nest, Austrialia, 2016; pp. 203–238. ISBN 9781760291952. [Google Scholar]
- Holm, S. A simple sequentially rejective multiple test procedure. Scand. J. Stat. 1979, 6, 65–70. [Google Scholar]
- Statistics Austria. OENACE 2008—Structure. Available online: http://www.statistik.at/KDBWeb/kdb_VersionAuswahl.do?KDBtoken=null&versID=10438&sprache=EN (accessed on 1 August 2018).
- EUR-Lex. Available online: https://eur-lex.europa.eu/eli/reco/2003/361/oj (accessed on 15 September 2018).
- Chen, M.; Yang, Z.; Dou, W.; Wang, F. Flying or dying? Organizational change, customer participation, and innovation ambidexterity in emerging economies. Asia Pac. J. Manag. 2018, 35, 97–119. [Google Scholar] [CrossRef]
- Hahn, T.; Figge, F.; Pinkse, J.; Preuss, L. A Paradox Perspective on Corporate Sustainability: Descriptive, Instrumental, and Normative Aspects. J. Bus. Ethics 2018, 148, 235–248. [Google Scholar] [CrossRef]
- Baumgartner, R.J. Managing corporate sustainability and CSR: A conceptual framework combining values, strategies and instruments contributing to sustainable development. Corp. Soc. Responsib. Environ. Manag. 2014, 21, 258–271. [Google Scholar] [CrossRef]
- Hahn, T.; Pinkse, J.; Preuss, L.; Figge, F. Tensions in Corporate Sustainability: Towards an Integrative Framework. J. Bus. Ethics 2015, 127, 297–316. [Google Scholar] [CrossRef]
- Ivory, S.B.; Brooks, S.B. Managing Corporate Sustainability with a Paradoxical Lens: Lessons from Strategic Agility. J. Bus. Ethics 2018, 148, 347–361. [Google Scholar] [CrossRef]
- Preuss, L.; Gold, M.; Rees, C. (Eds.) Corporate Social Responsibility and Trade Unions: Perspectives Across Europe; Routledge: London, UK, 2015; ISBN 9780415856812. [Google Scholar]
© 2019 by the authors. Licensee MDPI, Basel, Switzerland. This article is an open access article distributed under the terms and conditions of the Creative Commons Attribution (CC BY) license (http://creativecommons.org/licenses/by/4.0/).