Mathematical Analysis of Environmental Effects of Forming a Platoon of Smart Vehicles


Abstract
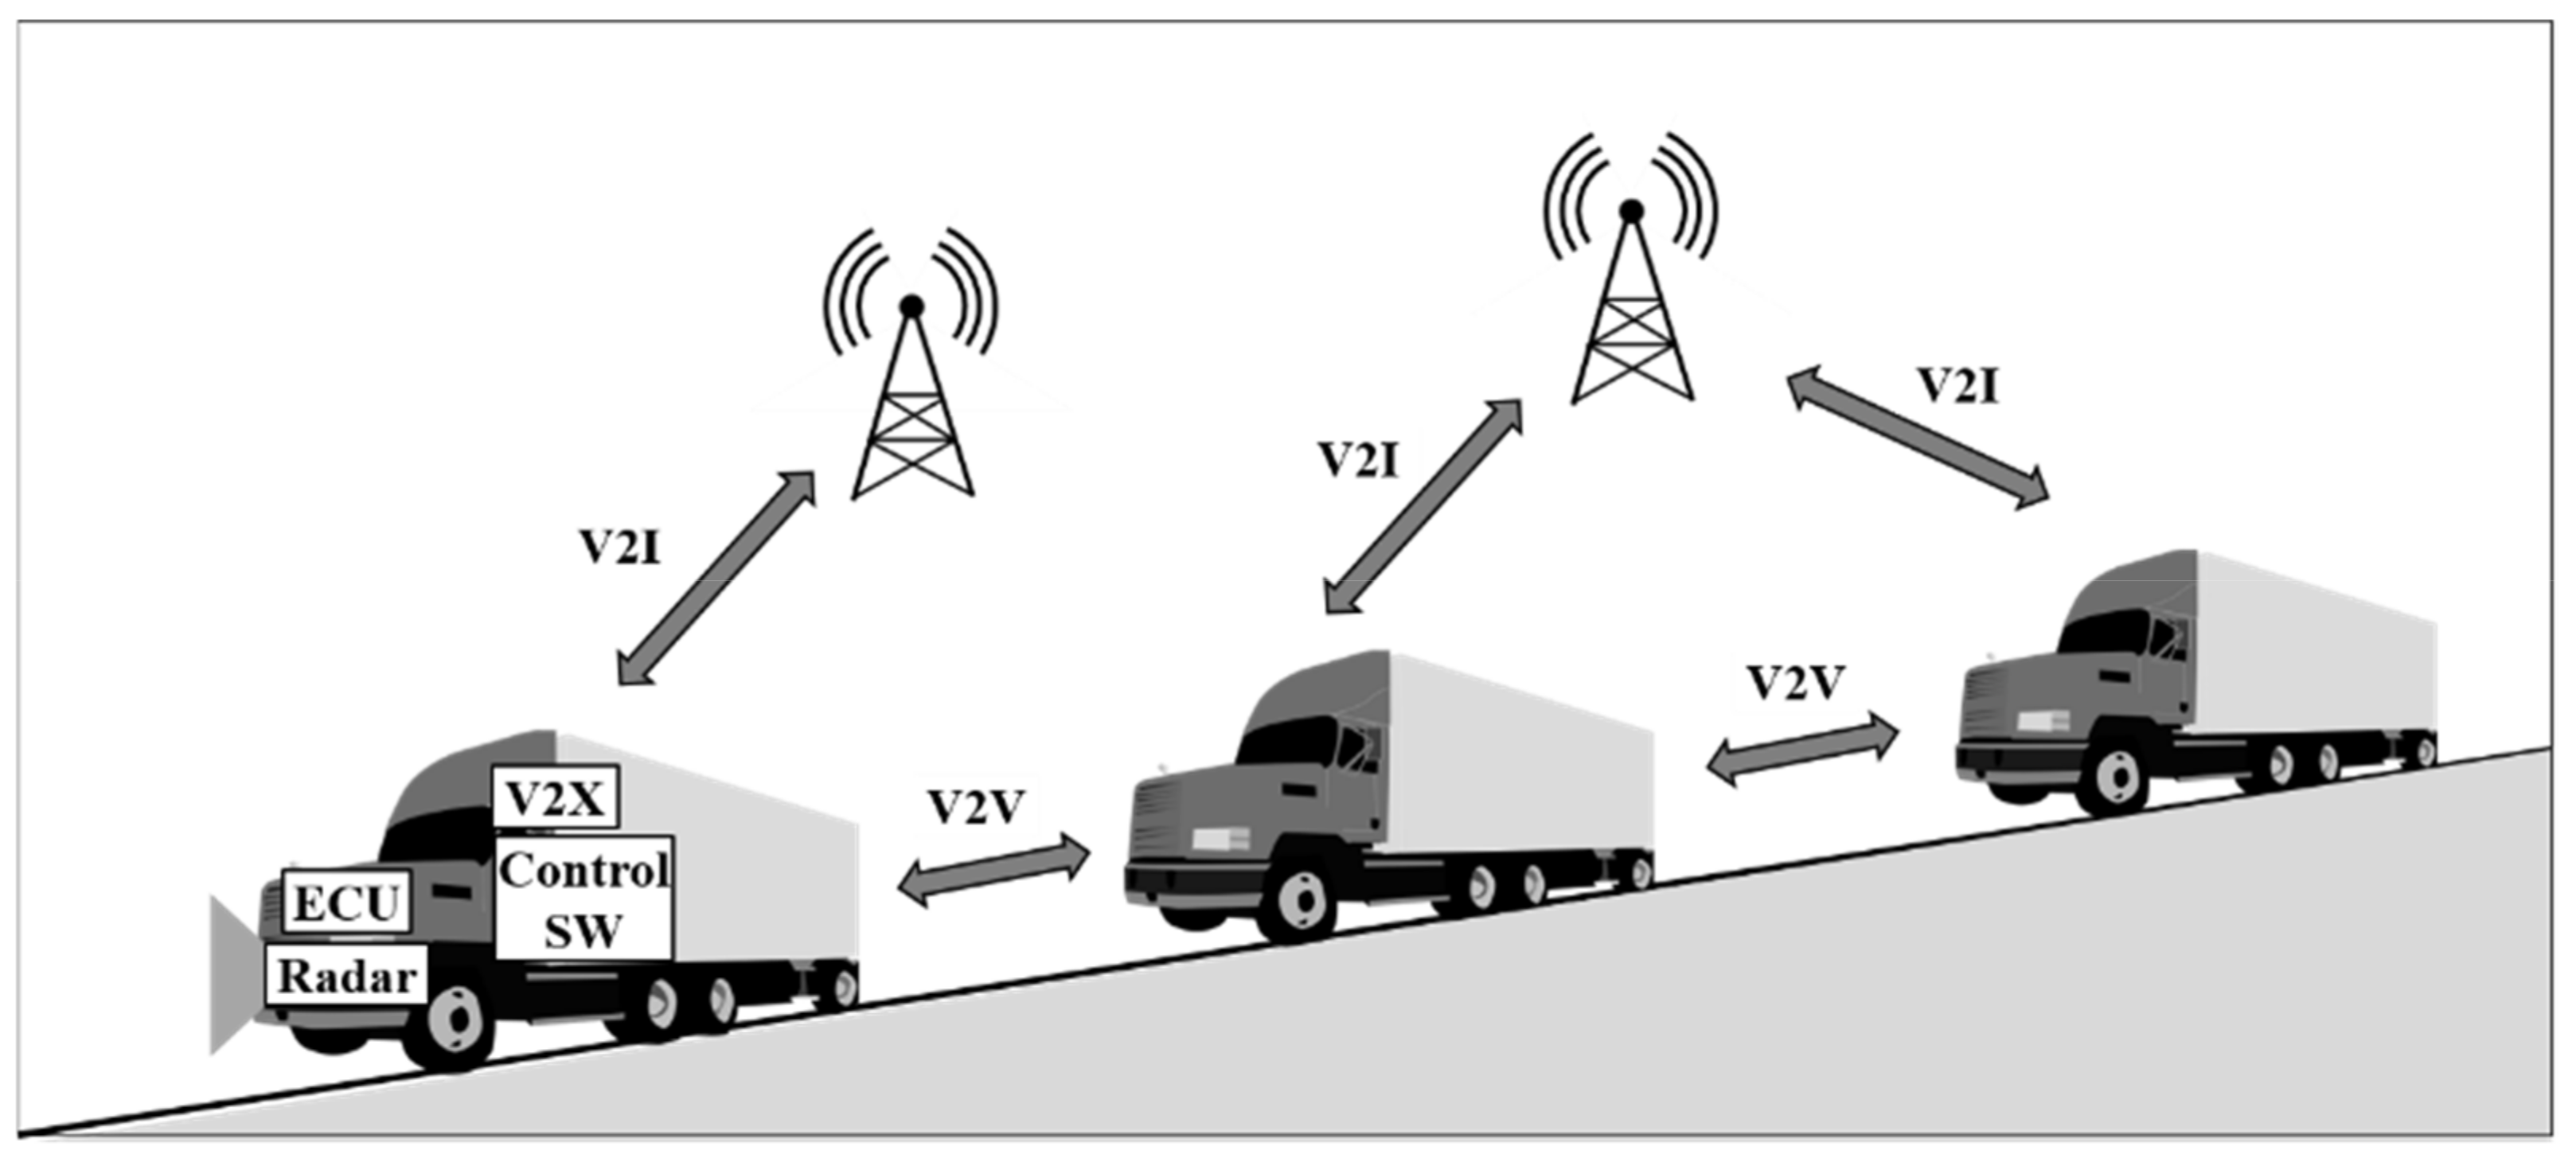
:1. Introduction
2. Literature Review
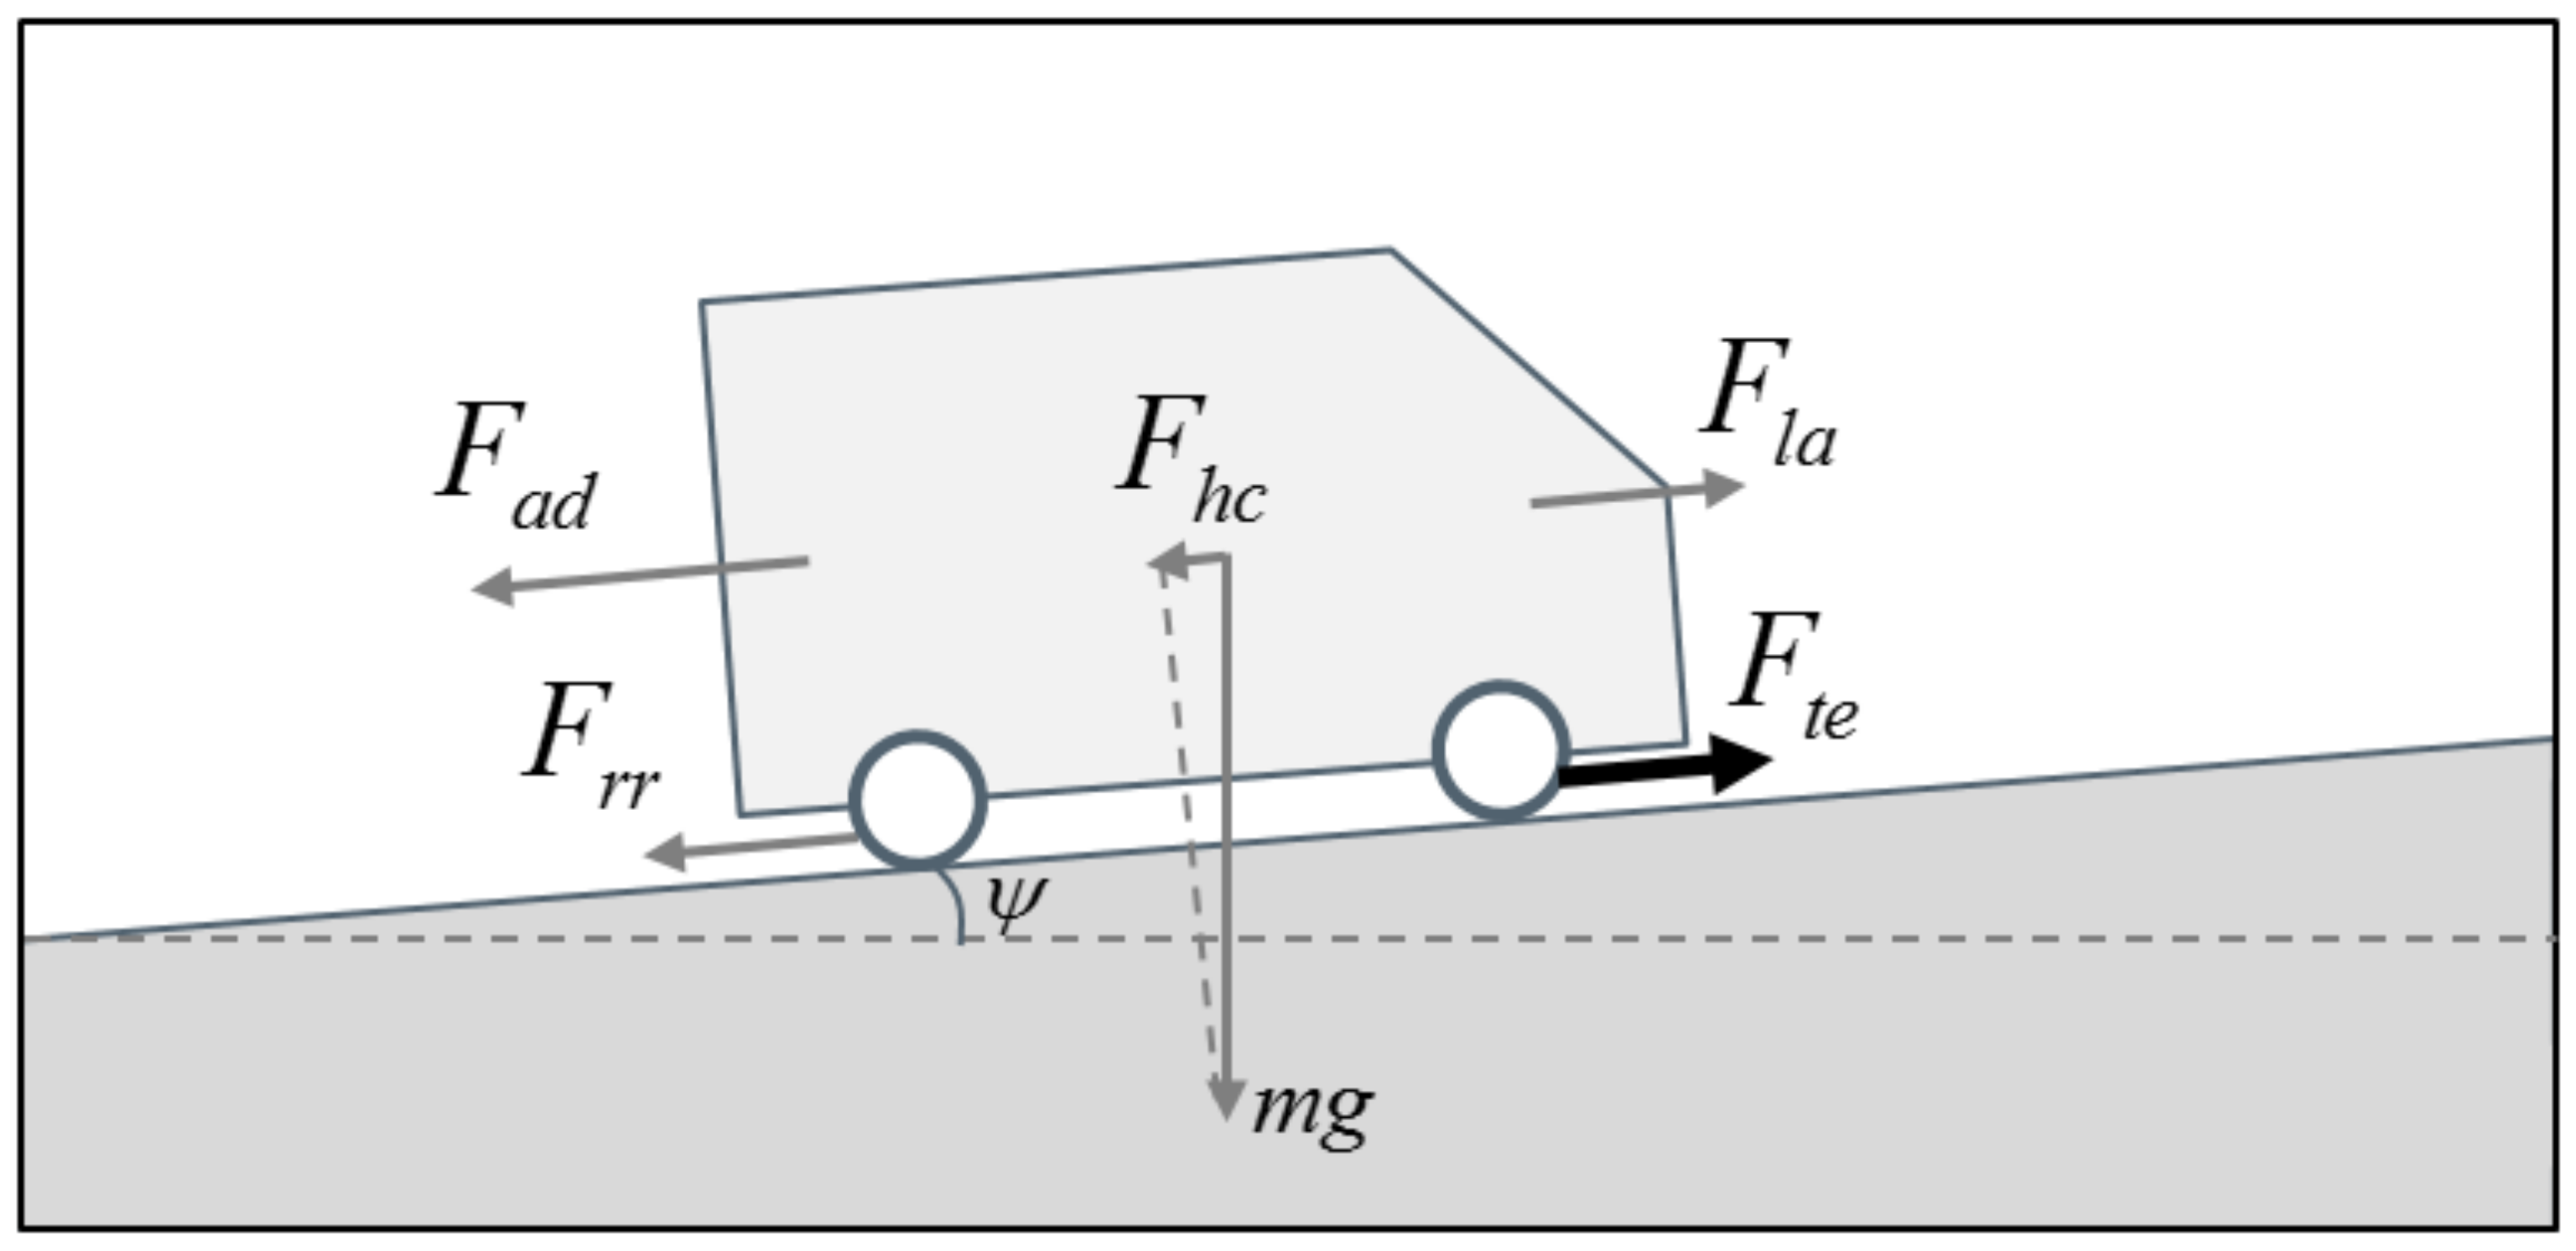
3. Power Modeling
4. Mathematical Experiment Design
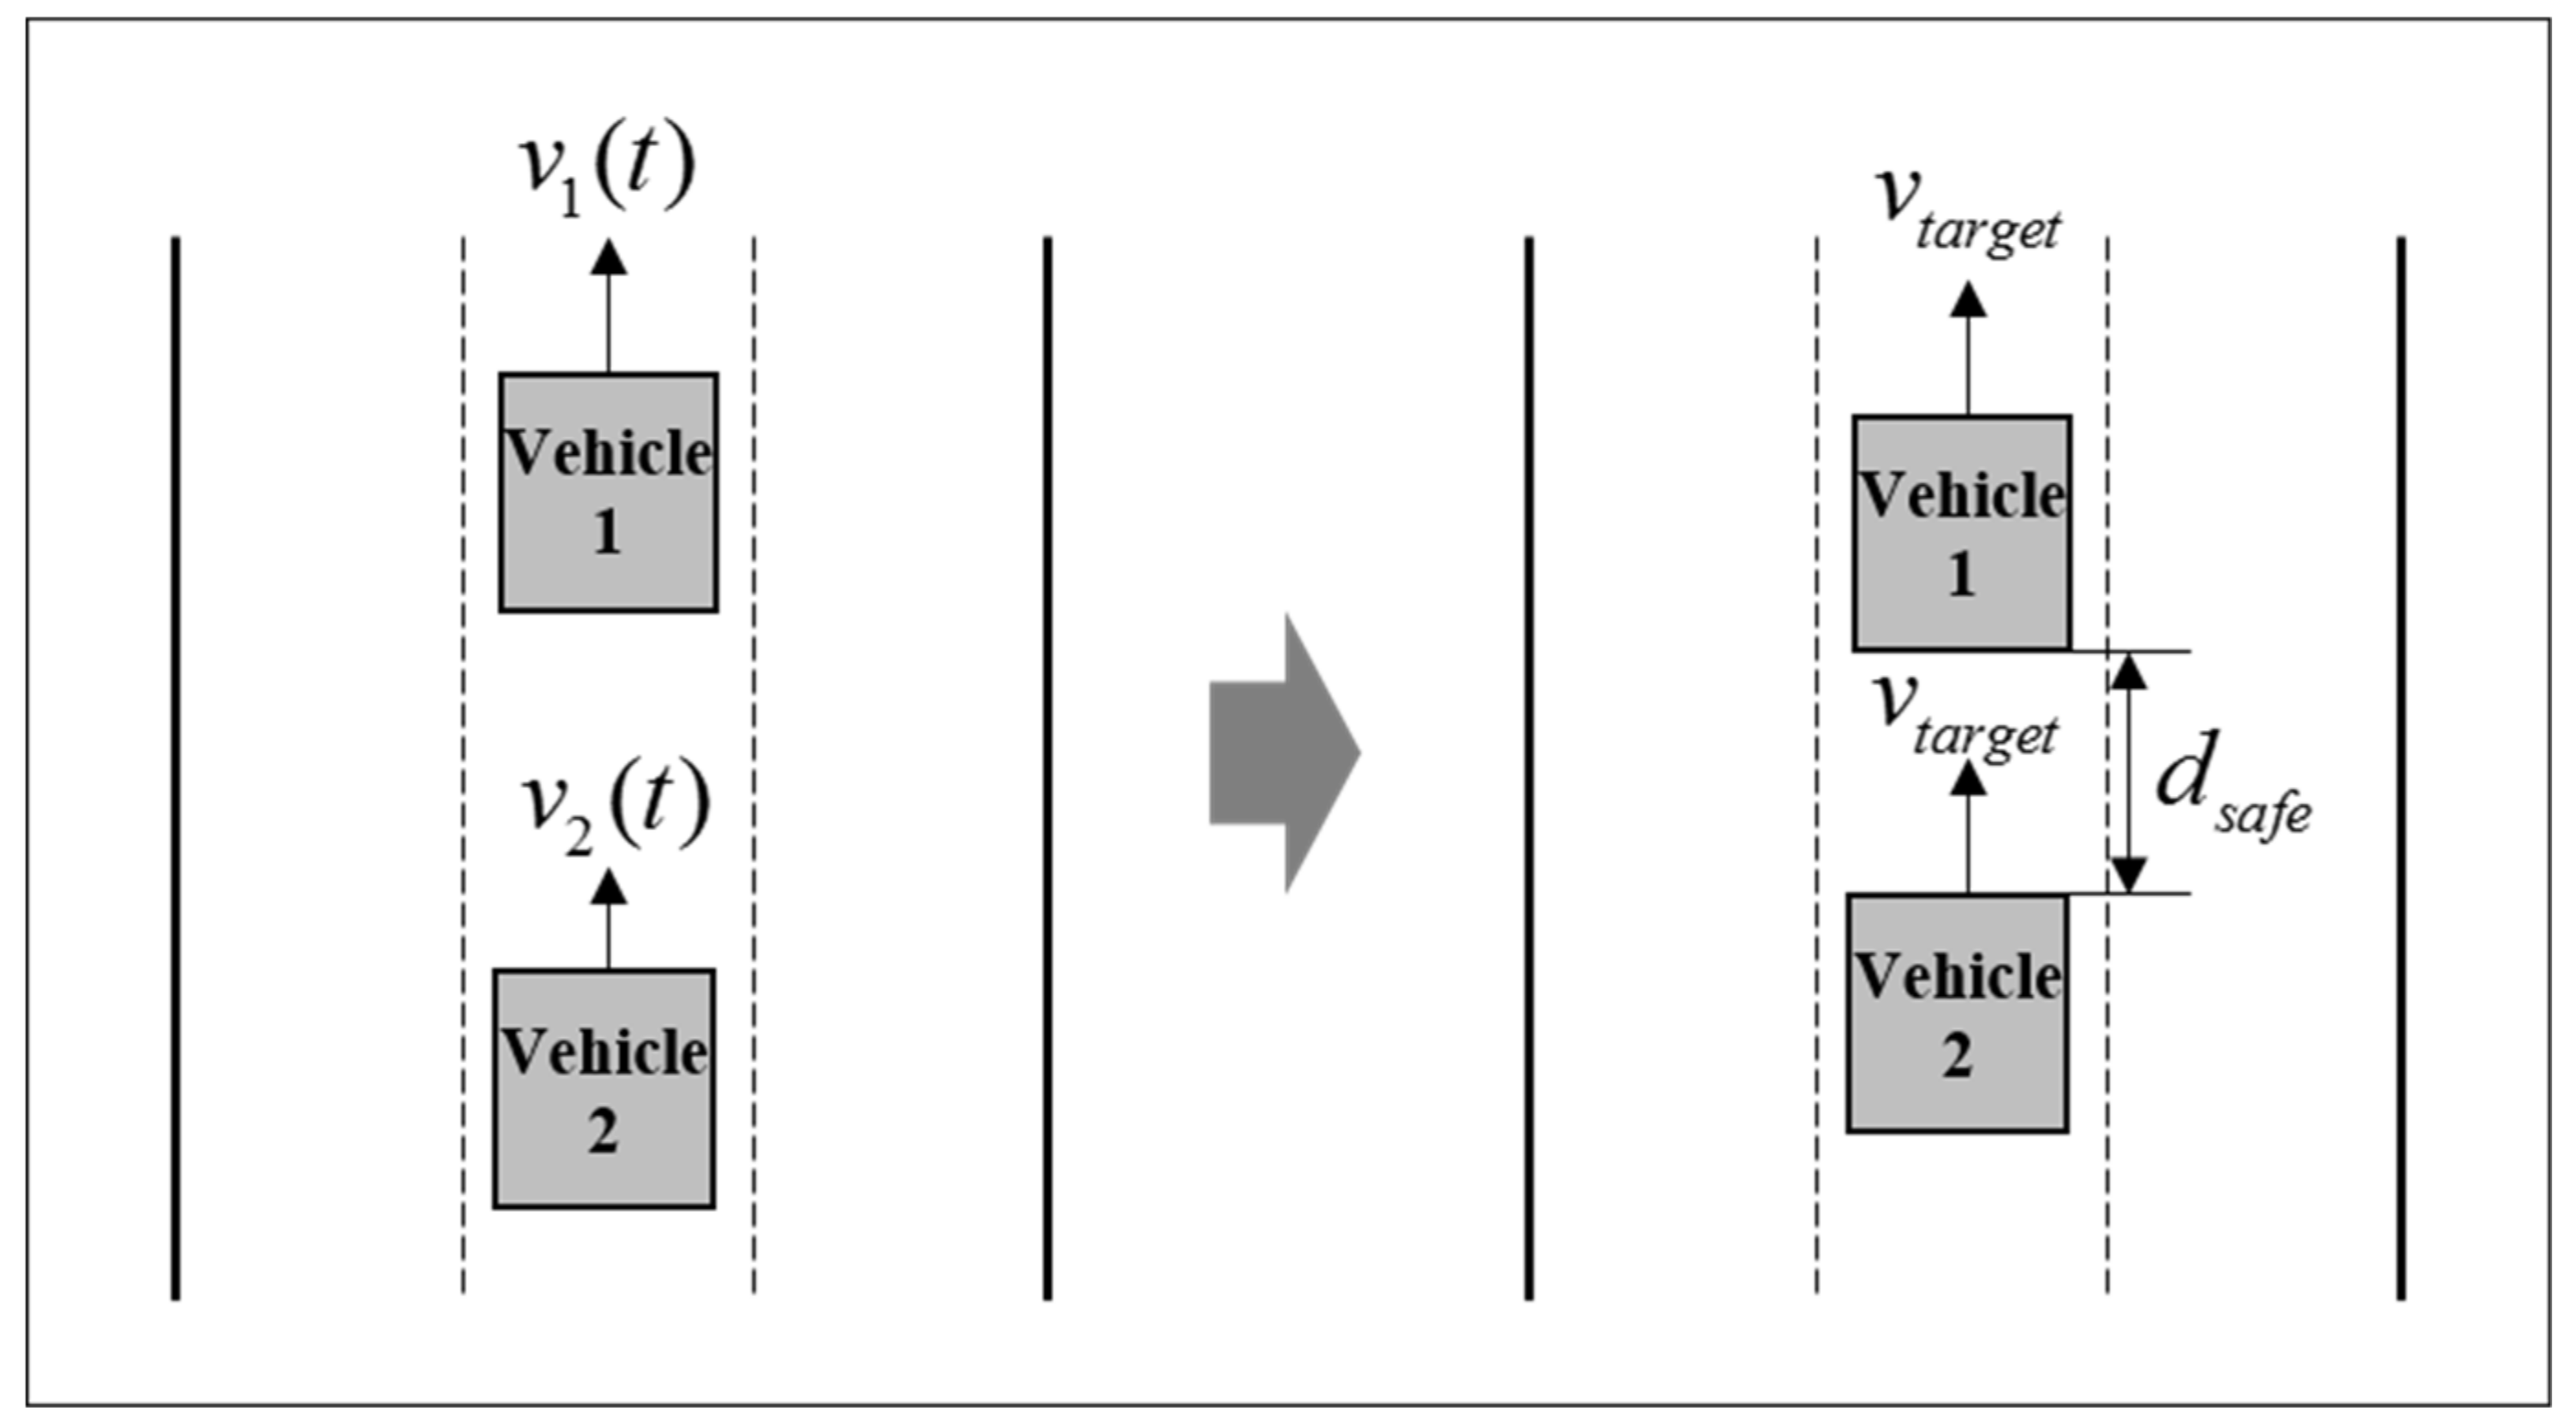
4.1. Basic Design
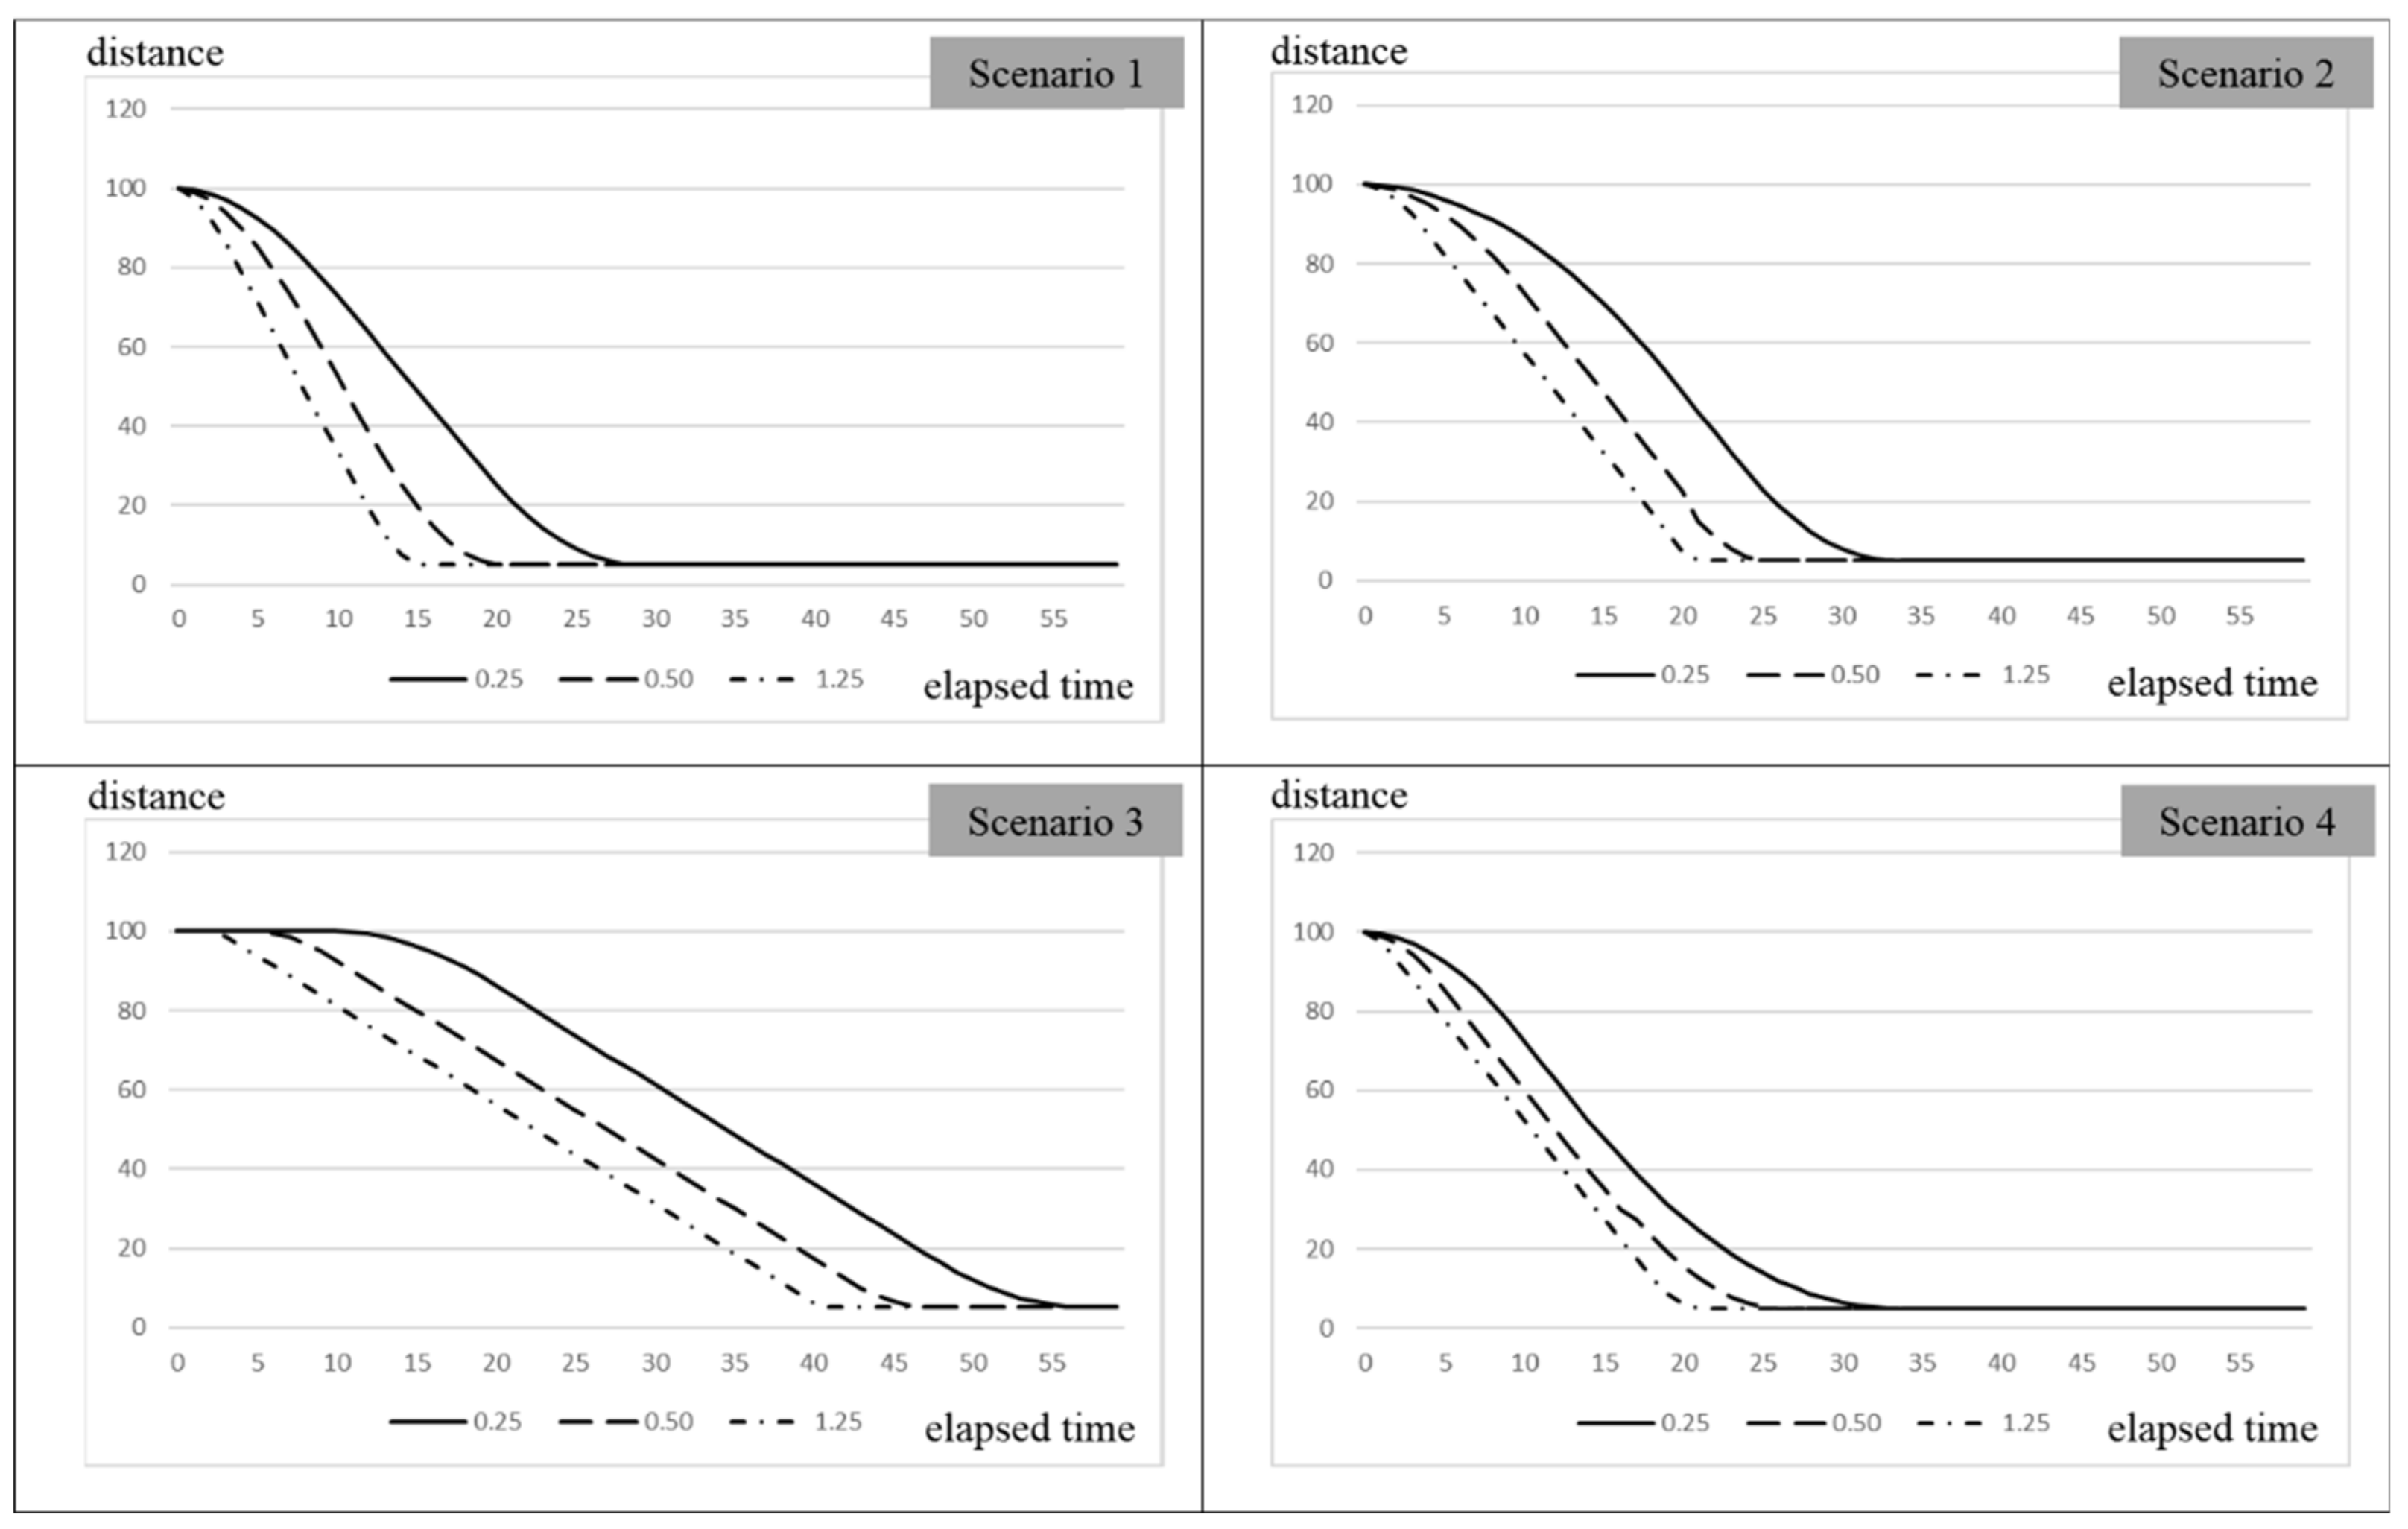
4.2. Operation Profile Scenario
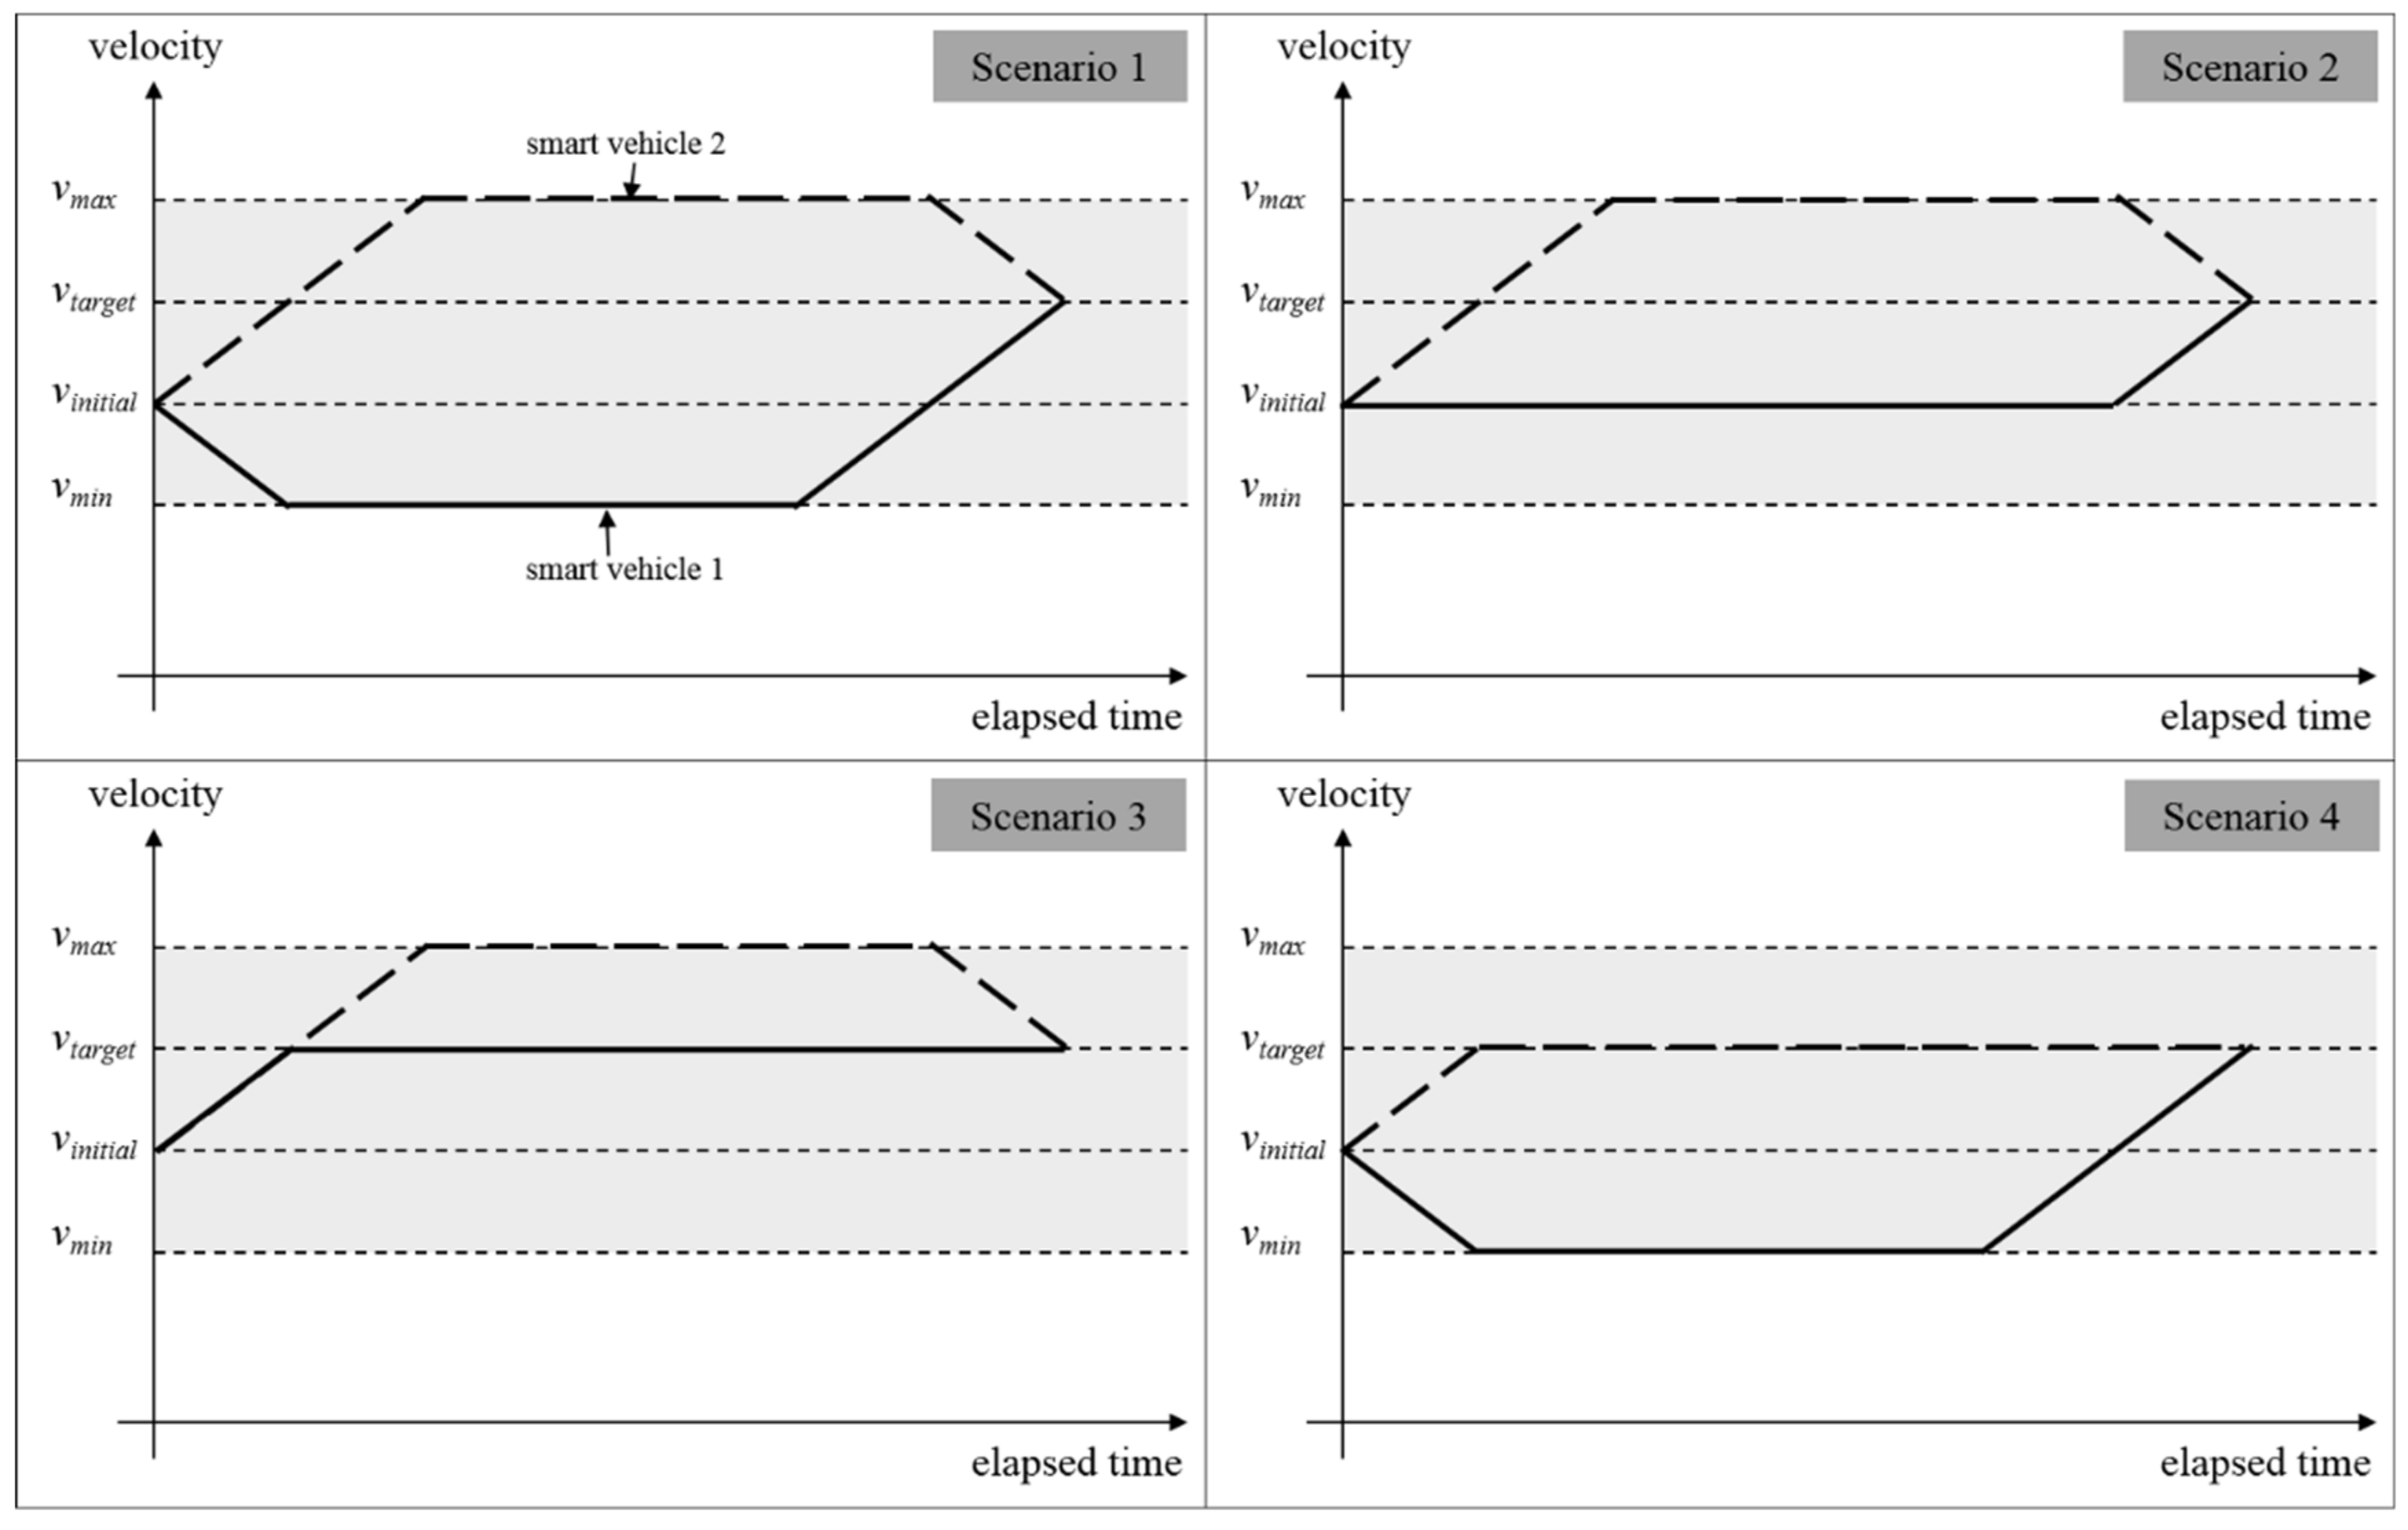
- Scenario 1: firstly, smart vehicle 1 reduces its velocity to the minimum allowable level, while smart vehicle 2 increases its velocity to the maximum allowable level. Then, they control their velocities to reach the target platooning speed considering the final space between them to be the target platooning space.
- Scenario 2: firstly, smart vehicle 1 maintains its initial velocity, while smart vehicle 2 increases its velocity to the maximum allowable level. Then, they control their velocities to reach the target platooning speed considering the final space between them to be the target platooning space.
- Scenario 3: firstly, smart vehicle 1 controls its velocity to reach the target platooning speed, while smart vehicle 2 increases its velocity to the maximum allowable level. Then, smart vehicle 2 reduces its velocity to reach the target platooning speed considering the final space between them to be the target platooning space.
- Scenario 4: firstly, smart vehicle 1 reduces its velocity to the minimum allowable level, while smart vehicle 2 controls its velocity as the target platooning speed. Then, smart vehicle 1 increases its velocity to reach the target platooning speed considering the final space between them to be the target platooning space.
5. Mathematical Experiment Result
5.1. Parameter Setting
5.2. Results Analysis
6. Conclusions
Author Contributions
Funding
Conflicts of Interest
References
- Andersen, P.B.; Hauksson, E.B.; Pedersen, A.B.; Gantenbein, D.; Jansen, B.; Andersen, C.A.; Dall, J. Smart Grid Applications, Communications, and Security. In Smart Grid Applications, Communications, and Security; Wiley: Hoboken, NJ, USA, 2012; pp. 381–408. [Google Scholar]
- Urmson, C.; Anhalt, J.; Bagnell, D.; Baker, C.; Bittner, R.; Clark, M.N.; Dolan, J.; Duggins, D.; Galatail, T.; Geyer, C.; et al. Autonomous driving in urban environments: Boss and the urban challenge. J. Field Robot. 2008, 25, 425–466. [Google Scholar] [CrossRef]
- Saeednia, M.; Menendez, M. A consensus-based algorithm for truck platooning. IEEE Trans. Intell. Transp. Syst. 2017, 18, 404–415. [Google Scholar] [CrossRef]
- Al Alam, A.; Gattami, A.; Johansson, K.H. An experimental study on the fuel reduction potential of heavy duty vehicle platooning. In Proceedings of the 13th International IEEE Conference on Intelligent Transportation Systems (ITSC), Funchal, Portugal, 19–22 September 2010; pp. 306–311. [Google Scholar]
- Bergenhem, C.; Hedin, E.; Skarin, D. Vehicle-to-vehicle communication for a platooning system. Procedia Soc. Behav. Sci. 2012, 48, 1222–1233. [Google Scholar] [CrossRef]
- Abualhoul, M.Y.; Marouf, M.; Shagdar, O.; Nashashibi, F. Platooning control using visible light communications: A feasibility study. In Proceedings of the 16th International IEEE Conference on Intelligent Transportation Systems (ITSC), The Hague, The Netherlands, 6–9 October 2013; pp. 1535–1540. [Google Scholar]
- Ishihara, S.; Rabsatt, R.V.; Gerla, M. Improving reliability of platooning control messages using radio and visible light hybrid communication. In Proceedings of the 2015 IEEE Vehicular Networking Conference (VNC), Kyoto, Japan, 16–18 December 2015; pp. 96–103. [Google Scholar]
- Benhimane, S.; Malis, E.; Rives, P.; Azinheira, J.R. Vision-based control for car platooning using homography decomposition. In Proceedings of the 2005 IEEE International Conference on Robotics and Automation, Barcelona, Spain, 18–22 April 2005; pp. 2161–2166. [Google Scholar]
- Kato, S.; Tsugawa, S.; Tokuda, K.; Matsui, T.; Fujii, H. Vehicle control algorithms for cooperative driving with automated vehicles and intervehicle communications. IEEE Trans. Intell. Transp. Syst. 2002, 3, 155–161. [Google Scholar] [CrossRef]
- Larson, J.; Kammer, C.; Liang, K.Y.; Johansson, K.H. Coordinated route optimization for heavy-duty vehicle platoons. In Proceedings of the 16th International IEEE Conference on Intelligent Transportation Systems (ITSC), The Hague, The Netherlands, 6–9 October 2013; pp. 1196–1202. [Google Scholar]
- Hall, R.; Chin, C. Vehicle sorting for platoon formation: Impacts on highway entry and throughput. Transport. Res. Part C Emer. Technol. 2005, 13, 405–420. [Google Scholar] [CrossRef]
- Yazbeck, J.; Scheuer, A.; Charpillet, F. Decentralized near-to-near approach for vehicle platooning based on memorization and heuristic search. In Proceedings of the 2014 IEEE International Conference on Robotics and Automation (ICRA), Hong Kong, China, 31 May–7 June 2014; pp. 631–638. [Google Scholar]
- Saeednia, M.; Menendez, M. Analysis of Strategies for Truck Platooning: Hybrid Strategy. Transp. Res. Rec. J. Transp. Res. Board 2016, 2547, 41–48. [Google Scholar] [CrossRef]
- Nourmohammadzadeh, A.; Hartmann, S. The fuel-efficient platooning of heavy duty vehicles by mathematical programming and genetic algorithm. In Proceedings of the International Conference on Theory and Practice of Natural Computing, Sendai, Japan, 12–13 December 2016; pp. 46–57. [Google Scholar]
- Turri, V.; Besselink, B.; Johansson, K.H. Cooperative look-ahead control for fuel-efficient and safe heavy-duty vehicle platooning. IEEE Trans. Control Syst Technol. 2017, 25, 12–28. [Google Scholar] [CrossRef]
- Davila, A.; Nombela, M. Platooning-Safe and Eco-Friendly Mobility; SAE Technical Paper No. 2012-01-0488; SAE Int.: Warrendale, PA, USA, 2012. [Google Scholar]
- Liang, K.Y. Coordination and Routing for Fuel-Efficient Heavy-Duty Vehicle Platoon Formation; KTH Royal Institute of Technology: Stockholm, Sweden, 2014. [Google Scholar]
- Van De Hoef, S.; Johansson, K.H.; Dimarogonas, D.V. Fuel-optimal centralized coordination of truck platooning based on shortest paths. In Proceedings of the 2015 American Control Conference (ACC), Chicago, IL, USA, 1–3 July 2015; pp. 3740–3745. [Google Scholar]
- Ko, Y.D.; Jang, Y.J. The optimal system design of the online electric vehicle utilizing wireless power transmission technology. IEEE Trans. Intell. Transp. Syst. 2013, 14, 1255–1265. [Google Scholar] [CrossRef]
- Larminie, J.; Lowry, J. Electric Vehicle Technology Explained; John Wiley and Sons: Hoboken, NJ, USA, 2004. [Google Scholar]

| Parameters | Values | Parameters | Values | Parameters | Values |
|---|---|---|---|---|---|
| vinitial | 81 km/h | tforming | 60 s | Cd | 1.2 |
| vtarget | 90 km/h | μrr | 0.02 | ψ | 0 |
| vmin | 72 km/h | m | 2000 kg | a1 | 0.25 m/s2 |
| vmax | 99 km/h | g | 9.8 m/s2 | a2 | 0.50 m/s2 |
| dinitial | 100 m | ρ | 1 | a3 | 1.25 m/s2 |
| dsafe | 5 m | A | 5 |
| Scenario 1 | Scenario 2 | |||||
|---|---|---|---|---|---|---|
| 0.25 m/s2 | 0.50 m/s2 | 1.25 m/s2 | 0.25 m/s2 | 0.50 m/s2 | 1.25 m/s2 | |
| Power consumption (W) | 572,004 | 566,168 | 558,035 | 509,928 | 492,028 | 481,237 |
| Forming time (seconds) | 29.0 | 21.0 | 16.0 | 34.0 | 26.5 | 22.0 |
| Forming distance (meters) | 641.25 | 450.00 | 331.25 | 776.25 | 601.25 | 496.25 |
| Scenario 3 | Scenario 4 | |||||
| 0.25 m/s2 | 0.50 m/s2 | 1.25 m/s2 | 0.25 m/s2 | 0.50 m/s2 | 1.25 m/s2 | |
| Power consumption (W) | 636,827 | 605,634 | 586,917 | 480,911 | 458,717 | 443,587 |
| Forming time (seconds) | 58.0 | 48.0 | 42.0 | 34.0 | 26.5 | 22.0 |
| Forming distance (meters) | 1436.25 | 1192.50 | 1046.25 | 741.25 | 560.00 | 451.25 |
© 2019 by the authors. Licensee MDPI, Basel, Switzerland. This article is an open access article distributed under the terms and conditions of the Creative Commons Attribution (CC BY) license (http://creativecommons.org/licenses/by/4.0/).
Share and Cite
Ko, Y.D.; Song, B.D.; Oh, Y. Mathematical Analysis of Environmental Effects of Forming a Platoon of Smart Vehicles. Sustainability 2019, 11, 571. https://doi.org/10.3390/su11030571
Ko YD, Song BD, Oh Y. Mathematical Analysis of Environmental Effects of Forming a Platoon of Smart Vehicles. Sustainability. 2019; 11(3):571. https://doi.org/10.3390/su11030571
Chicago/Turabian StyleKo, Young Dae, Byung Duk Song, and Yonghui Oh. 2019. "Mathematical Analysis of Environmental Effects of Forming a Platoon of Smart Vehicles" Sustainability 11, no. 3: 571. https://doi.org/10.3390/su11030571
APA StyleKo, Y. D., Song, B. D., & Oh, Y. (2019). Mathematical Analysis of Environmental Effects of Forming a Platoon of Smart Vehicles. Sustainability, 11(3), 571. https://doi.org/10.3390/su11030571