Multiannual Assessment of the Risk of Surface Water Erosion and Metal Accumulation Indices in the Flysch Stream Using the MARS Model in the Polish Outer Western Carpathians


Abstract
1. Introduction
2. Material and Methods
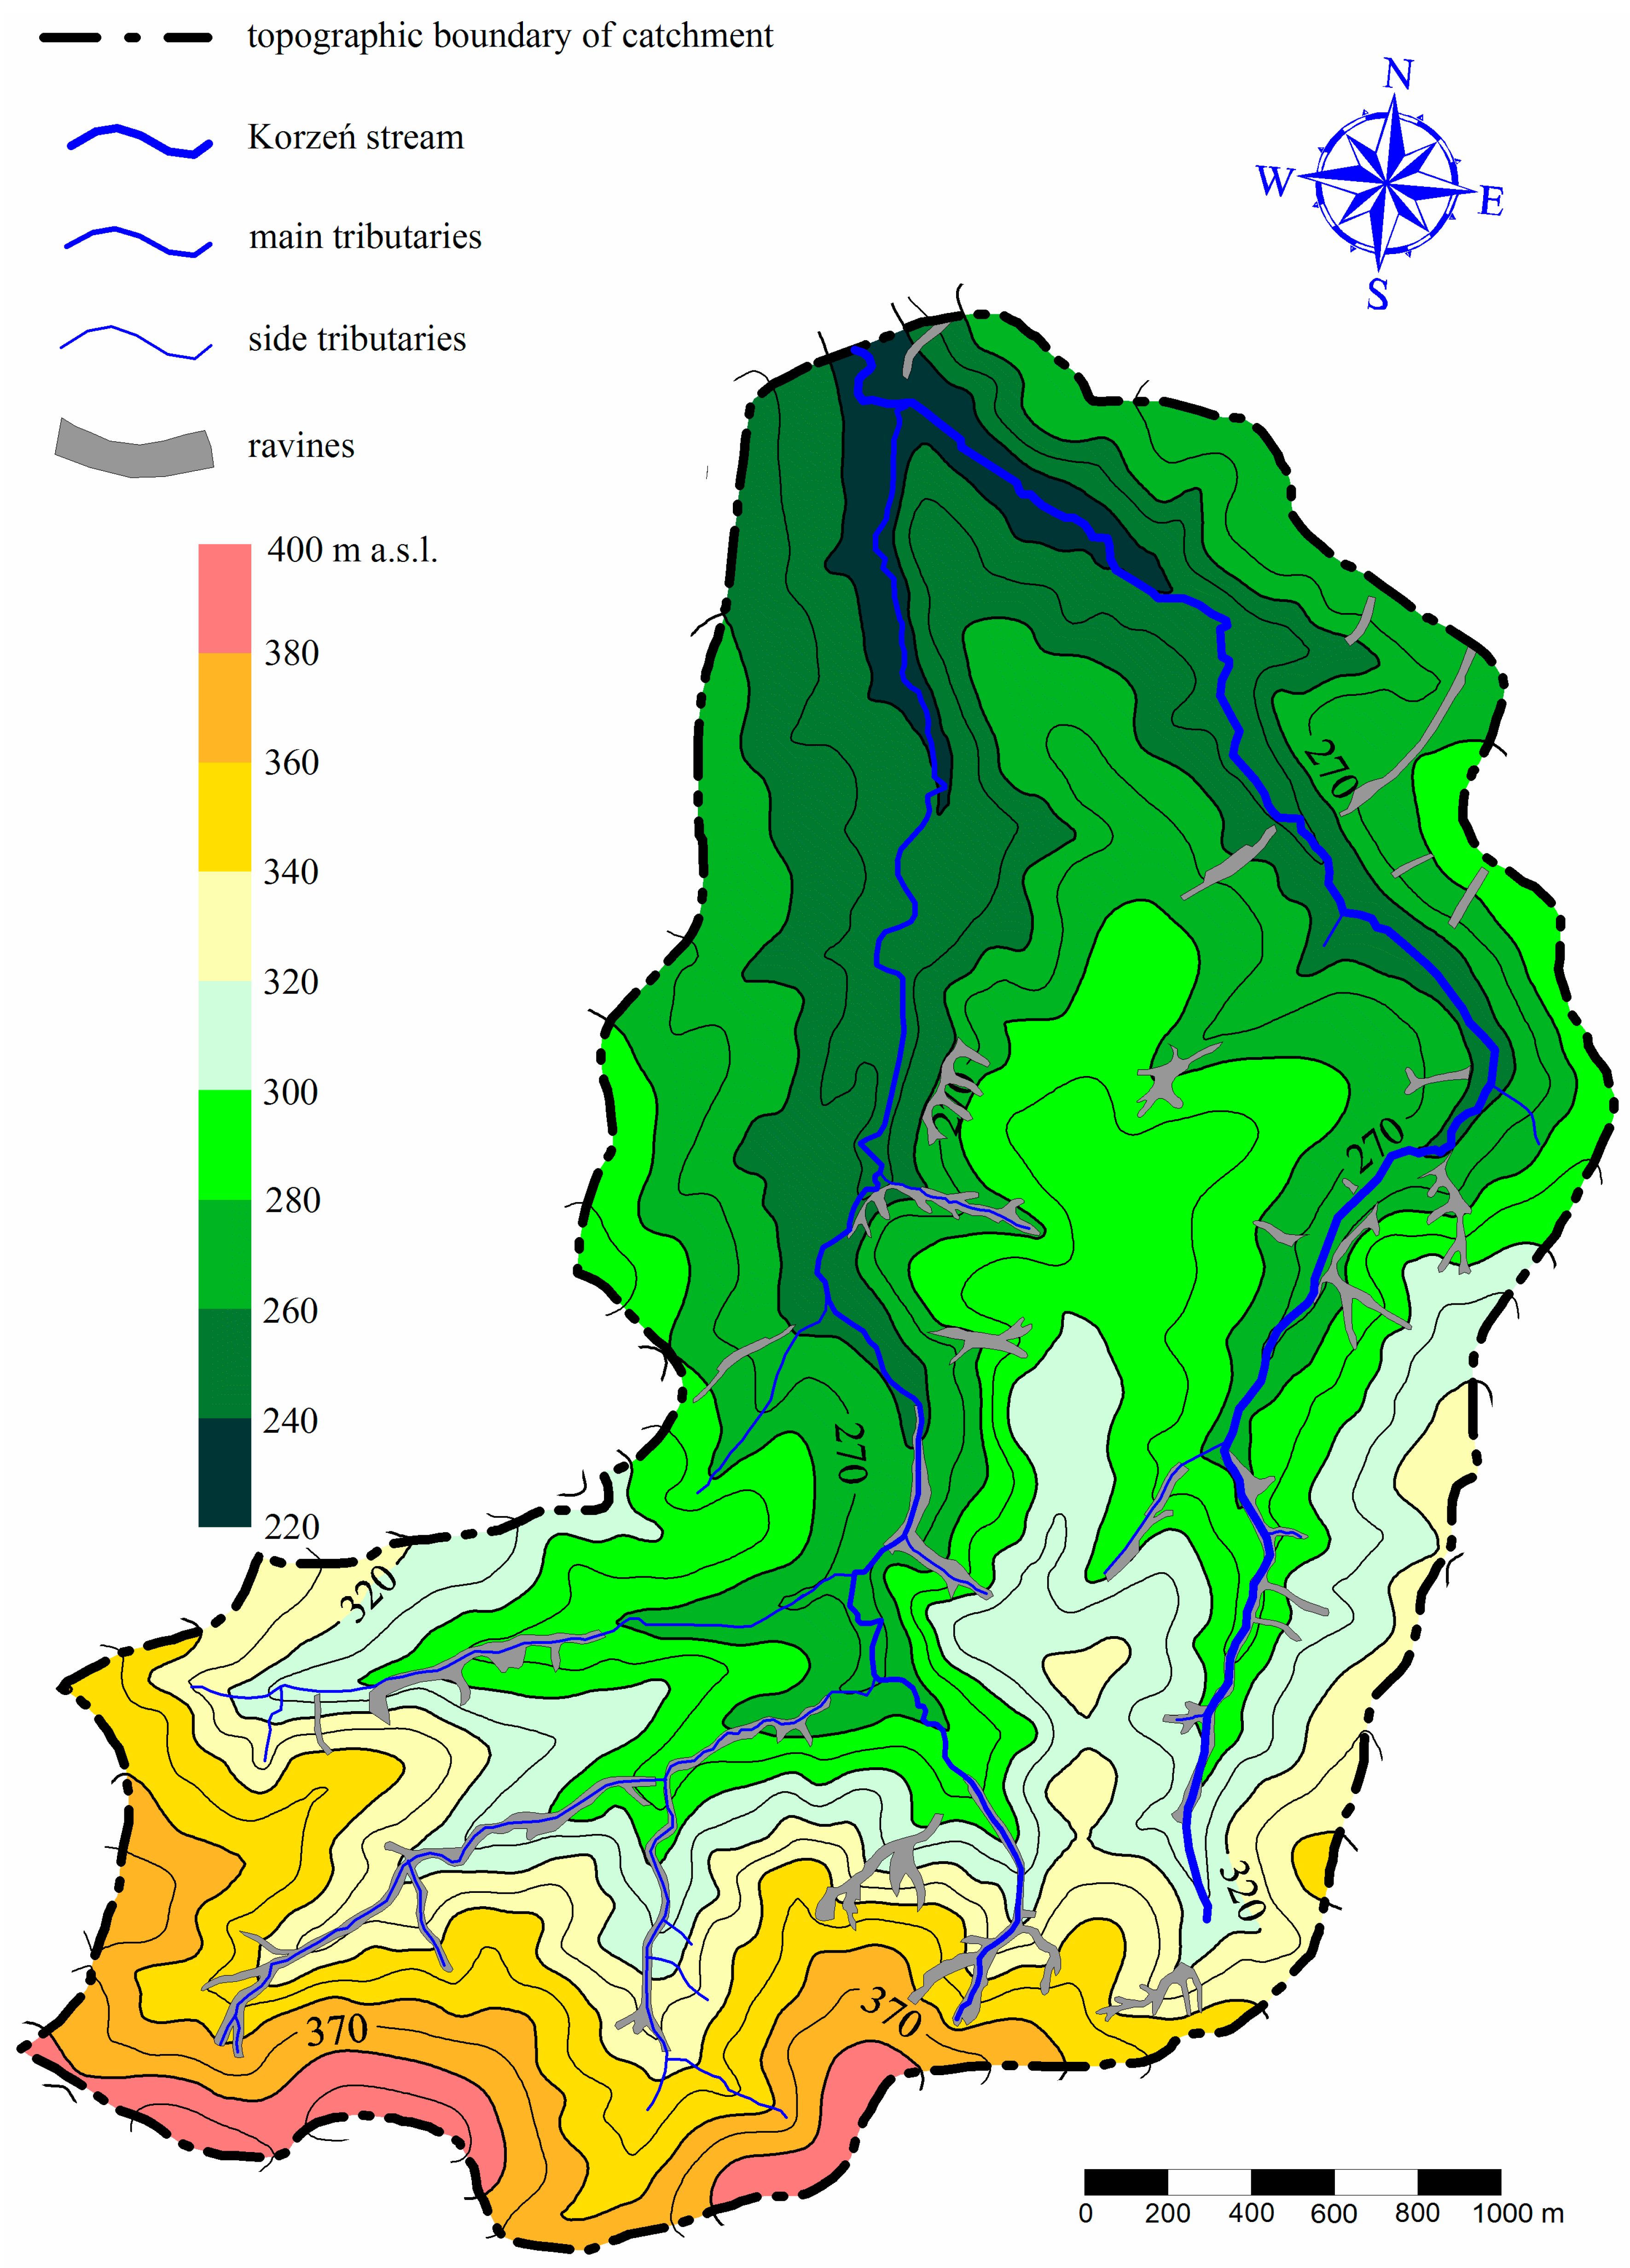
2.1. Study Area
2.2. Geometry and Morphometry of the Study Area
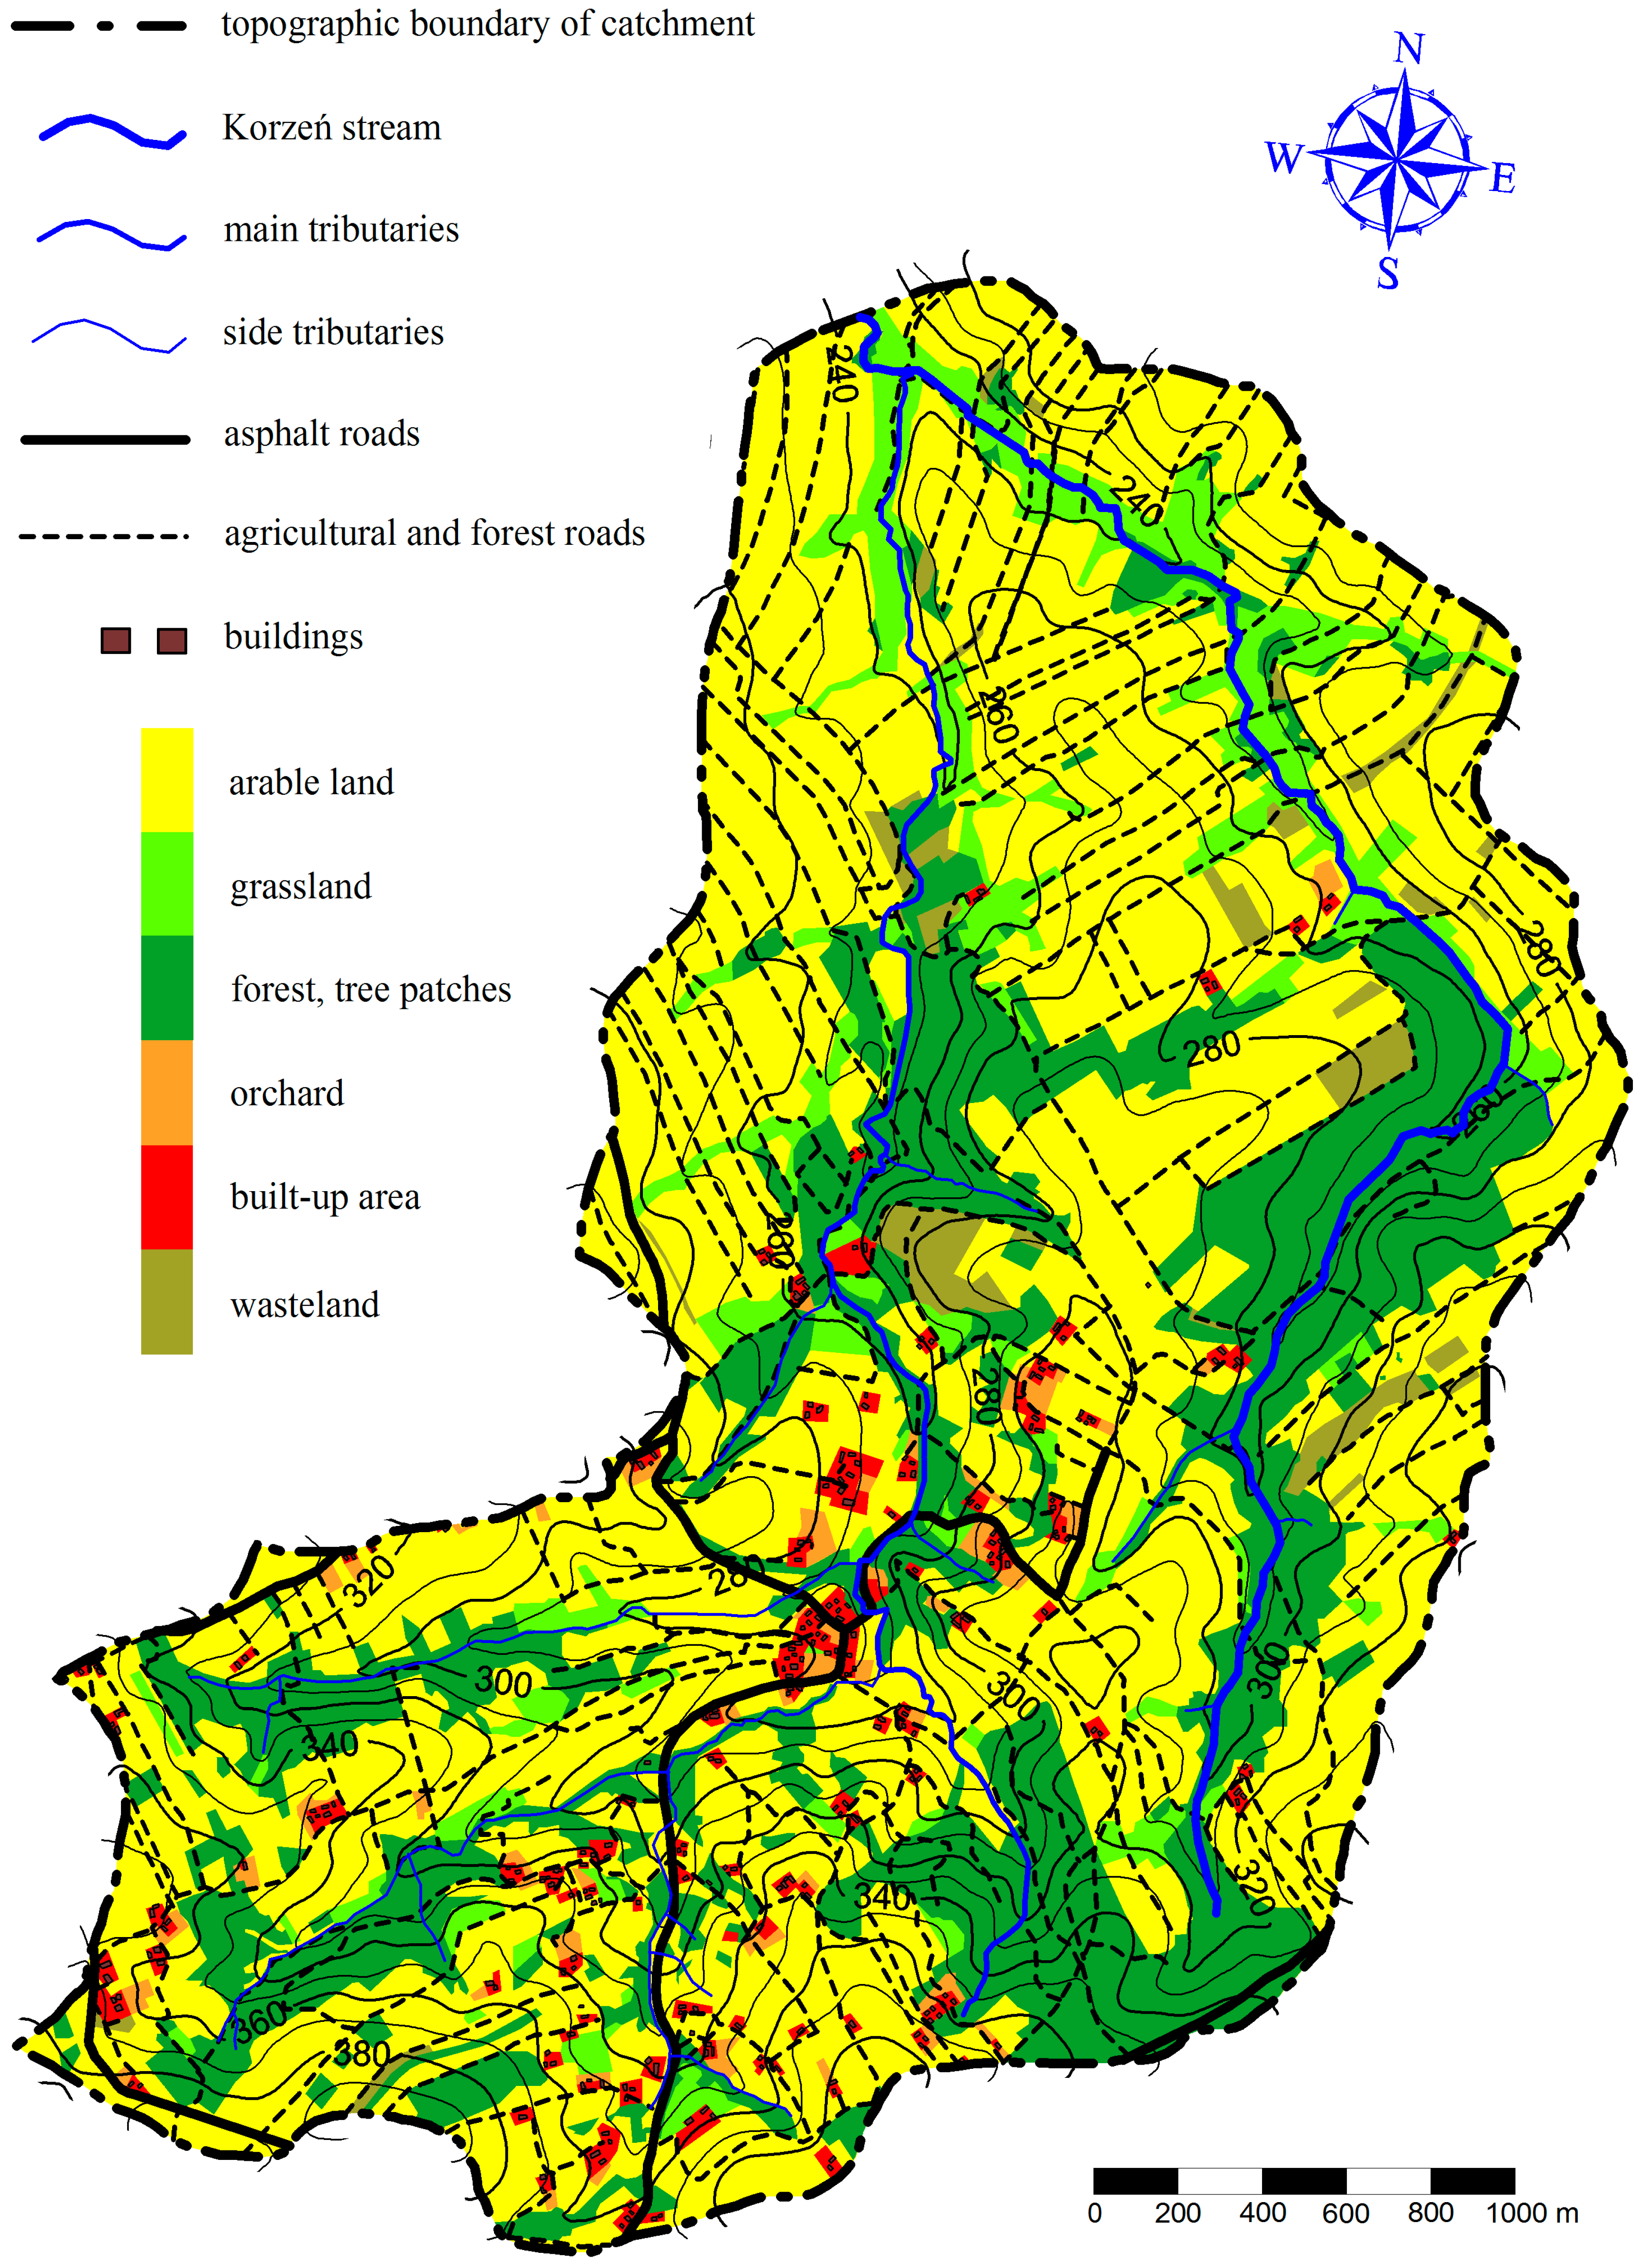
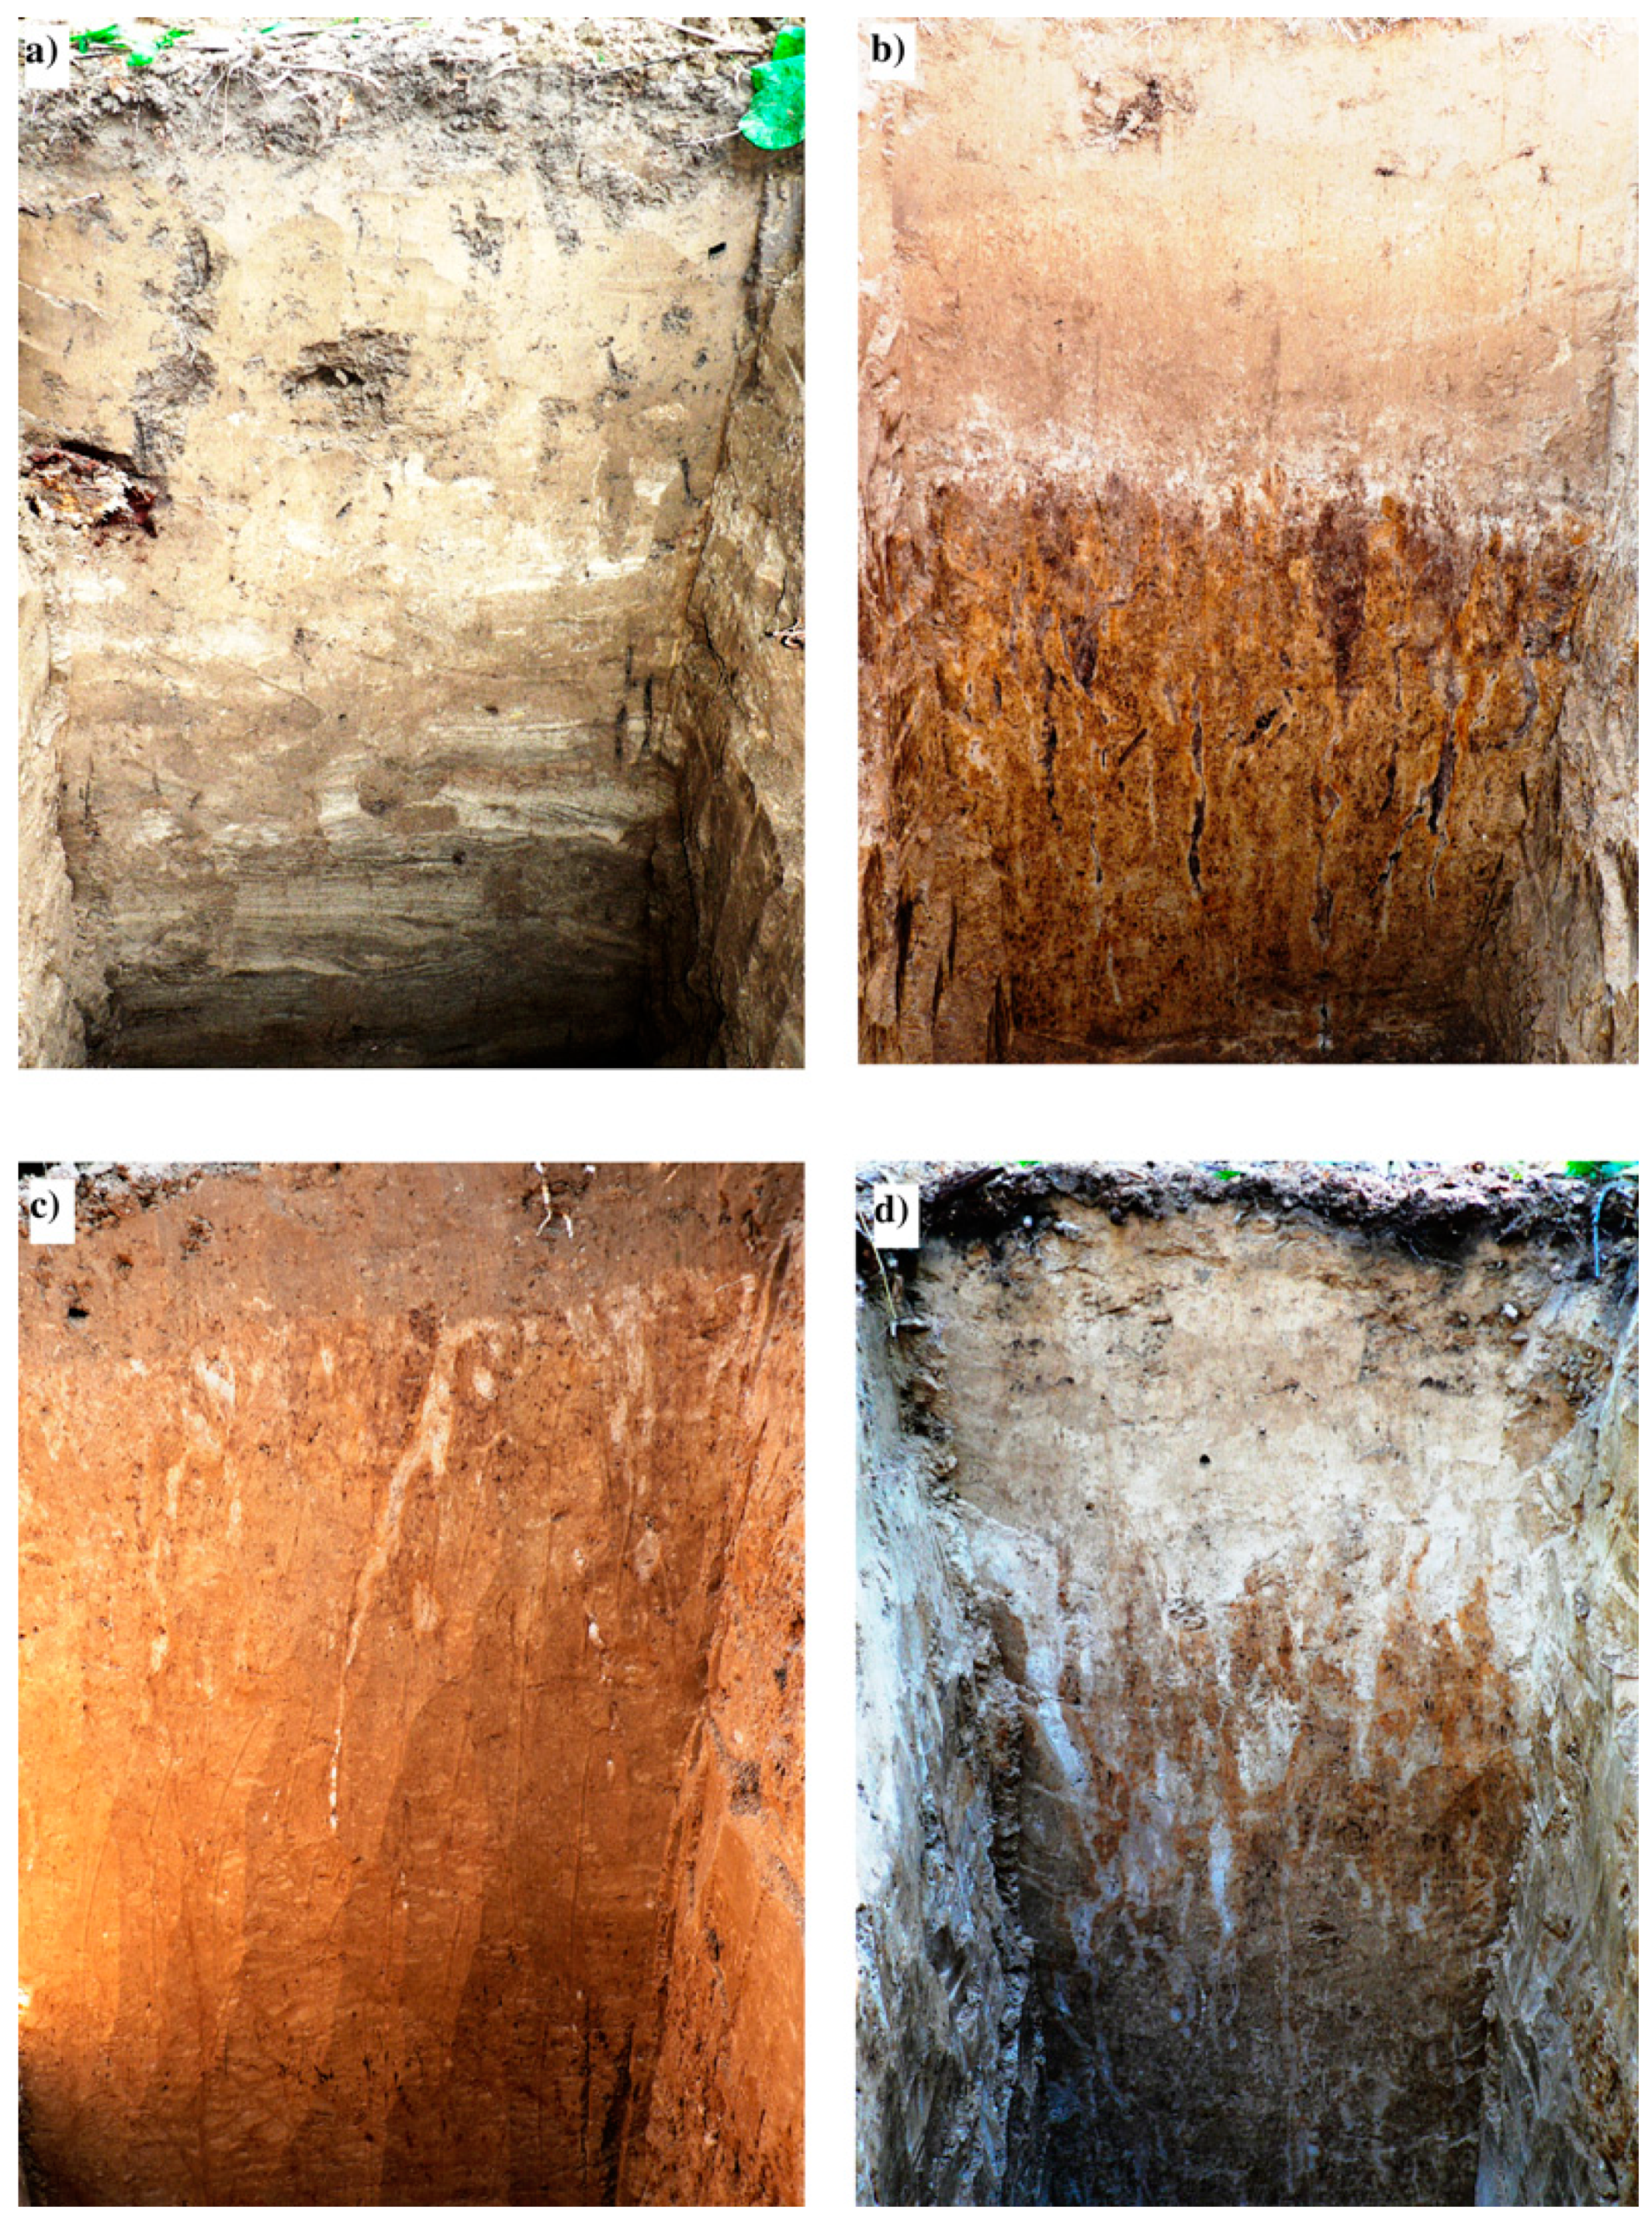
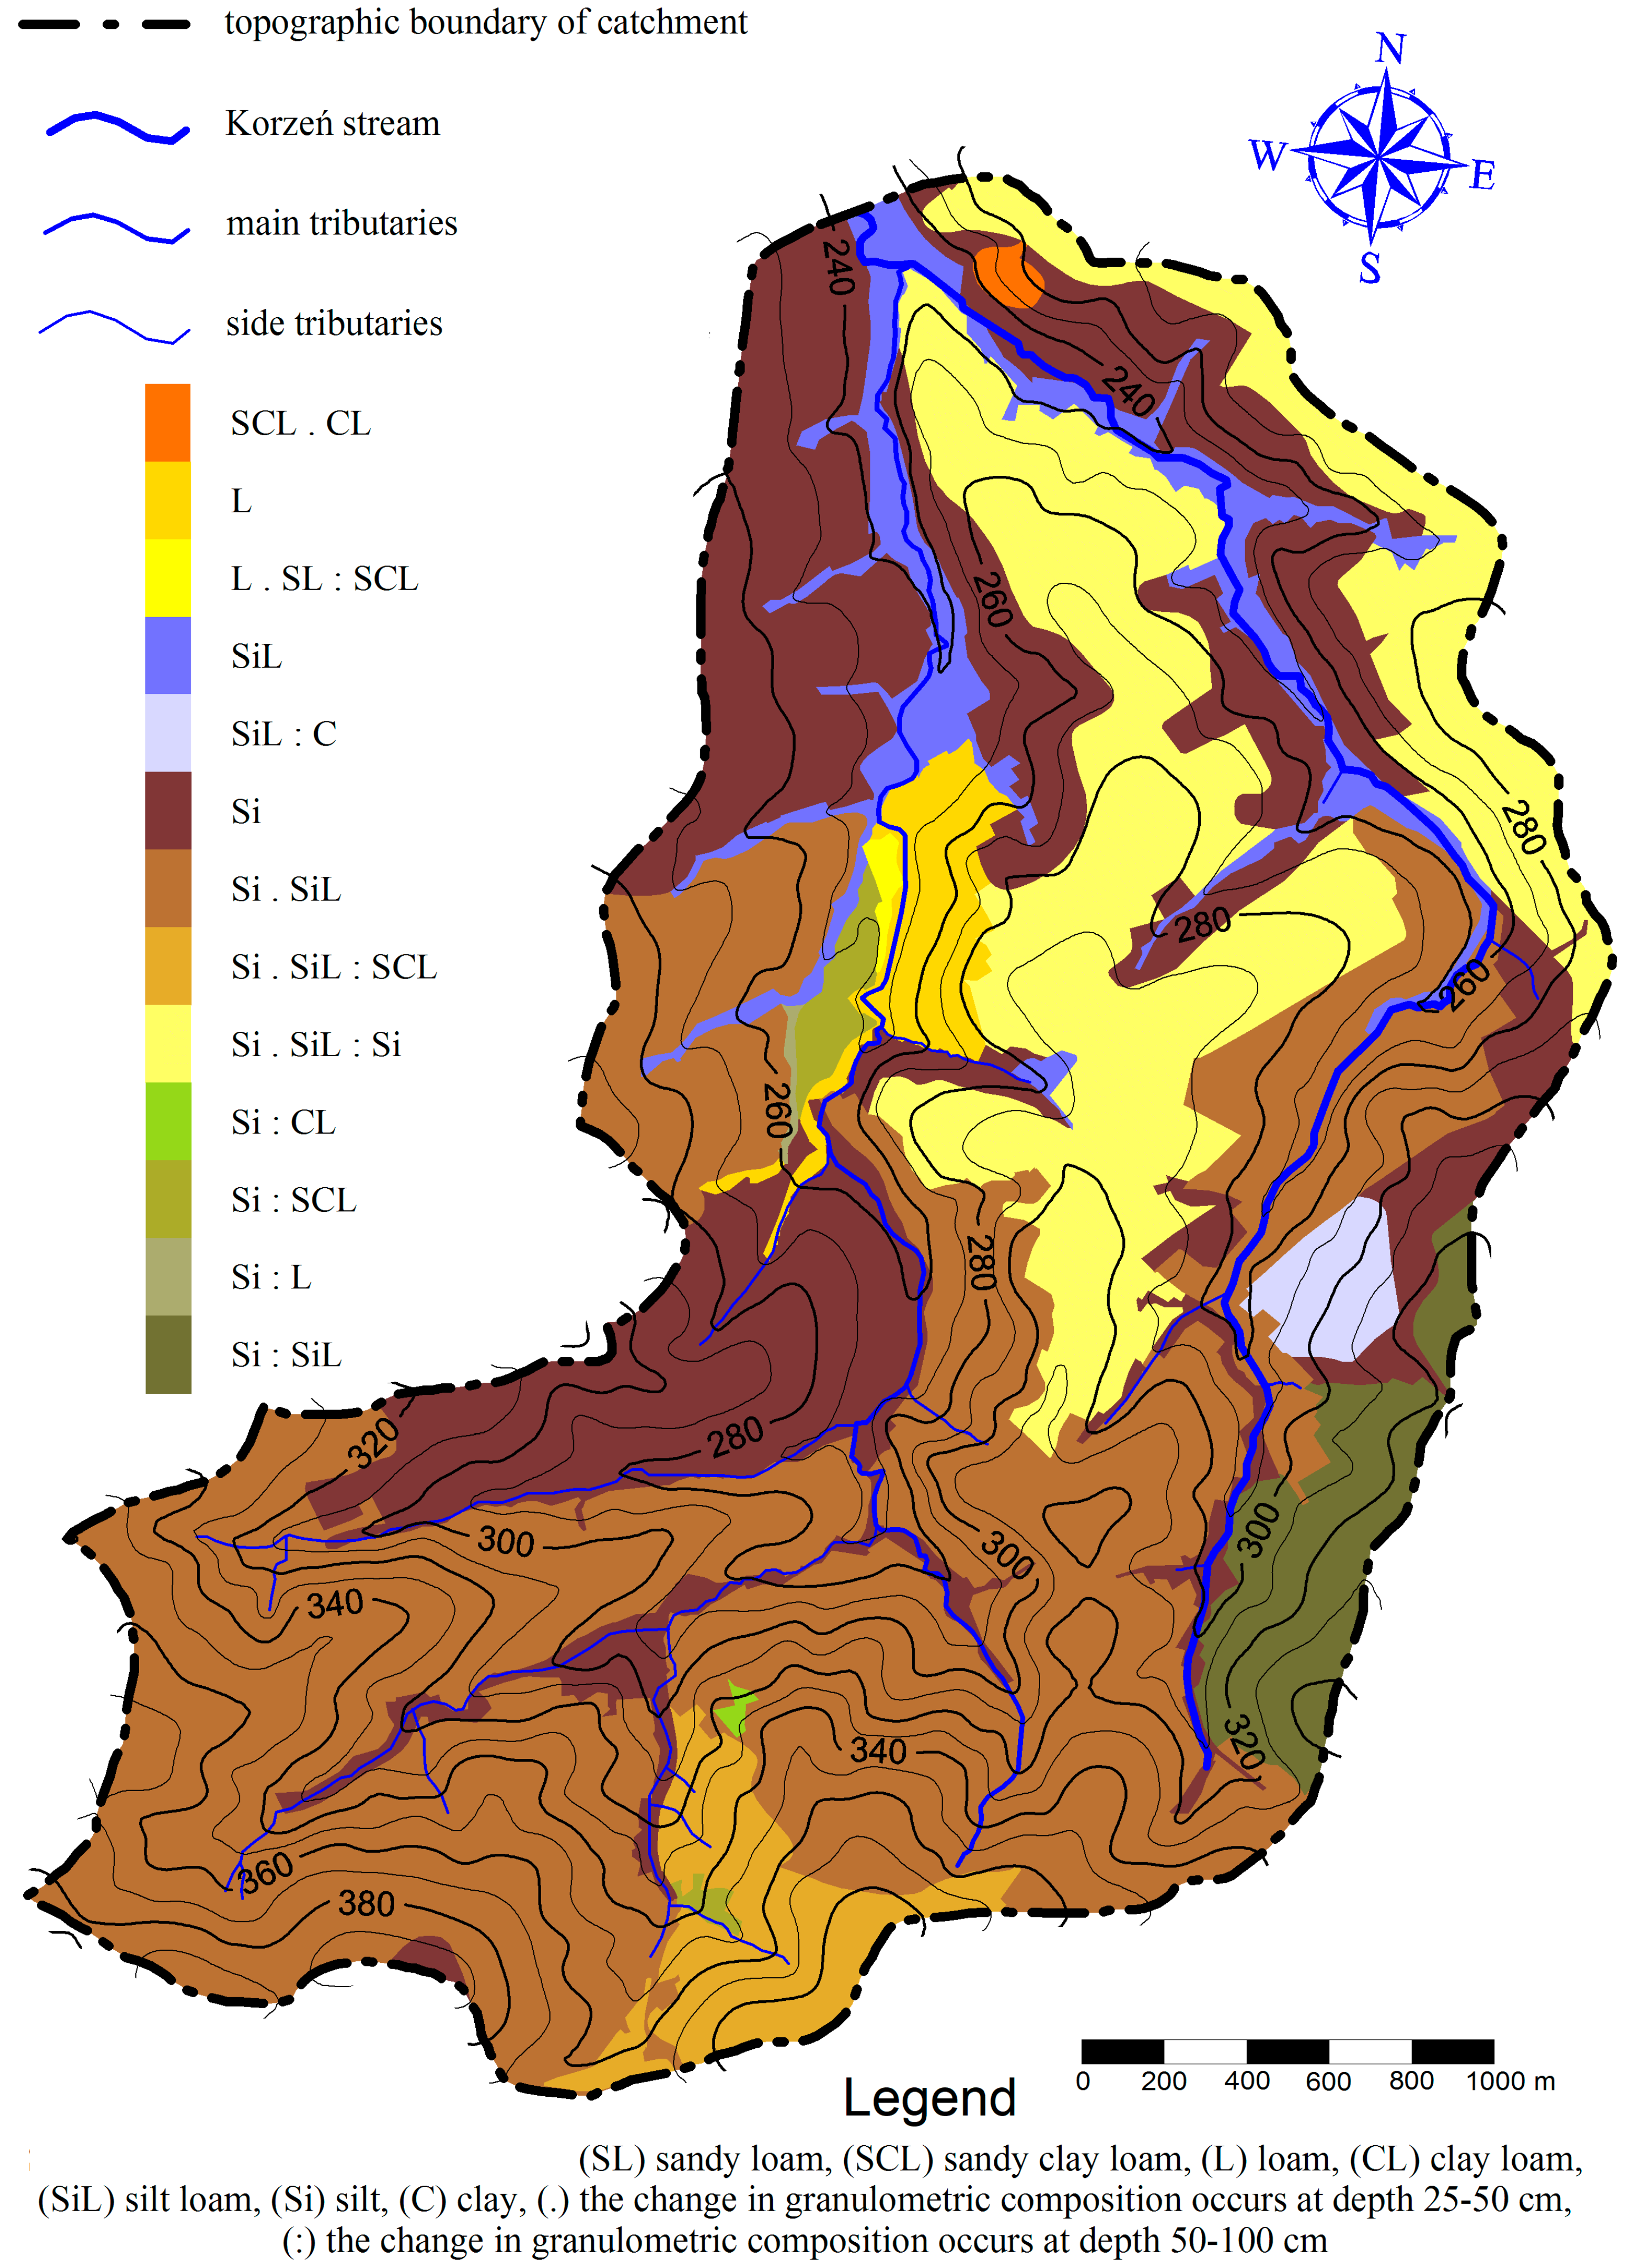
2.3. Soils and Land Use
2.4. Topography and Hydrological Geometry
2.5. Determination of Surface Water Quality Indices
2.6. Erosion Model
2.7. Water Quality Indices
2.8. Statistical Analysis and Data Processing
3. Results
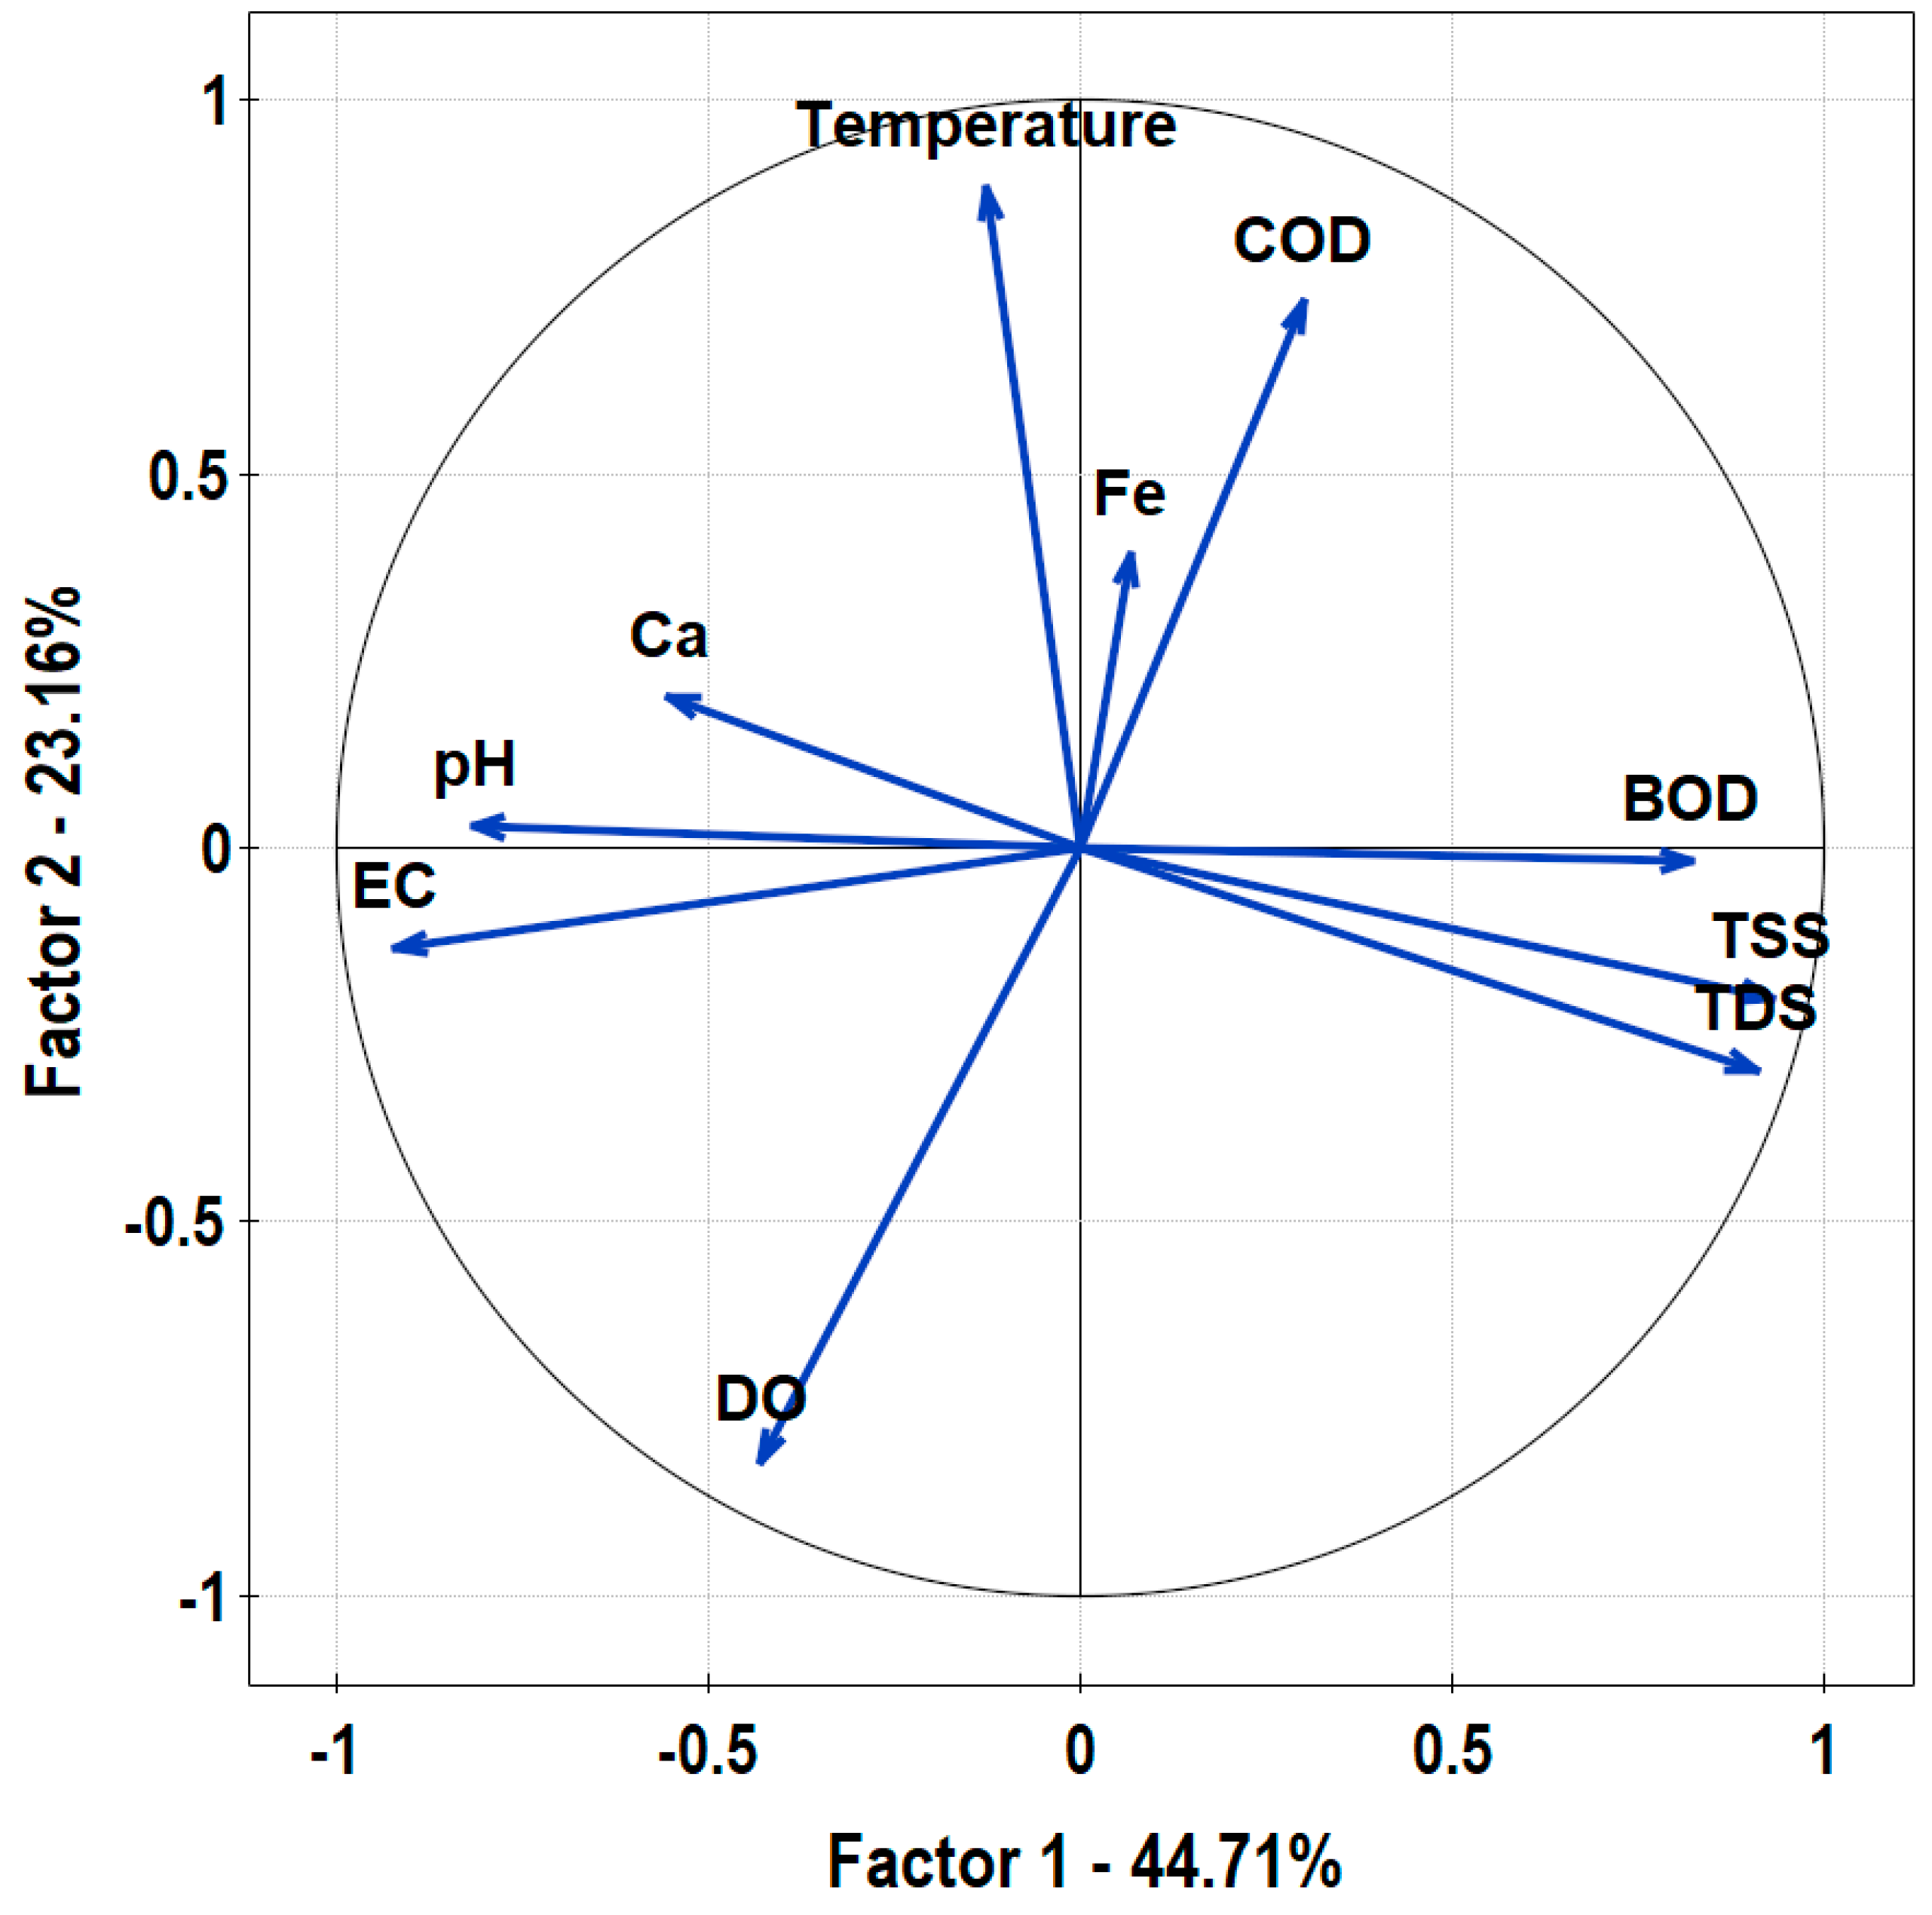
3.1. Physicochemical Indices
3.2. Relation Between Land-Use and Physicochemical Indices
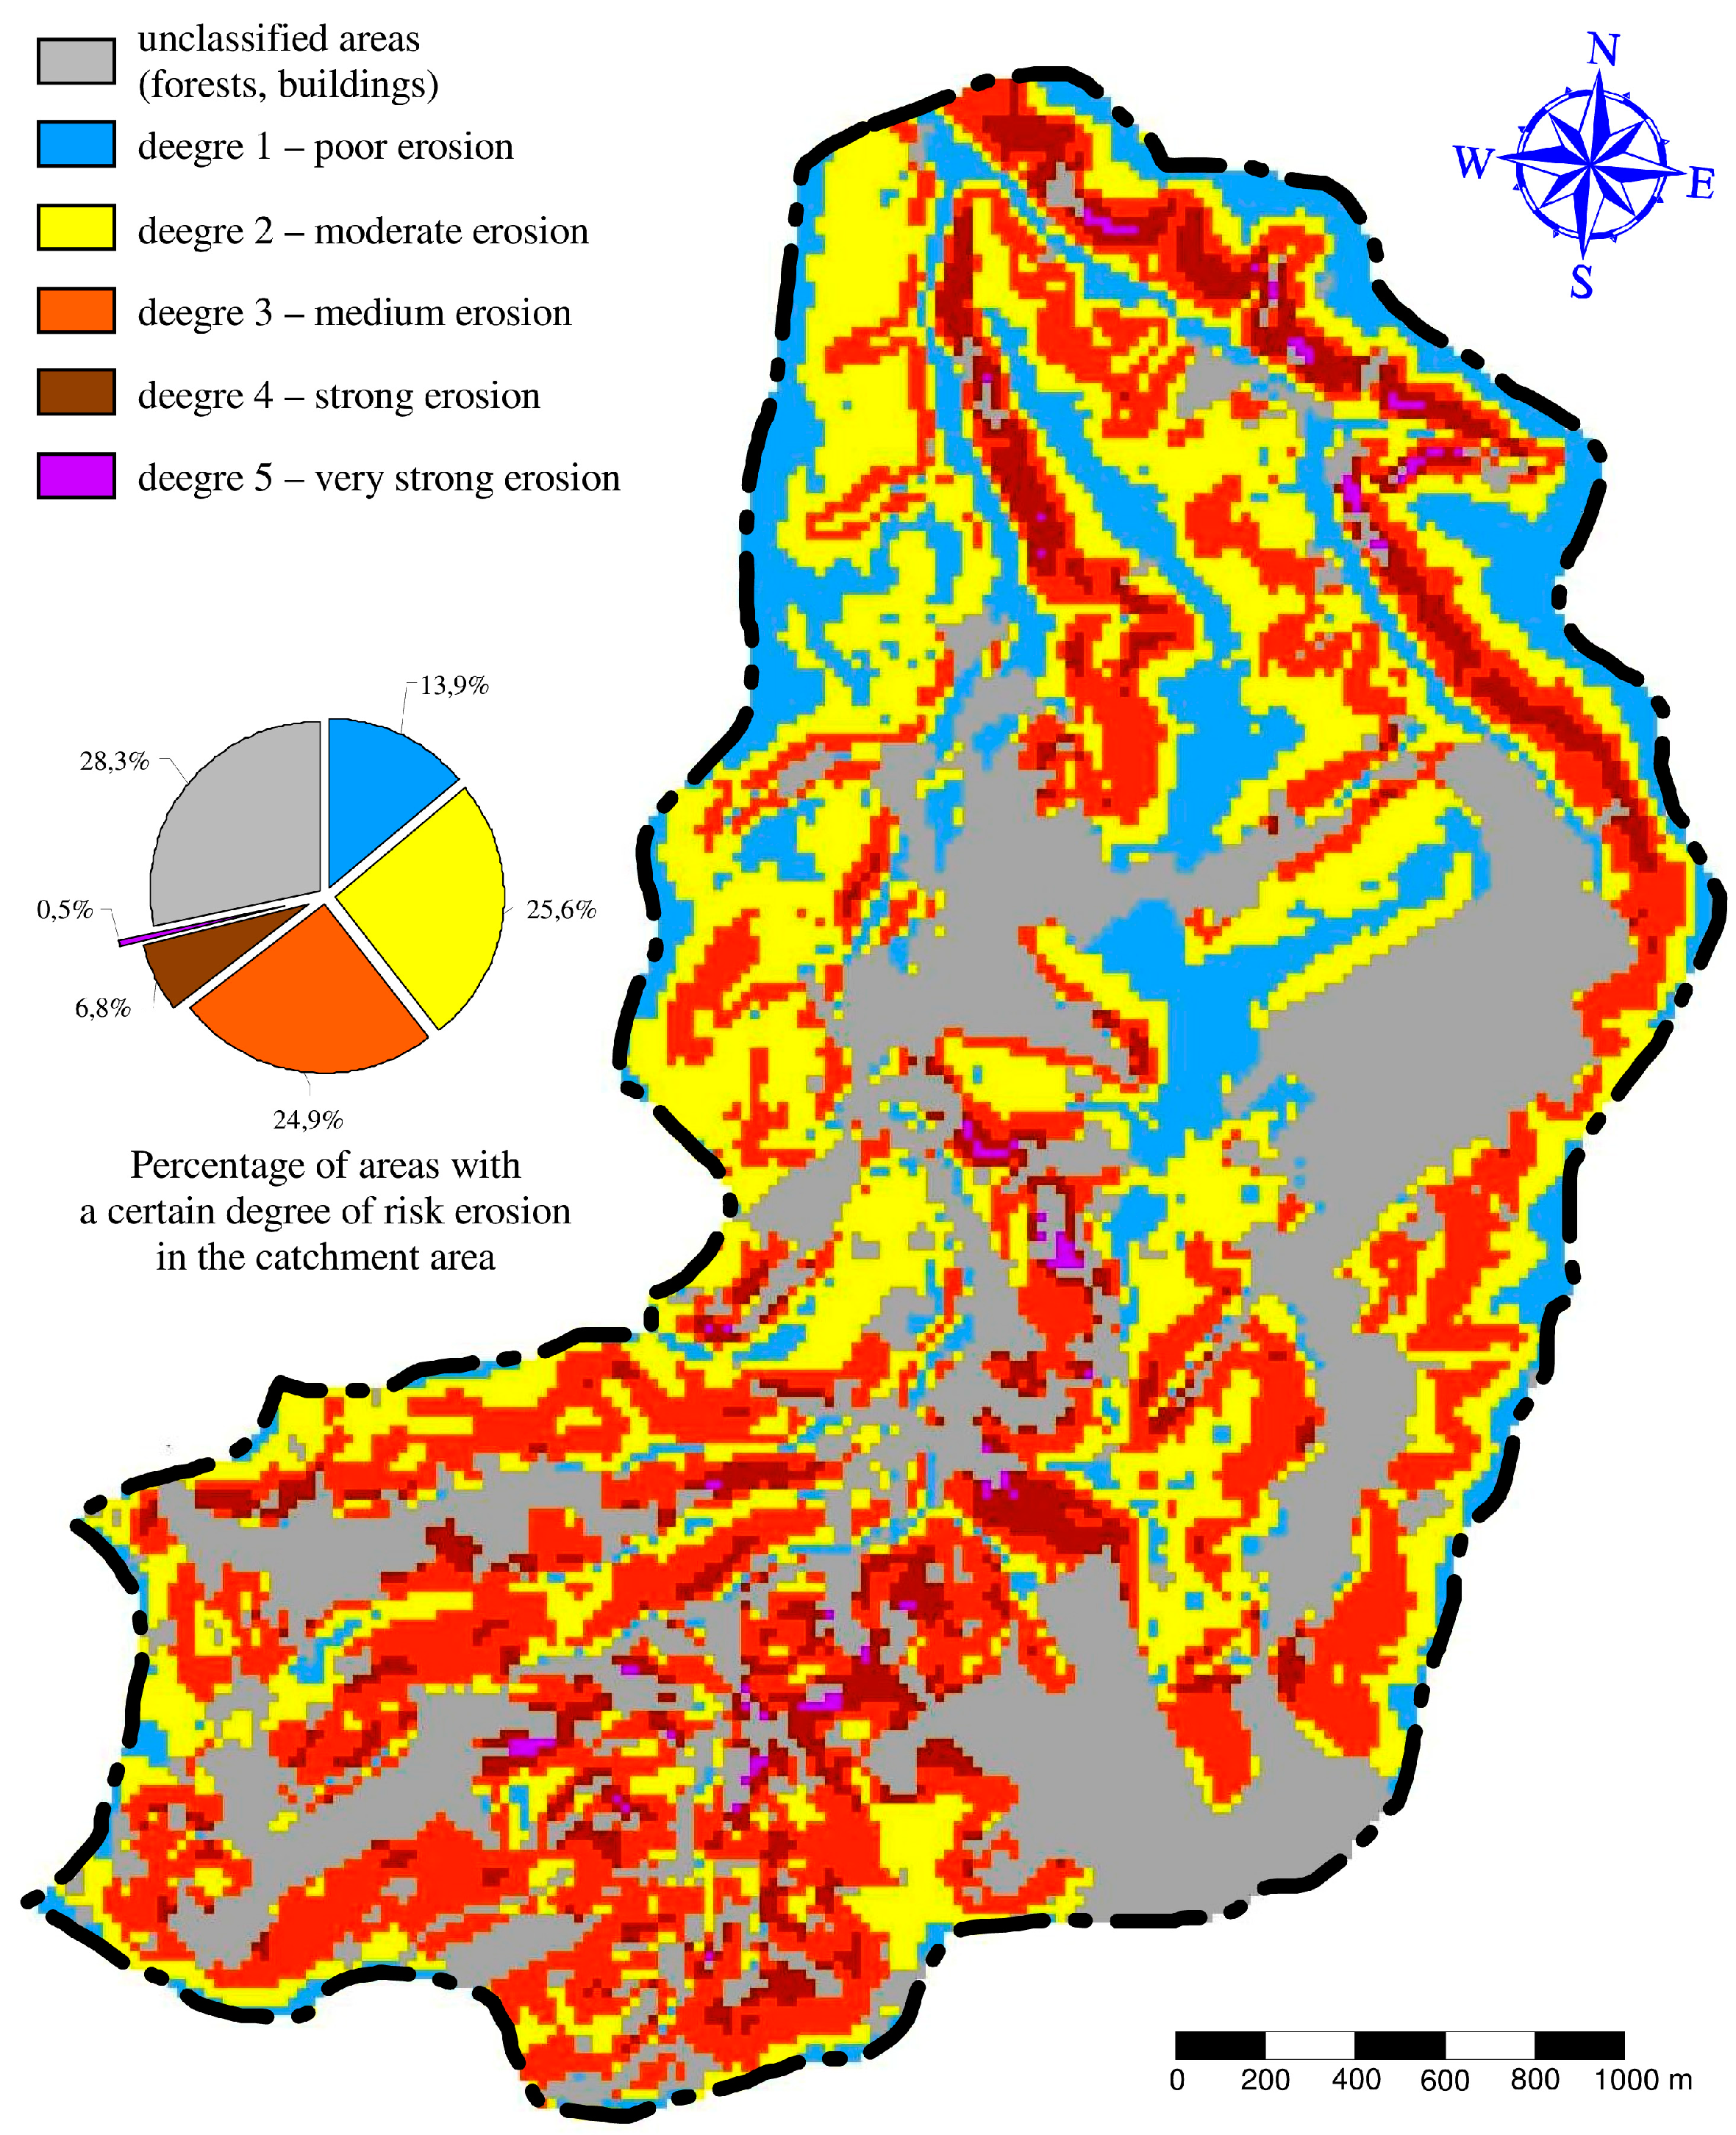
3.3. Evaluation of Erosive Intensity
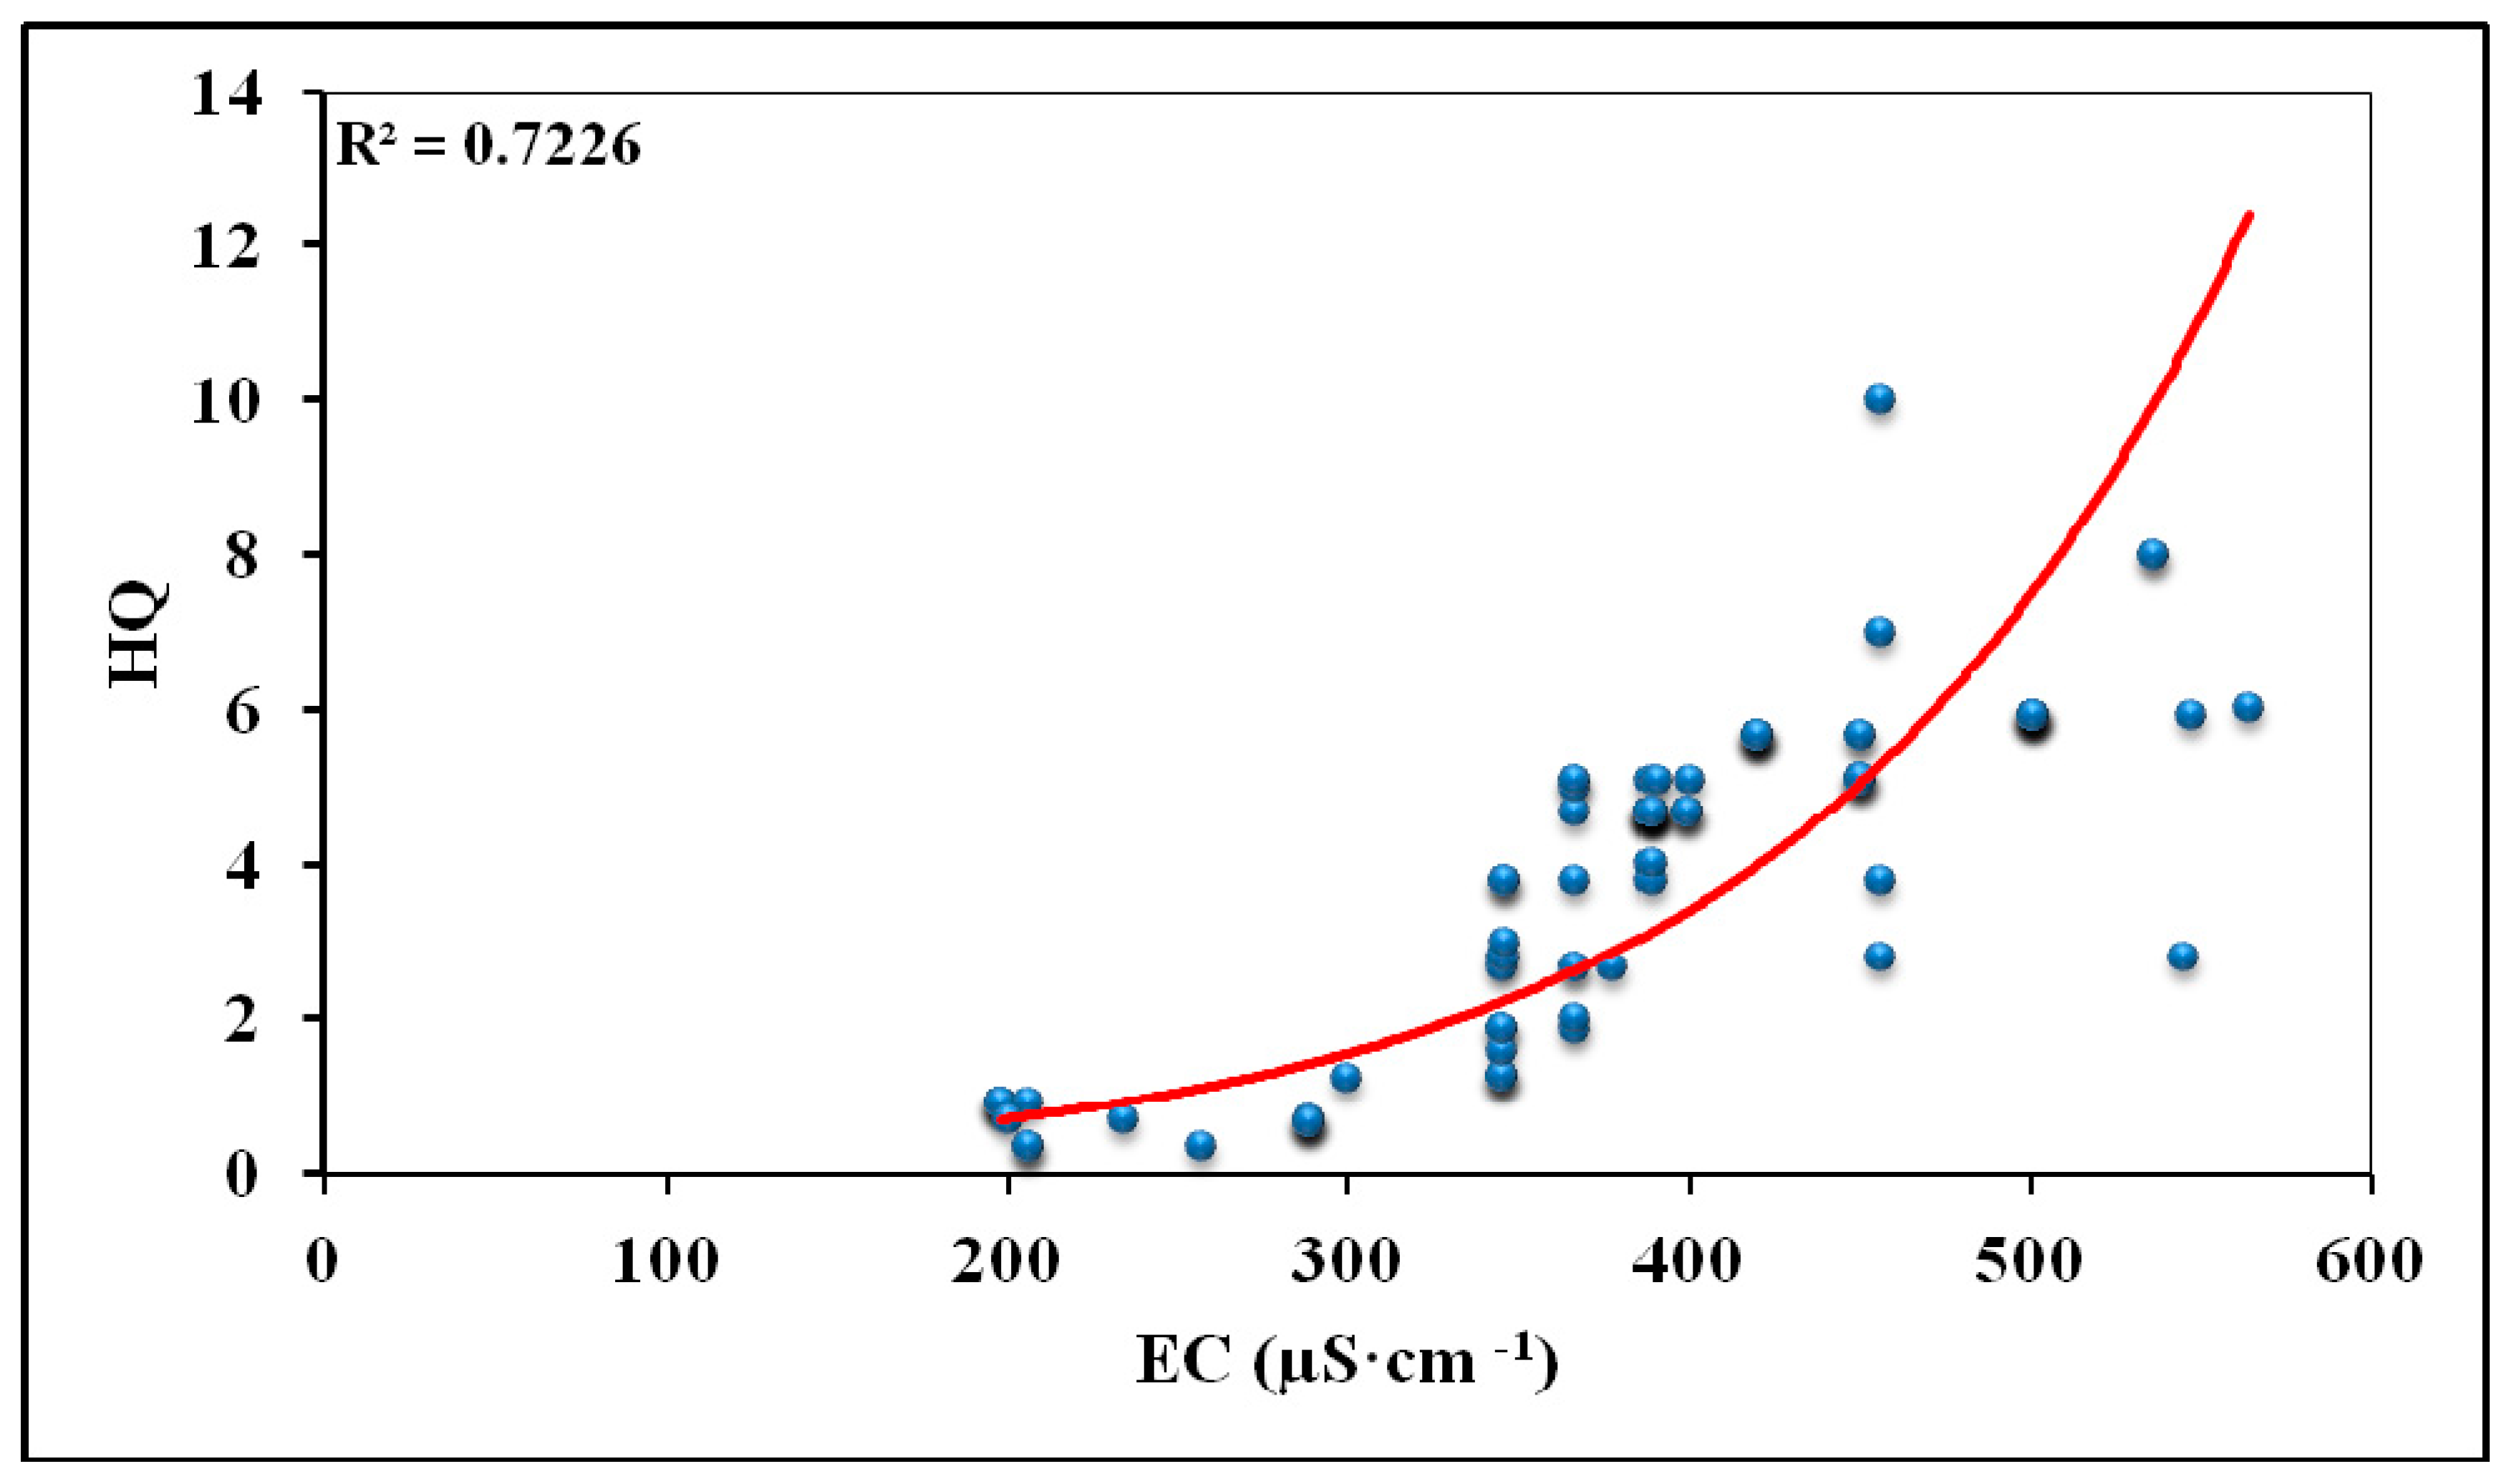
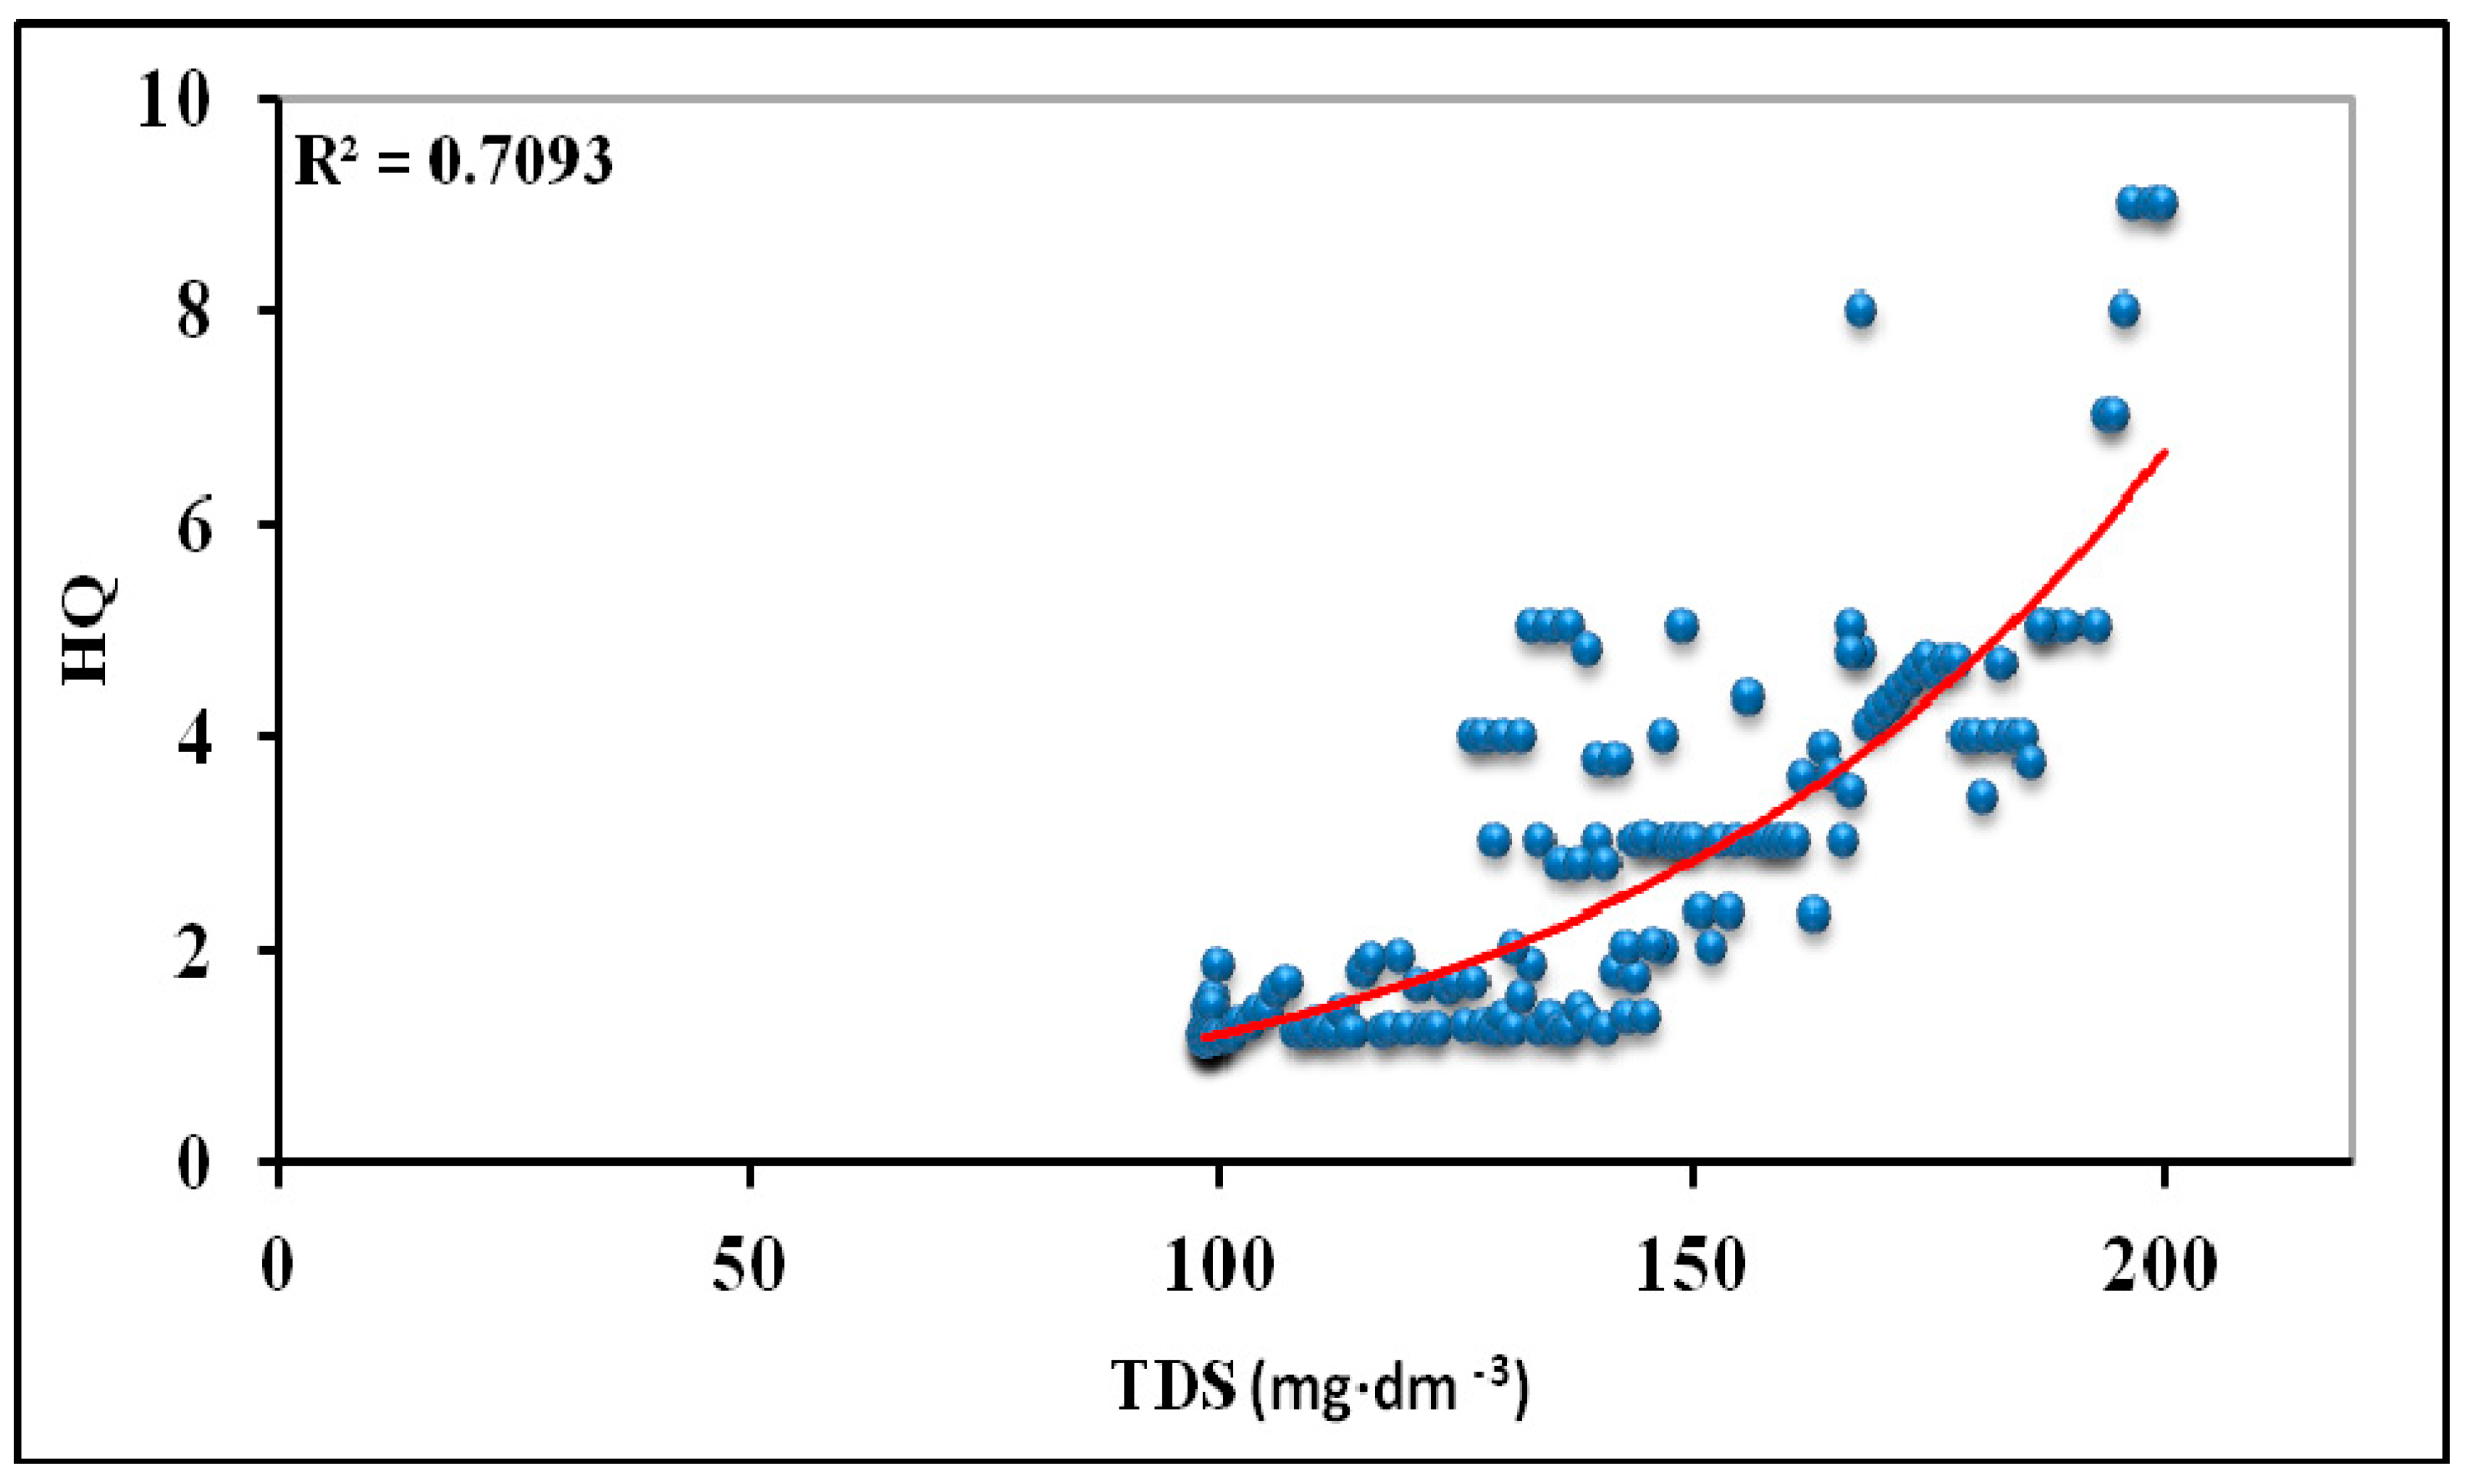
3.4. Evaluation of Metal Accumulation Factors
4. Discussion
4.1. Anthropogenic Threats to Water Quality
4.2. Land Use, Prognostic-Regressive Method, and Systematic Studies of Surface Water Quality
4.3. Protection of Soils and Water in Upland and Mountain Catchment Areas
5. Conclusions
Author Contributions
Funding
Conflicts of Interest
References
- Tena, T.M.; Mwaanga, P.; Nguvulu, A. Impact of Land Use/Land Cover Change on Hydrological Components in Chongwe River Catchment. Sustainability 2019, 11, 6415. [Google Scholar] [CrossRef]
- Bogdał, A.; Kowalik, T. Variability of values of physicochemical water quality indices along the length of the Iwoniczanka stream. J. Ecol. Eng. 2015, 16, 168–175. [Google Scholar] [CrossRef][Green Version]
- Assouline, S.; Russo, D.; Silber, A.; Or, D. Balancing water scarcity and quality for sustainable irrigated agriculture. Water Resour. Res. 2015, 51, 3419–3436. [Google Scholar] [CrossRef]
- Bogdał, A.; Kowalik, T.; Ostrowski, K.; Skowron, P. Seasonal variability of physicochemical parameters of water quality on length of Uszwica river. J. Ecol. Eng. 2016, 17, 161–170. [Google Scholar] [CrossRef]
- Zhao, X.; Li, S.; Pu, J.; Miao, P.; Wang, Q.; Tan, K. Optimization of the National Land Space Based on the Coordination of Urban-Agricultural-Ecological Functions in the Karst Areas of Southwest China. Sustainability 2019, 11, 6752. [Google Scholar] [CrossRef]
- Bogdał, A.; Ostrowski, K. Loads of selected chemical components delivered by precipitation and flowing away from Włosień stream catchment. Acta Sci. Pol. Form. Circ. 2006, 5, 47–57. [Google Scholar]
- Bugajski, P.; Chmielowski, K.; Kaczor, G. Optimization of the percentage of sewage from septic tanks for stable operation of a wastewater treatment plant. Pol. J. Environ. Stud. 2016, 25, 1421–1425. [Google Scholar] [CrossRef]
- Bogdał, A.; Ostrowski, K. Loads of selected components supplied with precipitation and flowing away from the area of two small catchments with diversified use. Acta Sci. Pol. Form. Circ. 2009, 8, 35–45. [Google Scholar]
- Liberacki, D.; Szafrański, C. Contents of biogenic components in surface waters of small catchments in the Zielonka Forest. Ann. Set Environ. Prot. 2008, 10, 181–192. [Google Scholar]
- Balakrishnan, A.; Ramu, A. Evaluation of heavy metal pollution index (HPI) of ground water in and around the coastal area of Gulf of Mannar biosphere and Palk Strait. J. Adv. Chem. Sci. 2016, 2, 331–333. [Google Scholar]
- Bhutiani, R.; Khanna, D.R.; Kulkarni, D.B.; Ruhela, M. Assessment of Ganga river ecosystem at Haridwar, Uttarakhand, India with reference to water quality indices. Appl. Water Sci. 2014, 6, 107–113. [Google Scholar] [CrossRef]
- Koc, J.; Skonieczyk, P. Role of Retention Reservoir in Protecting a Lake from Biogenic Substances Running off from Rural Areas. Pol. J. Environ. Stud. 2007, 16, 292–296. [Google Scholar]
- Policht-Latawiec, A.; Kapica, A. Influence of Hard Coal Mine on Water Quality in the Vistula River. Ann. Set Environ. Prot. 2013, 15, 2640–2651. [Google Scholar]
- Kondracki, J. Geografia Regionalna Polski; Naukowe PWN: Warsaw, Poland, 2009. (In Polish) [Google Scholar]
- Soil Survey Staff. Soil Taxonomy: A Basic System of Soil Classification for Making and Interpreting Soil Surveys, 2nd ed.; U.S. Department of Agriculture Handbook 436; Natural Resources Conservation Service: Washington, DC, USA, 1999.
- Burchard, J.; Dubaniewicz, H. Współczynnik zanieczyszczenia jako miara kompleksowej oceny stopnia zanieczyszczenia wód powierzchniowych na przykładzie Pilicy i Bzury. In Proceedings of the Materiały IX Ogólnopolskiej Konferencji Hydrograficznej, Łódź, Poland, 28–29 September 1981. [Google Scholar]
- Łomotowski, J.; Szpindor, A. Nowoczesne Systemy Oczyszczania Ścieków (Modern Wastewater Treatment Systems); Arkady: Warsaw, Poland, 1999. [Google Scholar]
- Rozporządzenie Ministra Środowiska z dnia 21 lipca 2016 roku w sprawie sposobu klasyfikacji stanu jednolitych części wód powierzchniowych oraz środowiskowych norm jakości dla substancji priorytetowych Dz. U. z 2016, poz. 1187; ISAP: Warsaw, Poland, 2016.
- Wu, J.Y.; Yan, Z.G.; Liu, Z.T.; Liu, J.D.; Liang, F.; Wang, X.N.; Wang, W.L. Development of water quality criteria for phenanthrene and comparison of the sensitivity between native and non-native species. Environ. Pollut. 2015, 196, 141–146. [Google Scholar] [CrossRef] [PubMed]
- Mohan, S.V.; Nithila, P.; Reddy, S.J. Estimation of heavy metal in drinking water and development of heavy metal pollution index. J. Environ. Sci. Health 1996, 31, 283–289. [Google Scholar] [CrossRef]
- Nasrabadi, T. An index approach to metallic pollution in river waters. Int. J. Environ. Res. 2015, 9, 385–394. [Google Scholar]
- Friedman, J. Multivariate Adaptive Regression Splines. Ann. Stat. 1991, 19, 1–67. [Google Scholar] [CrossRef]
- Hastie, T.; Tibshirani, R.; Friedman, J. Elements of Statistical Learning: Data Mining, Inference and Prediction; Springer: New York, NY, USA, 2001. [Google Scholar]
- Józefaciuk, C.; Józefaciuk, A. Komentarz do Instrukcji w Sprawie Inwentaryzacji Gruntów Zagrożonych Erozją; Wyd. IUNG: Puławy, Poland, 1999. [Google Scholar]
- Fu, J.; Zhao, C.; Luo, Y.; Liu, C.; Kyzas, G.Z.; Luo, Y.; Zhao, D.; An, S.; Zhu, H. Heavy metals in surface sediments of the Jialu River, China: Their relations to environmental factors. J. Hazard. Mater. 2014, 270, 102–109. [Google Scholar] [CrossRef]
- Rajda, W.; Kanownik, W. Some water quality indices in small watercourses in urbanized areas. Arch. Environ. Prot. 2007, 33, 31–38. [Google Scholar]
- Rajda, W.; Natkaniec, J. The impact of select forms of antropopression on quality of surface waters. Ann. Wars. Agric. Univ.—SGGW Land Reclam. 2001, 31, 65–74. [Google Scholar]
- Halecki, W.; Kruk, E.; Ryczek, M. Evaluation of water erosion at a mountain catchment in Poland using the G2 model. Catena 2018, 164, 116–124. [Google Scholar] [CrossRef]
- Halecki, W.; Kruk, E.; Ryczek, M. Estimations of nitrate nitrogen, total phosphorus flux and suspended sediment concentration (SSC) as indicators of surface-erosion processes using an ANN (Artificial Neural Network) based on geomorphological parameters in mountainous catchments. Ecol. Indic. 2018, 91, 461–469. [Google Scholar] [CrossRef]
- Halecki, W.; Kruk, E.; Ryczek, M. Loss of topsoil and soil erosion by water in agricultural areas: A multi-criteria approach for various land use scenarios in the Western Carpathians using a SWAT model. Land Use Policy 2018, 73, 363–372. [Google Scholar] [CrossRef]
- Ostrowski, K.; Bogdał, A. Loads of selected chemical components delivered by precipitation and flowing away from Wronowiec micro catchment. Acta Sci. Pol. Form. Circ. 2006, 5, 37–46. [Google Scholar]
- Bugajski, P.; Chmielowski, K.; Kaczor, G. Reliability of a collective wastewater treatment plant. J. Ecol. Eng. 2016, 17, 143–147. [Google Scholar] [CrossRef][Green Version]
- Skorbiłowicz, M. Identification and evaluation of pollution sources influence on quality of River Orlanka, NE Poland. Pol. J. Environ. Stud. 2007, 16, 304–310. [Google Scholar]
- Pytka, A.; Jóźwiakowski, K.; Marzec, M.; Gizińska, M.; Sosnowska, B. Impact assessment of anthropogenic pollution on water quality of Bochotniczanka river. Inf. Ecol. Rural Areas 2013, 3, 15–29. [Google Scholar]
- Thapa, R.; Gupta, S.; Reddy, D.V. Application of geospatial modelling technique in delineation of fluoride contamination zones within Dwarka Basin, Birbhum, India. Geosci. Front. 2017, 8, 1105–1114. [Google Scholar] [CrossRef]
- Rai, P.K.; Mishra, A.; Tripathi, B.D. Heavy metal and microbial pollution of River Ganga: A case study of water quality at Varanasi. Aquat. Ecosyst. Health Manag. 2010, 13, 352–361. [Google Scholar] [CrossRef]
- Thapa, R.; Gupta, S.; Guin, S.; Kaur, H. Assessment of groundwater potential zones using multi-influencing factor (MIF) and GIS: A case study from Birbhum district, West Bengal. Appl. Water Sci. 2017, 7, 4117–4131. [Google Scholar] [CrossRef]
- Thapa, R.; Gupta, S.; Gupta, A.; Reddy, D.V.; Kaur, H. Use of geospatial technology for delineating groundwater potential zones with an emphasis on water-table analysis in Dwarka River basin, Birbhum, India. Hydrogeol. J. 2018, 26, 899–922. [Google Scholar] [CrossRef]
- European Parliament and European Council. Directive 2000/60/EC of the European Parliament and of the Council Establishing a Framework for Community Action in the Field of Water Policy; OJ L 327, 21.12.2000; European Parliament and European Council: Brussels, Belgium, 2000. [Google Scholar]
- Halecki, W.; Młyński, D.; Ryczek, M.; Kruk, E.; Radecki-Pawlik, A. Applying an Artificial Neural Network (ANN) to Assess Soil Salinity and Temperature Variability in Agricultural Areas of a Mountain Catchment. Pol. J. Environ. Stud. 2017, 6, 2545–2554. [Google Scholar] [CrossRef]
- Su, S.; Zhi, J.; Lou, L.; Huang, F.; Chen, X.; Wu, J. Spatio-temporal patterns and source apportionment of pollution in Giantang River (China) using neural-based modeling and multivariate statistical techniques. Phys. Chem. Earth Parts A/B/C 2011, 36, 379–386. [Google Scholar] [CrossRef]
- Tu, J.; Xia, Z.G. Examining spatially varying relationships between land use and water quality using geographically weighted regression I: Model design and evaluation. Sci. Total Environ. 2008, 407, 358–378. [Google Scholar] [CrossRef]
- Hus, T.; Pulikowski, K. Content of nitrogen compounds in water flowing out of small agricultural catchments. Pol. J. Environ. Stud. 2011, 20, 895–902. [Google Scholar]
- Koc, J.; Glińska-Lewczuk, K. Hydrochemical characteristics of spring water in young glacial area on the example of the Łyna River headwater. J. Elementol. 2004, 9, 25–34. [Google Scholar]
- Purandara, B.K.; Varadarajan, N.; Venkatesh, B.; Choubey, V.K. Surface water quality evaluation and modeling of Ghataprabha River, Karnataka, India. Environ. Monit. Assess. 2012, 184, 1371–1378. [Google Scholar] [CrossRef]
- Kowalik, T.; Bogdał, A.; Kanownik, W.; Ostrowski, K.; Rajda, W. Quality and Functional Values of Waters Flowing away from Catchments of Planned Small Retention Storage Reservoirs in the Beskid Makowski and Żywiecki Mts; Monograph of UR Kraków; Wydawnictwo Uniwersytetu Rolniczego w Krakowie: Kraków, Poland, 2010; p. 94. [Google Scholar]
- Niczyporuk, A.; Wiater, J. The Influence of Basin use of Chwiszcza and Perebel River on Seasonal Quality of Discharge Water. Pol. J. Environ. Stud. 2006, 15, 397–400. [Google Scholar]
- Sharma, S.; Tali, I.; Pir, Z.; Siddique, A.; Mudgal, L.K. Evaluation of physicochemical parameters of Narmada River, MP, India. Researcher 2012, 4, 13–19. [Google Scholar]
- Haritash, A.K.; Gaur, S.; Garg, S. Assessment of water quality and suitability analysis of River Ganga in Rishikesh, India. Appl. Water Sci. 2016, 6, 383–392. [Google Scholar] [CrossRef]
- Halecki, W.; Barabasz, W. Seasonal potential transmission of pathogens associated with ground drinking water. Pol. J. Environ. Stud. 2017, 26, 2539–2543. [Google Scholar] [CrossRef]
- Kumar, M.; Rahman, M.M.; Ramanathan, A.L.; Naidu, R. Arsenic and other elements in drinking water and dietary components from the middle Gangetic plain of Bihar, India: Health risk index. Sci. Total Environ. 2016, 539, 125–134. [Google Scholar] [CrossRef] [PubMed]
- Yadav, K.K.; Gupta, N.; Kumar, V.; Sharma, S.; Arya, S. Water quality assessment of Pahuj River using water quality index at Unnao Balaji, M.P.; India. Int. J. Sci. Basic Appl. Res. 2015, 19, 241–250. [Google Scholar]
- Smith, C.J.; Oster, J.D.; Sposito, G. Potassium and magnesium in irrigation water quality assessment. Agric. Water Manag. 2015, 157, 59–64. [Google Scholar] [CrossRef]
- Jeziorski, A.; Paterson, A.M.; Watson, I.; Cumming, B.F.; Smal, J.P. The influence of calcium decline and climate change on the Cladocerans within low calcium, circumneutral lakes of 692 the Experimental Lakes Area. Hydrobiologia 2014, 722, 129–142. [Google Scholar] [CrossRef]
- Sobhanardakani, S.; Yari, A.R.; Taghavi, L.; Tayebi, L. Application of water quality pollution indices to assess the heavy metal contamination, Case study: Groundwater resources of Asadabad Plain in 2012. Arch. Hyg. Sci. 2016, 5, 221–228. [Google Scholar]
- Kanownik, W.; Kowalik, T. Variability of water resources flowing away from small agricultural catchment. Pol. J. Environ. Stud. 2010, 19, 65–71. [Google Scholar]
- Kanownik, W.; Pijanowski, Z. A Load of Selected Chemical Components Carried Away by the Outflow from Mountain Catchments. Pol. J. Environ. Stud. 2007, 16, 297–303. [Google Scholar]
- Trivedi, R.C. Water quality of Ganga River—An overview. Aquat. Ecosyst. Health Manag. 2010, 13, 347–351. [Google Scholar] [CrossRef]
- Naubi, I.; Zardari, N.H.; Shirazi, S.M.; Ibrahim, N.F.; Baloo, L. Effectiveness of water quality index for monitoring Malaysian River Water Quality. Pol. J. Environ. Stud. 2016, 25, 231–239. [Google Scholar] [CrossRef]
- Kanownik, W.; Kowalik, T.; Bogdał, A.; Ostrowski, K. Quality categories of stream waters included in the small retention programme in the Malopolska province. Pol. J. Environ. Stud. 2013, 22, 159–165. [Google Scholar]
- Yan, C.A.; Zhang, W.; Zhang, Z.; Liu, Y.; Deng, C.; Nie, N. Assessment of water quality and identification of polluted risky regions based on field observations & GIS in the Honghe river watershed, China. PLoS ONE 2015, 10, e0119130. [Google Scholar]
- Halecki, W.; Stachura, T.; Fudała, W.; Rusnak, M. Evaluating the applicability of MESS (matrix exponential spatial specification) model to assess water quality using GIS technique in agricultural mountain catchment (Western Carpathian). Environ. Monit. Assess. 2019, 191, 26. [Google Scholar] [CrossRef] [PubMed]
- Sharda, V.N.; Prasher, S.O.; Patel, R.M.; Ojasvi, P.R.; Prakash, C. Performance of Multivariate Adaptive Regression Splines (MARS) in predicting runoff in mid-Himalayan micro-watersheds with limited data. Hydrol. Sci. J. 2008, 53, 1165–1175. [Google Scholar] [CrossRef]


| Parameter | Unit | Value |
|---|---|---|
| Stream length (LG) | km | 5.11 |
| Direct tributaries length (LD) | 5.67 | |
| Lower-order tributaries length (L’D) | 6.96 | |
| Total length (LTot) | 17.71 | |
| Average width of catchment (Bz) | km | 2.09 |
| Circumference of catchment (Oz) | 14.80 | |
| Average length of catchment (Lz) | 4.62 | |
| Area of catchment (A) | km2 | 9.65 |
| Water network density (Gs) | km·km−2 | 1.84 |
| Watercourse slope (Jc) | % | 1.5 |
| Form index (CF) | – | 0.45 |
| Elongation index (CW) | 0.76 | |
| Circularity index (CK) | 0.55 | |
| Gravelius index (K) | 1.34 | |
| Annual average flow (SSQ) | m3·s−1·km−2 | 0.008 |
| Minimum average flow (SNQ) | 0.002 | |
| Annual minimum low (NNQ) | 0.001 | |
| Flow Q50% | 0.631 | |
| Flow Q1% | 3.109 |
| Parameter | Unit | Sampling Sites | |||||
|---|---|---|---|---|---|---|---|
| 1 | 2 | 3 | 4 | 5 | 6 | ||
| TSS | mg∙dm−3 | 6.50 | 4.87 | 8.47 | 55.79 | 5.77 | 63.99 |
| DO | 10.10 | 9.50 | 10.10 | 10.13 | 10.27 | 10.43 | |
| BOD5 | 1.50 | 2.12 | 1.92 | 2.11 | 2.21 | 1.95 | |
| COD-Mn | 6.11 | 7.85 | 8.03 | 7.42 | 7.53 | 6.72 | |
| PO43− | 0.07 | 0.05 | 0.04 | 0.08 | 0.03 | 0.08 | |
| PTot | 0.03 | 0.01 | 0.01 | 0.03 | 0.01 | 0.03 | |
| N-NH4 | 0.08 | 0.04 | 0.07 | 0.04 | 0.04 | 0.05 | |
| NH4+ | 0.09 | 0.06 | 0.09 | 0.05 | 0.05 | 0.06 | |
| N-NO2− | 0.02 | 0.01 | 0.01 | 0.01 | 0.01 | 0.02 | |
| NO2− | 0.05 | 0.04 | 0.04 | 0.05 | 0.04 | 0.05 | |
| N-NO3− | 0.76 | 0.56 | 0.63 | 0.98 | 0.71 | 1.31 | |
| NO3− | 3.36 | 2.48 | 2.81 | 4.33 | 3.14 | 5.79 | |
| TDS | 239 | 182 | 181 | 183 | 181 | 201 | |
| SO42− | 40.96 | 30.64 | 29.41 | 30.34 | 31.47 | 40.17 | |
| Cl− | 11.38 | 10.27 | 10.72 | 9.74 | 10.70 | 14.15 | |
| Ca2+ | 65.30 | 58.58 | 59.84 | 63.7 | 61.15 | 72.93 | |
| Mg2+ | 9.93 | 8.46 | 9.05 | 10.91 | 8.75 | 9.16 | |
| Na+ | 10.66 | 8.75 | 8.94 | 9.60 | 8.99 | 10.94 | |
| K+ | 2.64 | 2.63 | 2.52 | 2.09 | 2.66 | 3.05 | |
| Mn2+ | 0.32 | 0.26 | 0.27 | 0.42 | 0.26 | 0.18 | |
| FeTot | 0.66 | 0.30 | 0.38 | 0.96 | 0.38 | 0.65 | |
| Temperature | °C | 10.0 | 12.4 | 11.9 | 9.3 | 12.2 | 9.2 |
| pH | – | 7.94 | 7.98 | 7.99 | 7.92 | 8.01 | 7.98 |
| EC | μS∙cm−1 | 386 | 352 | 354 | 378 | 362 | 415 |
| Variable | Loading Factors | |||||
|---|---|---|---|---|---|---|
| Factor 1 | Factor 2 | Factor 3 | Factor 4 | Factor 5 | Factor 6 | |
| Temperature | −0.13 | 0.88 | −0.36 | −0.05 | 0.14 | −0.13 |
| FeTot | 0.07 | 0.39 | 0.73 | −0.52 | −0.10 | −0.17 |
| pH | −0.81 | 0.03 | −0.16 | −0.02 | 0.26 | −0.45 |
| DO | −0.43 | −0.82 | 0.26 | 0.15 | −0.14 | −0.13 |
| EC | −0.92 | −0.13 | 0.01 | 0.14 | −0.16 | −0.19 |
| BOD5 | 0.82 | −0.02 | 0.23 | 0.32 | 0.04 | −0.30 |
| COD-Mn | 0.30 | 0.73 | 0.19 | 0.46 | −0.31 | −0.06 |
| TSS | 0.93 | −0.20 | −0.06 | −0.06 | 0.20 | −0.11 |
| TDS | 0.91 | −0.30 | 0.02 | 0.02 | 0.19 | −0.12 |
| Ca2+ | −0.55 | 0.20 | 0.54 | 0.28 | 0.48 | 0.22 |
| Land-Use Type | Indicators of Metal Accumulation | ||
|---|---|---|---|
| HPI | HEI | HQ | |
| Arable land | 19 | 2.56 | 0.53 |
| Meadow | 13 | 2.67 | 0.45 |
| Forest | 12 | 2.56 | 4.56 |
© 2019 by the authors. Licensee MDPI, Basel, Switzerland. This article is an open access article distributed under the terms and conditions of the Creative Commons Attribution (CC BY) license (http://creativecommons.org/licenses/by/4.0/).
Share and Cite
Halecki, W.; Kowalik, T.; Bogdał, A. Multiannual Assessment of the Risk of Surface Water Erosion and Metal Accumulation Indices in the Flysch Stream Using the MARS Model in the Polish Outer Western Carpathians. Sustainability 2019, 11, 7189. https://doi.org/10.3390/su11247189
Halecki W, Kowalik T, Bogdał A. Multiannual Assessment of the Risk of Surface Water Erosion and Metal Accumulation Indices in the Flysch Stream Using the MARS Model in the Polish Outer Western Carpathians. Sustainability. 2019; 11(24):7189. https://doi.org/10.3390/su11247189
Chicago/Turabian StyleHalecki, Wiktor, Tomasz Kowalik, and Andrzej Bogdał. 2019. "Multiannual Assessment of the Risk of Surface Water Erosion and Metal Accumulation Indices in the Flysch Stream Using the MARS Model in the Polish Outer Western Carpathians" Sustainability 11, no. 24: 7189. https://doi.org/10.3390/su11247189
APA StyleHalecki, W., Kowalik, T., & Bogdał, A. (2019). Multiannual Assessment of the Risk of Surface Water Erosion and Metal Accumulation Indices in the Flysch Stream Using the MARS Model in the Polish Outer Western Carpathians. Sustainability, 11(24), 7189. https://doi.org/10.3390/su11247189