Abstract
Greenhouse gas (GHG) emissions are an important factor in the evaluation of green industrial growth, when low GHG emissions along with high industrial growth are expected. In this paper, the improvement of sustainable development of industry in China (2007–2015) was investigated via analysis of the relationships between the GHG emissions and energy consumption in comparison to European countries. A hierarchical cluster analysis (HCA) was conducted to distinguish industrial growth with GHG emission and energy consumption structures. The results of this research indicated that green industrial growth in Europe had a negative annual rate of GHG emissions. This contributed to the ratio of renewable energy consumption increasing to a maximum of 33% and an average of 16%. In comparison, the GHG emissions in China increased at a rate of 50% to 77% in the main industrial provinces since 2007 with their rapid industrial growth. The rate of GHG emissions decreased after 2012, which was 7% or less than the rate of emissions in the industrial provinces. Contrary to in Europe, the decreasing rate of GHG emissions in China was attributed to the improvement of fossil energy efficiency, as renewable energy consumption was less than 10% in most industrial provinces. Our data analysis identified that the two different energy consumption strategies improved green industrial growth in Europe and China, respectively. Our data analysis identified the two different energy consumption strategies employed by Europe and China, each of which promoted green industrial growth in the corresponding areas. We concluded that China achieved green industrial growth through an increase in energy efficiency through technology updates to decrease GHG emissions, which we call the “China Model.” The “Europe Model” proved to be quite different, having the core characteristic of increasing renewable energy use.
1. Introduction
The approach to a sustainability is a challenge to the industrial growth of both developed and developing countries. In Europe, it is important that the evaluation of sustainable industrial growth is relative to greenhouse gas (GHG) emissions. It has been reported that a remarkable reduction of GHG occurred in European Union countries with the application of sustainable industrial growth policies. The Environmental Kuznets Curve (EKC) affirmed that industrial growth without GHG is increasing in most European countries. Tsiantikoudis S. et al [1] stated that the results of the ARDL approach cannot validate the inverted U-shape of the EKC hypothesis, but an inverted N-pattern was confirmed. This was attributed to a change in the energy consumption structure. The traditional industries led to increasing GHG because fossil fuels were used as the main energy sources in most countries. As the idea of sustainable industrial growth spread, more European countries gradually adopted renewable energy—wind, solar biomass, and tidal energy—in their industrial growth to replace fossil fuels—oil and coal. As an example, a high rate of renewable energy consumption (over 30% in gross energy consumption) was observed in Austria. The Europe committee council released a target of achieving 20% renewable energy consumption by 2020.
In comparison, the economic growth in newly industrialized countries generated less GHG. For instance, the State Council of China issued the National Air Pollution Prevention and Control Action Plan in 2013, with the aim of achieving reductions of 47% of SO2, 32% of NOx, and 40% of CO2 emissions. It is noted that the increasing rate of industry growth was kept constant at 6–7% in China after the Plan was applied, which proposed the reserve relationship between industrial growth and environmental emissions [2]. This proposed that the sustainable growth of industries was achieved with the reduction of GHG emissions. This may be relative to the increase in renewable energy consumption, which had a positive effect on the GHG emission reduction in developing countries, such as India, Brazil, and Malaysia. However, a low ratio of renewable energy consumption in China indicates that a change of energy consumption was not primarily responsible for the GHG reductions. Consequently, sustainable industrial growth with GHG emission reductions in China is probably relative to its energy consumption model, which is quite different from that of Europe.
The aim of this study was to investigate the relationship between the structures of energy consumption and GHG emission during industrial growth in China in comparison to Europe. The relationships between the industry outputs and GHG emission were accessed to evaluate the improvement of sustainable development by industry. Renewable energy consumption was employed as an index to assess the efficiency of GHG emission reduction with industrial growth in different regions. The empirical analysis was carried out by hierarchical cluster analysis (HCA) to distinguish the different modes of sustainable industrial growth in European countries and China.
2. Literature Review
As defined by Wang and Li [3], the term green growth indicates that economic growth as well as natural assets continue to provide various resources and environmental services for human well-being. In most of the research on green growth, maintaining economic growth while reducing GHG emissions is one of the most important topics [4,5,6]. From the existing research, there are three main ways to achieve this goal: industrial structure upgrades, energy structure upgrades, and energy efficiency improvements driven by technological advances. In general, industrial upgrading and clean energy transformation are often accompanied by technological advances [7].
Structural upgrades of the industries can transform energy and emissions-intensive industries into capital and technology-intensive industries, thereby achieving the goal of green growth. Heavy industry is the largest source of GHG emissions in China. Lin and Liu [8] showed that these structural upgrades within heavy industry have made an important contribution to the reduction of carbon emission in China. Karmellos et al., [9] analyzed the carbon dioxide emissions and economic growth of European countries from 1960 to 1996 and found that the structural upgrades played the same role in carbon emissions reduction. Similar research can be seen in literatures [10,11,12]. In general, industrial restructuring and upgrading of energy structures are often accompanied by technological advances and energy efficiency improvements [13].
Energy structure transformation and upgrading can promote green growth. The replacement of traditional fossil fuels such as coal and oil by renewable energy sources such as hydropower, wind energy, solar energy, and nuclear energy can also reduce greenhouse gas and pollutant emissions while ensuring economic growth [14,15]. Hansen et al. [16] showed that Germany will build an energy system that aims to operate using 100% renewable energy, which will achieve the goal of zero emissions. The shortcomings of the clean transformation of energy structure are also obvious, as the cost of renewable energy is higher than that of fossil energy [17]. Other literature analyzes green growth from the perspective of technological progress. Technological progress can increase energy efficiency, which can in turn achieve energy saving, emission reduction, and green growth [18,19].
Different countries or different regions of a country have different levels of attention to green growth, and a comparison of these countries can provide inspiration for us to better formulate relevant policies [20,21]. Almost all of this research starts with the upgrading of industrial structures and discusses their contribution to green growth. But at the same time, as people pay more attention to green growth, green growth can also promote the transformation and upgrading of industrial structures [22].
Comparing China and some European countries can provide us with a good sample to investigate different patterns in terms of industrial structures, energy consumption structures, and green growth, which can ultimately help us to better understand and implement this mechanism of green growth.
3. Data and Methodology
3.1. Data
All the Chinese data were collected from the Chinese National Bureau of Statistics. All the European data were collected from the European Environmental Agency (EEA) and the Eurostat. The Eastern European countries including Romania, Poland, and Czech Republic were selected as investigation subjects. For comparison, the UK, Netherlands, Spain, Austria, Germany, and France were selected as developed country subjects in this study. Wind, solar, nuclear energy and natural gas were defined as green energy and the coal and oil were defined as traditional energy in the data collection process. The time period was from 2007 to 2016. All of the units of energy were converted into the weight of standard coal.
3.2. Methodology
3.2.1. Principal Component Analysis
Principal component analysis (PCA) is a method for the reduction of dimension, which reveals the structure of the data matrix [23]. In current work, a data matrix composed of the industrial output, GHG emission, and renewable energy consumption of European countries and China provinces, was established. Principal components (PCs) involving several non-correlation components were formed via the reduction of the variables in the dataset. A screen plot was used to determine the number of PCs, which is relative to each variable. The relationships between the variables can be accessed and visualized in two dimensions.
3.2.2. Hierarchical Cluster Analysis
Hierarchical cluster analysis (HCA) is a method that is used to illustrate and classify data to the type of cluster, as well as to measure the similarities for distinct data sources [24,25]. The theory of HCA is shown in Figure 1. HCA aims to divide and discriminate the data matrix in different hierarchies. The initial sequence is random and disordered. The order and direction are determined gradually in different hierarchies after each cluster. There are two strategies to divide the dataset: agglomerative hierarchical clustering (AGNES) and divisive hierarchical clustering (DIANA). In AGNES, all each data points were regard as a cluster. The statistical distances between the data points were evaluated. Two data points were merged into a new cluster according to the minimum distance. This combination process was repeated until the expected cluster number was obtained. DIANA works in the opposite way to AGNES. All the data points are regarded as one cluster and divided according to the maximum statistical distance. This division process was repeated until the expected cluster number was obtained.
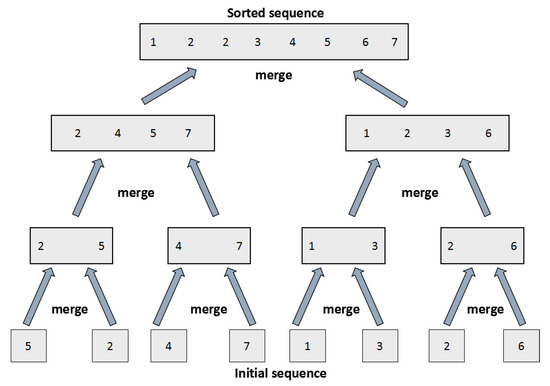
Figure 1.
The plot of the theory of hierarchical cluster analysis.
HCA can reflect the order and direction of a dataset, which means HCA can also access the linear relationship between variables through observation of the differences between clusters. It provides insight into the variety and the interaction to the linear relationships between the variables in a dataset under different clusters.
Statistical distance is a method used to evaluate the similarity between data points in HCA [26,27]. The similarity was calculated in Equation (1)
where Sim (a,b) represents the similarity between points a and b, which is relative to the distance d (a,b) between them. Because the result of cluster analysis is in line with the statistical distance matrix, the selection for statistical distance is critical in HCA.
There are several models for description of d (a,b) in HCA, such as Euclidean Distance, Manhattan Distance, Cosine Similarity, and Jaccard Similarity. In the current work, Euclidean Distance was selected due to the following reasons:
- The variable selection was subjective in the linear model. In the application of the linear model for the economic variable, the results of the t-test are the first considerable index that can be used to evaluate the relationship between one variable and a response variable. The variable index, R2, which assesses the importance of a variable to the linear model, can usually not be evaluated and the importance of the variable for the linear model cannot be accessed due to the complexity of economic and society variables. This leads to subjectivity in variable selection.
- The investigation object variables are numeric values and the regression of indices with the year is robust. The Jaccard Similarity was not considered. For the Cosine Similarity, the elements in each vector were defined into characters, which means the differences in numeric values were removed. Obviously, the Cosine Similarity is not adapted in this study. Because the dataset in this study is normal distribution and the units and forms of influence can be removed through normalization treatment, the Euclidean Distance was chosen as the statistical distance in this study.
The details of Euclidean Distance are as follows:
Euclidean Distance is the most used statistical distance measurement in HCA, which can describe the geometric distance between points x and y in a multidimensional space (Equation (2)). It is noted that the Euclidean Distance can be influenced by the unit of the original dataset. If there is a significant difference of the magnitude of x and y, the Euclidean Distance will produce incorrect information
where i represents the normalized values of evaluated indices in the year of x and y. The linkage method was chosen as an average to reduce the errors caused by outliers in this HCA. Accordingly, the HCA was conducted using the package of NbClust in R version 3.4.4, which is a free software environment for statistical computing and graphics. The NbClust package of HCA deploys Euclidean Distance.
Before the evaluation of HCA, the relationships between energy, GHG and the outputs of industry were evaluated using a linear regression model in the package of lm in R version 3.4.4. The linear regression is a common investigation method due to its simplified nature and commonness. Each significance level of independent variables was evaluated using the t-test to evaluate the relationship between it and the response variable.
4. Results
With an empirical analysis of HCA, the different models of industrial growth in European countries and China were evaluated through the relationship between renewable energy consumption and the efficiency of GHG emissions. The results were drawn as follows:
4.1. Change of Industry Growth in Europe with Energy-consumption Structure and GHG Emissions
The level of industrial growth in Europe (WE) and Central/Eastern Europe (EE) has different patterns. As shown in Figure 2a, an increase in industrial output was observed in Austria, Germany, and Belgium since 2010. Other WE countries showed little growth in their industries as no growth of the industrial output was observed. In contract, a sharp increase in industrial output occurred in Central/Eastern Europe (EE) since 2010. Among these countries, Romania and Poland saw a major increase in their industrial output, which suggests a fast increasing of economic growth in EE. It is noted that the industry growth rate of EE countries was similar to that of Austria and Germany.
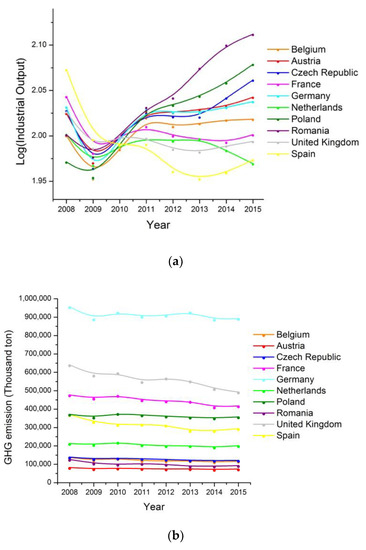
Figure 2.
The time-dependent change of industrial output in European countries (a) with corresponding GHG emissions (b).
In terms of pollution, the amount of GHG emission varied in EE and WE. Figure 2b shows that GHG emissions in Germany, the UK, and France was higher than those in other countries, consistent with their high industrial output among European countries. Despite this, the total GHG emissions in European countries were reduced. From 2007, the highest reduction rate of GHG emissions was 26% in Romania, followed by 23% in United Kingdom, and 20% in Spain. The lowest reduction rate of GHG emission was about 4% in Poland. This observation shows green industrial growth with the reduction of GHG emissions in Europe.
To further evaluate green industry growth in Europe, the annual increasing rate between GHG emission and industry output in European countries was figured out. Figure 3 shows that in most cases, the GHG emission increasing rate was negative, even with the positive increasing rate of industry output. One point that should be especially noticed is a positive increasing rate of GHG emissions in 2010 with the relatively decreasing of industrial growth, which was due to the financial and fiscal crisis since 2008 (Figure 2). Despite the positive increasing rate of GHG emissions, this reflects a green industrial growth pattern in European countries. It is noted that the increasing of renewable energy consumption in both WE and EE was encouraged, which improved the reduction of GHG emissions. Accordingly, the industrial growth pattern with the increase in renewable energy consumption for low GHG emission is popular in European countries.
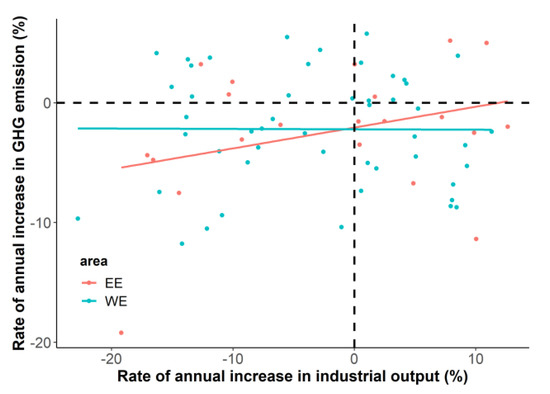
Figure 3.
Annual increasing rate between GHG emissions and industry output in European countries.
4.2. Growth of Industry in China
Figure 4 shows GHG emissions for the development of industry in China in 2007–2015. The GHG emissions in most provinces were increased (Figure 4a). Anhui province provided a GHG emissions rate of 77%, which was highest among Chinese provinces. The GHG emission rate in Jiangsu, Guangxi, and Sichuan were 50–54%. It is notable that the increasing of GHG emissions was inhibited since 2012 in all Chinese provinces except for Sichuan and Zhejiang. For instance, the rate of GHG emissions decreased by 10% in Anhui, 7% in Jiangsu, and 3% in Guangxi, respectively. This indicates that the reduction policy for GHG emissions worked in China. With GHG emission reductions, the industrial growth persisted. As shown in Figure 4b, the increasing of industrial output was recorded. This suggests that in China, the high industrial growth did not lead to high GHG emission.
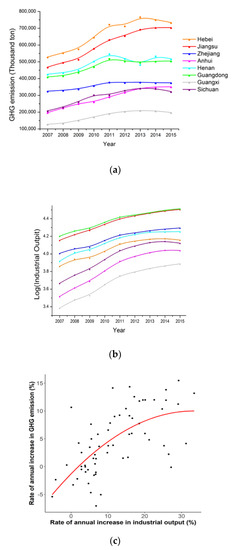
Figure 4.
GHG emission (a) and the industrial growth (b) (variable price) in China from 2007 to 2015 with their annual increasing rates (c).
Figure 4c shows the annual increasing rate between GHG emissions and industrial output in China. With the increase in the rate of annual industrial output growth, a sharp increase in the GHG emission rate was observed. It is noted that when the annual rate of industrial growth was higher than 20%, the annual increasing rate of GHG emissions was decreased and maintained at 10%. Thus, the GHG emissions were decreased at high rates of industrial growth, which was proposed to be sustainable in China. This is supported by the statistical result of the ratio between two annual increasing rates (RGHG/Output). In Europe, RGHG/Output was 0.17 via a linear fitting for EE (red curve) and 0 for WE (green curve), respectively (Figure 3). RGHG/Output in China changed from 0.68 to 0.27 with the rate of industrial growth ranging from 0% to 20%, but the industrial growth rate decreased to 0.07, or around 30%. Apparently, the controlling of GHG emissions in China seemed similar to that in Europe. However, fossil fuels are still the main energy supplement for Chinese industrial growth. It is supposed that the path of GHG emission reductions in China does not follow that of Europe.
Besides the replacement of fossil energy by renewable energy, the increase in energy consumption efficiency of fossil fuels such as coal and oil was an alternative way to promote industrial growth. This is what happened in China. This suggests that the reverse relationship between industrial growth and reduction of GHG emission in China is predominantly relative to the change of energy efficiency rather than to its energy consumption structure.
4.3. Driving Forces of GHG Emission Reduction with Industry Growth
To recognize the approaches to sustainable industrial growth in China and Europe, the energy consumption structure of these areas should be analyzed respectively as follows:
Figure 5a shows that the consumption of renewable energy was increased in Europe. A high consumption of renewable energy was observed in United Kingdom, Belgium, and the Czech Republic with the amount of renewable energy consumption reaching around 20 Mtce. The percentage of renewable energy in gross energy consumption (rrenewable) was correspondingly increased (Figure 5b). The value of rrenewable was 25% in Romania and 32% in Austria with the percentage among these countries therefore reaching at 16%.
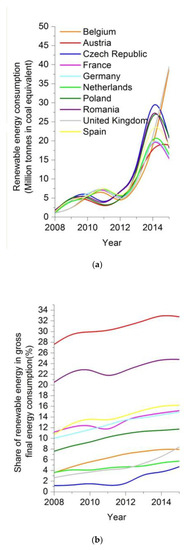
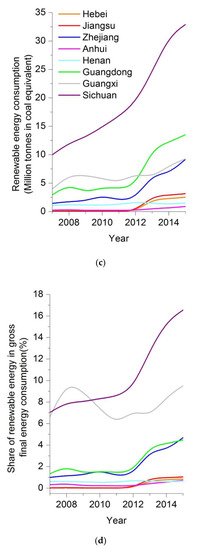
Figure 5.
Renewable energy consumption of European countries (a) with the share of renewable energy in gross energy consumption (b), compared the renewable energy consumption (c) and the share of renewable energy in gross energy consumption (d) of China.
In comparison, the amount of renewable energy consumption in Chinese provinces was below 15 Mtce. Only Sichuan provided an amount of renewable energy consumption 32 Mtce (Figure 5c). Despite this, the percentage of renewable energy in gross energy consumption in most China provinces increased since 2012. The level of rrenewable was less than 10% except in Sichuan province (16%) (Figure 5d). Therefore, this proposes that the effect of renewable energy on GHG emission was limited and did not support fast industrial growth. The low consumption of renewable energy in China suggests that industrial growth was supported by fossil fuel utilization.
Moreover, the impact of energy consumption structure on industrial output in China was identified compared to that in Europe. For this purpose, Figure 6 shows the annual relationship between renewable energy consumption and industrial output increasing in European countries and China. In Europe (Figure 6a), the annual increasing rate of renewable energy consumption was constant at around 2% regardless of the changing in the annual increasing rate of industrial output. In comparison, an inverted “U” curve was observed via the regression result of annual increasing rate between renewable energy consumption and industrial output in China (Figure 6b). The peak of 1.5% annual increasing rate of renewable energy consumption compared to a 10% increasing in the annual rate of industrial output. The annual rate of renewable energy consumption decreased with the annual increasing rate of industry output when it was higher or lower than 10%. Therefore, this observation indicates that energy efficiency was responsible for industrial growth in China.
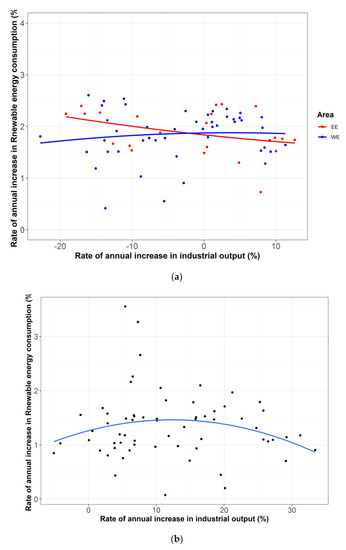
Figure 6.
Annual increasing rate between renewable energy consumption and industry output in European countries (a) and China (b).
To distinguish the model of energy consumption in different areas, the cluster dendrogram by HCA was figured out via industrial growth, GHG emissions, and renewable energy consumption. Figure 7a shows the driving force of industrial growth in various areas was divided into three groups: the United Kingdom group with Germany and France, other European countries, and China. This reflects three types of green industrial growth. The United Kingdom group with Germany and France are the industrial countries that led the reduction of GHG emissions for decades with increases in renewable energy consumption. In comparison, the high rate of renewable energy in the industrial growth in other European countries was developed to maintain reductions of GHG emissions. In China, fossil fuels were the main energy consumed for the industrial growth that released many GHG emissions. For 2015, the cluster result is similar to that for 2007 (Figure 7b). This reflects the renewable energy consumption increased industrial growth in Europe, especially in countries outside of the United Kingdom group with Germany and France. It is interesting that the energy consumption structure in China was different from that in European countries. This indicates that fossil fuel is still the main energy consumption source in China. In accordance with this, a different model of green industrial growth was identified in China from that in Europe, which was relative to their corresponding energy consumption.
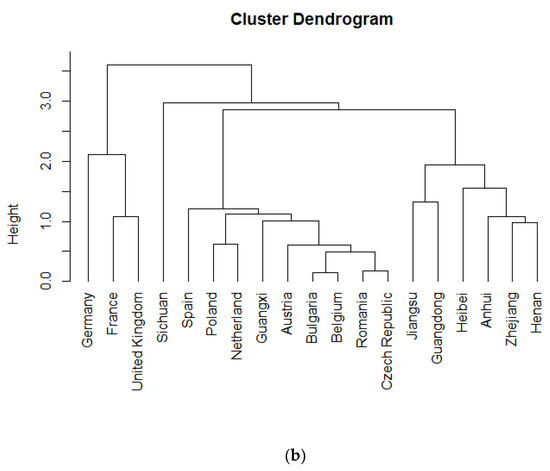
Figure 7.
The result of HCA of industrial growth with GHG emissions at different models of energy consumption at 2007 (a) and 2015 (b).
The different model of sustainable industrial growth are shown by the PCA method. As shown in Figure 8a, the data spot of European countries in 2007 kept close to PC2 while those of most China provinces kept close to PC1. As the contribution of renewable energy consumption to the GHG emission reduction in Europe, the PC2 stands for renewable energy consumption. As a result, the efficiency of primary energy has an effect on the decrease in GHG emissions in China, as PC1 stands for the contribution of energy efficiency. Moreover, in 2015, the model of energy consumption in Europe and China was similar to for 2007 (Figure 8b). It is indicated that for sustainable industrial growth, renewable energy consumption contributed to the GHG emission reductions in Europe at the negative annual increasing rate of GHG emission. For the same purpose, the increase in energy efficiency via the technology update to decrease GHG emission worked in China as there was a decrease in annual rate of GHG emissions (Figure 4c).
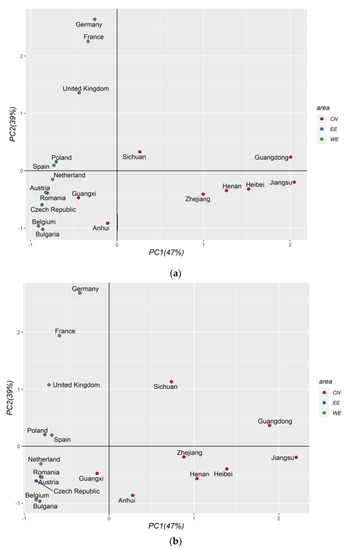
Figure 8.
The PCA result of industrial growth with GHG emission and renewable energy consumption in European countries and China at 2007 (a) and 2015 (b).
5. Discussion
For the model of green industrial growth between Europe and China, different strategies were adopted. According to the result in the current work, the characteristics between the China and Europe model are summarized and listed in Table 1, compared to that in previous work. In Europe, green productivity growth is the strategy, which is achieved via stringent environmental regulation policy [28,29]. However, the compliance cost effect would be high to maintain economic growth. This challenge could be solved via renewable energy consumption, which has been reported in Greece [30] and India [31,32]. As renewable energy consumption was promoted, industrial growth was accompanied with a relatively fast reduction of GHG emissions in European countries, which could be attributed to the change of energy consumption structure. We call this the Europe Model (EM).

Table 1.
Co-evaluation key-characteristics between the China and Europe models.
Meanwhile, in those countries where abundant coal or oil is produced, technological progress can reduce carbon intensity, which will increase the energy efficiency [33].The results in previous work have revealed that energy efficiency is improved in China recent decade [22,34]. Li and Lin [35] shows that China’s technological progress has reduced carbon dioxide emissions by 3.2% each year. China’s carbon emissions through consumption of oil, gas, and coal was 9428.8 million tons in 2018, which was reported in BP Statistical review of world energy 2019, which means that technological progress will reduce carbon emissions by 300 tons while other conditions remain the same. This is relative to industrial structure green adjustments, along with a market-based environmental regulation. In this situation, it is proposed that innovation of conversion technology in fossil fuel energy can be achieved in China, which would lead to the reduction of emission rate with a fast industrial growth. Thus, we label this strategy the China Model, which contrasts to the Europe Model with the core character of using more renewable energy. The findings enable an empirical analysis of the Porter Hypothesis and can further promote green growth in China.
6. Conclusions
In the current work, the effect of energy-consumption on green industrial growth with GHG emission was investigated in China, compared to that in Europe. The relationships between the industry outputs and the mass weights of green energy consumption with GHG emission were accessed to evaluate the improvement of green development on the growth of industry. Hierarchical cluster analysis (HCA) was conducted to distinguish the time points to evaluate the transformation of industrial and energy consumption structures. Through our research results we conclude:
(1) The green industrial growth in Europe contributed to the ratio of renewable energy consumption, which increased to a maximum of 33% and 16% on average. By replacing traditional fossil fuels with renewable energy, European countries were able to reduce their GHG emissions while maintaining economic and industrial growth.
(2) Although China’s total greenhouse gas emissions continue to rise, China still achieves a certain degree of green industrial growth, which can be largely attributed to the improvement of energy efficiency. Due to its huge energy consumption, China’s renewable energy proportion is difficult to raise to the level of European countries in the short term, which means that China’s green growth will continue to rely mainly on energy efficiency.
(3) In recent years, the consumption and proportion of renewable energy in China have been rising, and the growth rate of greenhouse gas emissions has been declining. However, in general, the increase in energy efficiency via the technology update to decrease GHG emissions worked in China, which we call the China Model. This is quite different from the Europe Model, which has the core character eristic of using more renewable energy. We conclude that either the utilization of renewable energy or the improvement of fossil energy efficiency through technological progress could be options to promote sustainable development.
Author Contributions
Conceptualization, Y.M and J.Z.; methodology, K.L.; investigation, K.L.; writing—original draft preparation, Y.M.; writing—review and editing, Y.M.; supervision, J.Z.; project administration, Y.M.
Funding
This research was funded by National Statistics Science Researching Project ‘Impact of aging on potential economic output’ (2018LY39).
Conflicts of Interest
The authors declare no conflict of interest.
References
- Tsiantikoudis, S.; Zafeiriou, E.; Kyriakopoulos, G.; Arabatzis, G. Revising the Environmental Kuznets Curve for Deforestation: An Empirical Study for Bulgaria. Sustainability 2019, 11, 4364. [Google Scholar] [CrossRef]
- Mao, Y.; Liu, Z.; Grigorescu, A.; Condrea, E. reverse relation of the industrial growths and environmental emissions in china by employment variety. J. Environ. Prot. Ecol. 2019, 20, 620–630. [Google Scholar]
- Wang, X.; Li, M. The Spatial Spillover Effects of Environmental Regulation on China’s Industrial Green Growth Performance. Energies 2019, 12, 267. [Google Scholar] [CrossRef]
- Van Vuuren, D.P.; Stehfest, E.; Gernaat, D.E.; Doelman, J.C.; Van den Berg, M.; Harmsen, M.; de Boer, H.S.; Bouwman, L.F.; Daioglou, V.; Edelenbosch, O.Y. Energy, land-use and greenhouse gas emissions trajectories under a green growth paradigm. Glob. Environ. Chang. 2017, 42, 237–250. [Google Scholar] [CrossRef]
- Dai, H.; Xie, X.; Xie, Y.; Liu, J.; Masui, T. Green growth: The economic impacts of large-scale renewable energy development in China. Appl. Energy 2016, 162, 435–449. [Google Scholar] [CrossRef]
- Antal, M.; Van Den Bergh, J.C. Green growth and climate change: Conceptual and empirical considerations. Clim. Policy 2016, 16, 165–177. [Google Scholar] [CrossRef]
- Huisingh, D.; Zhang, Z.; Moore, J.C.; Qiao, Q.; Li, Q. Recent advances in carbon emissions reduction: Policies, technologies, monitoring, assessment and modeling. J. Clean. Prod. 2015, 103, 1–12. [Google Scholar] [CrossRef]
- Lin, B.; Liu, K. Using LMDI to Analyze the Decoupling of Carbon Dioxide Emissions from China’s Heavy Industry. Sustainability 2017, 9, 1198–1214. [Google Scholar]
- Karmellos, M.; Kopidou, D.; Diakoulaki, D. A decomposition analysis of the driving factors of CO2 (Carbon dioxide) emissions from the power sector in the European Union countries. Energy 2016, 94, 680–692. [Google Scholar] [CrossRef]
- Zhao, M.; Tan, L.; Zhang, W.; Ji, M.; Liu, Y.; Yu, L. Decomposing the influencing factors of industrial carbon emissions in Shanghai using the LMDI method. Energy 2010, 35, 2505–2510. [Google Scholar] [CrossRef]
- Zhang, Y.; Da, Y. The decomposition of energy-related carbon emission and its decoupling with economic growth in China. Renew. Sustain. Energy Rev. 2015, 41, 1255–1266. [Google Scholar] [CrossRef]
- Du, Z.; Lin, B. Analysis of carbon emissions reduction of China’s metallurgical industry. J. Clean. Prod. 2018, 176, 1177–1184. [Google Scholar] [CrossRef]
- Guan, D.; Meng, J.; Reiner, D.M.; Zhang, N.; Shan, Y.; Mi, Z.; Shao, S.; Liu, Z.; Zhang, Q.; Davis, S.J. Structural decline in China’s CO 2 emissions through transitions in industry and energy systems. Nat. Geosci. 2018, 11, 551–555. [Google Scholar] [CrossRef]
- Shahsavari, A.; Akbari, M. Potential of solar energy in developing countries for reducing energy-related emissions. Renew. Sustain. Energy Rev. 2018, 90, 275–291. [Google Scholar] [CrossRef]
- Wei, Y.; Liang, Q.; Wu, G.; Liao, H. Effects of Clean and Renewable Energy on National Energy Security. Energy Econ. 2019, 81, 253–270. [Google Scholar]
- Hansen, K.; Mathiesen, B.V.; Skov, I.R. Full energy system transition towards 100% renewable energy in Germany in 2050. Renew. Sustain. Energy Rev. 2019, 102, 1–13. [Google Scholar] [CrossRef]
- Verdolini, E.; Vona, F.; Popp, D. Bridging the gap: Do fast-reacting fossil technologies facilitate renewable energy diffusion? Energy Policy 2018, 116, 242–256. [Google Scholar] [CrossRef]
- Li, K.; Lin, B. Impact of energy conservation policies on the green productivity in China’s manufacturing sector: Evidence from a three-stage DEA model. Appl. Energy 2016, 168, 351–363. [Google Scholar] [CrossRef]
- Liu, K.; Bai, H.; Yin, S.; Lin, B. Factor substitution and decomposition of carbon intensity in China’s heavy industry. Energy 2018, 145, 582–591. [Google Scholar] [CrossRef]
- Bajdor, P. Comparison between sustainable development concept and Green Logistics: The literature review. Pol. J. Manag. Stud. 2012, 5, 225–233. [Google Scholar]
- Jänicke, M.; Jörgens, H. Strategic environmental planning and uncertainty: A cross-national comparison of green plans in industrialized countries. Policy Stud. J. 2000, 28, 612–632. [Google Scholar] [CrossRef]
- Li, K.; Lin, B. Economic growth model, structural transformation, and green productivity in China. Appl. Energy 2017, 187, 489–500. [Google Scholar] [CrossRef]
- Liu, Z.; Zhou, J.; Zhang, J.; Mao, Y.; Huang, X.; Qian, G. Evaluation for the heavy metal risk in fine particulate matter from the perspective of urban energy and industrial structure in China: A meta-analysis. J. Clean. Prod. 2020, 244, 118597–118609. [Google Scholar] [CrossRef]
- Kwon, Y.; Kang, K.; Bae, C. Unsupervised learning for human activity recognition using smartphone sensors. Expert Syst. Appl. 2014, 41, 6067–6074. [Google Scholar] [CrossRef]
- Aravossis, K.G.; Kapsalis, V.C.; Kyriakopoulos, G.L.; Xouleis, T.G. Development of a Holistic Assessment Framework for Industrial Organizations. Sustainability 2019, 11, 3946. [Google Scholar] [CrossRef]
- Ward, J.H., Jr. Hierarchical grouping to optimize an objective function. J. Am. Stat. Assoc. 1963, 58, 236–244. [Google Scholar] [CrossRef]
- Van der Helm, F.C.; Veenbaas, R. Modelling the mechanical effect of muscles with large attachment sites: Application to the shoulder mechanism. J. Biomech. 1991, 24, 1151–1163. [Google Scholar] [CrossRef]
- Xiao, J.; Boschma, R.; Andersson, M. Industrial diversification in Europe: The differentiated role of relatedness. Econ. Geogr. 2018, 94, 514–549. [Google Scholar] [CrossRef]
- Wang, Y.; Sun, X.; Guo, X. Environmental regulation and green productivity growth: Empirical evidence on the Porter Hypothesis from OECD industrial sectors. Energy Policy 2019, 132, 611–619. [Google Scholar] [CrossRef]
- Kyriakopoulos, G.L.; Arabatzis, G.; Tsialis, P.; Ioannou, K. Electricity consumption and RES plants in Greece: Typologies of regional units. Renew. Energy 2018, 127, 134–144. [Google Scholar] [CrossRef]
- Gopinath, D. Why a clearer ‘green industrial policy’matters for India: Reconciling growth, climate change and inequality. Local Econ. 2016, 31, 830–835. [Google Scholar] [CrossRef]
- Swain, A.K. India’s green industrial policy. Econ. Political Wkly. 2014, 49, 19–23. [Google Scholar]
- Feng, Y.; Zhong, S.; Li, Q.; Zhao, X.; Dong, X. Ecological well-being performance growth in China (1994–2014): From perspectives of industrial structure green adjustment and green total factor productivity. J. Clean. Prod. 2019, 236, 117556–117569. [Google Scholar] [CrossRef]
- Tian, P.; Lin, B. Promoting green productivity growth for China’s industrial exports: Evidence from a hybrid input-output model. Energy Policy 2017, 111, 394–402. [Google Scholar] [CrossRef]
- Li, J.; Lin, B. Inter-factor/inter-fuel substitution, carbon intensity, and energy-related CO2 reduction: Empirical evidence from China. Energy Econ. 2016, 56, 483–494. [Google Scholar] [CrossRef]
- Lin, B.; Zhang, G. Can Industrial Restructuring Significantly Reduce Energy Consumption? Evidence from China. Emerg. Mark. Financ. Trade 2018, 54, 1082–1095. [Google Scholar] [CrossRef]
- Lorentzen, A.; Widmaier, B.; Laki, M. Institutional Change and Industrial Development in Central and Eastern Europe; Ashgate Pub Co: London, UK; New York, NY, USA, 2018. [Google Scholar]
- Guo, L.-L.; Qu, Y.; Wu, C.-Y.; Wang, X.-L. Identifying a pathway towards green growth of Chinese industrial regions based on a system dynamics approach. Resour. Conserv. Recycl. 2018, 128, 143–154. [Google Scholar] [CrossRef]
© 2019 by the authors. Licensee MDPI, Basel, Switzerland. This article is an open access article distributed under the terms and conditions of the Creative Commons Attribution (CC BY) license (http://creativecommons.org/licenses/by/4.0/).