Article

Spatial Distribution Characteristics of Soil Salinity and Moisture and Its Influence on Agricultural Irrigation in the Ili River Valley, China

1
Xinjiang Institute of Ecology and Geography, Chinese Academy of Sciences, Urumqi 830011, China
2
University of Chinese Academy of Sciences, Beijing 100049, China
3
College of Resource and Environment Sciences, Xinjiang University, Urumqi 830046, China
*
Author to whom correspondence should be addressed.
Sustainability 2019, 11(24), 7142; https://doi.org/10.3390/su11247142
Submission received: 6 November 2019 / Revised: 7 December 2019 / Accepted: 10 December 2019 / Published: 13 December 2019

Abstract

:
Soil salinization is a global problem, which threatens agricultural productivity and sustainability, especially in arid and semi-arid regions. Soil salinity and moisture are important factors affecting agricultural production in arid regions. However, few studies have considered the influence of topographic factors on the spatial distribution patterns of soil salinity and moisture. This research aims to explore the spatial distribution characteristics and its influencing factors of soil salinity and moisture in the oasis farmland of arid areas. In this paper, GIS and geostatistics methods were applied to analyze the spatial distribution characteristics and variability of soil salinity and moisture, and then the corresponding proxy variables were used to quantitatively study the influence factors by using the geographical detector model. The results showed the coefficients of the variation of soil salinity and moisture to be 71.25% and 31.89%, respectively. There was moderate spatial autocorrelation of soil salinity and moisture. Soil salinity in the southwest was higher than in the northeast, and soil moisture in the northwest and southeast were lower than in the center and the northeast edge. The main influencing factors were available phosphorus, roughness of terrain, alkaline nitrogen, available potassium, and elevation. Combined action of topographic factors and soil nutrients has a major influence on the spatial distribution of soil salinity and moisture. Therefore, developing a suitable fertilizer regime under different topographic conditions could be an effective way to promote the sustainability of oasis agriculture in arid areas.

1. Introduction

Salinization is a worldwide problem and is particularly acute in semi-arid areas. The area of salinized soil in the world is about 9.55 × 10 8 hm2, among which the salinized soil area accounts for about 3.78% of the total area in China [1,2], most of which is distributed in arid and semi-arid areas of China [3]. The stability of an oasis ecological environment is related to the survival of humans, social stability, and sustainable development of the economy in the whole arid area. However, the problem of soil salinization and secondary soil salinization caused by the rapid development of oasis irrigation agriculture not only restricts sustainable development of oasis agriculture but also affects the overall stability of the oasis ecological environment [4,5]. Therefore, it is of great practical significance to explore possibilities for preventing and controlling soil salinization for the maintenance of oasis agricultural production and regional stability.
The spatial heterogeneity of soil salinity and moisture is an important factor affecting agricultural production, and the distribution of both impacts the spatial distribution of soil salinization to a certain extent [6,7]. Therefore, exploring the spatial distribution pattern and its driving factors of soil salinity and moisture can provide a basis reference for improving soil salinization, increasing agricultural production, and maintaining regional stability.
In the arid and semi-arid areas of northwest China, the largest salinization area is in Xinjiang, where the area of saline-alkali soil accounts for about a third of the total area of cultivated land [8,9]. Qapqal Xibe Autonomous County is a typical agricultural irrigation area in Ili River Valley, China. Its terrain is a multi-stage ladder from the south to the north that is narrow in the east, wide in the west, high in the south, and low in the north. In recent years, the high degree of soil and water exploitation in the agricultural irrigation area of the Ili River Valley, coupled with the complex and diverse topography, has led to increased soil salinization. Therefore, it is urgently necessary to understand and master the degree and distribution of soil salinization in the region to promote the sustainable development of agriculture. The spatial distribution of soil salinity and moisture is affected by multiple factors [10,11]. Moreover, the driving factors of soil salinity and moisture interact with each other, as the interaction of topography and climate can cause the variation of soil salinity and moisture to a certain extent, especially in arid areas [12]. However, it is unclear how driving factors interact with each other. Few studies have explored the effect of the interaction between multiple factors on the spatial distribution of soil salinity and moisture. The geographical detector model is a research method that can quantitatively detect the main driving factors and the interaction between different driving factors by analyzing the difference between the intra and inter layer variance in the spatial heterogeneity of research objects [13,14]. Consequently, the geographical detector model can be used to fill this gap. Therefore, we hypothesized that topographical factors and soil nutrient factors were the major driving factors in the oasis farmland of arid areas, and detected the differences in dominant drivers by using a geographical detector model.
The objectives of this paper are the following: (1) to explore the spatial distribution characteristics of soil salinity and moisture; (2) to identify the influential factors of spatial variation of soil salinity and moisture; and (3) to determine the interaction between factors affecting the spatial distribution of soil salinity and moisture in a typical agricultural irrigation area of the oasis in an arid area. Finally, we provide a reference for comprehensively mastering the degree and distribution of salinization, the prevention of salinization, and the stable agricultural production and sustainable development of oasis agriculture.
The remainder of this study is organized as follows. Section 2 presents a literature review of the soil salinity and moisture. Section 3 describes the study areas, sample collection, and analysis methods, and presents the methods used in this paper. Section 4 analyzes the spatial variability of soil salinity and moisture and identifies the main factors influencing the spatial distribution of soil salinity and moisture. Section 5 discusses the main results of our research. Section 6 presents the conclusions of this study.

2. Literature Review

In recent years, the research on spatial variability of soil salinity and moisture has made great progress. The existing body of research on soil salinity and moisture suggests that the spatial variability of soil salinity and moisture is mostly the combined result of natural and human factors [15,16,17], and is closely related to many external factors such as distance from the river, groundwater, topography, irrigation modes, and environment [18,19,20,21,22,23,24]. Cemek, et al. [6] examined the spatial variability of soil properties affecting salinity and alkalinity on the Bafra plain of northern Turkey and found that 1) the spatial variability of soil properties in different soil layers is different, and 2) the spatial dependence of soil properties was mainly caused by external factors such as groundwater, drainage, irrigation system, and microtopography. Bhunia et al. [25] applied a geostatistical model to analyze the spatial variability of soil properties in lateritic soils of West Bengal, India. They pointed out that land management has a certain impact on soil quality and the geostatistics model is a very effective method to explore the spatial variability of soil properties. Qi et al. [26] found that different tillage and mulching modes had significant effects on the spatial distribution of soil salinity and moisture under drip irrigation.
In areas with relatively consistent climate and parent material, topography is an important condition that indirectly causes the redistribution of material and energy in soil, and different topography conditions significantly impact on the spatial variability of soil properties [21,27,28,29]. Zhang et al. [30] indicated that topography plays an important role in the spatial distribution pattern of saline-alkali soil on the regional scale, and further point out that topography has a great influence on the distribution pattern of salt on the surface (0–20 cm) and middle (20–60 cm) layers. Zhao et al. [31] analyzed the seasonal changes of soil nutrients by using classical statistics and geostatistics methods and indicated that topography, vegetation, and human disturbance were the main factors causing the differences of soil nutrient patterns in the Mun River Basin. Canto´n et al. [32] explored the relationship between the spatial distribution of ground cover and topographic attributes in the Tabemas badlands of SE Spain and pointed out that slope and concave slopes have a significant correlation with vegetation coverage. Yang et al. [33] found that the influence of micro-topography on the spatial distribution of soil salinity is different in dry years and wet years. Although many studies explored the spatial distribution pattern of soil salinity and moisture [34,35], there are still relatively few studies on the influence of topographic factors on spatial distribution patterns in the oasis farmlands of arid areas.
Additionally, there are some differences in the spatial variation of soil salinity and moisture in different scales [36,37]. Ma, et al. [38] indicated that the variation of soil salinity is controlled by topographic, climatic, and hydrological factors at the scale. Ren, et al. [39] explored the correlation between soil salinity with groundwater, topography, irrigation, and other factors with three scales. The results showed that the soil salinity distribution was obviously affected by micro-topography and the field irrigation at the field scale, while it was main affected by topography and groundwater depth at the regional scale. Zhang, et al. [8] showed that soil salinity was more influenced by human factors on a small spatiotemporal scale, but natural factors such as topography, groundwater and climate conditions had greater influence on large spatiotemporal scales. Overall, the spatial distribution of soil salinity and moisture and the mechanisms responsible for the distribution are different in different regions and scales.

3. Materials and Methods
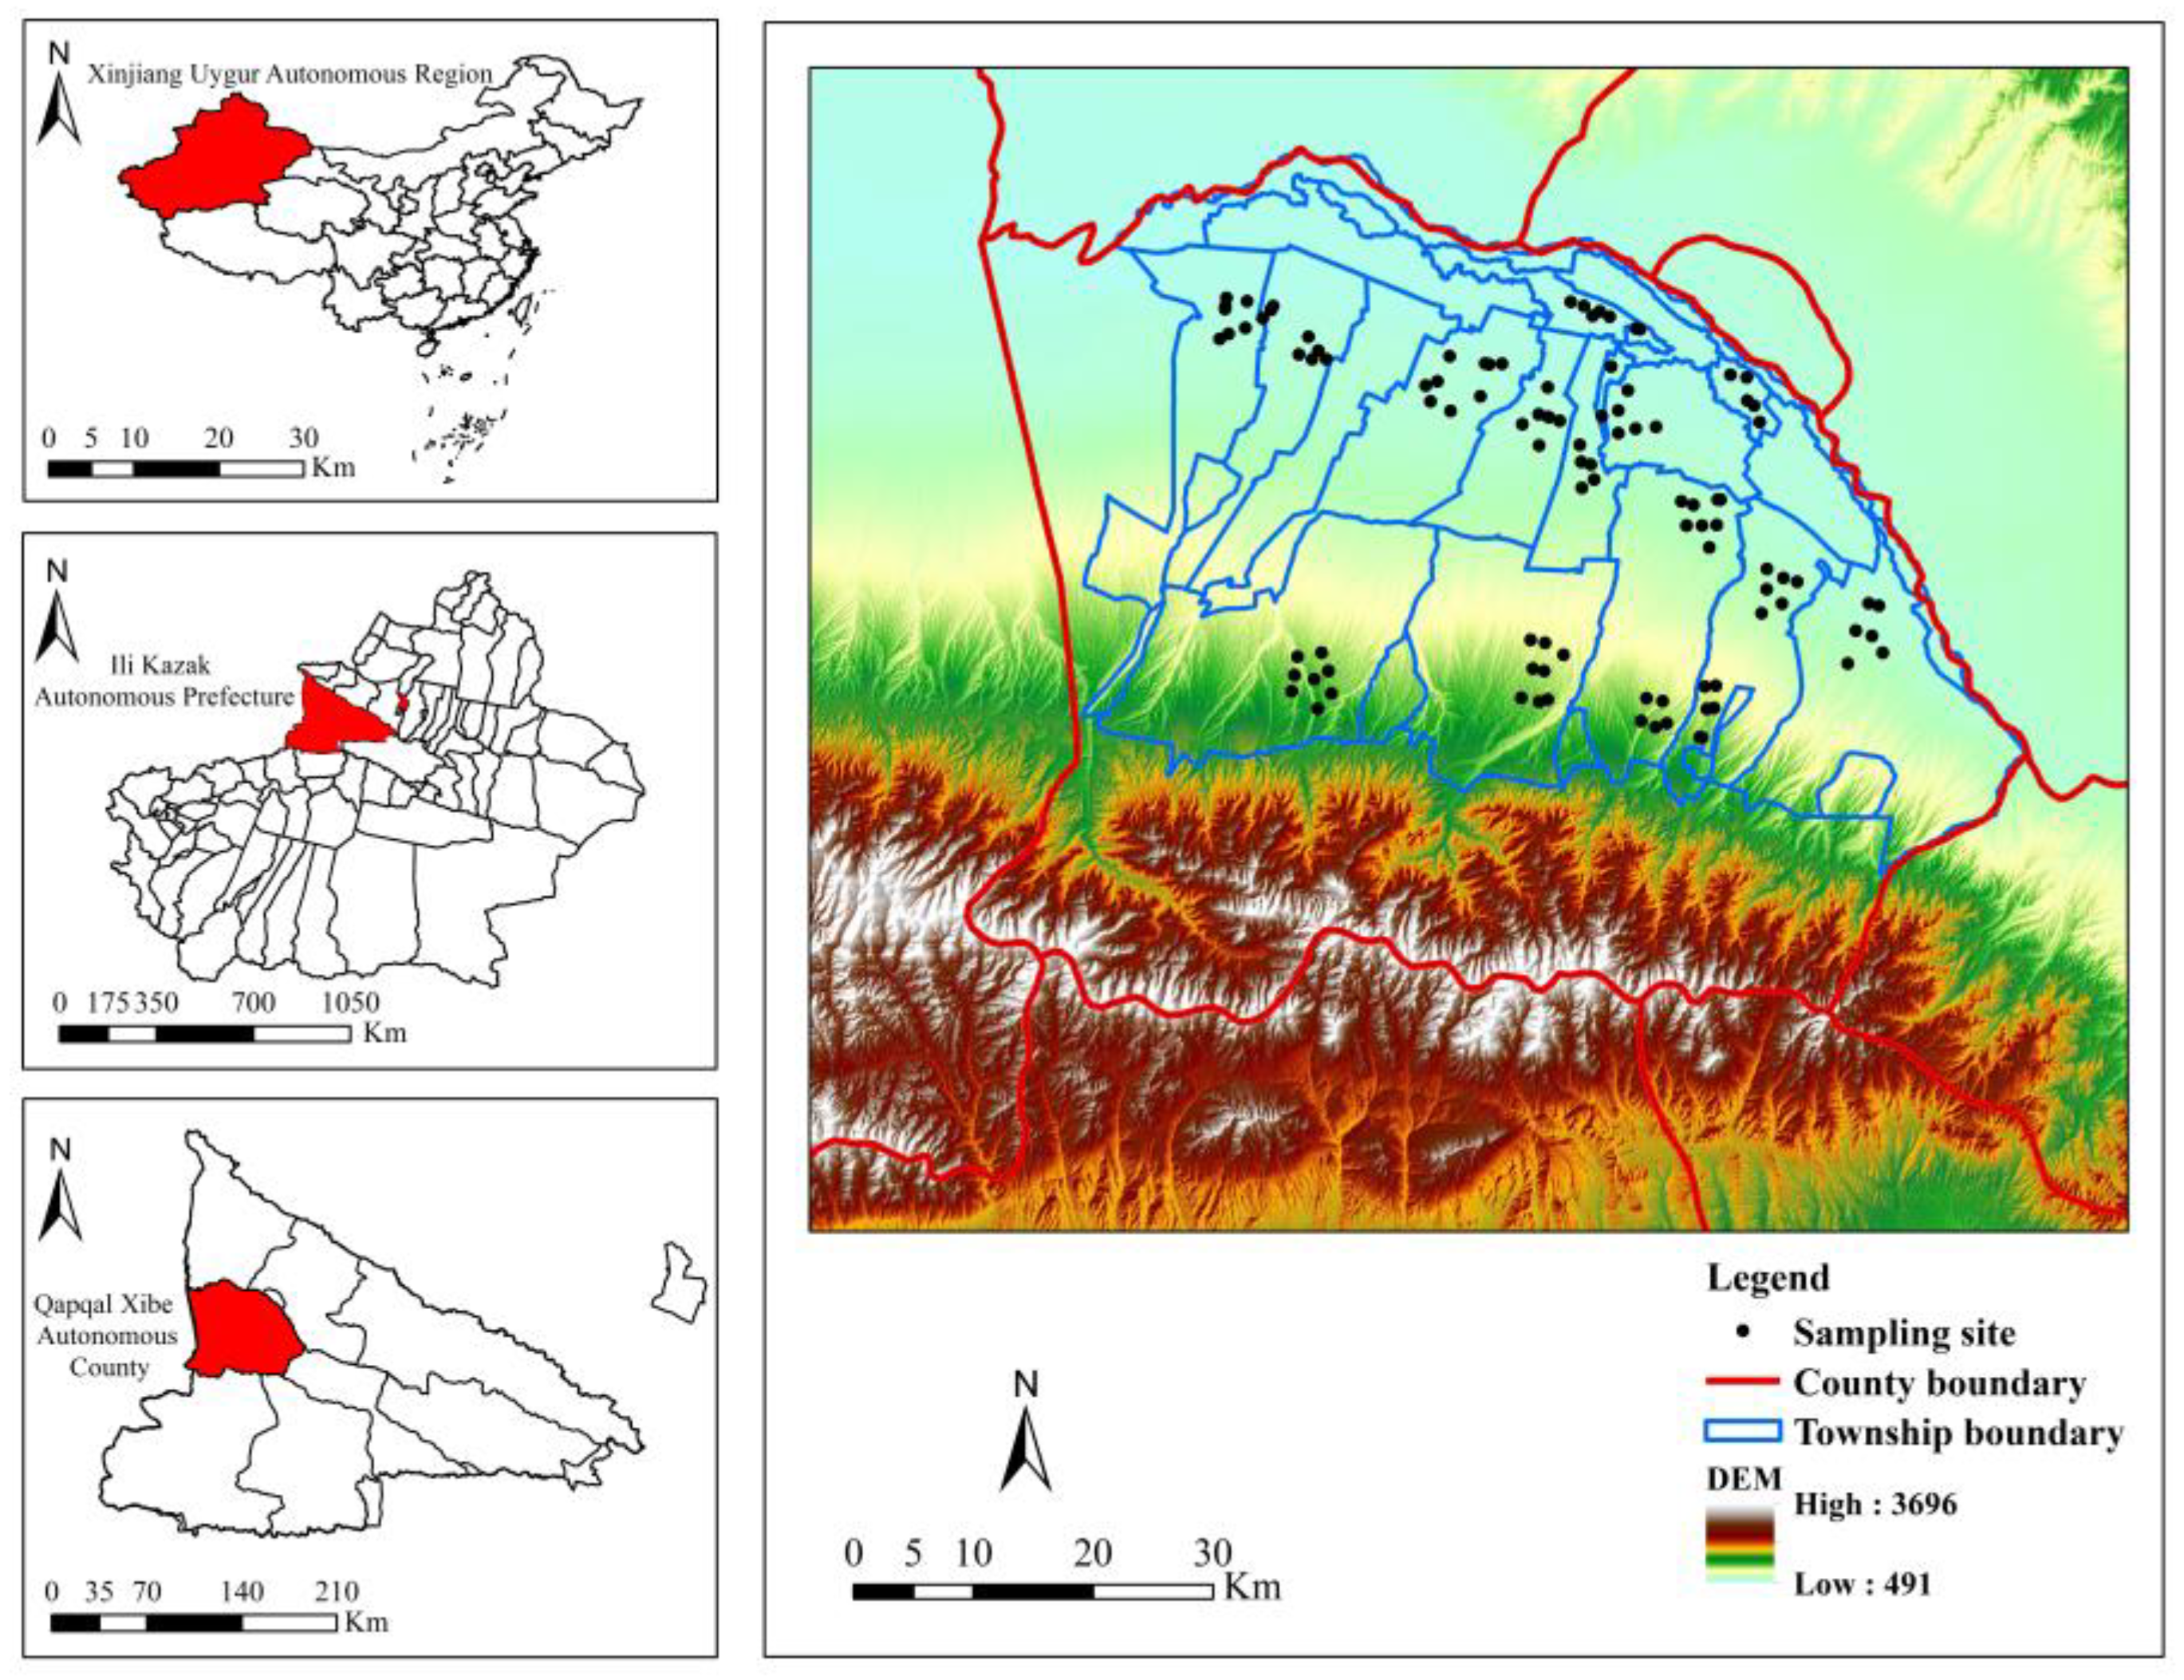
3.1. Study Area

Qapqal Xibe Autonomous County is situated in the inclined plain area at the north foot of Wu Sun Mountain in the west of the central Tian Shan Mountains, in the Ili valley basin of the western part of Xinjiang, China. The area produces high-quality grain, cotton, oil, and special agricultural products in Xinjiang, China [40] (Figure 1). The geographical coordinates are 43°17′–43°57′ N, 80°31′–81°43′ E. The study area has a typical continental temperate semi-arid climate, with an average annual temperature of 7.9 °C and annual average precipitation of 206 mm. Furthermore, precipitation levels are higher in the south and east than in the north and west. The terrain in the south is higher than in the north, and slopes from southeast to northwest. The elevation ranges from 640 to 670 m and is highest in the southeast, and lowest in the northwest. The zonal soil is mainly composed of sierozem. There are abundant land resources in the county, and the irrigated area is about 9.26 × 10⁴ hm2. In recent years, to improve the utilization rate of soil and water resources in the Ili River Basin, a large number of land resources have been reclaimed and the effective soil layer is thin in this county. Therefore, it is faced with the risk of soil erosion and salinization caused by agricultural irrigation after reclamation.

3.2. Sample Collection and Analysis Methods
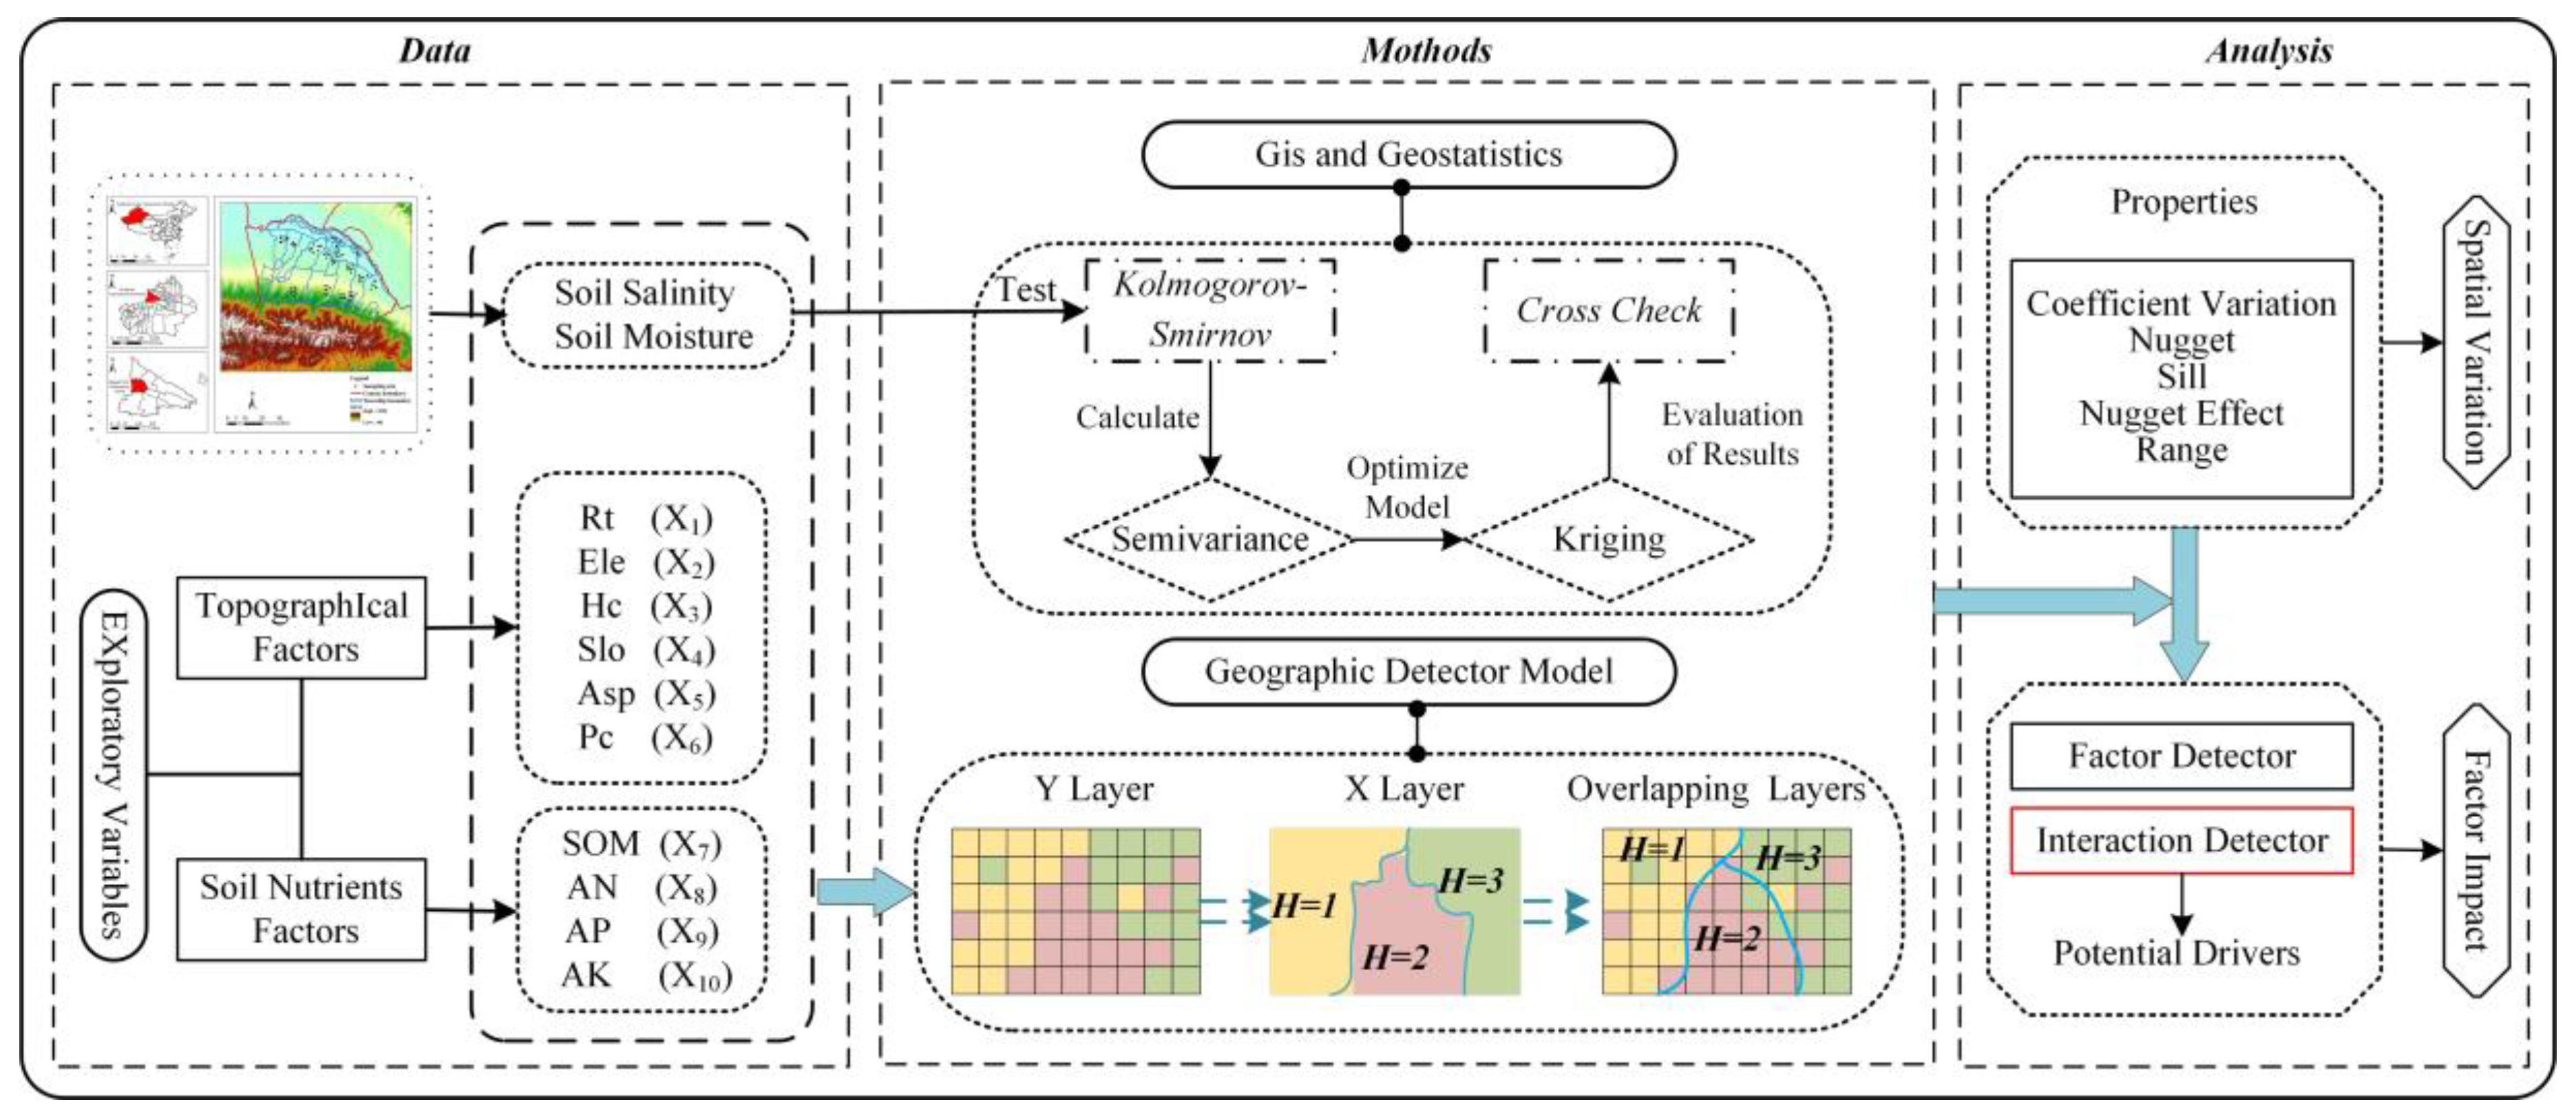
In October 2015, we investigated the surface soil of 14 villages and towns in a typical agricultural and irrigation area of Qapqal Xibe Autonomous County (Figure 1). The county has been planting corn, rice, wheat, and other crops all year-round. At present, the planting pattern of "corn as the main crop, rice as the auxiliary" has been formed in the country. Therefore, based on the characteristics of perennial crop species, topography, soil types, and fertility, we selected 4–5 representative strip fields in each township. Sampling of the same field was performed according to an S-shaped line. Five samples were taken from each field, and the soil samples at each point were mixed into one sample using the quartering method. The dry weight of the soil samples was about 1 kg, and 72 samples were collected. We used a sampling interval of about 1–2 km and a sampling depth of 0–20 cm. All soil samples were collected under uniform climatic conditions.
The soil samples were taken back to the laboratory, impurities were removed, then it was dried naturally, ground, and passed through a 2 mm sieve. A 1:5 soil water mass ratio extract was prepared to determine the content of soil salt. Soil moisture content was determined by the oven-drying method [41].

3.3. Methodology

3.3.1. Geostatistical Analysis

Geostatistical methods were used to explore the spatial variability of the soil salinity and moisture. The semivariance function is a basic geostatistical tool and is a key function for studying soil variability. The function includes several important parameters such as nugget (C0), sill (C0 + C1), nugget effect C0/(C0 + C1) and range (A0). It can be used to reveal the spatial correlation of soil properties [42]. The estimation formula is given by
γ ( h ) = 1 2 N ( h ) i = 1 N ( h ) [ Z ( χ i ) Z ( χ i + h ) ] 2 ,
where γ (h) is the semi-variance of the samples, h is the distance between two sampling points (also known as the lag distance), N (h) is the number of paired data points at a distance interval h, and Z (χi) and Z (χi + h) are the observed values of the sampling point of Z at the spatial position χi and χi + h, respectively.
Generally speaking, C0 represents the variation caused by random factors, (C0 + C1) represents the total variation of the system, C0/(C0 + C1) reflects the spatial dependence of soil properties, which is an important indicator to measure the spatial variation of regionalized random variables [43]. When C0/(C0 + C1) < 25%, there is a strong spatial correlation, which is caused by structural factors. When 25% < C0/(C0 + C1) < 75% there is medium spatial correlation, which is caused by both structural and random factors. When C0/(C0 + C1) > 75% the spatial correlation is much weaker, which is mostly caused by random factors. A nugget effect to 1 means that there is constant variation on the whole scale [42]. A0 indicates the size of the spatial autocorrelation range of soil properties. Kriging interpolation is a method of unbiased optimal estimation for the value of a regionalized variable in the area without sampling by using the structural characteristics of the original data and semivariance of the regionalized variable [43]. Therefore, we adopted the kriging interpolation to analyze the spatial distribution pattern of soil salinity and moisture.

3.3.2. Geographical Detector

Extraction of Model Factors

Considering data availability of data and calculation feasibility, we selected ten exploratory variables to detect the spatial variation of soil salinity and moisture, including roughness of terrain (Rt, X1), elevation (Ele, X2), horizontal curvature (Hc, X3), slope (Slo, X4), aspect (Asp, X5), profile curvature (Pc, X6), organic matter (SOM, X7), alkaline nitrogen (AN, X8), available phosphorus (AP, X9), and available potassium(AK, X10) (Table 1). All exploratory variables were classified by the natural breaks classification method in ArcGIS 10.2.
In particular, based on previous research results [32,44,45], topographical factors were extracted from DEM data with a resolution of 30 m by using the Spatial Analysis Tools in ArcGIS 10.2. In this study, we extracted 6 representative topographic factors to reflect the topographic features of the study area. Elevation can be directly extracted from DEM data, and roughness of terrain, horizontal curvature, slope, aspect and profile curvature are realized by the 3D Analysis calculation tool in ArcGIS 10.2 [46,47,48] (Table 2).
The organic matter content in the soil was determined by the potassium dichromate volumetric method. The alkaline nitrogen soil content was determined by the alkali-hydrolysed diffusion method. The available phosphorus in the soil was extracted using 0.5mol·L-1 sodium bicarbonate with the anti-colorimetric method and tested with a UV-2550 spectrophotometer. The available potassium in the soil was determined by the ammonium acetate extraction-flame photometer method [41].

Geographical Detector Model

The geographical detector model is a research tool for analyzing spatial heterogeneity [13,14]. In this study, this model is used to quantitatively analyze the driving factors of the spatial distribution of soil salinity and moisture in the study areas, and determine the interaction between each factor. The principle of the geographical detector is given by
q = 1 h = 1 L i = 1 N h ( Y h i Y ¯ h ) 2 i = 1 N ( Y i Y ¯ ) 2 = 1 h = 1 L N h σ h 2 N σ 2 = 1 S S W S S T ,
SST = i N ( Y i Y ¯ ) 2 = N σ 2 ,
SSW = h = 1 L i N h ( Y h i Y ¯ h ) 2 = h = 1 L N h σ h 2 ,
where q (q∈ [0, 1]) represents the size of the driving force; h = 1, , L is the layer of the explanatory variable X; Nh and N are the number of samples in the layer h and the total region, respectively; Yi and Yhi denote the value of unit i in the population and the layer h, respectively; and σ h 2 and σ 2 are the variance in the h layer and the variance in the region, respectively. SST is the total sum of squares and SSW is the within sum of squares. A larger q value indicates stronger spatial heterogeneity or greater randomness in the spatial distribution. When q = 0, there is no spatial heterogeneity of the study objects. When q = 1, there is perfect spatial heterogeneity [49].

3.4. Data Analysis and Processing

The basic statistical characteristics of the experimental data such as mean, maximum, minimum, standard deviation, coefficient variation were analyzed by SPSS 19.0, and the Kolmogorov-Smirnov test was used to test the normal distribution of the experimental data. The software of GS + 9.0 was used to convert the logarithm of the experimental data that did not conform to the normal distribution, and the semivariance function was used for calculation and optimization. According to the fitting model and its parameters, ArcGIS 10.2 software was used to conduct kriging interpolation analysis. From this analysis, the spatial interpolation distribution map of soil salinity and moisture can be obtained, and further evaluation of the interpolation results was performed by cross-checking. Finally, the driving factors of the spatial distribution of soil salinity and moisture were investigated by using the geographic detector model. In summary, the whole flow of this study can be given in Figure 2.

4. Results

4.1. Statistical Characteristics of Soil Salinity and Moisture

As shown in Table 3, soil salinity ranged from 0.0137% to 0.4407%, with an average value of 0.1345%, indicating that the slightly salinized soil is rather widely distributed. Soil moisture ranged from 0.2547% to 1.1980%, and the mean value was 0.6082%. The calculation of the variation function requires that the data follow the normal distribution [42]. Therefore, the K-S method is used to test whether the data are normally distributed. Soil salinity obeyed the lognormal distribution, while soil moisture obeyed the normal distribution. Both soil salinity and moisture met the basic requirements of geostatistical analysis. The Coefficient variation (CV) can reflect the degree of dispersion of random variables. A CV < 10% generally denotes weak variability, while 10% < CV < 100% denotes moderate variability, and CV > 100% denotes strong variability [50]. The variation coefficients of soil salinity and moisture were 71.25% and 31.89%, respectively, demonstrating that both conditions exhibit medium variation, Nevertheless, the variation in the degree of soil salinity was significantly higher than that of soil moisture.

4.2. Spatial Variability of Soil Salinity and Moisture

The semivariance function was used to analyze the spatial variability of soil salinity and moisture (Table 4). The optimal theoretical model chosen for soil salinity and moisture were the spherical and Gaussian models, respectively. The nugget effects of soil salinity and moisture in the study area were 40.97% and 41.61%, respectively. We found a moderate degree of spatial autocorrelation for both soil salinity and moisture, indicating that the spatial variability of both conditions was affected by structural factors (topography, soil types, parent material, climate, etc.) and random factors (irrigation, fertilization, farming methods, planting crops and cropping system, etc.) working together. The distances for the spatial variability of soil salinity and moisture were 1010 m and 2390 m, respectively. Thus, the variability in distance of soil salinity is relatively smaller. In summary, the spatial variability of soil salinity and moisture was similar.

4.3. Spatial Pattern of Soil Salinity and Moisture

According to the theoretical model determined by the semivariance analysis and the existing observation data, the kriging interpolation method was used to conduct spatial interpolation for unsampled points, and obtain the spatial distribution pattern of soil salinity and moisture (Figure 3). The accuracy of the interpolation map was evaluated using the cross-validation method [51] (Table 5). The ME and MSE values of soil salinity and moisture were all close to zero, the values of RMSE and ASE were close to one, and the RMSSE was about 1.2061 and 1.0901, respectively. These results indicate that the accuracy of the spatial interpolation map is relatively high. As shown in Figure 3, the soil salinity in the southwest is higher than in the northeast, and the high content center is concentrated in the south of the study area, while the soils with lower salinity are mainly distributed in the north and at the eastern edge. The degree of spatial variation in the central south is relatively large, which is related to the following: the soil is mainly composed of sierozem; the cultivated land being distributed in the middle-upper and middle-lower parts of the proluvial-alluvial plain, and the piedmont alluvial diluvial fan being in the upper part; the large topographic relief; the outdated agricultural irrigation methods, such as flood irrigation and well irrigation methods and so on. The soil moisture was relatively higher in the center and at the north eastern edge of the study area, and relatively lower in the northwest and southeast. There was a closed high-value center in the middle, which is closely related to the perennial cultivation of paddy and wheat in the study area. Overall, there is a similar relationship between soil salinity and moisture, but it is not obvious.

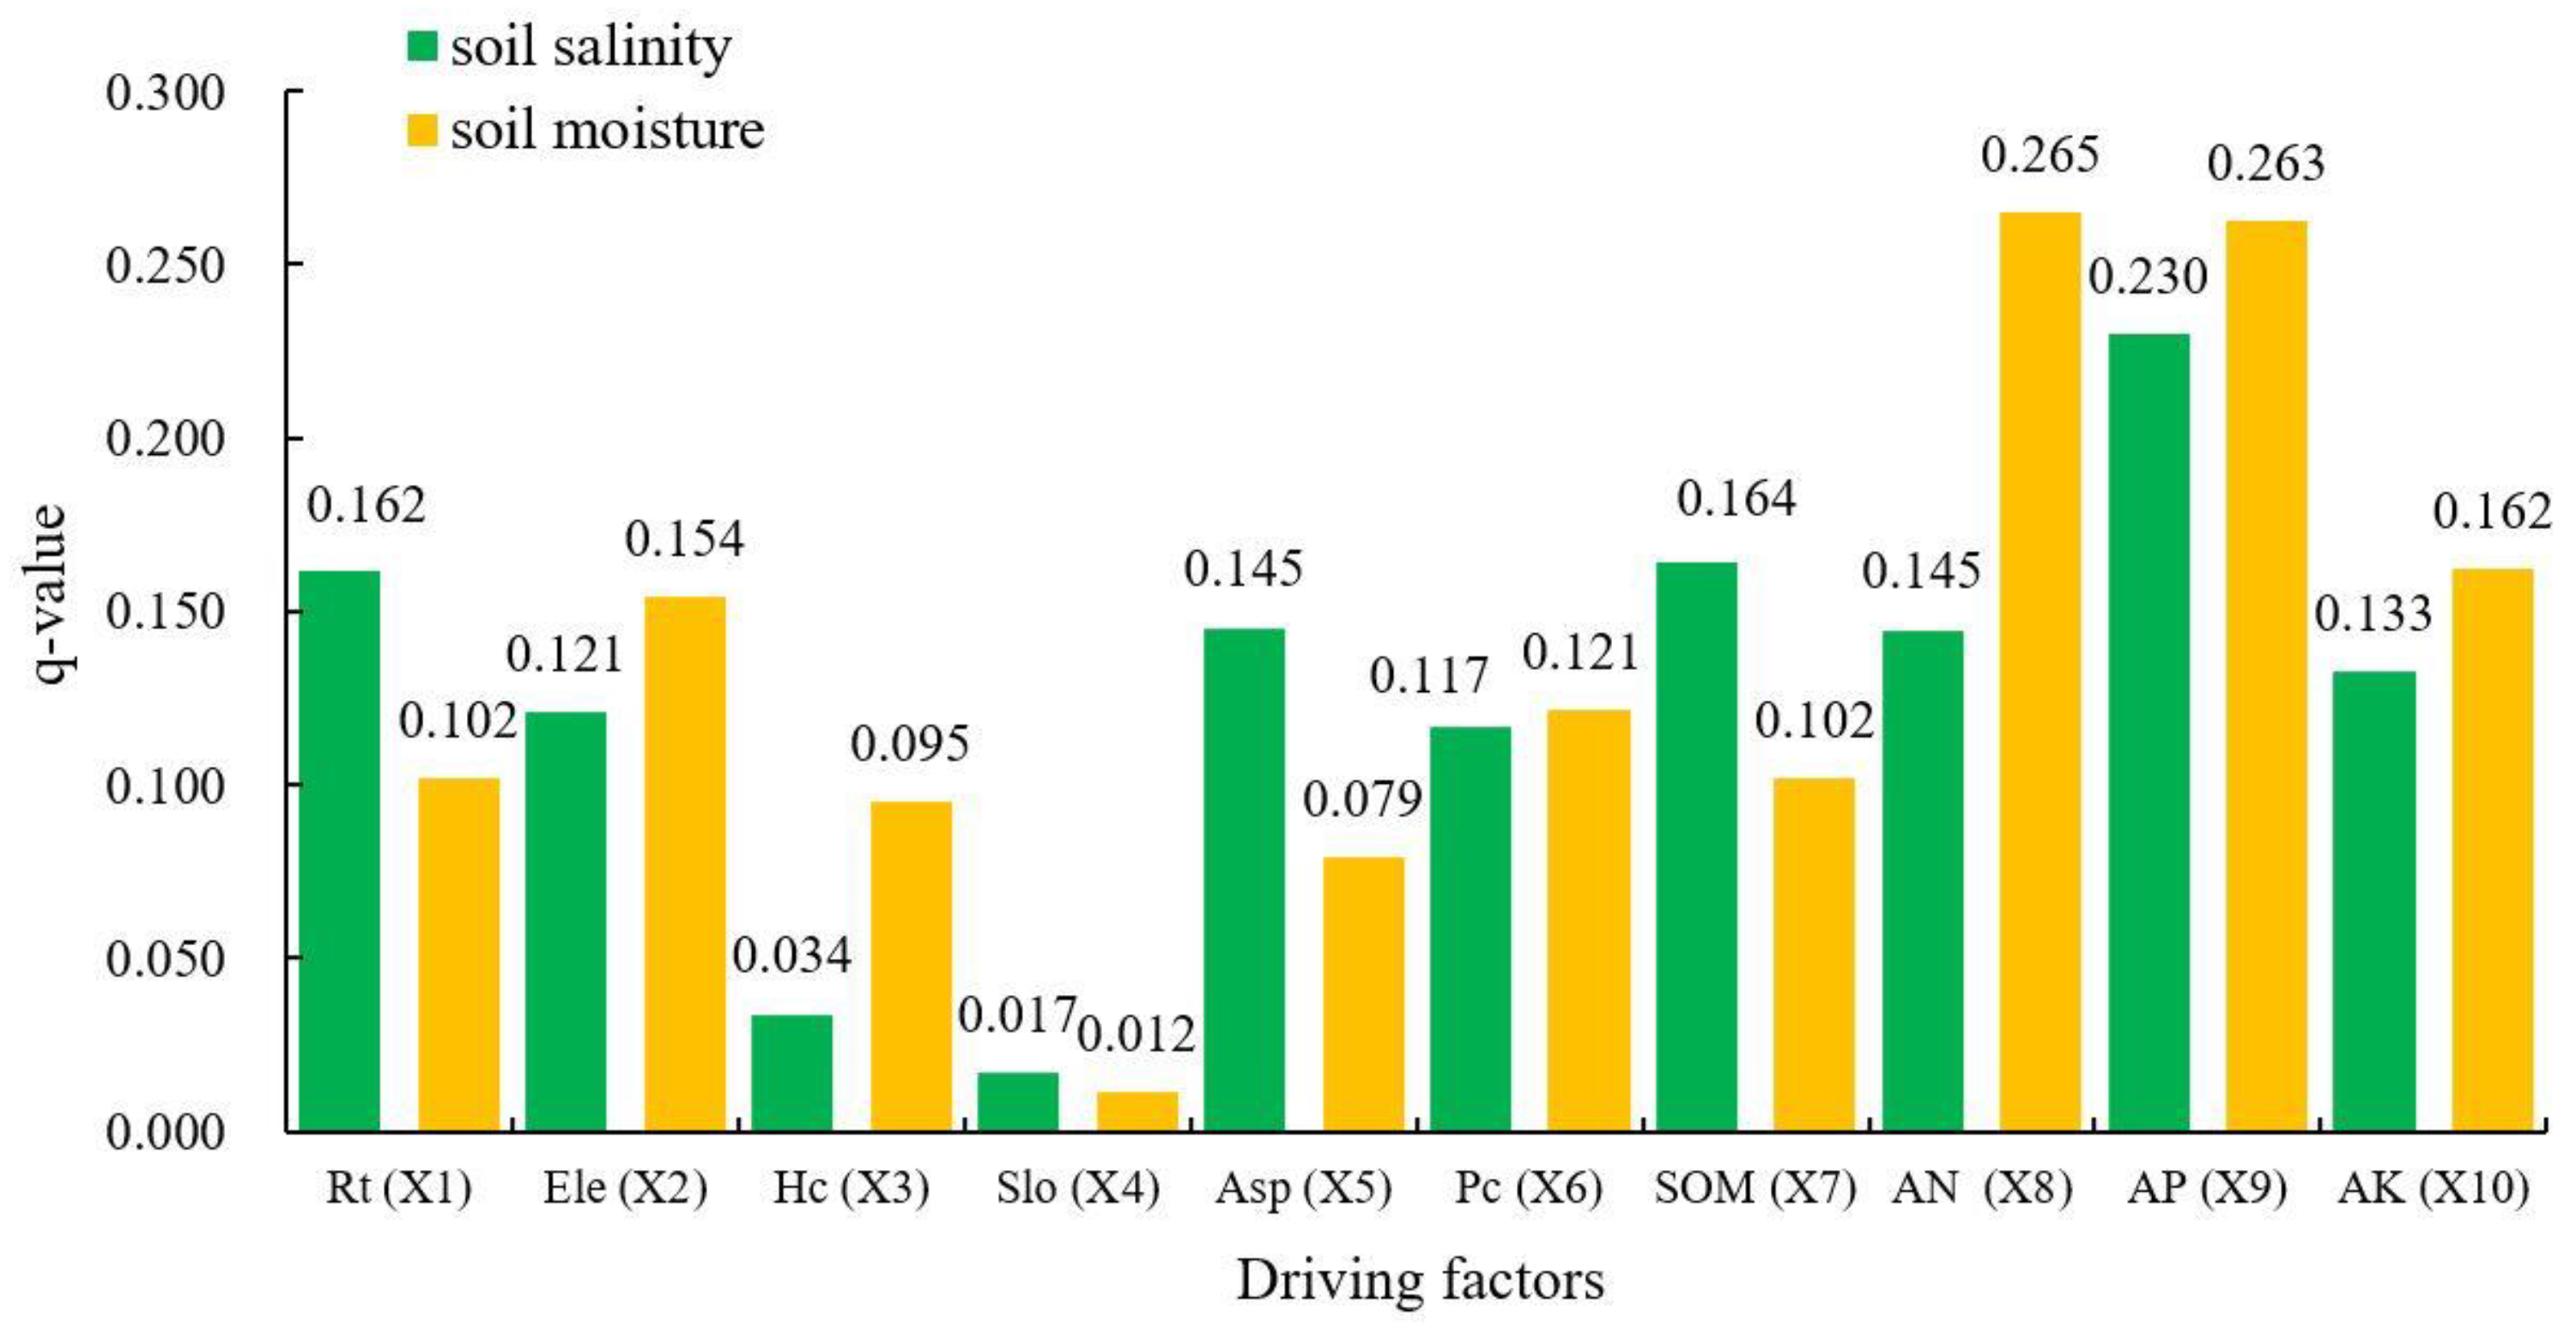
4.4. The Driving Factors of the Spatial Distribution of Soil Salinity and Moisture

The driving factors of the spatial distribution characteristics of soil salinity and moisture were analyzed by the geographical detector model, and the q value of the driving factors was calculated (Figure 4). Available phosphorus (0.230) had the greatest influence on the spatial distribution of soil salinity, which is mostly related to the fact that phosphate fertilizer can increase the total salt content. Organic matter (0.164) and roughness of terrain (0.162) were the second and third most important factors, respectively, indicating that organic matter and roughness of terrain affect the spatial distribution of soil salinity to a certain extent in farmland. The q values of alkaline nitrogen and aspect were both 0.145, which demonstrates that these are important influencing factors. The q values of the other factors range from 0.017 to 0.133; these factors have relatively weak explanatory power on the spatial distribution of soil salinity. Alkaline nitrogen (0.265) exerted a significant influence on the spatial distribution of soil moisture. This occurs because the content of alkaline nitrogen in the soil varies greatly under different water conditions. Available phosphorus (0.263) was the second most important factor, followed by available potassium (0.162) and elevation (0.154). Thus, the available phosphorus, available potassium and elevation have a certain impact on the spatial distribution of soil moisture, and the amount of fertilization and the position directly affect the spatial distribution of soil moisture. The q values of other factors range from 0.012 to 0.121; these factors have relatively weak explanatory power on the spatial distribution of soil moisture.
In conclusion, the q values of the driving factors on the spatial distribution of soil salinity and moisture ranged from 0.017 to 0.230, and 0.012 to 0.265, respectively. These results indicate that the explanatory power of the influencing factors was relatively weak on the spatial distribution of soil salinity and moisture on the whole. The reason for this may be that the study area is a typical farmland irrigation area, which is greatly disturbed by human factors, thus reducing the impact of soil properties and terrain factors.

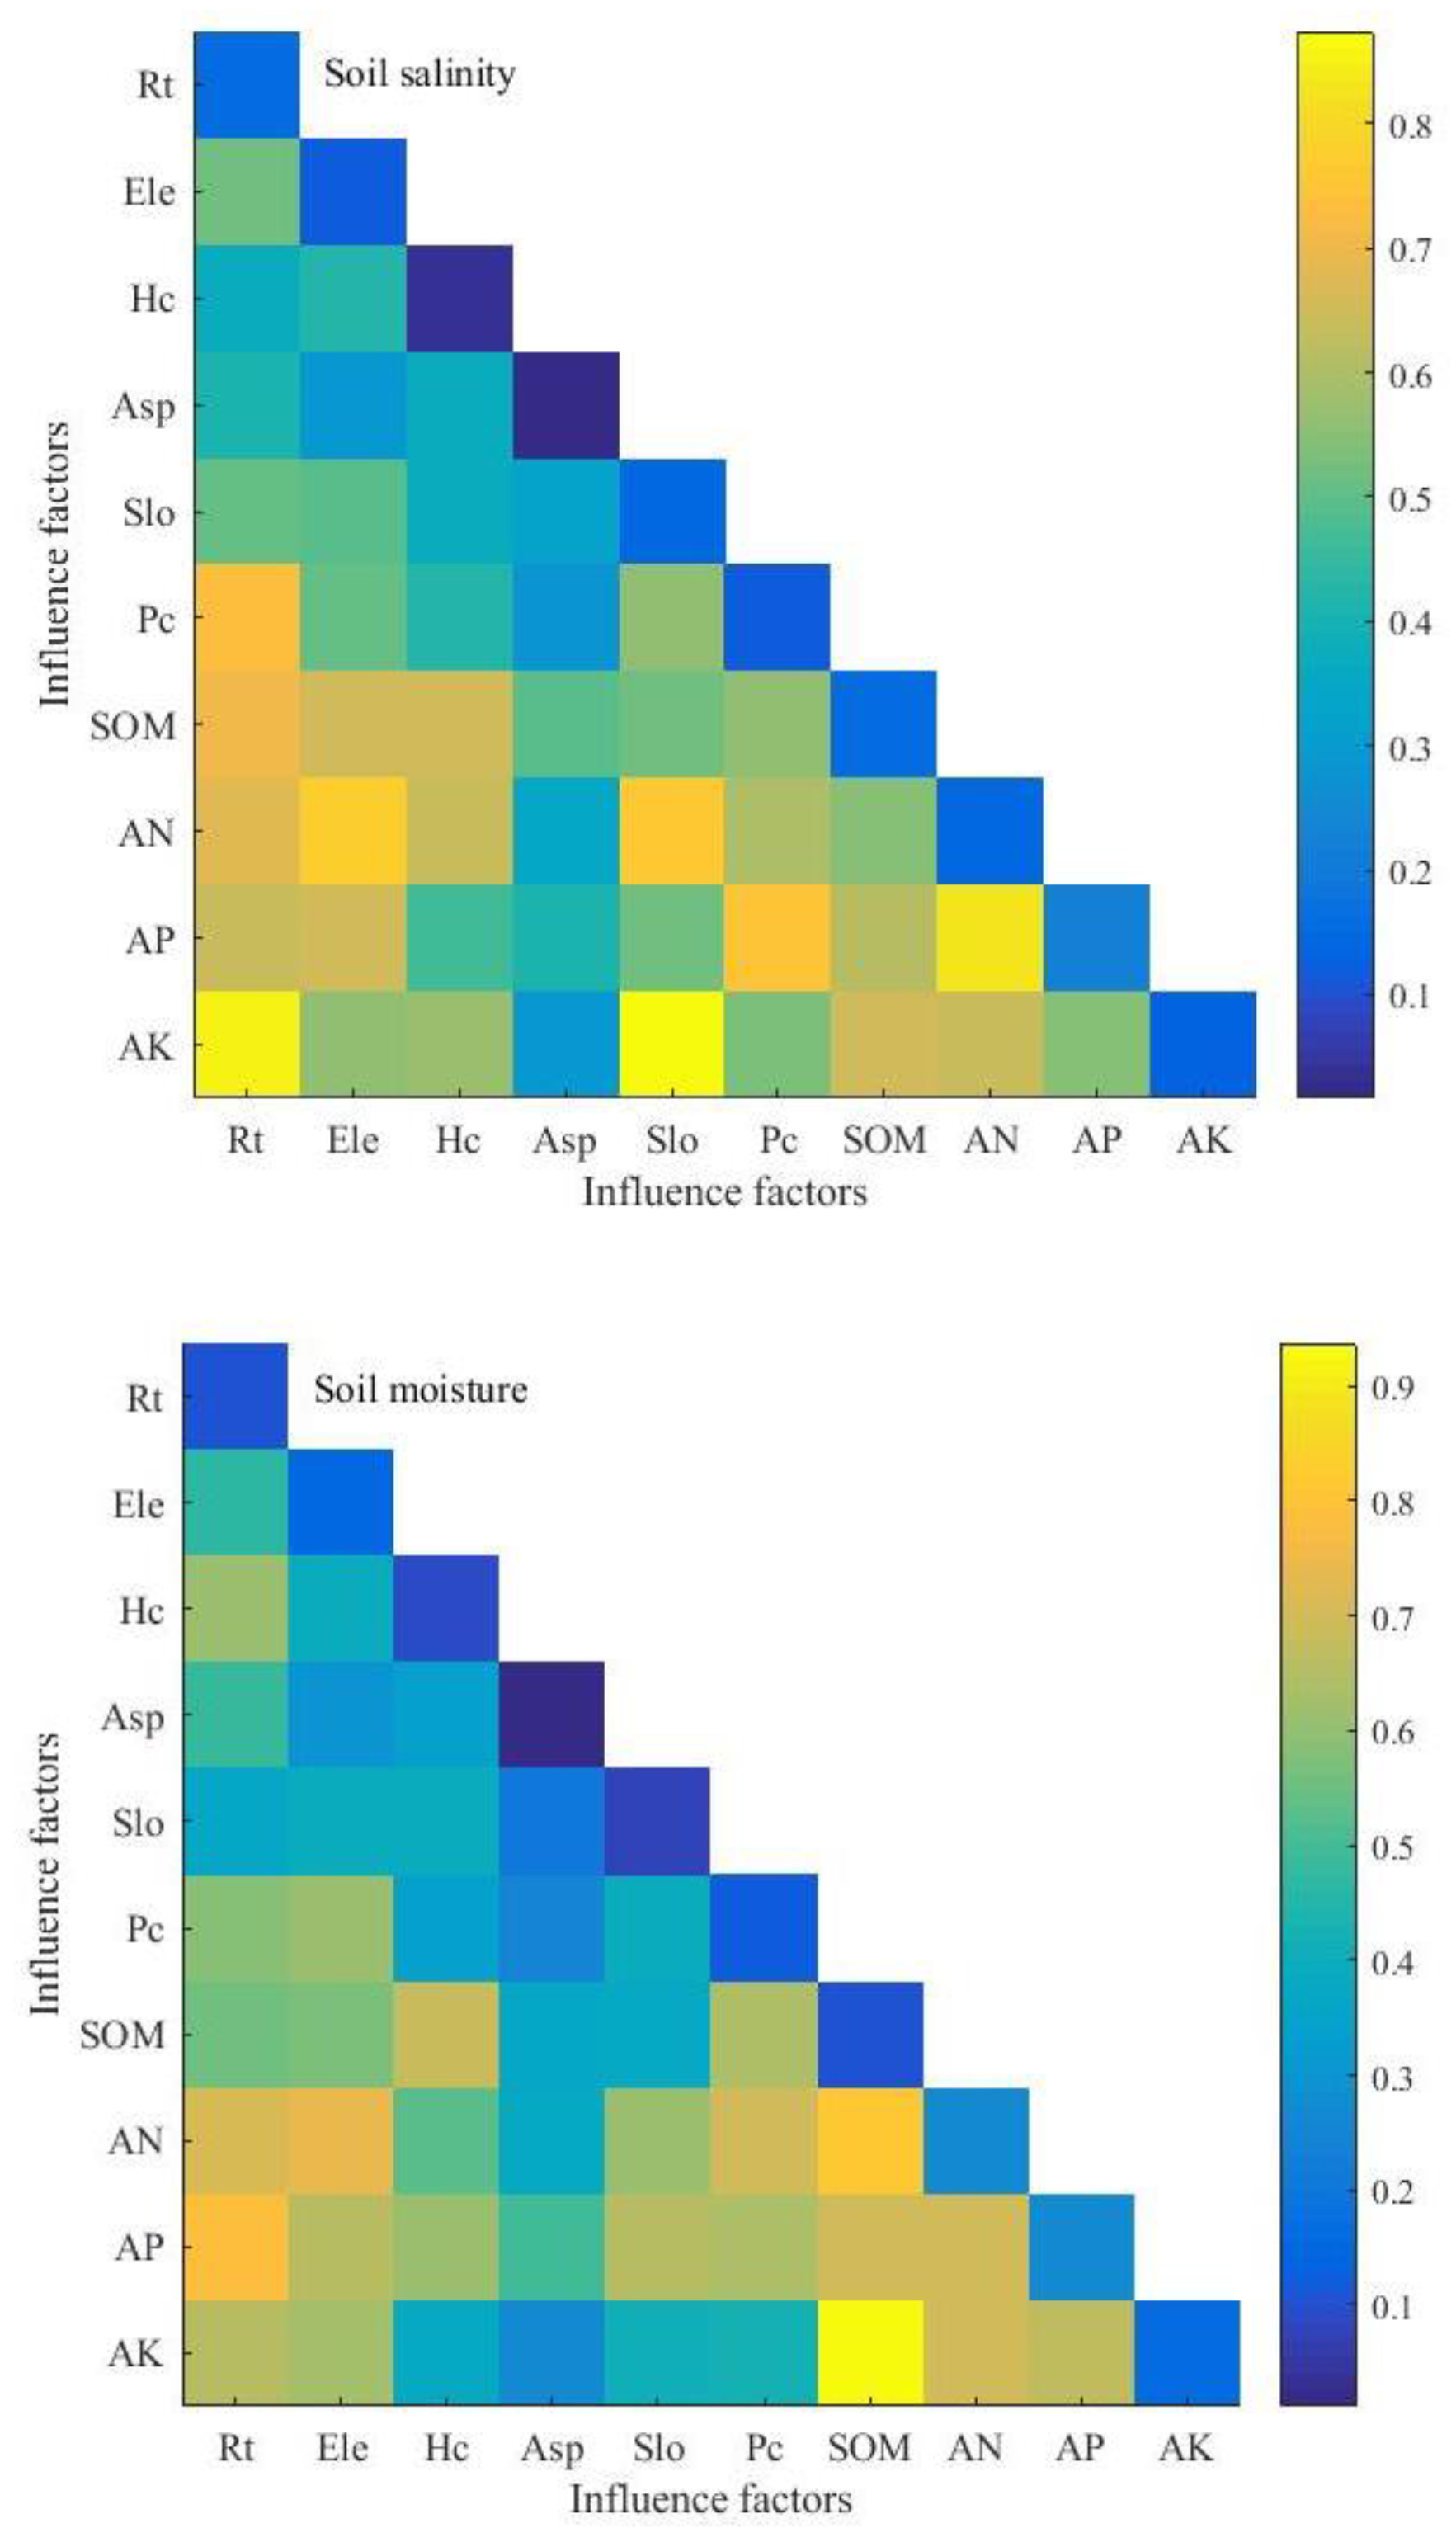
4.5. The Interaction of Driving Factors

Studying the interaction between influencing factors is important for understanding the degree to which the dependent variable is affected when two factors act at the same time. The interaction effect can be divided into five types: weaken, nonlinear (e.g., q(X1X2) < Min[q(X1), q(X2)]); weaken, uni- (e.g., Min[q(X1), q (X2)] < q (X1X2) < Max[q( X1), q(X2)]); enhance, bi-( e.g., q(X1X2) > Max[q(X1), q(X2)]); independent (e.g., [q(X1X2) = q(X1) + q(X2)]); and enhance, nonlinear (e.g., [q(X1X2) > q(X1) + q(X2)]). Hence, interactive detection was carried out on the driving factors of the spatial distribution of soil salinity and moisture in the agricultural irrigation area of Ili River Valley, China (Figure 5, Table 6). The results showed that all factor interactions were enhanced, nonlinear. In terms of soil salinity, the interactions of aspect with available potassium (X5X10, 0.874), roughness of terrain with available potassium (X1X10, 0.851) and alkaline nitrogen with available phosphorus (X8X9, 0.823) have relatively stronger explanatory power for the spatial distribution of soil salinity. According to the analysis described in Section 4.4., the explanatory power of available potassium (0.133) for soil salinity is relatively weak in factor detection. However, the interaction of available potassium with aspect and roughness of terrain showed strong explanatory power, indicating that available potassium can be reflected only when it meets a certain aspect and roughness of terrain. The interactions of organic matter with available potassium (X7X10, 0.938), organic matter with alkaline nitrogen (X7X8, 0.820) and roughness of terrain with available phosphorus (X1X9, 0.780) have the strongest explanatory power for the spatial distribution of soil moisture. Similarly, the explanatory power of organic matter (0.102) for soil moisture is relatively weak in the factor detection in the analysis described in Section 4.4., but its interaction with available potassium and alkaline nitrogen showed strong explanatory power, indicating that organic matter is influential only when certain levels of available phosphorus and alkaline nitrogen are present.
In addition, the interaction of horizontal curvature with organic matter (X3X7, 0.656), profile curvature with alkaline nitrogen (X3X8, 0.644), profile curvature with available potassium (X3X10, 0.579) have relatively strong explanatory power on the spatial distribution of soil salinity. However, the driving effect of horizontal curvature (0.034) on soil salinity is not obvious in factor detection. At the same time, the interaction of elevation with alkaline nitrogen (X2 ∩ X8, 0.736), roughness of terrain with alkaline nitrogen (X1 ∩ X8, 0.708), aspect with available phosphorus (X5X9, 0.649), and aspect with alkaline nitrogen (X5X8, 0.611) have relatively strong explanatory power on the spatial distribution of soil moisture. However, the driving effect of aspect (0.079) on soil moisture is not obvious in factor detection. Overall, we conclude that topographic factors and soil nutrients together affect the spatial distribution of soil salinity and moisture.

5. Discussion

Soil salinity and moisture are important factors affecting agricultural production in arid areas [52]. Understanding and mastering the spatial distribution of soil salinity and moisture can provide basic information for preventing and controlling soil salinization and lead to scientific agricultural management [53]. Therefore, in order to clearly understand the spatial distribution characteristics of soil salinity and moisture and their influencing factors, we applied GIS and geostatistics methods to explore the spatial variability of soil salinity and moisture in typical agricultural irrigation areas of the Ili River valley, China, and identified the driving factors of soil salinity and moisture by using the geographical detector model.
In this study, the results show that soil salinity ranged from 0.0137% to 0.4407%. This implies that the soil in the study area was mainly lightly salinized and that areas with moderate and strong salinized soil and non-salinized soil are less prevalent in the study area. From the spatial distribution pattern of soil salinity, soil salinity in the southwest is higher than in the northeast, and a high content center is concentrated in the south of the study area. Combined with the actual situation of the study area, we can explain this phenomenon based on the following factors. On the one hand, the topography of the study area slopes from high in the south to low in the north, with multi-stage steps. Thus, the thickness of the effective soil layer is greatest in the central north [54]. On the other hand, the study area is affected by alluvial-proluvial and formed fan-shaped land of different sizes as a result, but the southern part of the study area is located at the junction of the inclined plain and the alluvial plain, which makes the groundwater on the north and south sides stagnant and blocked, and the water level rises, concentrating the salt on the surface. Moreover, the various irrigation methods, such as well irrigation and flood irrigation, make the soil salinity in the area relatively high. These results were consistent with the results reported by Wang et al. [55]. In addition, Liu et al. [40] indicated that the soil salinity in the study area is also affected by the distance from the river, and water diversion irrigation is the main source of salt accumulation in this region. Therefore, the spatial distribution pattern of soil salinity is significantly affected by topography and irrigation mode.
There are significant differences in the influence of different factors on the spatial variability of soil properties. Available phosphorus had the strongest explanatory power for the spatial distribution of soil salinity, while available potassium had weaker explanatory power. However, when available potassium interacts with aspect and roughness of terrain, it played a dominant role in the spatial distribution of soil salinity. This is related to the concave topography which facilitates the accumulation of salt. The undulation of the terrain causes more salt to be redistributed horizontally and vertically, thus allowing the salt to easily accumulate on the surface. At the same time, roughness of terrain had weaker explanatory power. However, when roughness of terrain interacts with alkaline nitrogen and available phosphorus presented strong explanatory power in the spatial distribution of soil moisture. This implies that the combined action of topographic factors and soil nutrients has a major influence on the spatial distribution of soil salinity and moisture.
Topography is an important factor that greatly affects soil moisture [29,56]. In this study, topographical factors were not well correlated with soil moisture and the role of single topographic factor on the spatial heterogeneity of soil moisture presented weaker. The reason for this may be that the study area is a typical farmland irrigation area, which is greatly disturbed by human factors and mainly distributed the light and moderate salinized soils, thus reducing the impact of terrain factors. It may also because the contribution of a single factor on soil salinity and moisture is inconsistent in different regions [36]. However, interactions with soil nutrients presented strong explanatory power in the spatial distribution of soil moisture. Previous studies have also demonstrated that topographical factors had a major influence on the redistribution of soil nutrients [48,57]. Therefore, an effective way to improve the degree of soil salinization in the oasis farmland of arid area is to make a suitable fertilization system under different topography conditions.
There are also several aspects that we should consider in follow-up studies. Firstly, although topographic factors can explain the spatial variability of soil properties to a certain extent, some studies have shown that that soil properties may also be affected by other environmental factors [58], and there may exist mutual constraints among various factors [11,59]. Therefore, when exploring the degree to which other factors influence the spatial variability of soil salinity and moisture, the interaction between factors needs to be studied further. Secondly, spatial variation of soil properties is scale specific, so the factors that affect soil properties at different scales are different [36,38]. Therefore, the relationship between spatial variability of soil salinity and moisture and topographic factors in large-scale regions should be further studied and considered in the future. Finally, geographical detectors identified the power of determinant of factors, but the direction of influence direction could not be determined. Hence, the comparative analysis of the drivers of soil salinity and moisture by geographical detector model and other models should be considered in future research. Additionally, our study has been conducted only in the oasis farmland of arid areas as the current results could not be extended to other regions, which is a limitation of this study. Therefore, we anticipate that our research might promote and inspire further studies regarding soil salinity and moisture, and its influencing factors in the oasis farmland of arid areas.

6. Conclusions

This paper analyzed the spatial variability of soil salinity and moisture in the cultivated layer of Qapqal Xibe Autonomous County, in the typical agricultural irrigation area of the Ili River valley, China. Then explored the main driving factors of the spatial distribution of soil salinity and moisture using the geographic detector model. The main conclusions are as follows.
(1)
The average value of soil salinity and soil moisture were 0.1345% and 0.6082%, respectively, and mainly lightly salinized soil was distributed in the study area. The coefficient of variation of soil salinity and water content was 71.25% and 31.89%, respectively, which corresponds to moderate levels of variation. There were moderate spatial auto-correlation of both soil salinity and moisture, which were mainly affected by structural (topography, soil types, parent material, climate, etc.) and random (irrigation, fertilization, farming methods, planting crops, and cropping system, etc.) factors.
(2)
Spatially, in terms of spatial distribution, soil salinity in the southwest was higher than in the northeast, and the high content center was concentrated in the south of the study area. Soil moisture was relatively high in the middle and along the north eastern edge, while soils in the northwest and southeast have relatively low moisture.
(3)
Available phosphorus, organic matter and roughness of terrain were the main driving factors of the spatial distribution of soil salinity. Alkaline nitrogen, available phosphorus, available potassium and elevation were the main driving factors of the spatial distribution of soil moisture. The interaction of available potassium with aspect and roughness of terrain played a dominant role in the spatial distribution of soil salinity, and the effect of available potassium depended on the aspect and roughness of terrain. The interaction of organic matter with available potassium and alkaline nitrogen played a leading role in the spatial distribution of soil moisture, and the explanatory power of organic matter was only strong when interacting with available potassium and alkaline nitrogen under certain conditions. Therefore, combined action of topographic factors and soil nutrients has a major influence on the spatial distribution of soil salinity and moisture.
(4)
Our results obtained this study indicate that an effective way to improve the degree of soil salinization is to make a suitable fertilization system under different topography conditions. First of all, we suggest that popularizing water-saving irrigation technology, controlling irrigation quota, digging drainage ditch, implementing the paddy-wheat rotation, and changing the backward situation of flood irrigation in the areas with a high salt salinity content. Secondly, in the region with high slope and low altitude, the amount of specific soil nutrient elements should be appropriately increased to improve soil fertility. Finally, when it comes to nutrient management, managers need to consider the impact of topographic factors and soil nutrient on the distribution of soil salinity and moisture, expand the scope of scientific research, training and promotion, then scientifically guide farmers to carry out rational fertilization and improve crop yield. Additionally, some measures such as improvement of irrigation and drainage system, rational exploitation and utilization of groundwater, and water-saving irrigation can also effectively improve soil salinization.

Author Contributions

L.X. developed the original idea and designed the methodology. L.X. drafted the manuscript, which was revised by H.D., X.Z. All authors have read and approved the final manuscript.

Funding

This work was supported by the university scientific research program of education department, Xinjiang Uygur Autonomous Region (XJEDU2016S078).

Conflicts of Interest

The authors declare no conflict of interest.

References

  1. Li, J.; Pu, L.; Han, M.; Zhu, M.; Zhang, R.; Xiang, Y. Soil salinization research in China: Advances and prospects. J. Geogr. Sci. 2014, 24, 943–960. [Google Scholar] [CrossRef]
  2. Jiang, S.-Q.; Yu, Y.-N.; Gao, R.-W.; Wang, H.; Zhang, J.; Li, R.; Long, X.-H.; Shen, Q.-R.; Chen, W.; Cai, F. High-throughput absolute quantification sequencing reveals the effect of different fertilizer applications on bacterial community in a tomato cultivated coastal saline soil. Sci. Total Environ. 2019, 687, 601–609. [Google Scholar] [CrossRef]
  3. Ma, Z.; Xu, Y.; Peng, J.; Chen, Q.; Wan, D.; He, K.; Shi, Z.; Li, H. Spatial and temporal precipitation patterns characterized by TRMM TMPA over the Qinghai-Tibetan plateau and surroundings. Int. J. Remote Sens. 2018, 39, 3891–3907. [Google Scholar] [CrossRef]
  4. Bui, E.N. Soil salinity: A neglected factor in plant ecology and biogeography. J. Arid Environ. 2013, 92, 14–25. [Google Scholar] [CrossRef]
  5. Metternicht, G.I.; Zinck, J.A. Remote sensing of soil salinity: Potentials and constraints. Remote Sens. Environ. 2003, 85, 1–20. [Google Scholar] [CrossRef]
  6. Cemek, B.; GÜLer, M.; KiliÇ, K.; Demir, Y.; Arslan, H. Assessment of spatial variability in some soil properties as related to soil salinity and alkalinity in Bafra plain in northern Turkey. Environ. Monit. Assess. 2007, 124, 223–234. [Google Scholar] [CrossRef]
  7. Moustafa, M.M.; Yomota, A. Use of a covariance variogram to investigate influence of subsurface drainage on spatial variability of soil-water properties. Agric. Water Manag. 1998, 37, 1–19. [Google Scholar] [CrossRef]
  8. Zhang, W.-T.; Wu, H.-Q.; Gu, H.-B.; Feng, G.-L.; Wang, Z.; Sheng, J.-D. Variability of Soil Salinity at Multiple Spatio-Temporal Scales and the Related Driving Factors in the Oasis Areas of Xinjiang, China. Pedosphere 2014, 24, 753–762. [Google Scholar] [CrossRef]
  9. Peng, J.; Biswas, A.; Jiang, Q.; Zhao, R.; Hu, J.; Hu, B.; Shi, Z. Estimating soil salinity from remote sensing and terrain data in southern Xinjiang Province, China. Geoderma 2019, 337, 1309–1319. [Google Scholar] [CrossRef]
  10. Huang, Y.; Wang, Y.; Zhao, Y.; Xu, X.; Zhang, J.; Li, C. Spatiotemporal Distribution of Soil Moisture and Salinity in the Taklimakan Desert Highway Shelterbelt. Water 2015, 7, 4343–4361. [Google Scholar] [CrossRef] [Green Version]
  11. Yang, X.-D.; Ali, A.; Xu, Y.-L.; Jiang, L.-M.; Lv, G.-H. Soil moisture and salinity as main drivers of soil respiration across natural xeromorphic vegetation and agricultural lands in an arid desert region. Catena 2019, 177, 126–133. [Google Scholar] [CrossRef]
  12. Chaieb, G.; Abdelly, C.; Michalet, R.; Acosta, A.T.R. Interactive effects of climate and topography on soil salinity and vegetation zonation in North-African continental saline depressions. J. Vegetation Sci. 2019, 30, 312–321. [Google Scholar] [CrossRef]
  13. Wang, J.F.; Li, X.H.; Christakos, G.; Liao, Y.L.; Zhang, T.; Gu, X.; Zheng, X.Y. Geographical Detectors-Based Health Risk Assessment and its Application in the Neural Tube Defects Study of the Heshun Region, China. Int. J. Geogr. Inf. Sci. 2010, 24, 107–127. [Google Scholar] [CrossRef]
  14. Wang, J.-F.; Zhang, T.-L.; Fu, B.-J. A measure of spatial stratified heterogeneity. Ecol. Ind. 2016, 67, 250–256. [Google Scholar] [CrossRef]
  15. LI, C.; LI, Y.; MA, J.; FAN, L.; WANG, Q. Spatial heterogeneity of soil chemical properties between Haloxylon persicum and Haloxylon ammodendron populations. J. Arid Land 2010, 2, 257–265. [Google Scholar]
  16. Zhou, H.H.; Chen, Y.N.; Li, W.H. Soil properties and their spatial pattern in an oasis on the lower reaches of the Tarim River, northwest China. Agric. Water Manag. 2010, 97, 1915–1922. [Google Scholar] [CrossRef]
  17. Feng, X.; An, P.; Li, X.; Guo, K.; Yang, C.; Liu, X. Spatiotemporal heterogeneity of soil water and salinity after establishment of dense-foliage Tamarix chinensis on coastal saline land. Ecol. Eng. 2018, 121, 104–113. [Google Scholar] [CrossRef]
  18. Liu, Z.; Jiao, X.; Lu, S.; Zhu, C.; Zhai, Y.; Guo, W. Effects of winter irrigation on soil salinity and jujube growth in arid regions. PLoS ONE 2019, 14, e0218622. [Google Scholar] [CrossRef] [Green Version]
  19. Chen, L.; Feng, Q. Soil water and salt distribution under furrow irrigation of saline water with plastic mulch on ridge. J. Arid Land 2012, 5, 60–70. [Google Scholar] [CrossRef] [Green Version]
  20. Dai, X.; Huo, Z.; Wang, H. Simulation for response of crop yield to soil moisture and salinity with artificial neural network. Field Crops Res. 2011, 121, 441–449. [Google Scholar] [CrossRef]
  21. Liu, M.-X.; Yang, J.-S.; Li, X.-M.; Yu, M.; Jin, W. Effects of Irrigation Water Quality and Drip Tape Arrangement on Soil Salinity, Soil Moisture Distribution, and Cotton Yield (Gossypium hirsutum L.) Under Mulched Drip Irrigation in Xinjiang, China. J. Integr. Agric. 2012, 11, 502–511. [Google Scholar]
  22. Miguel, J.V.M.; Navarro-Pedreño, J.; García-Sánchez, E.; Mateu, J.; Juan, P. Spatial dynamics of soil salinity under arid and semi-arid conditions_Geological and environmental implications. Environ. Geol. 2004, 45, 448–456. [Google Scholar]
  23. Brocca, L.; Morbidelli, R.; Melone, F.; Moramarco, T. Soil moisture spatial variability in experimental areas of central Italy. J. Hydrol. 2007, 333, 356–373. [Google Scholar] [CrossRef]
  24. Sun, G.; Zhu, Y.; Ye, M.; Yang, J.; Qu, Z.; Mao, W.; Wu, J. Development and application of long-term root zone salt balance model for predicting soil salinity in arid shallow water table area. Agric. Water Manag. 2019, 213, 486–498. [Google Scholar] [CrossRef]
  25. Bhunia, G.S.; Shit, P.K.; Chattopadhyay, R. Assessment of spatial variability of soil properties using geostatistical approach of lateritic soil (West Bengal, India). Ann. Agrar. Sci. 2018, 16, 436–443. [Google Scholar] [CrossRef]
  26. Qi, Z.; Feng, H.; Zhao, Y.; Zhang, T.; Yang, A.; Zhang, Z. Spatial distribution and simulation of soil moisture and salinity under mulched drip irrigation combined with tillage in an arid saline irrigation district, northwest China. Agric. Water Manag. 2018, 201, 219–231. [Google Scholar] [CrossRef]
  27. Yao, X.; Fu, B.; Lü, Y.; Chang, R.; Wang, S.; Wang, Y.; Su, C. The multi-scale spatial variance of soil moisture in the semi-arid Loess Plateau of China. J. Soils Sedim. 2012, 12, 694–703. [Google Scholar] [CrossRef]
  28. Peng, D.; Shi, F.; Ye, B.; Yang, Y.; Zhao, C. Factors controlling the spatial variability of surface soil particles using GLMs and GAMs. Stoch. Environ. Res. Risk Assess. 2015, 29, 27–34. [Google Scholar] [CrossRef]
  29. Fang, X.N.; Zhao, W.W.; Wang, L.X.; Feng, Q.; Ding, J.Y.; Liu, Y.X.; Zhang, X. Spatial variations of deep soil moisture and the influencing factors in the Loess Plateau, China. Hydrol. Earth Syst. Sci. 2016, 1, 1–42. [Google Scholar]
  30. Zhang, F.; Xiong, H.; Tian, Y.; Nuan, F. Impacts of Regional Topographic Factors on Spatial Distribution of Soil Salinization in Qitai Oasis. Res. Environ. Sci. 2011, 24, 731–739. (In Chinese) [Google Scholar]
  31. Zhao, Z.; Liu, G.; Liu, Q.; Huang, C.; Li, H.; Wu, C. Distribution Characteristics and Seasonal Variation of Soil Nutrients in the Mun River Basin, Thailand. Int. J. Environ. Res. Public Health 2018, 15, 1818. [Google Scholar] [CrossRef] [Green Version]
  32. Canto’n, Y.; Barrio, G.D.; Sole’-Benet, A.; La’zaro, R. Topographic controls on the spatial distribution of ground cover in the Tabernas badlands of SE Spain. Catena 2004, 55, 341–365. [Google Scholar] [CrossRef]
  33. Yang, F.; An, F.; Ma, H.; Wang, Z.; Zhou, X.; Liu, Z. Variations on Soil Salinity and Sodicity and Its Driving Factors Analysis under Microtopography in Different Hydrological Conditions. Water 2016, 8, 227. [Google Scholar] [CrossRef] [Green Version]
  34. Wang, Z.; Zhou, B.; Pei, L.; Zhang, J.; He, X.; Lin, H. Controlling threshold in soil salinity when planting spring wheat and sequential cropping silage corn in Northern Xinjiang using drip irrigation. Int. J. Agric. Biol. Eng. 2018, 11, 108–114. [Google Scholar] [CrossRef] [Green Version]
  35. Wang, J.; Fu, G.; Liu, Y.; Xiong, Y. Spatial distribution of soil salinity and potential implications for soil management in the Manas River watershed, China. Soil Use Manag. 2019, 00, 1–11. [Google Scholar] [CrossRef]
  36. Huang, J.; Shi, Z.; Biswas, A. Characterizing anisotropic scale-specific variations in soil salinity from a reclaimed marshland in China. Catena 2015, 131, 64–73. [Google Scholar] [CrossRef]
  37. Wang, Y.; Deng, C.; Liu, Y.; Niu, Z.; Li, Y. Identifying change in spatial accumulation of soil salinity in an inland river watershed, China. Sci. Total Environ. 2018, 621, 177–185. [Google Scholar] [CrossRef]
  38. Ma, L.; Yang, S.; Simayi, Z.; Gu, Q.; Li, J.; Yang, X.; Ding, J. Modeling variations in soil salinity in the oasis of Junggar Basin, China. Land Degrad. Dev. 2018, 29, 551–562. [Google Scholar] [CrossRef]
  39. Ren, D.; Wei, B.; Xu, X.; Engel, B.; Li, G.; Huang, Q.; Xiong, Y.; Huang, G. Analyzing spatiotemporal characteristics of soil salinity in arid irrigated agro-ecosystems using integrated approaches. Geoderma 2019, 356, 113935. [Google Scholar] [CrossRef]
  40. Liu, Q.-Q.; Su, L.-T.; Liu, G.-M.; Shawulan, K.; Zhang, Y. Spatial Variation of Soil Salinity in the Chanan Irrigated Area in the Ili River Valley. Arid Zone Res. 2017, 34, 980–985. (In Chinese) [Google Scholar]
  41. Bao, S. Soil Agrochemical Analysis, 3rd ed.; China Agricultural Press: Beijing, China, 2000. (In Chinese) [Google Scholar]
  42. Nayanaka, V.G.D.; Vitharana, W.A.U.; Mapa, R.B. Geostatistical Analysis of Soil Properties to Support Spatial Sampling in a Paddy Growing Alfisol. Trop. Agric. Res. 2010, 22, 34–44. [Google Scholar] [CrossRef]
  43. Pang, S.; Li, T.-X.; Zhang, X.-F.; Wang, Y.-D.; Yu, H.-Y. Spatial variability of cropland lead and its influencing factors_ A case study in Shuangliu county, Sichuan province, China. Geoderma 2011, 162, 223–230. [Google Scholar] [CrossRef]
  44. Zevenbergen, L.W.; Thorne, C.R. Quantitative analysisof land surface topography. Earth Surf. Process. Landf. 1987, 12, 47–56. [Google Scholar] [CrossRef]
  45. Qin, C.-Z.; Zhu, A.X.; Shi, X.; Li, B.-L.; Pei, T.; Zhou, C.-H. Quantification of spatial gradation of slope positions. Geomorphology 2009, 110, 152–161. [Google Scholar] [CrossRef]
  46. Florinsky, I.V.; Eilers, R.G.; Manning, G.R.; Fuller, L.G. Prediction of soil properties by digital terrain modelling. Environ. Model. Softw. 2002, 17, 295–311. [Google Scholar] [CrossRef]
  47. Moore, I.D.; Gessler, P.E.; Nielsen, G.A.; Peterson, G.A. Soil Attribute Prediction Using Terrain Analysis. Soil Sci. Soc. Am. J. 1993, 57, 443–452. [Google Scholar] [CrossRef]
  48. Rutherford, S.; Zhang, X.; Zhang, F.; Wang, D.; Fan, J.; Hu, Y.; Kang, H.; Chang, M.; Pang, Y.; Yang, Y.; et al. Effects of vegetation, terrain and soil layer depth on eight soil chemical properties and soil fertility based on hybrid methods at urban forest scale in a typical loess hilly region of China. PLoS ONE 2018, 13, e0205661. [Google Scholar]
  49. Chen, G.; Luo, J.; Zhang, C.; Jiang, L.; Tian, L.; Chen, G. Characteristics and Influencing Factors of Spatial Differentiation of Urban Black and Odorous Waters in China. Sustainability 2018, 10, 4747. [Google Scholar] [CrossRef] [Green Version]
  50. Nielsen, D.R.; Bouma, J. Soil Saptial Variablity; Handbook of Soil Science: Wageningen, The Netherlands, 1985. [Google Scholar]
  51. Rezaee, H.; Asghari, O.; Yamamoto, J.K. On the reduction of the ordinary kriging smoothing effect. J. Min. Environ. 2011, 2, 102–117. [Google Scholar]
  52. Chang, X.; Gao, Z.; Wang, S.; Chen, H. Modelling long-term soil salinity dynamics using SaltMod in Hetao Irrigation District, China. Comput. Electron. Agric. 2019, 156, 447–458. [Google Scholar] [CrossRef]
  53. Wang, J.; Ding, J.; Yu, D.; Ma, X.; Zhang, Z.; Ge, X.; Teng, D.; Li, X.; Liang, J.; Lizaga, I.; et al. Capability of Sentinel-2 MSI data for monitoring and mapping of soil salinity in dry and wet seasons in the Ebinur Lake region, Xinjiang, China. Geoderma 2019, 353, 172–187. [Google Scholar] [CrossRef]
  54. Dang, Y. Land Salinization Situation Analysis and Risk Assessment at the Southern Bank of Ili River; China Agricultural University: Beijing, China, 2013. (In Chinese) [Google Scholar]
  55. Wang, S.; Jiao, P.; Xu, D.; Zhai, X. Variation trends and influencing factors of shallow soil salinity in arid area of Xinjiang. J. Drain. Irrig. Mach. 2013, 31, 623–628. (In Chinese) [Google Scholar]
  56. Zhu, Q.; Nie, X.; Zhou, X.; Liao, K.; Li, H. Soil moisture response to rainfall at different topographic positions along a mixed land-use hillslope. Catena 2014, 119, 61–70. [Google Scholar] [CrossRef]
  57. Jeong, G.; Oeverdieck, H.; Park, S.J.; Huwe, B.; Ließ, M. Spatial soil nutrients prediction using three supervised learning methods for assessment of land potentials in complex terrain. Catena 2017, 154, 73–84. [Google Scholar] [CrossRef]
  58. Akramkhanov, A.; Martius, C.; Park, S.J.; Hendrickx, J.M.H. Environmental factors of spatial distribution of soil salinity on flat irrigated terrain. Geoderma 2011, 163, 55–62. [Google Scholar] [CrossRef]
  59. González-Alcaraz, M.N.; Jiménez-Cárceles, F.J.; Álvarez, Y.; Álvarez-Rogel, J. Gradients of soil salinity and moisture, and plant distribution, in a Mediterranean semiarid saline watershed: A model of soil-plant relationships for contributing to the management. Catena 2014, 115, 150–158. [Google Scholar] [CrossRef]
Figure 1. Location of the study area and the distribution of sampling sites.
Sustainability 11 07142 g001
Figure 2. The whole flow chart of the method.
Sustainability 11 07142 g002
Figure 3. Spatial distribution of soil salinity and moisture.
Sustainability 11 07142 g003
Figure 4. Power of determinants of the spatial distribution of soil salinity and soil moisture.
Sustainability 11 07142 g004
Figure 5. Interaction relationship of each factor on soil salinity and soil moisture.
Sustainability 11 07142 g005
Table 1. Description of the selected driving factors and statistical characteristics.
IndicatorMean Standard
Deviation
VarianceMaximumMinimumCoefficient Variation/%
Rt (X1)22.13 38.46 1479.33 158.00 2.00 173.79
Ele (X2)843.50 433.70 188116.00 2400.00 575.00 51.42
Hc (X3)192.10 116.90 13675.20 359.30 1.60 60.85
Asp (X4)89.99 0.01 0.0002 90.00 89.94 0.01
Slo (X5)174.60 161.30 26001.60 357.50 −1.00 92.38
Pc (X6)60.89 30.07 904.40 88.31 4.53 49.38
SOM/(%) (X7)2.24 0.46 0.21 3.35 1.54 20.42
AN/(mg·kg−1) (X8)134.00 51.61 2663.74 243.94 49.90 38.51
AP/(mg·kg−1) (X9)10.84 11.18 125.09 51.99 2.02 103.14
AK/(mg·kg−1) (X10)264.00 99.00 9793.40 478.80 66.60 37.50
Table 2. The description of topographical factors.
VariableDescriptionFormulaReferences
Roughness of terrain (Rt)/mThe difference between the maximum and minimum values of the DEM grid. neighbourhood, represents the range of change in the surface elevation. Rt = Max n M i n n   a[46]
Horizontal curvature (Hc)/m-1A curvature of a normal section of the land surface, indicates that bending and variation of land surfaces along the horizontal direction. Hc = p 2 γ 2 p q s + q 2 t ( p 2 + q 2 ) 1 + p 2 + q 2   b[47]
Slope
(Slo)/°
An angle between a tangent plane and a horizontal one at a given point on the land surface, indicates the degree of inclination of the local surface slope. Slo = arctan ( p ) 2 + ( q ) 2   b[47,48]
Aspect
(Asp)/°
Indicates that there is deviation of a surface from a horizontal plane.Asp∈ [0°, 360°][47,48]
Profile curvature
(Pc)/m-1
A curvature of a normal section of the land surface by a plane, measures the rate of change in ground elevation along the direction of maximum slope. Pc = p 2 γ + 2 p q s + q 2 t ( p 2 + q 2 ) ( 1 + p 2 + q 2 ) 3   b[47]
Note: a Maxn, Minn indicates the maximum value and the minimum value of DEM raster neighbourhood, respectively; b p = δ z δ x ,   q = δ z δ y ,   γ = δ 2 z δ x 2 ,   t = δ 2 z δ y 2 ,   s = δ 2 z δ x δ y ,   x ,   y   ,   z expressed the distance difference in horizontal and vertical directions, respectively.
Table 3. Statistical characters of soil salinity and moisture.
MeanMinimumMaximumStandard DeviationCoefficient Variation (%)Distribution Type
Soil Salinity/(%)0.13450.01370.44070.095871.25LN
Soil Moisture/(%)0.60820.25471.19800.194031.89N
Note: N represents normal distribution; LN represents lognormal distribution.
Table 4. Parameters of the semi-variance model on soil salinity and soil moisture.
Theory ModelNugget
/C0
Sill
/C0 + C
Nugget Effect
/[C0/C0 + C]
Range
/A0(m)
R2Residual SS
Soil Salinity/(%)Spherical0.00590.01440.4097 10100.2431.064 × 10-4
Soil Moisture/(%)Gaussian0.01460.03520.4147 23900.1821.713 × 10-3
Table 5. Result of cross-checking.
Prediction Error
MERMSEASEMSERMSSE
Soil Salinity/(%)–0.00560.08970.0741–0.06081.2061
Soil Moisture/(%)–0.00120.17900.1651–0.02551.0901
Note: ME represents Mean; RMSE represents Root-Mean-Square; ASE represents Average Standard Error; MSE represents Mean Standardized; RMSSE represents Root-Mean-Square Standardized.
Table 6. Power of determinants of the interaction.
Soil SalinitySoil Moisture
Interaction Factorq-ValueInteraction ResultsInteraction Factorq-ValueInteraction Results
X5∩X100.874Enhance, nonlinearX7∩X100.938Enhance, nonlinear
X1∩X100.851Enhance, nonlinearX7∩ X80.820Enhance, nonlinear
X8∩X90.823Enhance, nonlinearX1∩X90.780Enhance, nonlinear
X2∩X80.779Enhance, nonlinearX2∩X80.736Enhance, nonlinear
X5∩X80.762Enhance, nonlinearX1∩X80.708Enhance, nonlinear
X6∩X90.752Enhance, nonlinearX8∩X90.706Enhance, nonlinear
X1∩X60.728Enhance, nonlinearX8∩X100.703Enhance, nonlinear
X1∩X70.708Enhance, nonlinearX7∩X90.701Enhance, nonlinear
X1∩X80.683Enhance, nonlinearX6∩X80.697Enhance, nonlinear
X3∩X70.656Enhance, nonlinearX3∩X70.692Enhance, nonlinear
X2∩X90.656Enhance, nonlinearX9∩X100.666Enhance, nonlinear
X7∩X100.652Enhance, nonlinearX2∩X90.661Enhance, nonlinear
X2∩X70.650Enhance, nonlinearX1∩X100.657Enhance, nonlinear
X3∩X80.644Enhance, nonlinearX5∩X90.649Enhance, nonlinear
X1∩X90.642Enhance, nonlinearX6∩X90.645Enhance, nonlinear
X8∩X100.641Enhance, nonlinearX6∩ X70.635Enhance, nonlinear
X7∩X90.612Enhance, nonlinearX2∩X100.629Enhance, nonlinear
X6∩X80.604Enhance, nonlinearX3∩X90.614Enhance, nonlinear
X3∩X100.579Enhance, nonlinearX2∩X60.612Enhance, nonlinear
X2∩X100.563Enhance, nonlinearX5∩X80.611Enhance, nonlinear
X6∩X70.559Enhance, nonlinearX1∩X30.606Enhance, nonlinear
X5∩X60.553Enhance, nonlinearX1∩X60.588Enhance, nonlinear
X7∩X80.542Enhance, nonlinearX2∩X70.569Enhance, nonlinear
X9∩X100.539Enhance, nonlinearX1∩X70.550Enhance, nonlinear
X6∩X100.535Enhance, nonlinearX3∩X80.521Enhance, nonlinear
X5∩X90.525Enhance, nonlinearX4∩X90.494Enhance, nonlinear
X1∩X20.523Enhance, nonlinearX1∩X40.483Enhance, nonlinear
X5∩X70.513Enhance, nonlinearX1∩X20.471Enhance, nonlinear
X2∩X60.506Enhance, nonlinearX6∩X100.426Enhance, nonlinear
X1∩X50.499Enhance, nonlinearX5∩X100.410Enhance, nonlinear
X2∩X50.486Enhance, nonlinearX5∩X60.401Enhance, nonlinear
X4∩X70.486Enhance, nonlinearX3∩X50.394Enhance, nonlinear
X3∩X90.469Enhance, nonlinearX2∩X30.391Enhance, nonlinear
X2∩X30.426Enhance, nonlinearX2∩X50.388Enhance, nonlinear
X3∩X60.419Enhance, nonlinearX5∩X70.387Enhance, nonlinear
X1∩X40.411Enhance, nonlinearX4∩X80.387Enhance, nonlinear
X4∩X90.406Enhance, nonlinearX3∩X100.379Enhance, nonlinear
X1∩X30.377Enhance, nonlinearX4∩X70.366Enhance, nonlinear
X3∩X50.376Enhance, nonlinearX1∩X50.364Enhance, nonlinear
X3∩X40.367Enhance, nonlinearX3∩X40.343Enhance, nonlinear
X4∩X80.345Enhance, nonlinearX3∩X60.342Enhance, nonlinear
X4∩X50.329Enhance, nonlinearX2∩X40.301Enhance, nonlinear
X4∩X100.296Enhance, nonlinearX4∩X100.258Enhance, nonlinear
X2∩X40.288Enhance, nonlinearX4∩X60.252Enhance, nonlinear
X4∩X60.273Enhance, nonlinearX4∩X50.204Enhance, nonlinear

