Have Bangladesh’s Polders Decreased Livelihood Vulnerability? A Comparative Case Study


Abstract
1. Introduction
2. Conceptualizing Key Concepts
2.1. Conceptualizing Polders
2.2. Conceptualizing Vulnerability
3. Methods
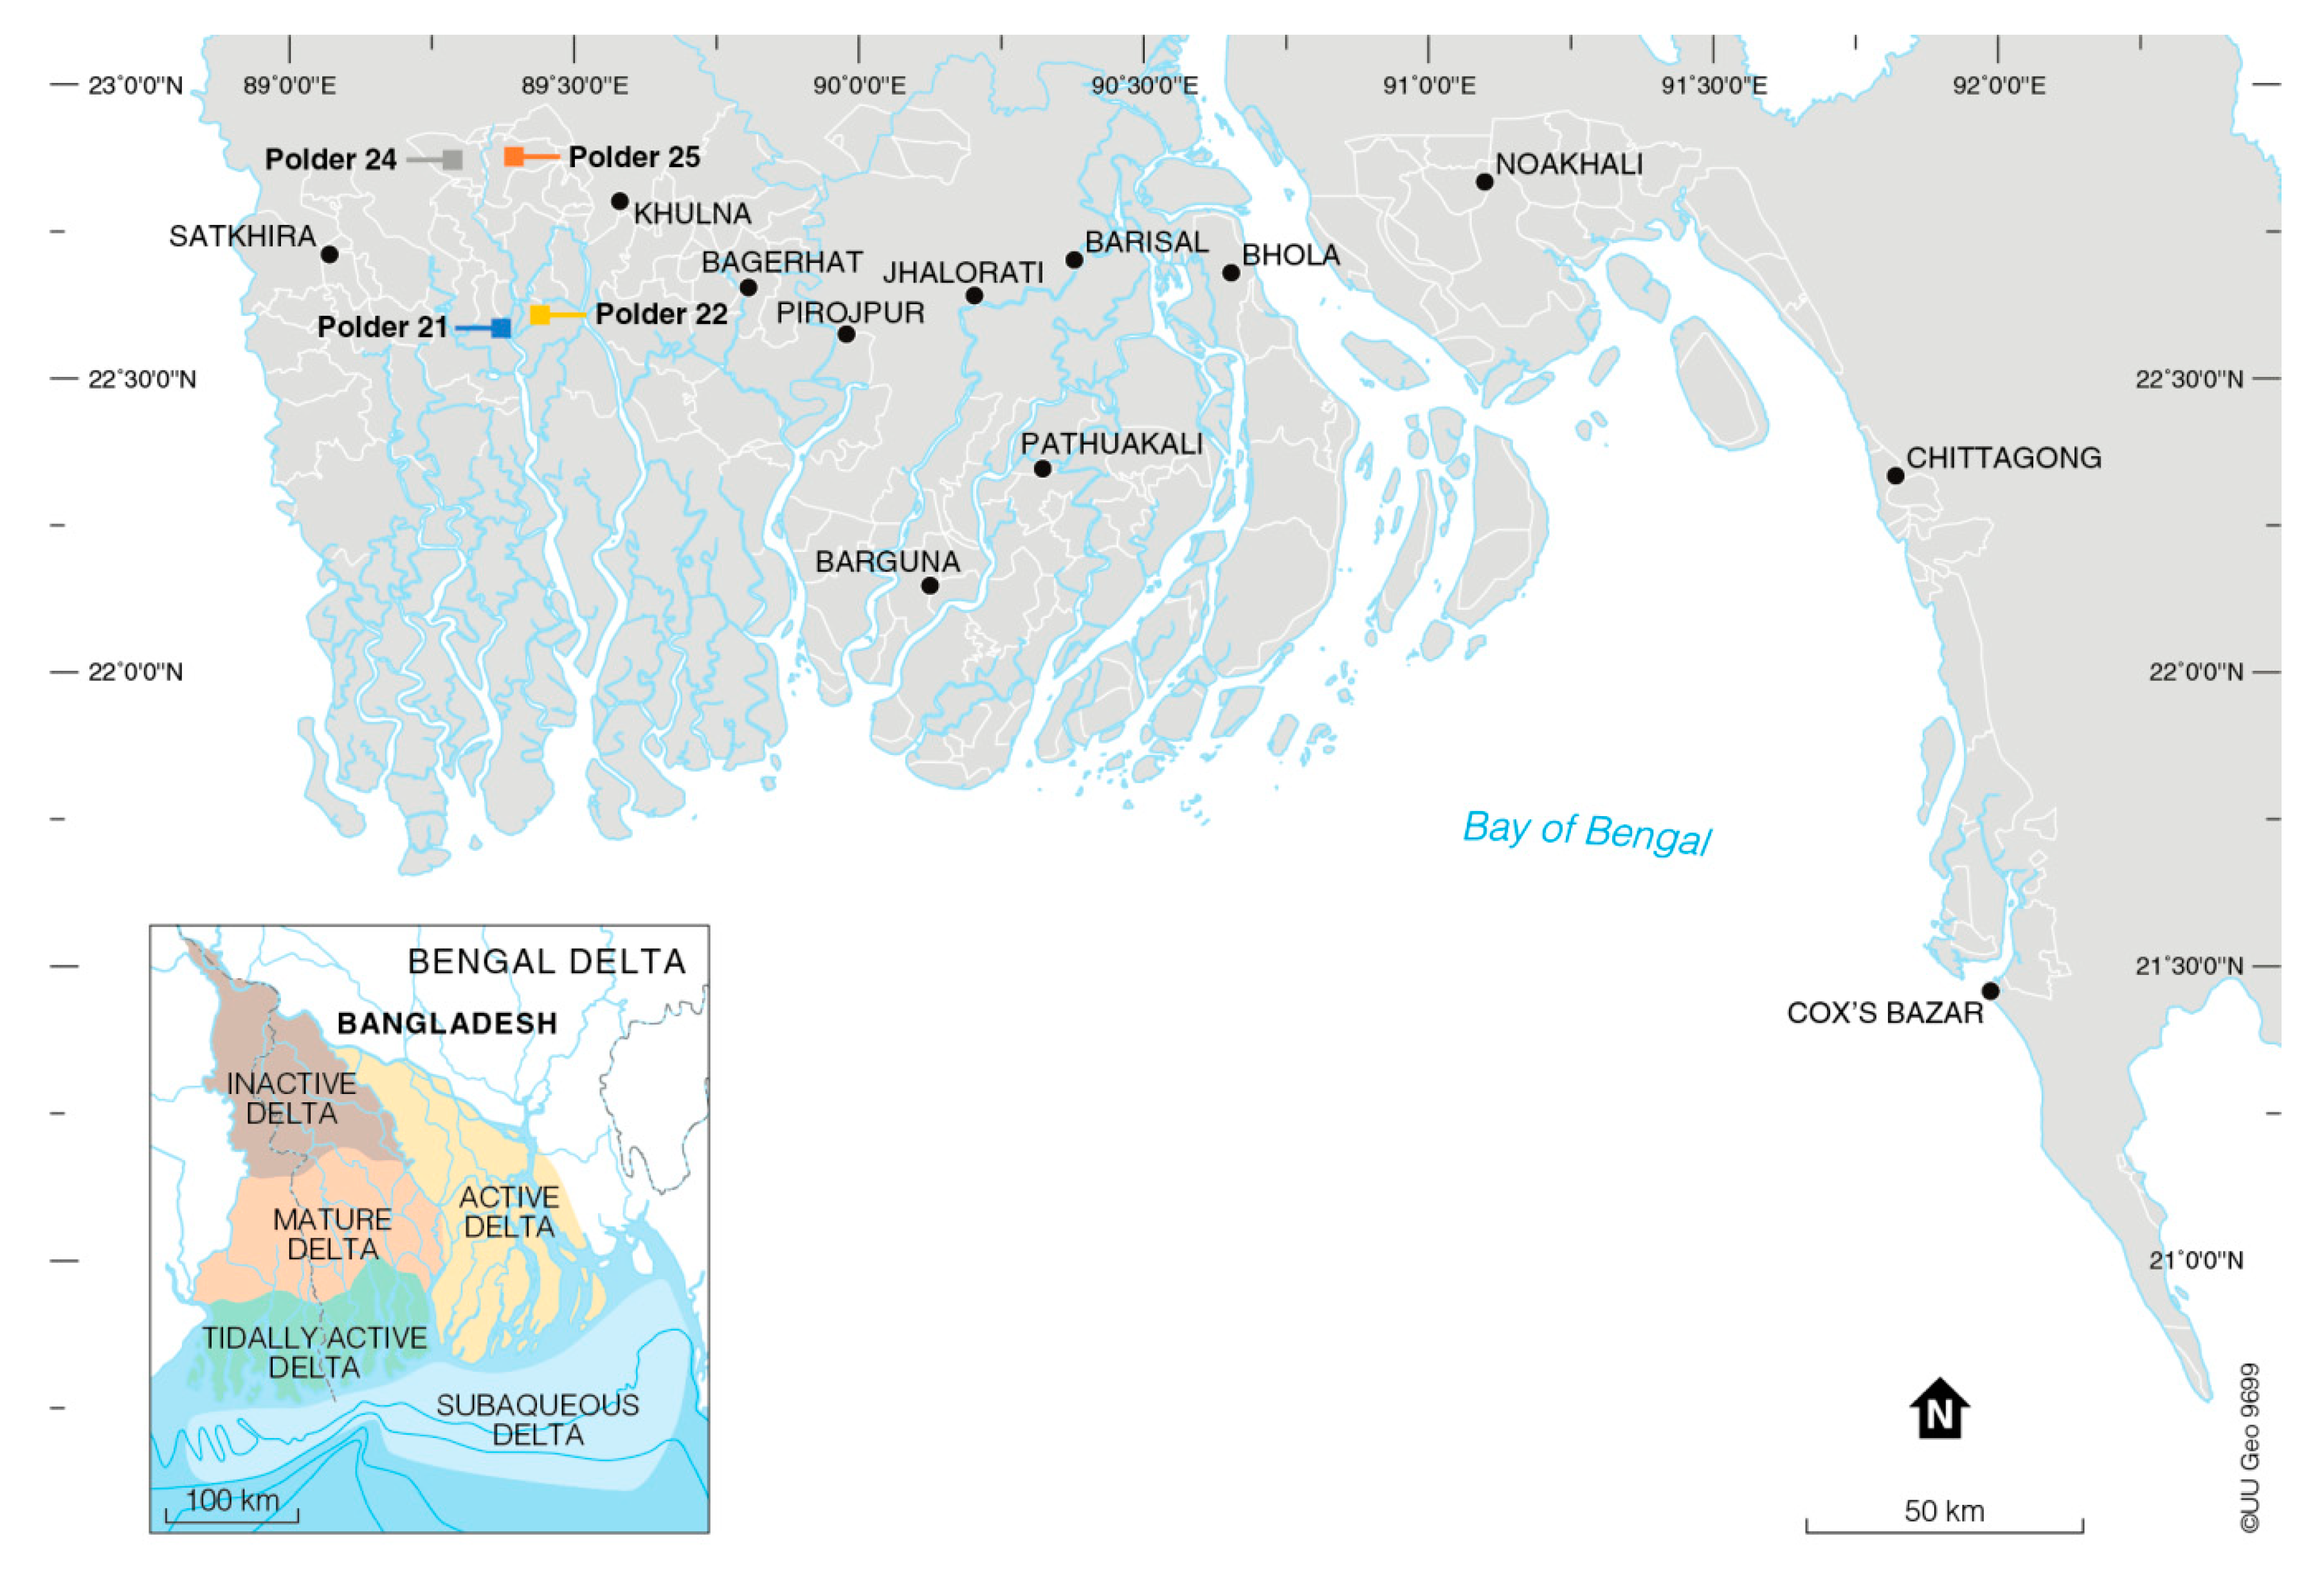
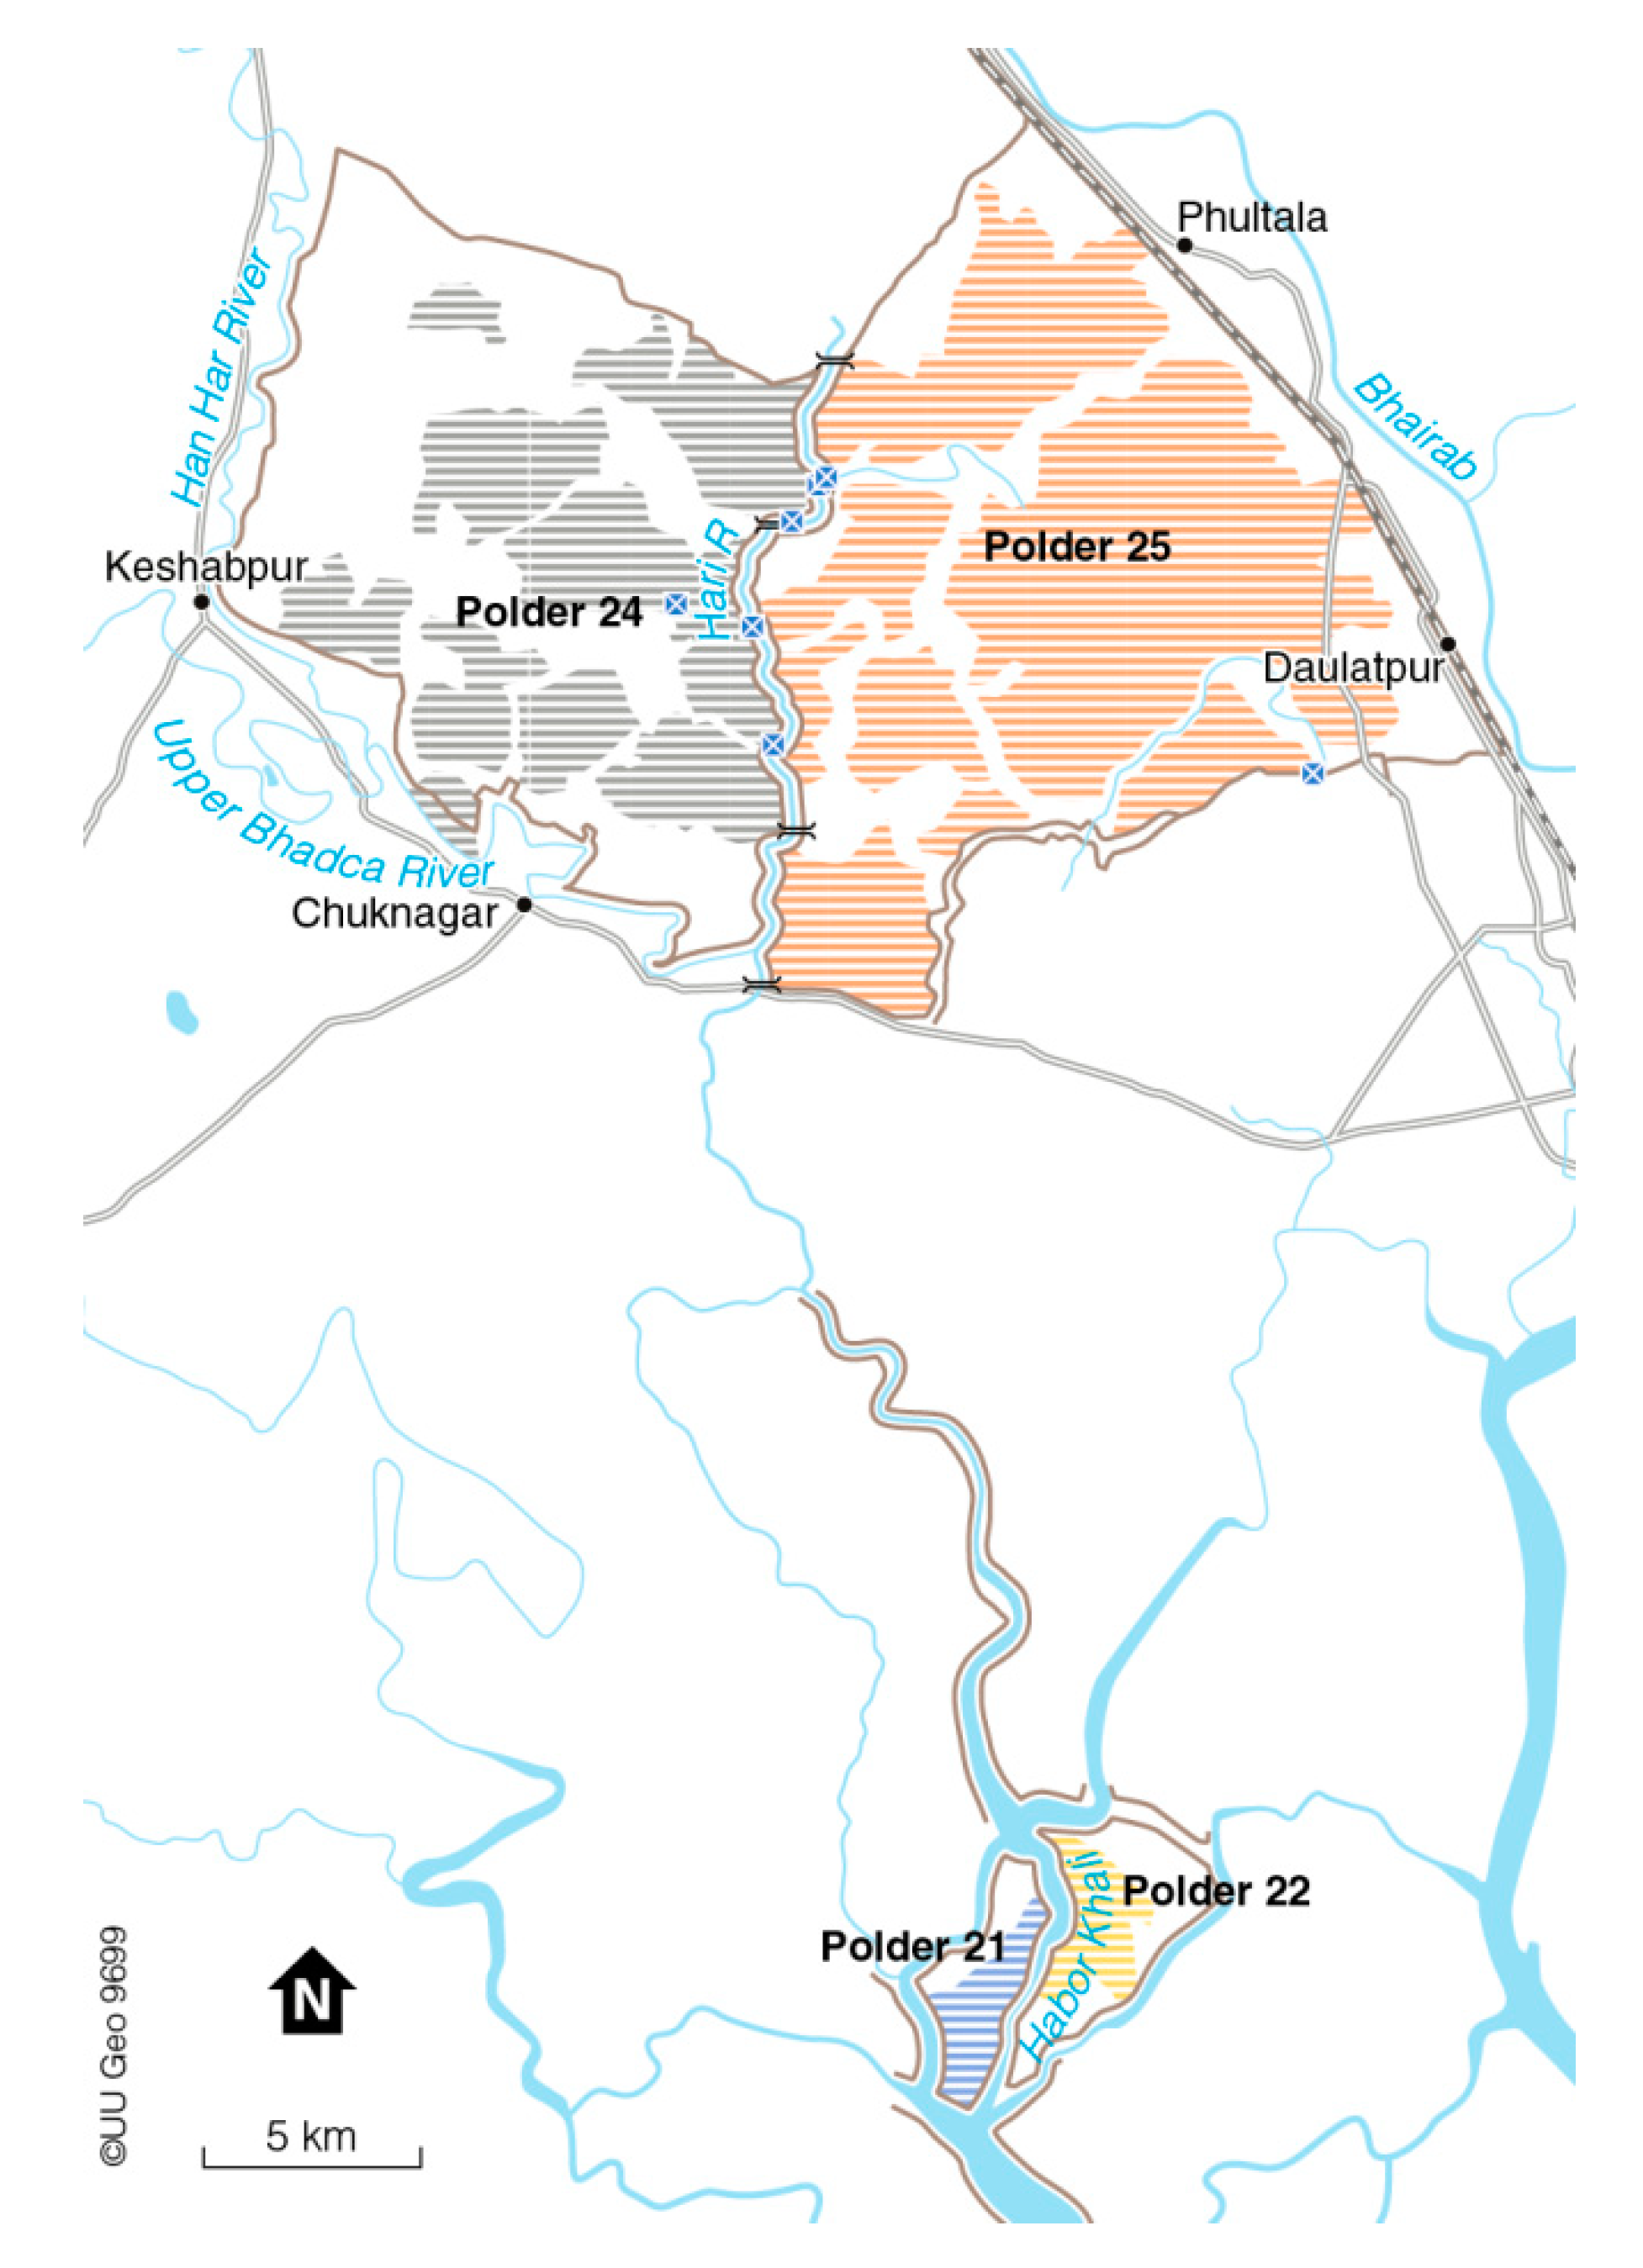
3.1. Study Sites
Rationale for Selection of Study Sites
3.2. Hypothesis, Dependent, and Independent Variables
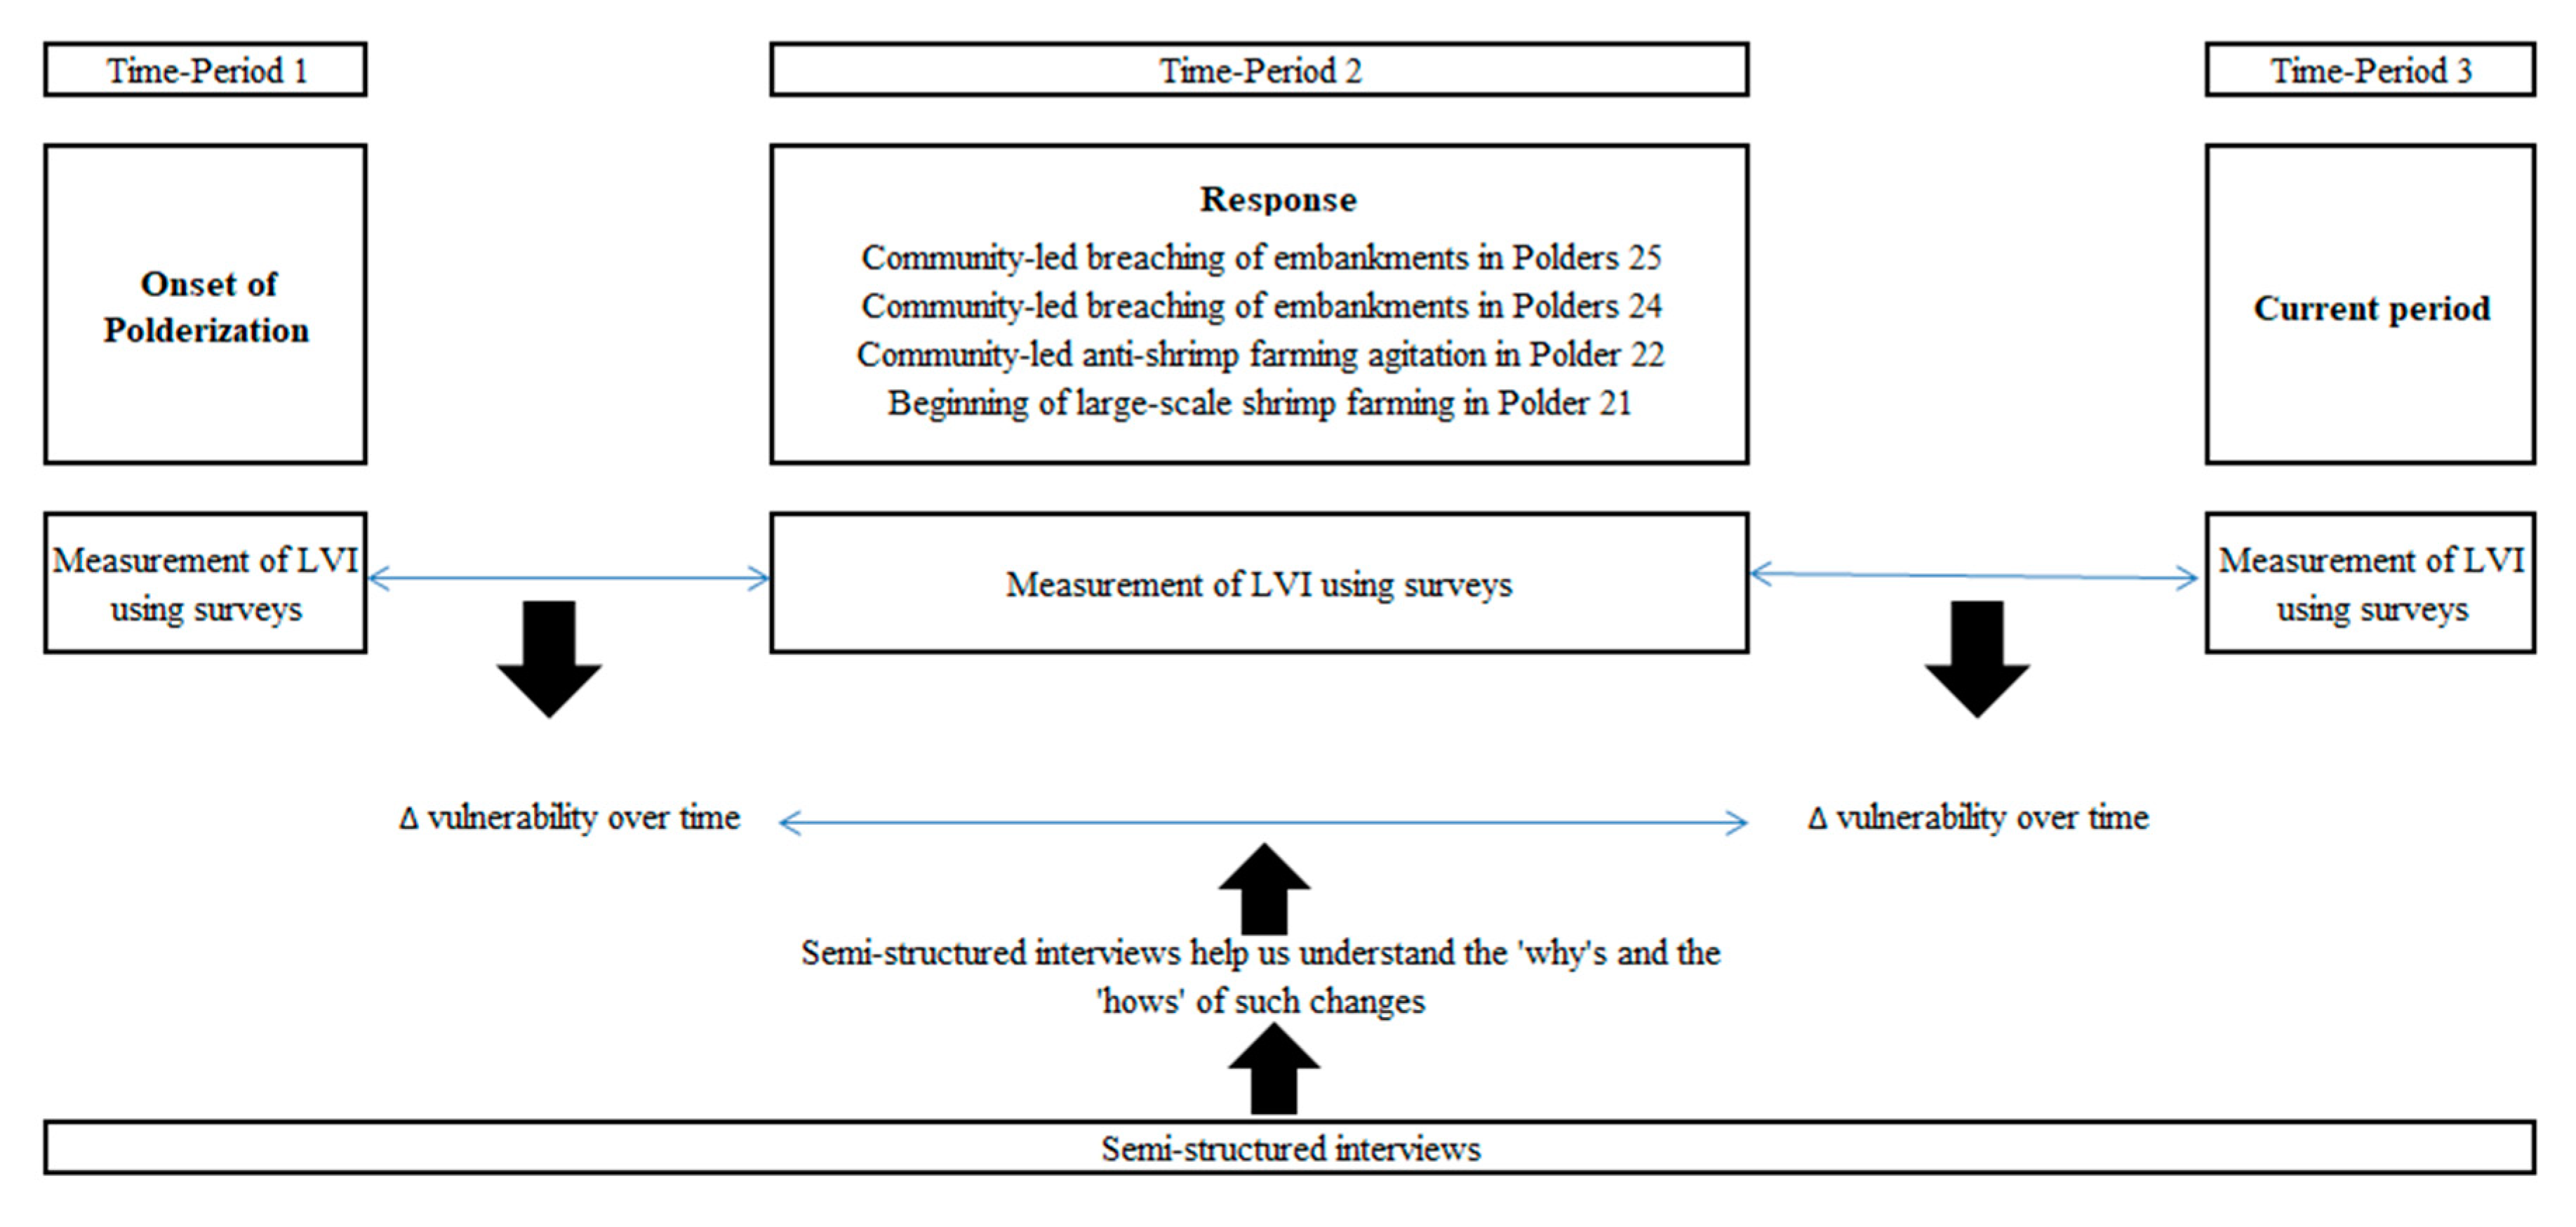
3.3. Data Collection and Analysis Strategy
3.4. Calculating the Livelihood Vulnerability Index (LVI)
4. Results
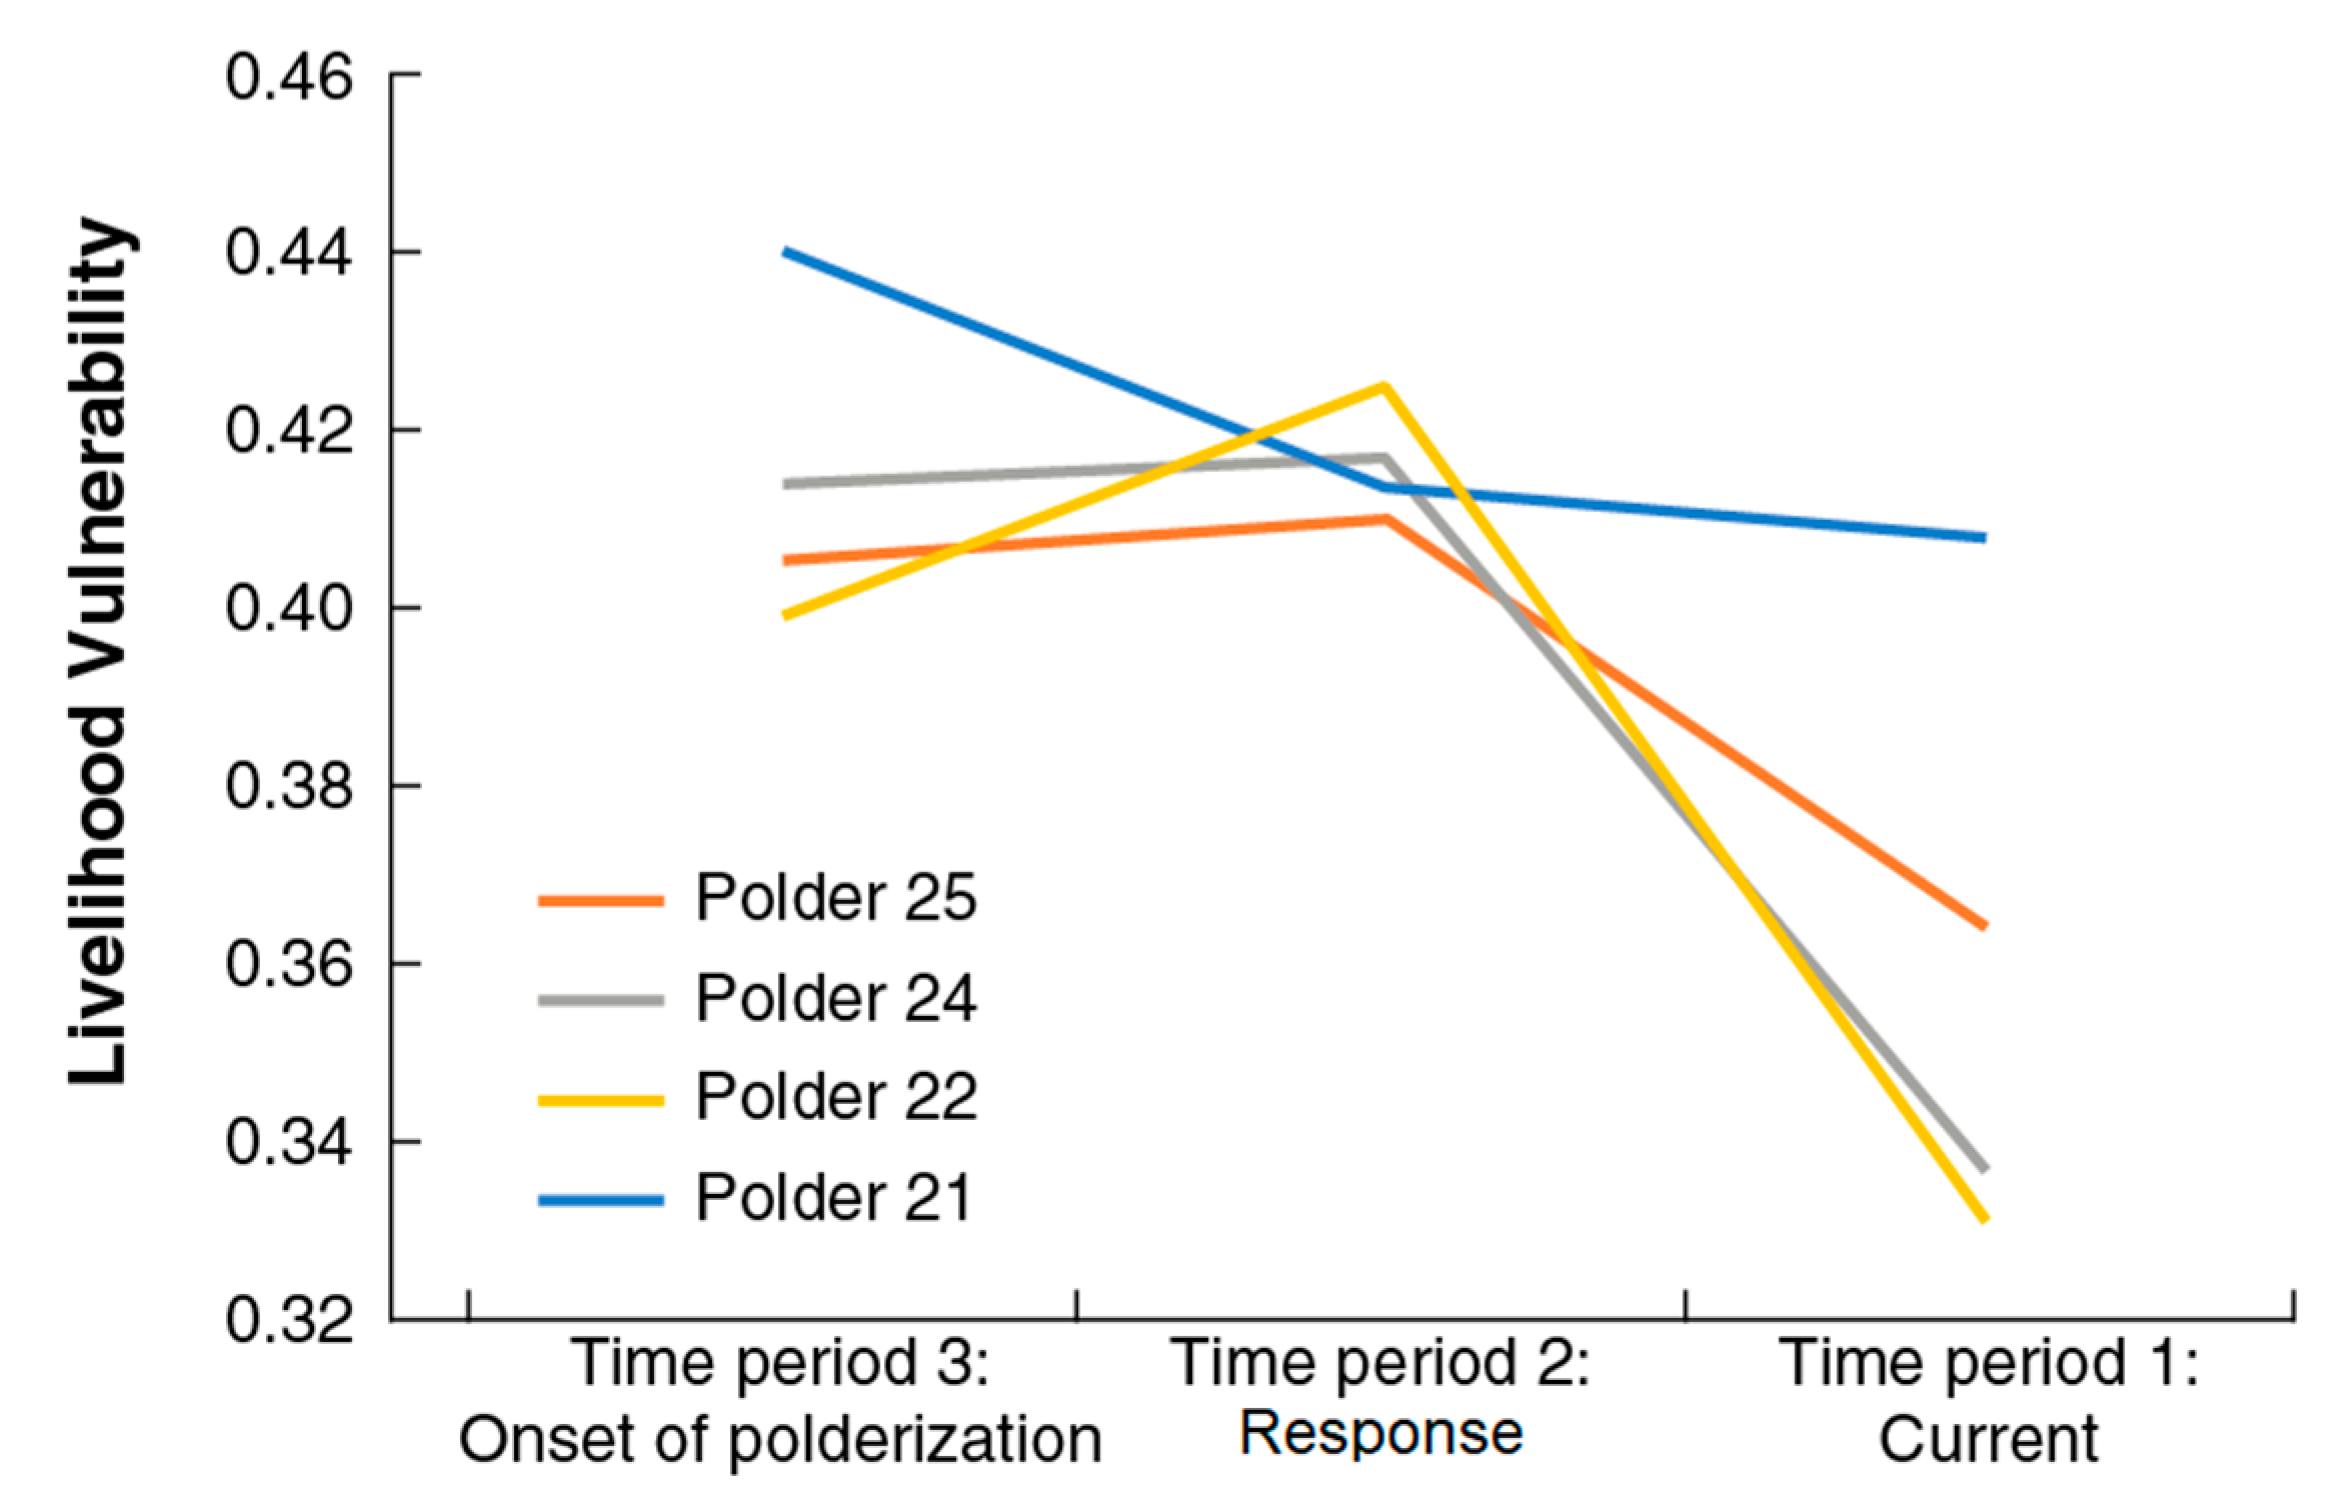
4.1. Variation of Livelihood Vulnerability Over Time
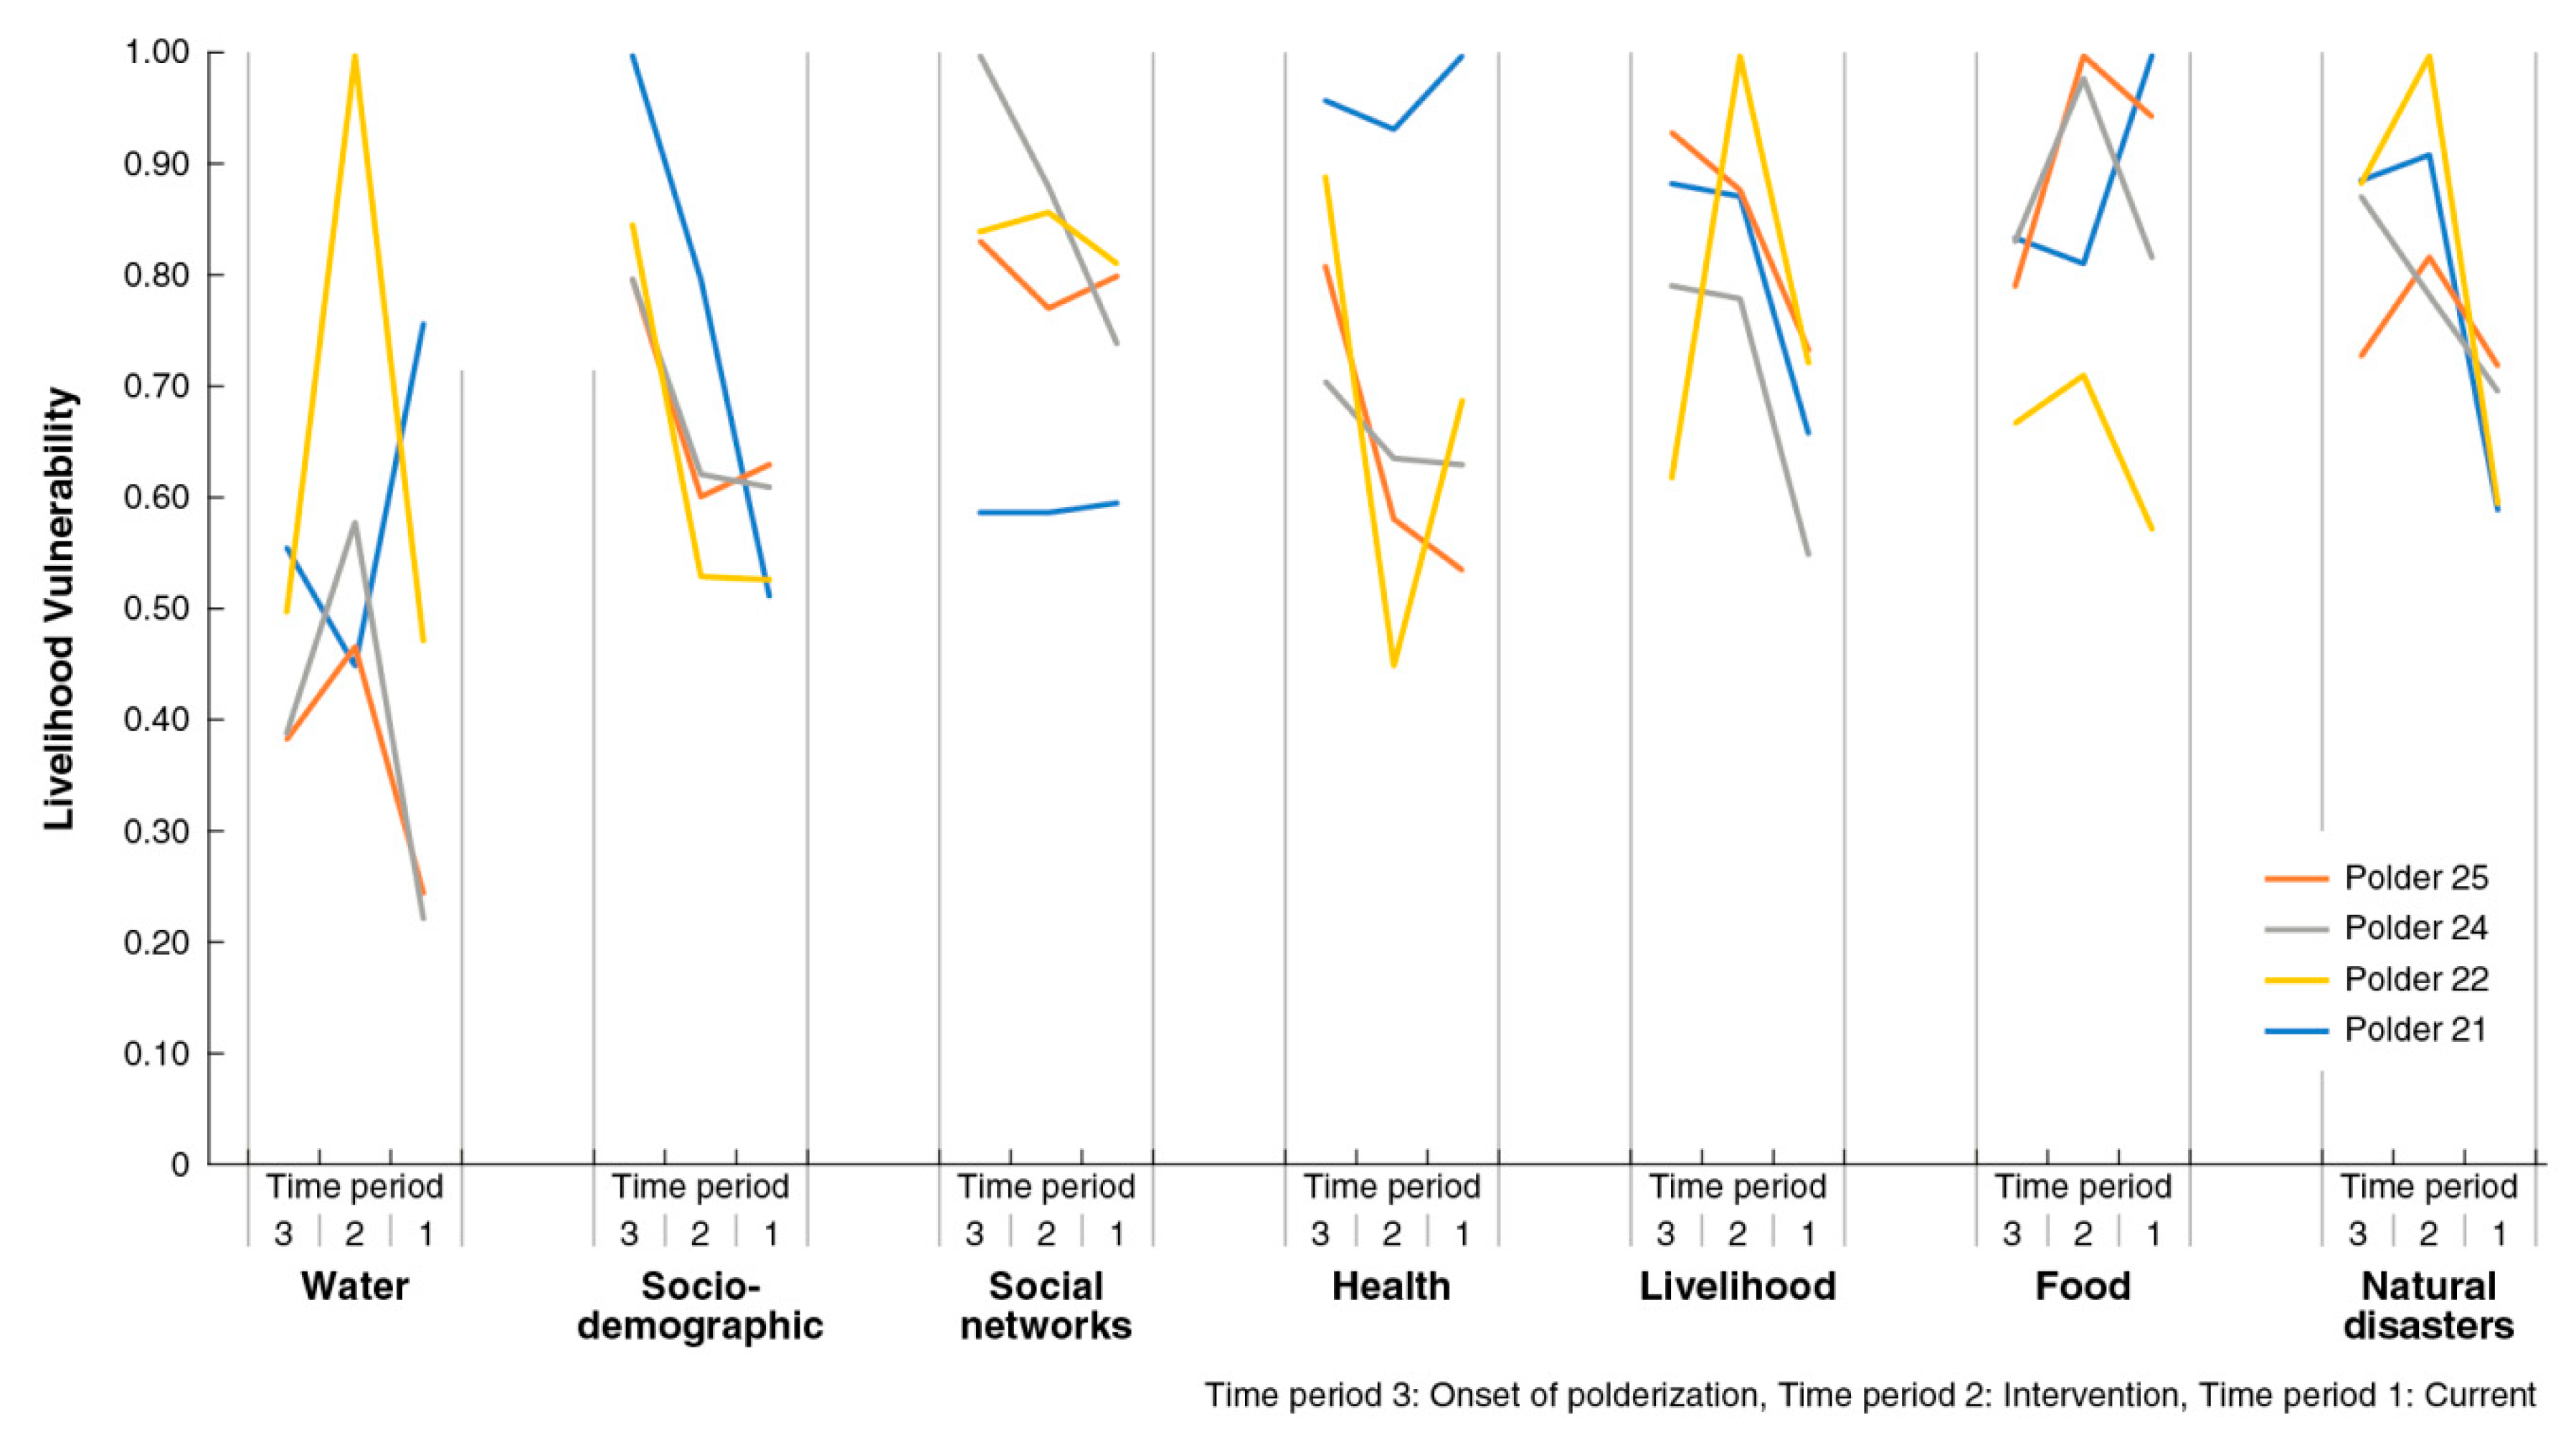
4.2. Variation of the 7 LVI Sub-Components Over Time
4.2.1. Variation of the Water Sub-Component
4.2.2. Variation of the Food Sub-Component
4.2.3. Variation of the Livelihood Strategies Sub-Component
4.2.4. Variation of the Health Sub-Component
4.2.5. Variation of the Socio-Demographic Sub-Component
4.2.6. Variation of the Social-Network Sub-Component
4.2.7. Variation of the Natural Disasters Sub-Component
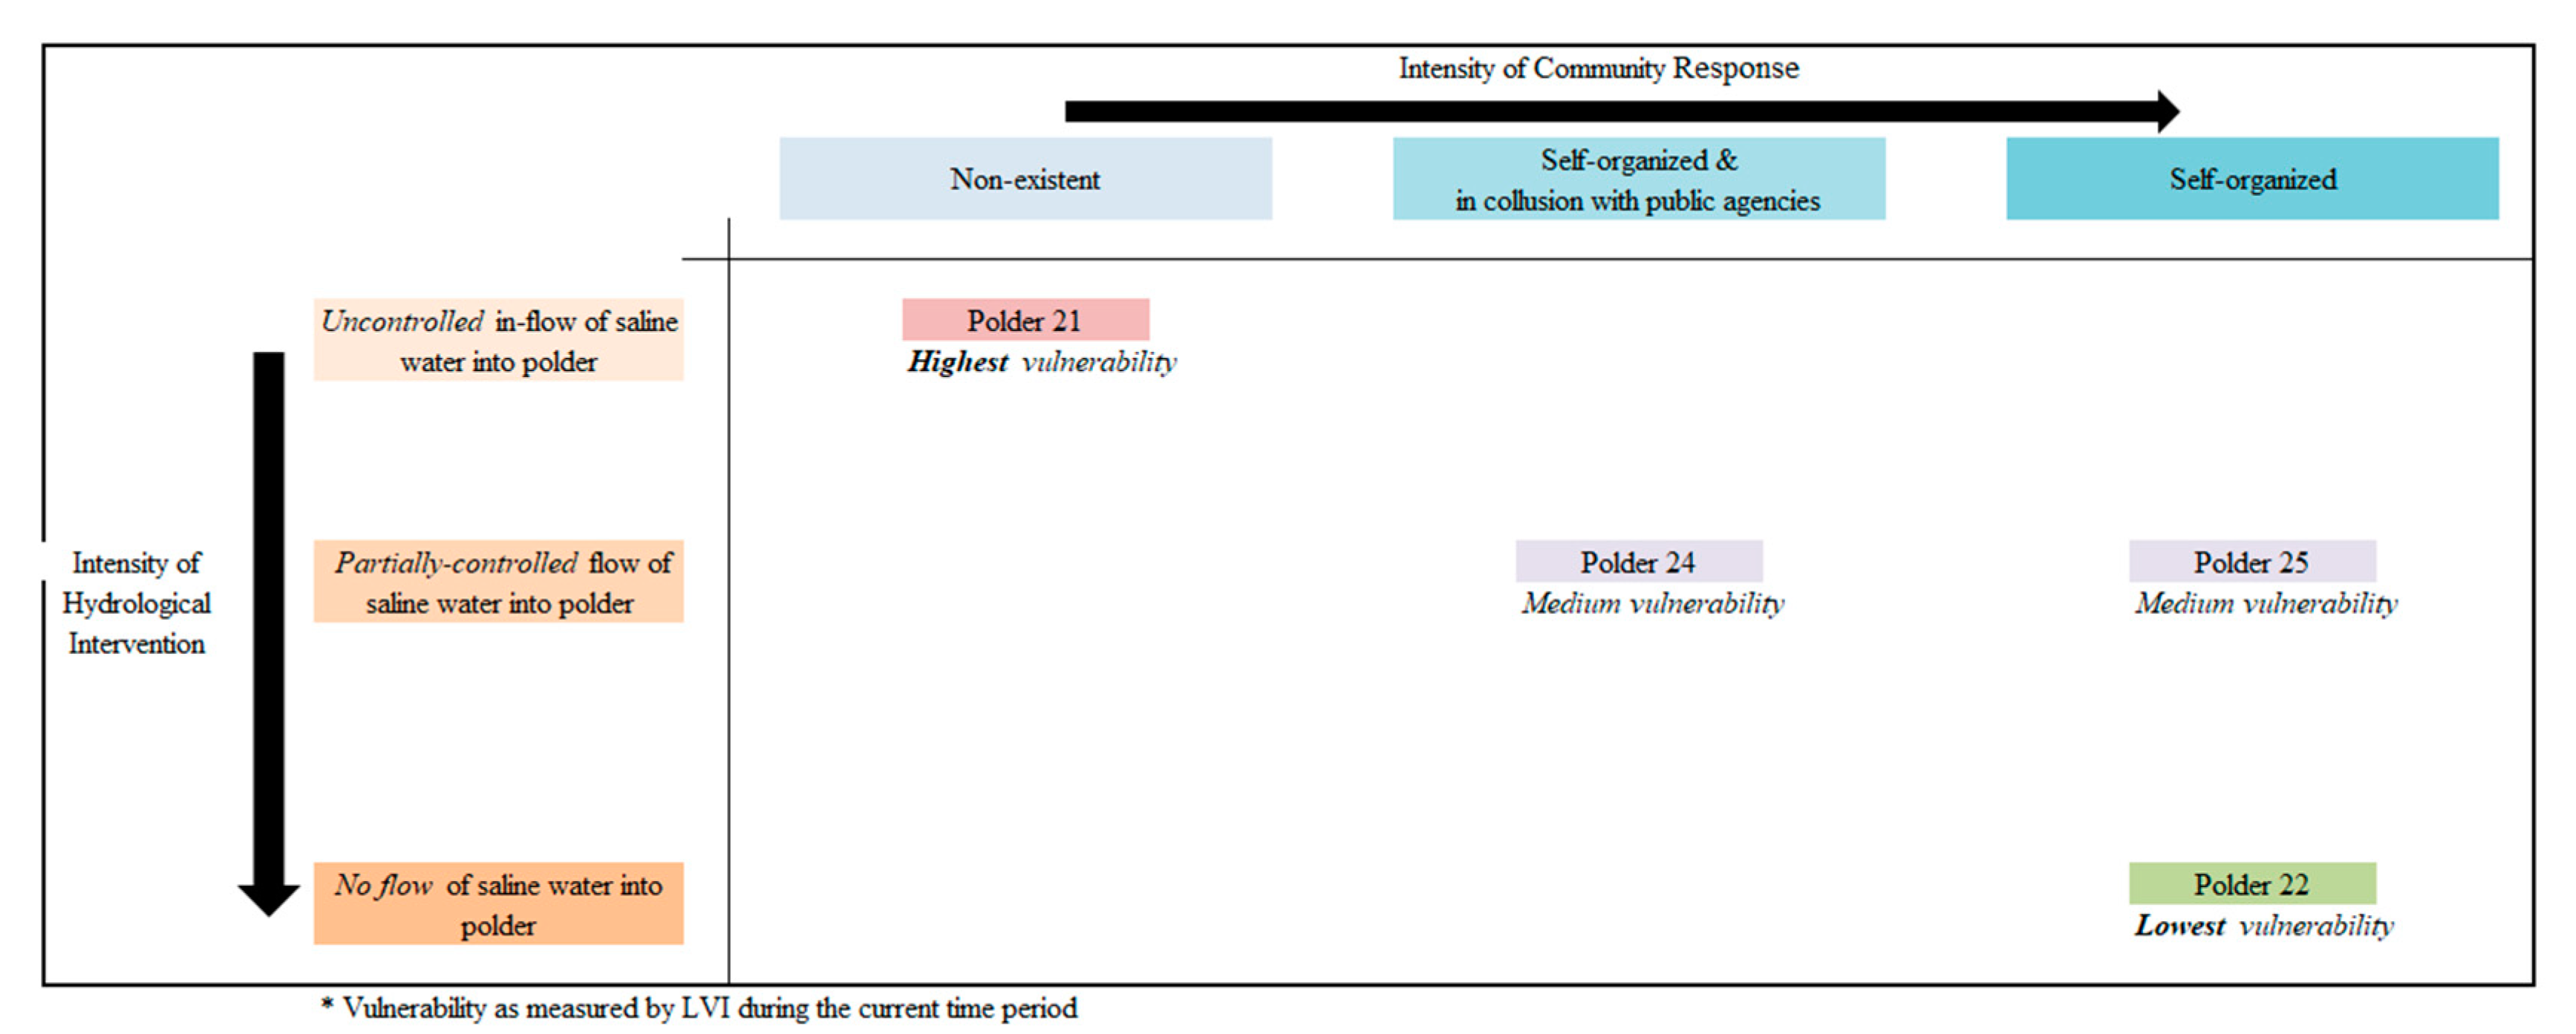
5. Discussion and Conclusions
Supplementary Materials
Author Contributions
Funding
Acknowledgments
Conflicts of Interest
References
- Neumann, B.; Vafeidis, A.T.; Zimmermann, J.; Nicholls, R.J. Future coastal population growth and exposure to sea-level rise and coastal flooding—A global assessment. PLoS ONE 2015, 10, e0118571. [Google Scholar] [CrossRef] [PubMed]
- Adger, W.N.; Hughes, T.P.; Folke, C.; Carpenter, S.R.; Rockström, J. Social-ecological resilience to coastal disasters. Science 2005, 309, 1036–1039. [Google Scholar] [CrossRef] [PubMed]
- Renaud, F.G.; Syvitski, J.P.M.; Sebesvari, Z.; Werners, S.E.; Kremer, H.; Kuenzer, C.; Ramesh, R.; Jeuken, A.; Friedrich, J. Tipping from the Holocene to the Anthropocene: How threatened are major world deltas? Curr. Opin. Environ. Sustain. 2013, 5, 644–654. [Google Scholar] [CrossRef]
- Nicholls, R.J.; Cazenave, A. Sea-level rise and its impact on coastal zones. Science 2010, 328, 1517–1520. [Google Scholar] [CrossRef]
- Inniss, L.; Simcock, A. The First Global Integrated Marine Assessment. World Ocean Assessment I; United Nations Environmental Program: New York, NY, USA, 2016. [Google Scholar]
- Quassem, M.; van Urk, A.; van Alphen, J.; van Beek, E.; Taal, M. Participatory flood management: Comparative study of the dutch and Bangladesh experience. In Floods, from Defence to Management; van Beek, E., Taal, M., van Alphen, J., Eds.; Taylor & Francis: Leiden, The Netherlands, 2006; pp. 133–146. [Google Scholar]
- Choudhury, N.Y.; Paul, A.; Paul, B.K. Impact of costal embankment on the flash flood in Bangladesh: A case study. Appl. Geogr. 2004, 24, 241–258. [Google Scholar] [CrossRef]
- Paprocki, K.; Cons, J. Life in a shrimp zone: Aqua- and other cultures of Bangladesh’s coastal landscape. J. Peasant Stud. 2014, 41, 1109–1130. [Google Scholar] [CrossRef]
- Auerbach, L.W.; Goodbred, S.L., Jr.; Mondal, D.R.; Wilson, C.A.; Ahmed, K.R.; Roy, K.; Steckler, M.S.; Small, C.; Gilligan, J.M.; Ackerly, B.A. Flood risk of natural and embanked landscapes on the Ganges–Brahmaputra tidal delta plain. Nat. Clim. Chang. 2015, 5, 153–157. [Google Scholar] [CrossRef]
- Alam, M.S.; Sasaki, N.; Datta, A. Waterlogging, crop damage and adaptation interventions in the coastal region of Bangladesh: A perception analysis of local people. Environ. Dev. 2017, 23, 22–32. [Google Scholar] [CrossRef]
- Das, D.; Mallick, B.; Vogt, J. Social process analysis in poverty alleviation program: A study of Khas-land distribution in rural Bangladesh. J. Bangladesh Inst. Plan. 2012, 2075, 9363. [Google Scholar]
- Wilson, C.; Goodbred, S.; Small, C.; Gilligan, J.; Sams, S.; Mallick, B.; Hale, R. Widespread infilling of tidal channels and navigable waterways in the human-modified tidal deltaplain of southwest Bangladesh. Elem.-Sci. Anthr. 2017, 5, 1–12. [Google Scholar] [CrossRef]
- Ishtiaque, A.; Sangwan, N.; Yu, D.J. Robust-yet-fragile nature of partly engineered social-ecological systems: A case study of coastal Bangladesh. Ecol. Soc. 2017, 22. [Google Scholar] [CrossRef]
- Akber, M.A.; Khan, M.W.R.; Islam, M.A.; Rahman, M.M.; Rahman, M.R. Impact of land use change on ecosystem services of southwest coastal Bangladesh. J. Land Use Sci. 2018, 13, 238–250. [Google Scholar] [CrossRef]
- Mukhopadhyay, A.; Hornby, D.D.; Hutton, C.W.; Lázár, A.N.; Johnson, F.A.; Ghosh, T. Land Cover and Land Use Analysis in Coastal Bangladesh. In Ecosystem Services for Well-Being in Deltas; Palgrave Macmillan: Cham, Switzerland, 2018; pp. 367–381. [Google Scholar]
- Mutahara, M. Turning the tide. In The Role of Participation and Learning in Strengthening Tidal River Management in the Bangladesh Delta; Wageningen University: Wageningen, The Netherlands, 2018. [Google Scholar]
- Seijger, C.; Datta, D.K.; Douven, W.; van Halsema, G.; Khan, M.F. Rethinking sediments, tidal rivers and delta livelihoods: Tidal river management as a strategic innovation in Bangladesh. Water Policy 2019, 21, 108–126. [Google Scholar] [CrossRef]
- Dewan, C.; Mukherji, A.; Buisson, M.-C. Evolution of water management in coastal Bangldesh: From temporary earthen embankments to depoliticized community-managed polders. Water Int. 2015, 40, 401–416. [Google Scholar] [CrossRef]
- Ayers, J. Resolving the Adaptation Paradox: Exploring the Potential for Deliberative Adaptation Policy-Making in Bangladesh. Glob. Environ. Politics 2011, 11, 62–88. [Google Scholar] [CrossRef]
- Huq, M.; Khan, M.F.; Pandey, K.; Ahmed, M.M.Z.; Khan, Z.H.; Dasgupta, S.; Mukherjee, N. Vulnerability of Bangladesh to Cyclones in A Changing Climate: Potential Damages and Adaptation Cost; The World Bank: Washington, DC, USA, 2010. [Google Scholar]
- Sarker, M.N.I.; Wu, M.; Alam, G.M.M.; Shouse, R.C. Livelihood Vulnerability of Riverine-Island Dwellers in the Face of Natural Disasters in Bangladesh. Sustainability 2019, 11, 1623. [Google Scholar] [CrossRef]
- Abedin, M.A.; Habiba, U.; Shaw, R. Water Insecurity: A Social Dilemma, 1st ed.; Abedin, M.A., Ed.; International Environment and Disaster Management Laboratory, Graduate School of Global Environment Studies, Kyoto University: Kyoto, Japan; Umma Habiba, International Environment and Disaster Management Laboratory, Graduate School of Global Environment Studies, Kyoto University: Kyoto, Japan; Rajib Shaw, International Environment and Disaster Management Laboratory, Graduate School of Global Environmental Studies, Kyoto University: Kyoto, Japan; Emerald Group Publishing Limited: Bingley, UK, 2013; ISBN 9781781908839. [Google Scholar]
- Panthi, J.; Aryal, S.; Dahal, P.; Bhandari, P.; Krakauer, N.Y.; Pandey, V.P. Livelihood vulnerability approach to assessing climate change impacts on mixed agro-livestock smallholders around the Gandaki River Basin in Nepal. Reg. Environ. Chang. 2016, 16, 1121–1132. [Google Scholar] [CrossRef]
- Miller, F.; Osbahr, H.; Boyd, E.; Thomalla, F.; Bharwani, S.; Ziervogel, G.; Walker, B.; Birkmann, J.; van der Leeuw, S.; Rockström, J.; et al. Resilience and Vulnerability: Complementary or Conflicting Concepts? Ecol. Soc. 2010, 15, 11. [Google Scholar] [CrossRef]
- Adger, W.N. Vulnerability. Glob. Environ. Chang. 2006, 16, 268–281. [Google Scholar] [CrossRef]
- Keynotes: Polders of the World; Segeren, W.A., Ed.; International Symposium: Lelystad, The Netherlands, 1982. [Google Scholar]
- Perry, M.; Canziani, O.; Palutikof, J.; Linden, P.V.D.; Hanson, C. Climate Change 2007: Impacts, Adaptation and Vulnerability: Contribution of Working Group II to the Fourth Assessment Report of the Intergovernmental Panel on Climate Change; Cambridge University Press for the Intergovernmental Panel on Climate Change: Cambridge, UK, 2007; ISBN 0521705975. [Google Scholar]
- IPCC. Climate Change 2001: Impacts, Adaptation, and Vulnerability; Cambridge University Press: Cambridge, UK, 2001. [Google Scholar]
- Hahn, M.B.; Riederer, A.M.; Foster, S.O. The Livelihood Vulnerability Index: A pragmatic approach to assessing risks from climate variability and change—A case study in Mozambique. Glob. Environ. Chang. 2009, 19, 74–88. [Google Scholar] [CrossRef]
- Scoones, I. Sustainable Rural Livelihoods: A Framework for Analysis; IDS Working Paper 72; Institute of Development Studies: Brighton, UK, 1998. [Google Scholar]
- Turner II, B.L. Vulnerability and resilience: Coalescing or paralleling approaches for sustainability science? Glob. Environ. Chang. 2010, 20, 570–576. [Google Scholar] [CrossRef]
- Shah, K.U.; Dulal, H.B.; Johnson, C.; Baptiste, A. Understanding livelihood vulnerability to climate change: Applying the livelihood vulnerability index in Trinidad and Tobago. Geoforum 2013, 47, 125–137. [Google Scholar] [CrossRef]
- Alwang, J.; Siegel, P.B.; Jorgensen, S.L. Vulnerability: A View from Different Disciplines; The World Bank: Washington, DC, USA, 2001. [Google Scholar]
- Brooks, N.; Neil Adger, W.; Mick Kelly, P. The determinants of vulnerability and adaptive capacity at the national level and the implications for adaptation. Glob. Environ. Chang. 2005, 15, 151–163. [Google Scholar] [CrossRef]
- GED. Bangladesh Delta Plan 2100: Draft; Bangladesh Planning Commission: Dhaka, Bangladesh, 2017.
- BWDB. Final Report, Volume VIII: Social & Environmental Reports, Coastal Embankment Improvement Project, Phase-I (CEIP-I); Bangladesh Water Development Board: Dhaka, Bangladesh, 2012.
- IWM. Final Report, Main Report, Feasibility Study and Detailed Engineering Design for Long Term Solution of Drainage Problems in the Bhabodah Area; Institute of Water Modeling: Dhaka, Bangladesh, 2010. [Google Scholar]
- Ostrom, E. A Polycentric Approach for Coping with Climate Change; The World Bank: Washington, DC, USA, 2009. [Google Scholar]
- Herrera, A. Access to khas land in Bangladesh: Discussion on the opportunities and challenges for landless people. In Essay on Development Policy: NADEL MAS-Cycle 2014-2016; ETH Zurich: Zurich, Switzerland, 2016; pp. 1–29. [Google Scholar]


| Hydrological Condition | Hydrological Intervention | Community Response | ||||
|---|---|---|---|---|---|---|
| Polder No. | Area (Hectares) | Length of Embankment (km) | Salinity Intrusion | Drainage Congestion | Flow of Saline Water | |
| 21 | 1417 | 17 | High | High | Uncontrolled | Non-existent |
| 22 | 1630 | 20 | Low | Low | Completely stopped | Self-organized |
| 24 | 28,340 | 26 | Medium | High | Partially controlled | Self-organized and in collusion with public agencies |
| 25 | 17,400 | 46 | Medium | Medium | Partially controlled | Self-organized |
| Components | Sub-Components | Explanation of Sub-Component | Whether Used in This Research |
|---|---|---|---|
| Socio-demographic profile | Dependency ratio | Ratio of the population under 15 and over 65 years of age to the population between 19 and 64 years of age | Yes |
| Percent of female-headed households | Percentage of households where the primary adult is female | No, during surveys researchers were unable to find any female-headed households in the study sites | |
| Size of household | Number of people who eats and sleeps in the house | Replacement indicator for percent of female-headed households | |
| Percent of households where head of household has not attended school | Percentage of households where the head of the household reports that they have attended 0 years of school | Yes | |
| Percent of households with orphans | Percentage of households that have at least one orphan living in their home. Orphans are children <18 years old who have lost one or both parents | Yes | |
| Livelihood | Percent of households with family member working in a different community | Percentage of households that report at least one family member who works outside of the community for their primary work activity | Yes |
| Percent of households dependent solely on agriculture as a source of income | Percentage of households that report only agriculture as a source of income | Yes | |
| Average agricultural livelihood diversification index | The inverse of (the number of agricultural livelihood activities +1) reported by a household | Yes | |
| Health | Average time to health facility (minutes) | Average time it takes the households to get to the nearest health facility | Yes |
| Percentage of households with family member with chronic illness | Percentage of households that report at least one family member with chronic illness. Chronic illness was defined subjectively by respondent | Yes | |
| Percentage of households where a family member had to miss work or school in the last two weeks due to illness | Percentage of households that report at least one family member who had to miss school of work due to illness in the last two weeks | Yes | |
| Average malaria exposure*prevention index | Months reported exposure to malaria (mosquito-borne disease) *Owning at least one bed net indicator (have bed net = 0.5, no bed net = 1) | No, almost all households had bed nets | |
| Percentage of households with reported exposure to mosquito-borne and/or water-borne disease | Percentage of households with reported exposure to mosquito-borne and/or water-borne disease | Replacement indicator for average malaria exposure * prevention index | |
| Social Networks | Average receive/give ratio | Ratio of number of times help received/number of times help given | Yes, but adapted |
| Average borrow/lend money ratio | Ratio of a household borrowing money in the past month to a household lending money in the past month | Yes | |
| Percentage of households that have not gone to their local government for assistance in the past 12 months | Percentage of households that reported that they have not asked their local government for any assistance in the past 12 months | Yes | |
| Food | Percentage of households dependent on family farm for food | Percentage of households that get their food primarily from their personal farms | Yes |
| Average number of months households struggle to find food | Average number of months households struggle to obtain food for their family | Yes | |
| Average crop diversity index | The inverse of (the number of crops grown by a household +1) | Yes, but adapted to include a larger diversity of food items to reflect ground realities | |
| Percent of households that do not save crops | Percentage of households that do not save crops from each harvest | Yes | |
| Percent of households that do not save seeds | Percentage of households that do not have seeds from year to year | Yes | |
| Water | Percent of households reporting water conflicts | Percentage of households that report having heard about conflicts over water in their community | Yes |
| Percentage of households that utilize a natural water source | Percentage of households that utilize a natural water source | Yes, but adapted to capture local dynamics associated with purchased water and tube-well | |
| Average time to water source (minutes) | Average time it takes the households to travel to their primary water source | Yes | |
| Percentage of households that do not have a consistent water supply | Percentage of households that report that water is not available at their primary water source everyday | Yes | |
| Inverse of the average number of liters of water stored per household | The inverse of (the average number of liters of water stored by each household +1) | Yes | |
| Natural disasters and climate variability | Exposure to natural disasters | Total number of floods, droughts, and cyclones that were reported by households in the past six years | Yes, but adapted to capture local dynamics associated with drainage congestion. In addition, the indicator was adapted to allocate higher scores to households exposed to a wider variety of hazards |
| Percentage of households that did not receive a warning about the pending natural disasters | Percentage of households that did not receive a warning about the pending natural disasters | Yes | |
| Percentage of households with an injury or death as a result of the natural disasters | Percentage of households with an injury or death as a result of the natural disasters | Yes | |
| Mean standard deviation of the daily average maximum temperature | Mean standard deviation of the daily average maximum temperature by month | No, data not available at polder-level | |
| Mean standard deviation of the daily average minimum temperature | Mean standard deviation of the daily average minimum temperature by month | No, data not available at polder-level | |
| Mean standard deviation of average precipitation | Mean standard deviation of average precipitation by month | No, data not available at polder-level |
| Factor Affecting Polder Vulnerability | Component of LVI | ||
|---|---|---|---|
| Hydrological interventions (use of polder-infrastructure to control salinity intrusion) | Water sub-component | Section 4.2.1 | |
| Food sub-component | Section 4.2.2 | ||
| Livelihood strategies sub-component | Section 4.2.3 | ||
| Macro-level societal factors | Connectivity to mainland | Health sub-component | Section 4.2.4 |
| Access to education and urbanization | Socio-demographic sub-component | Section 4.2.5 | |
| Increased economic affluence | Social-network sub-component | Section 4.2.6 | |
| Ecological factors and state-led developmental activities | Natural disasters sub-component | Section 4.2.7 | |
© 2019 by the authors. Licensee MDPI, Basel, Switzerland. This article is an open access article distributed under the terms and conditions of the Creative Commons Attribution (CC BY) license (http://creativecommons.org/licenses/by/4.0/).
Share and Cite
Nath, S.; van Laerhoven, F.; Driessen, P.P.J. Have Bangladesh’s Polders Decreased Livelihood Vulnerability? A Comparative Case Study. Sustainability 2019, 11, 7141. https://doi.org/10.3390/su11247141
Nath S, van Laerhoven F, Driessen PPJ. Have Bangladesh’s Polders Decreased Livelihood Vulnerability? A Comparative Case Study. Sustainability. 2019; 11(24):7141. https://doi.org/10.3390/su11247141
Chicago/Turabian StyleNath, Sanchayan, Frank van Laerhoven, and Peter P. J. Driessen. 2019. "Have Bangladesh’s Polders Decreased Livelihood Vulnerability? A Comparative Case Study" Sustainability 11, no. 24: 7141. https://doi.org/10.3390/su11247141
APA StyleNath, S., van Laerhoven, F., & Driessen, P. P. J. (2019). Have Bangladesh’s Polders Decreased Livelihood Vulnerability? A Comparative Case Study. Sustainability, 11(24), 7141. https://doi.org/10.3390/su11247141