Incorporating Smart Card Data in Spatio-Temporal Analysis of Metro Travel Distances

Abstract
1. Introduction
2. Literature Review
3. Study Area and Data Preparation
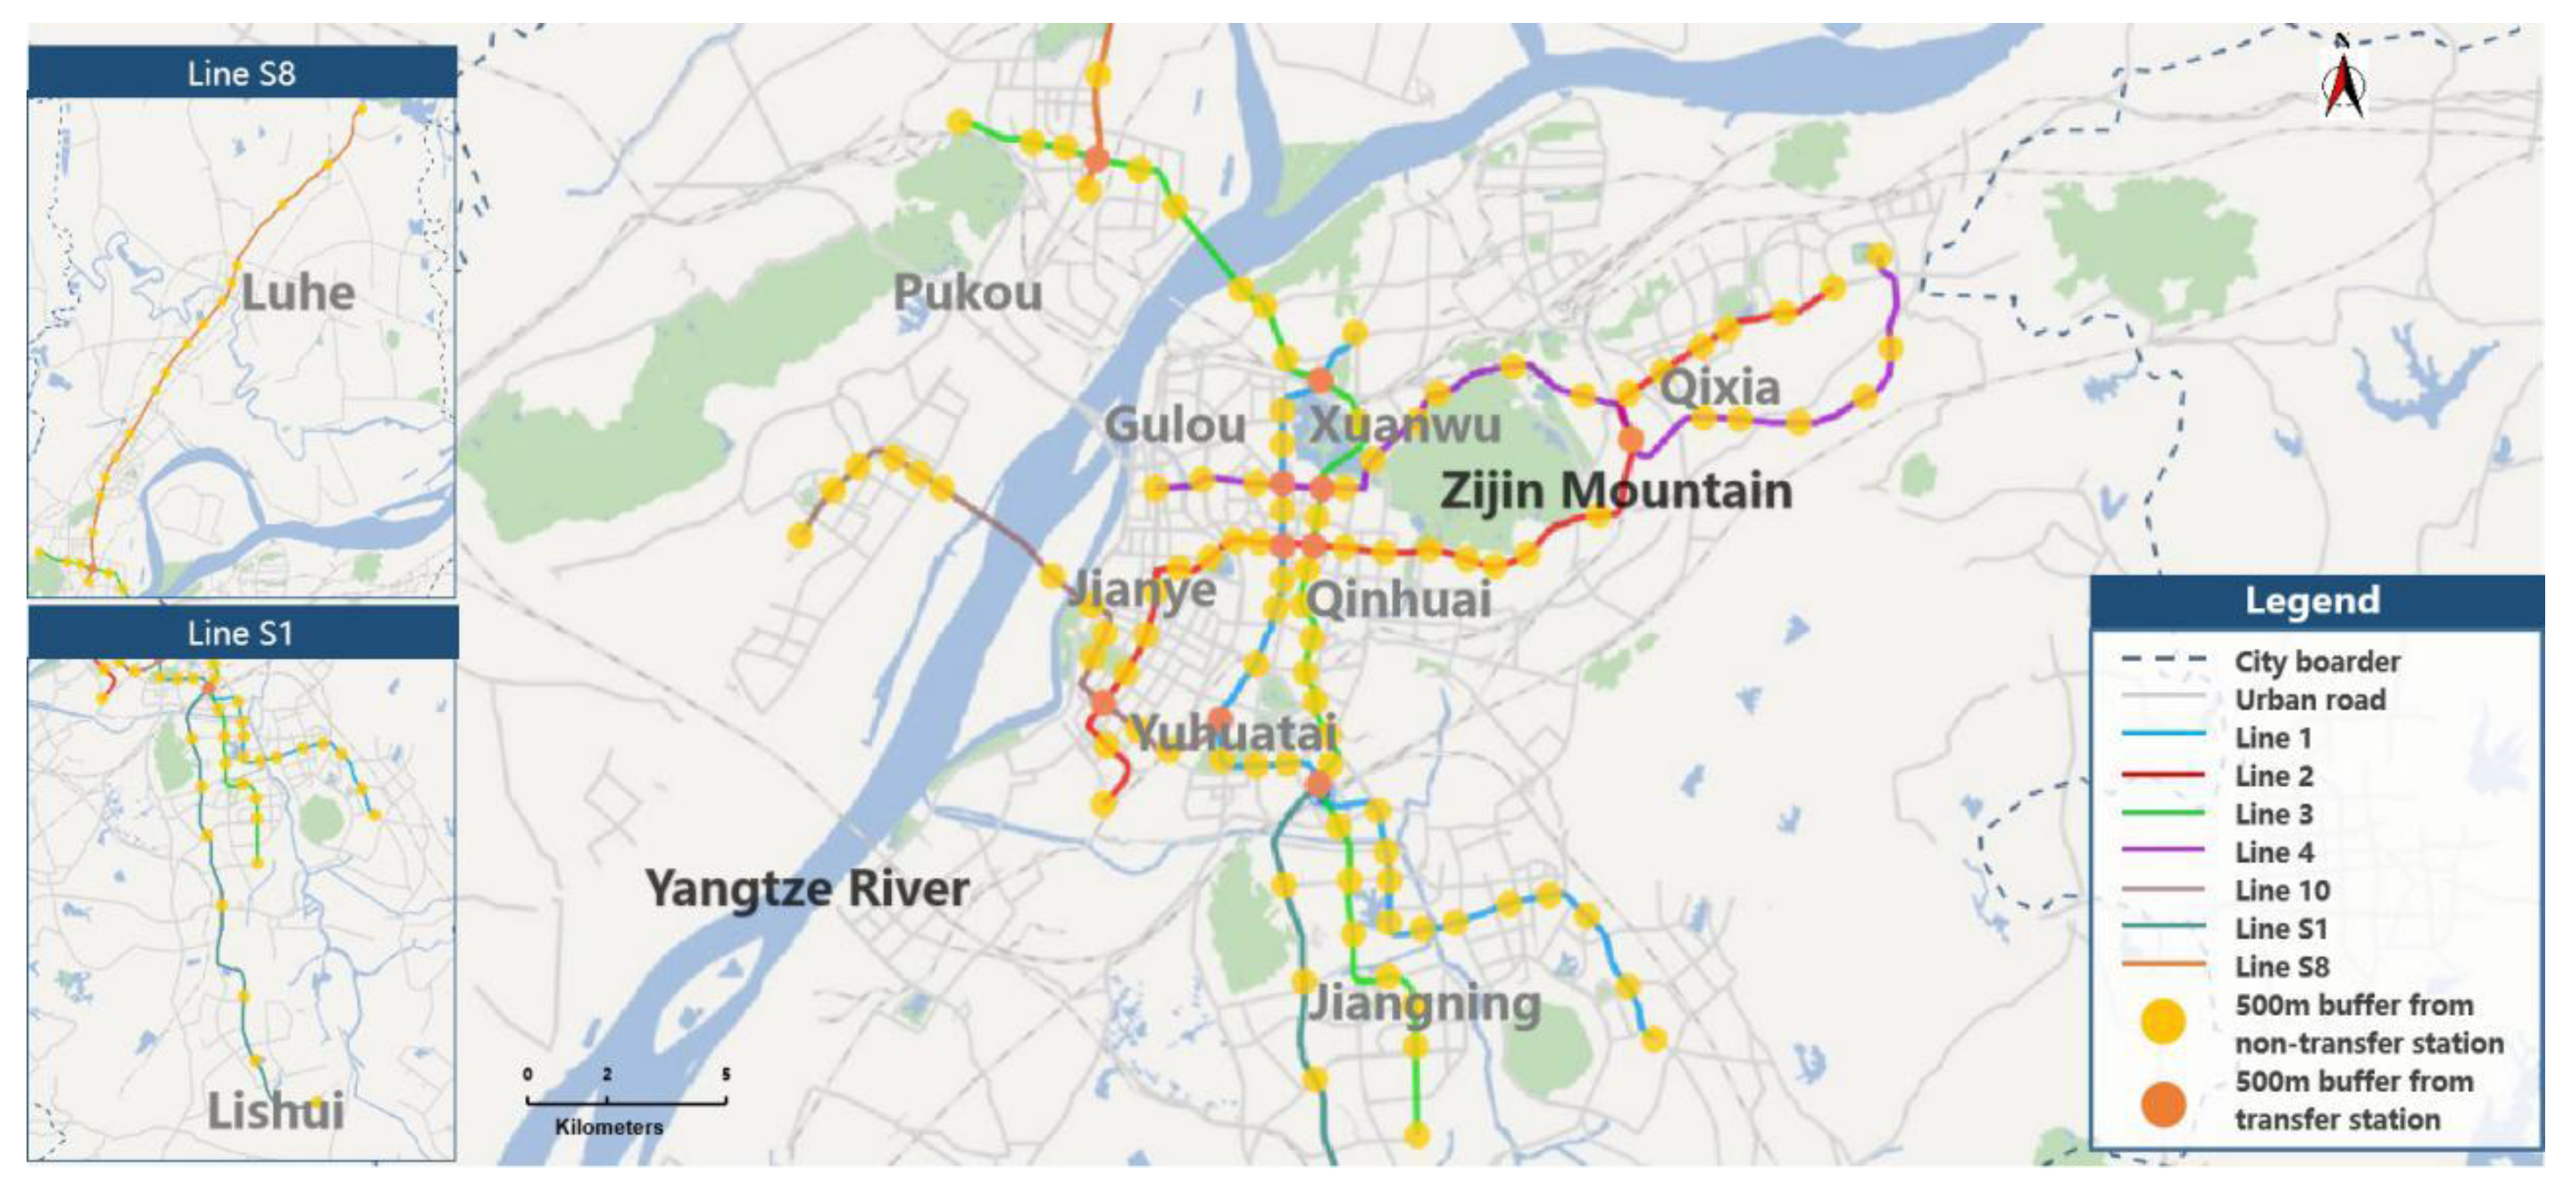
3.1. Study Area
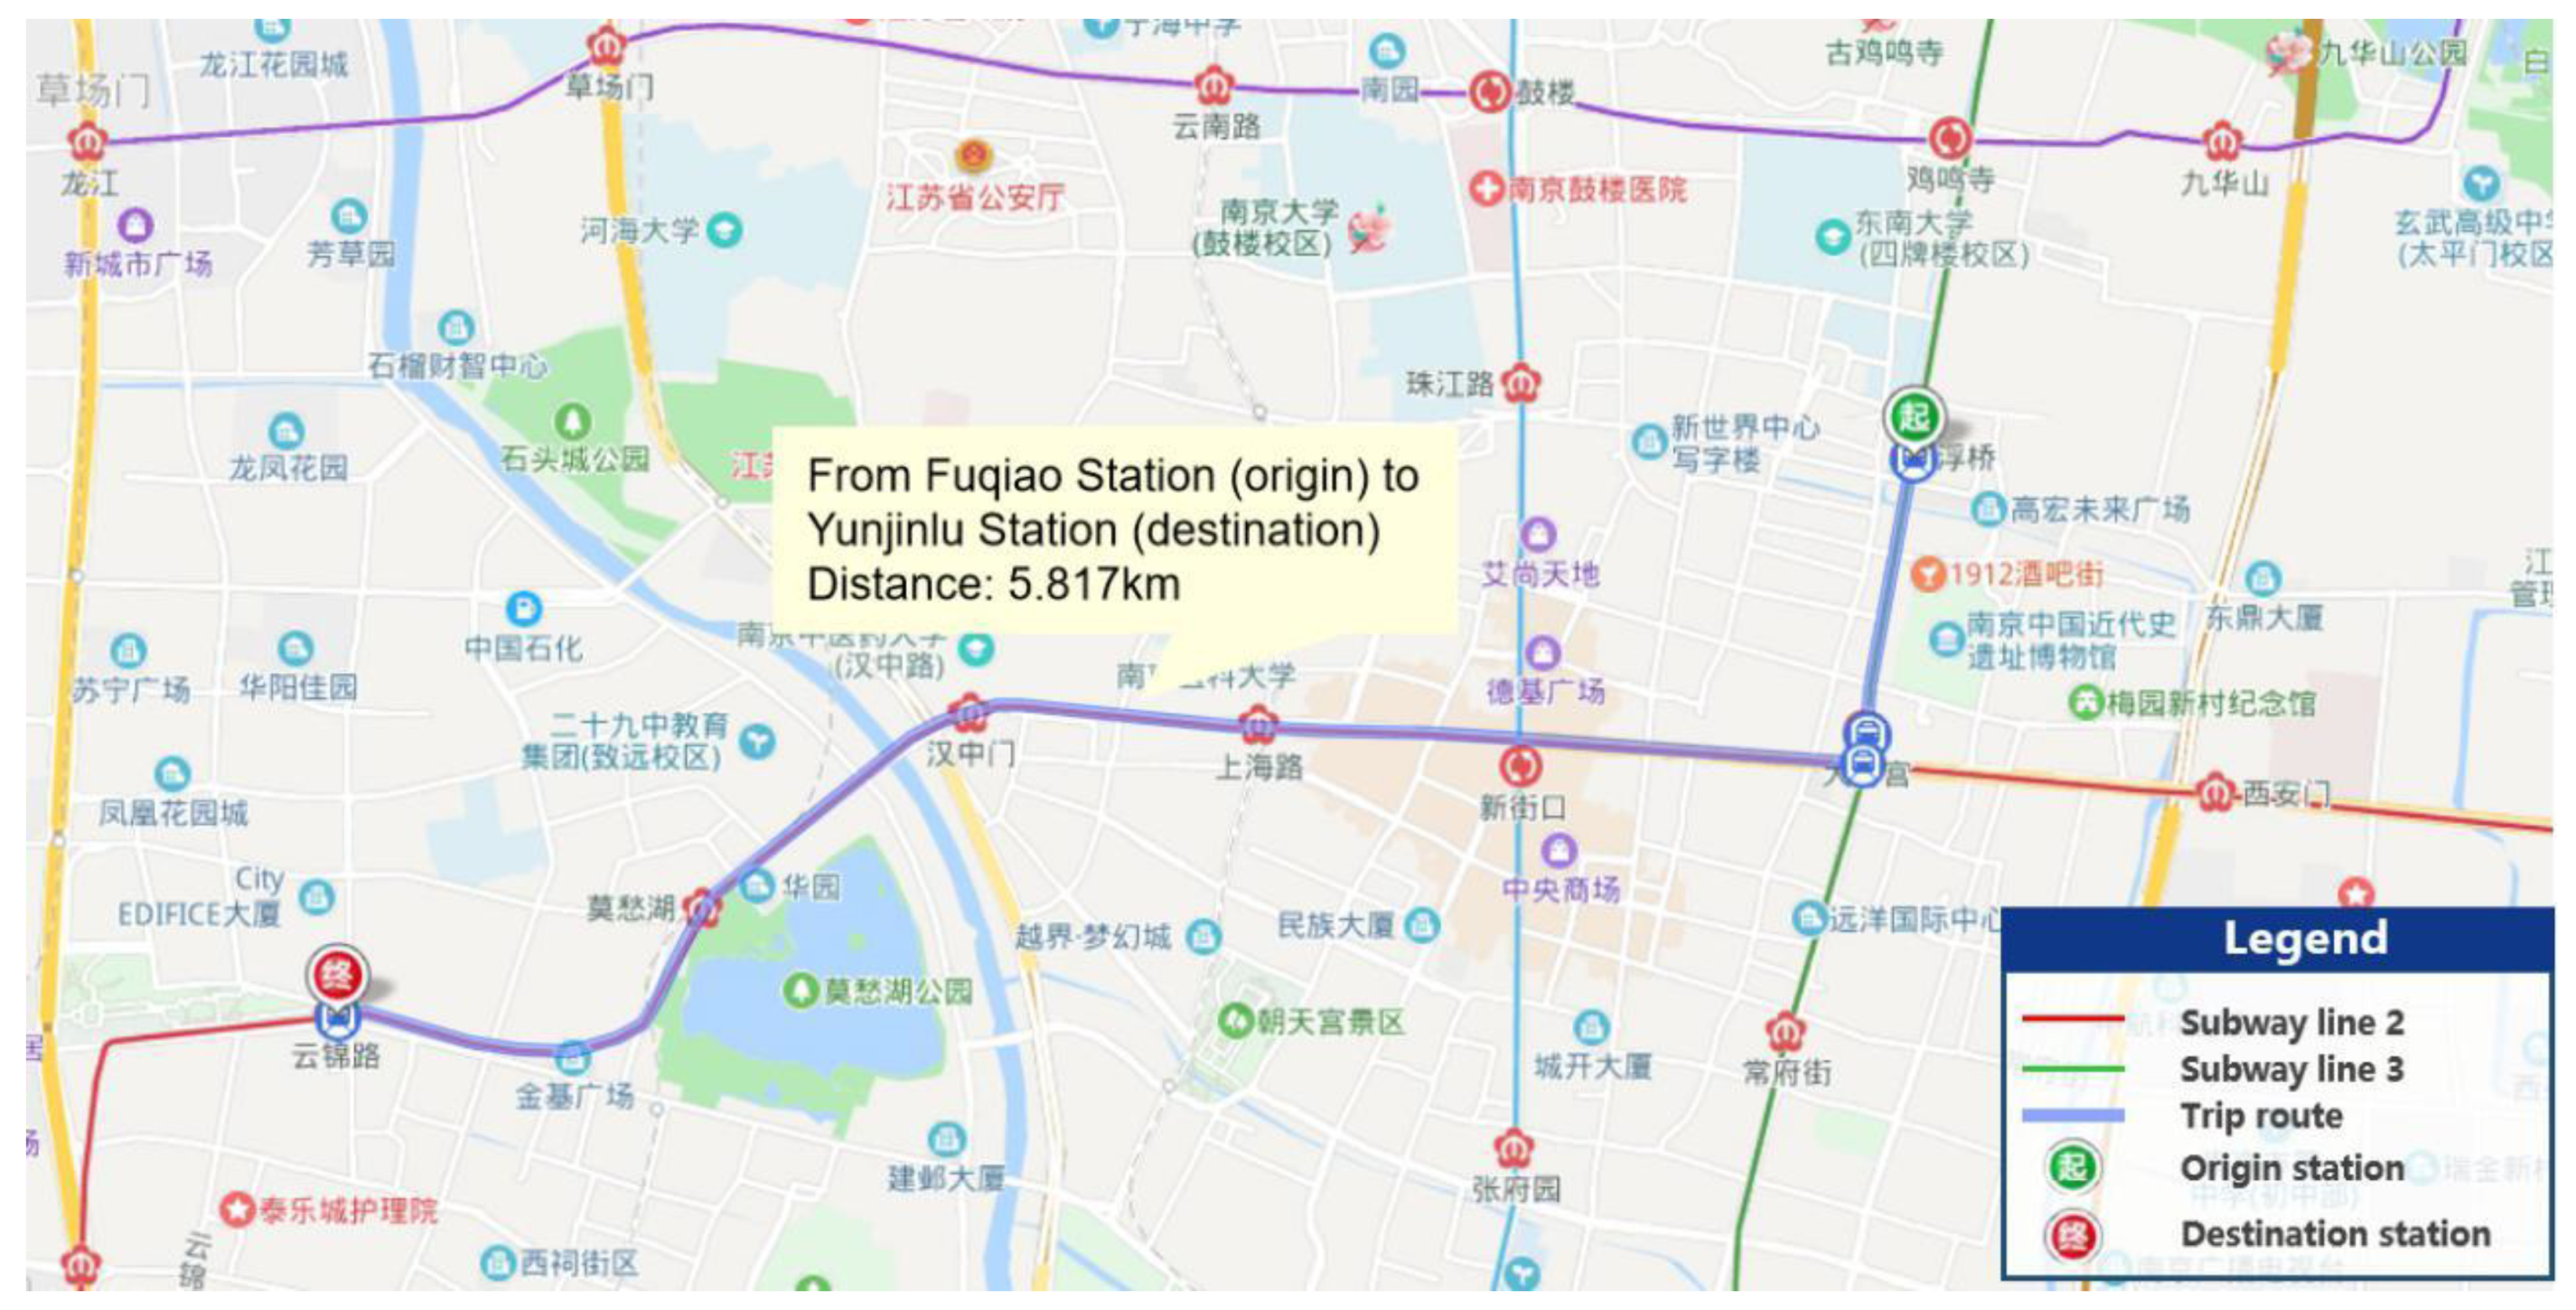
3.2. Data Source
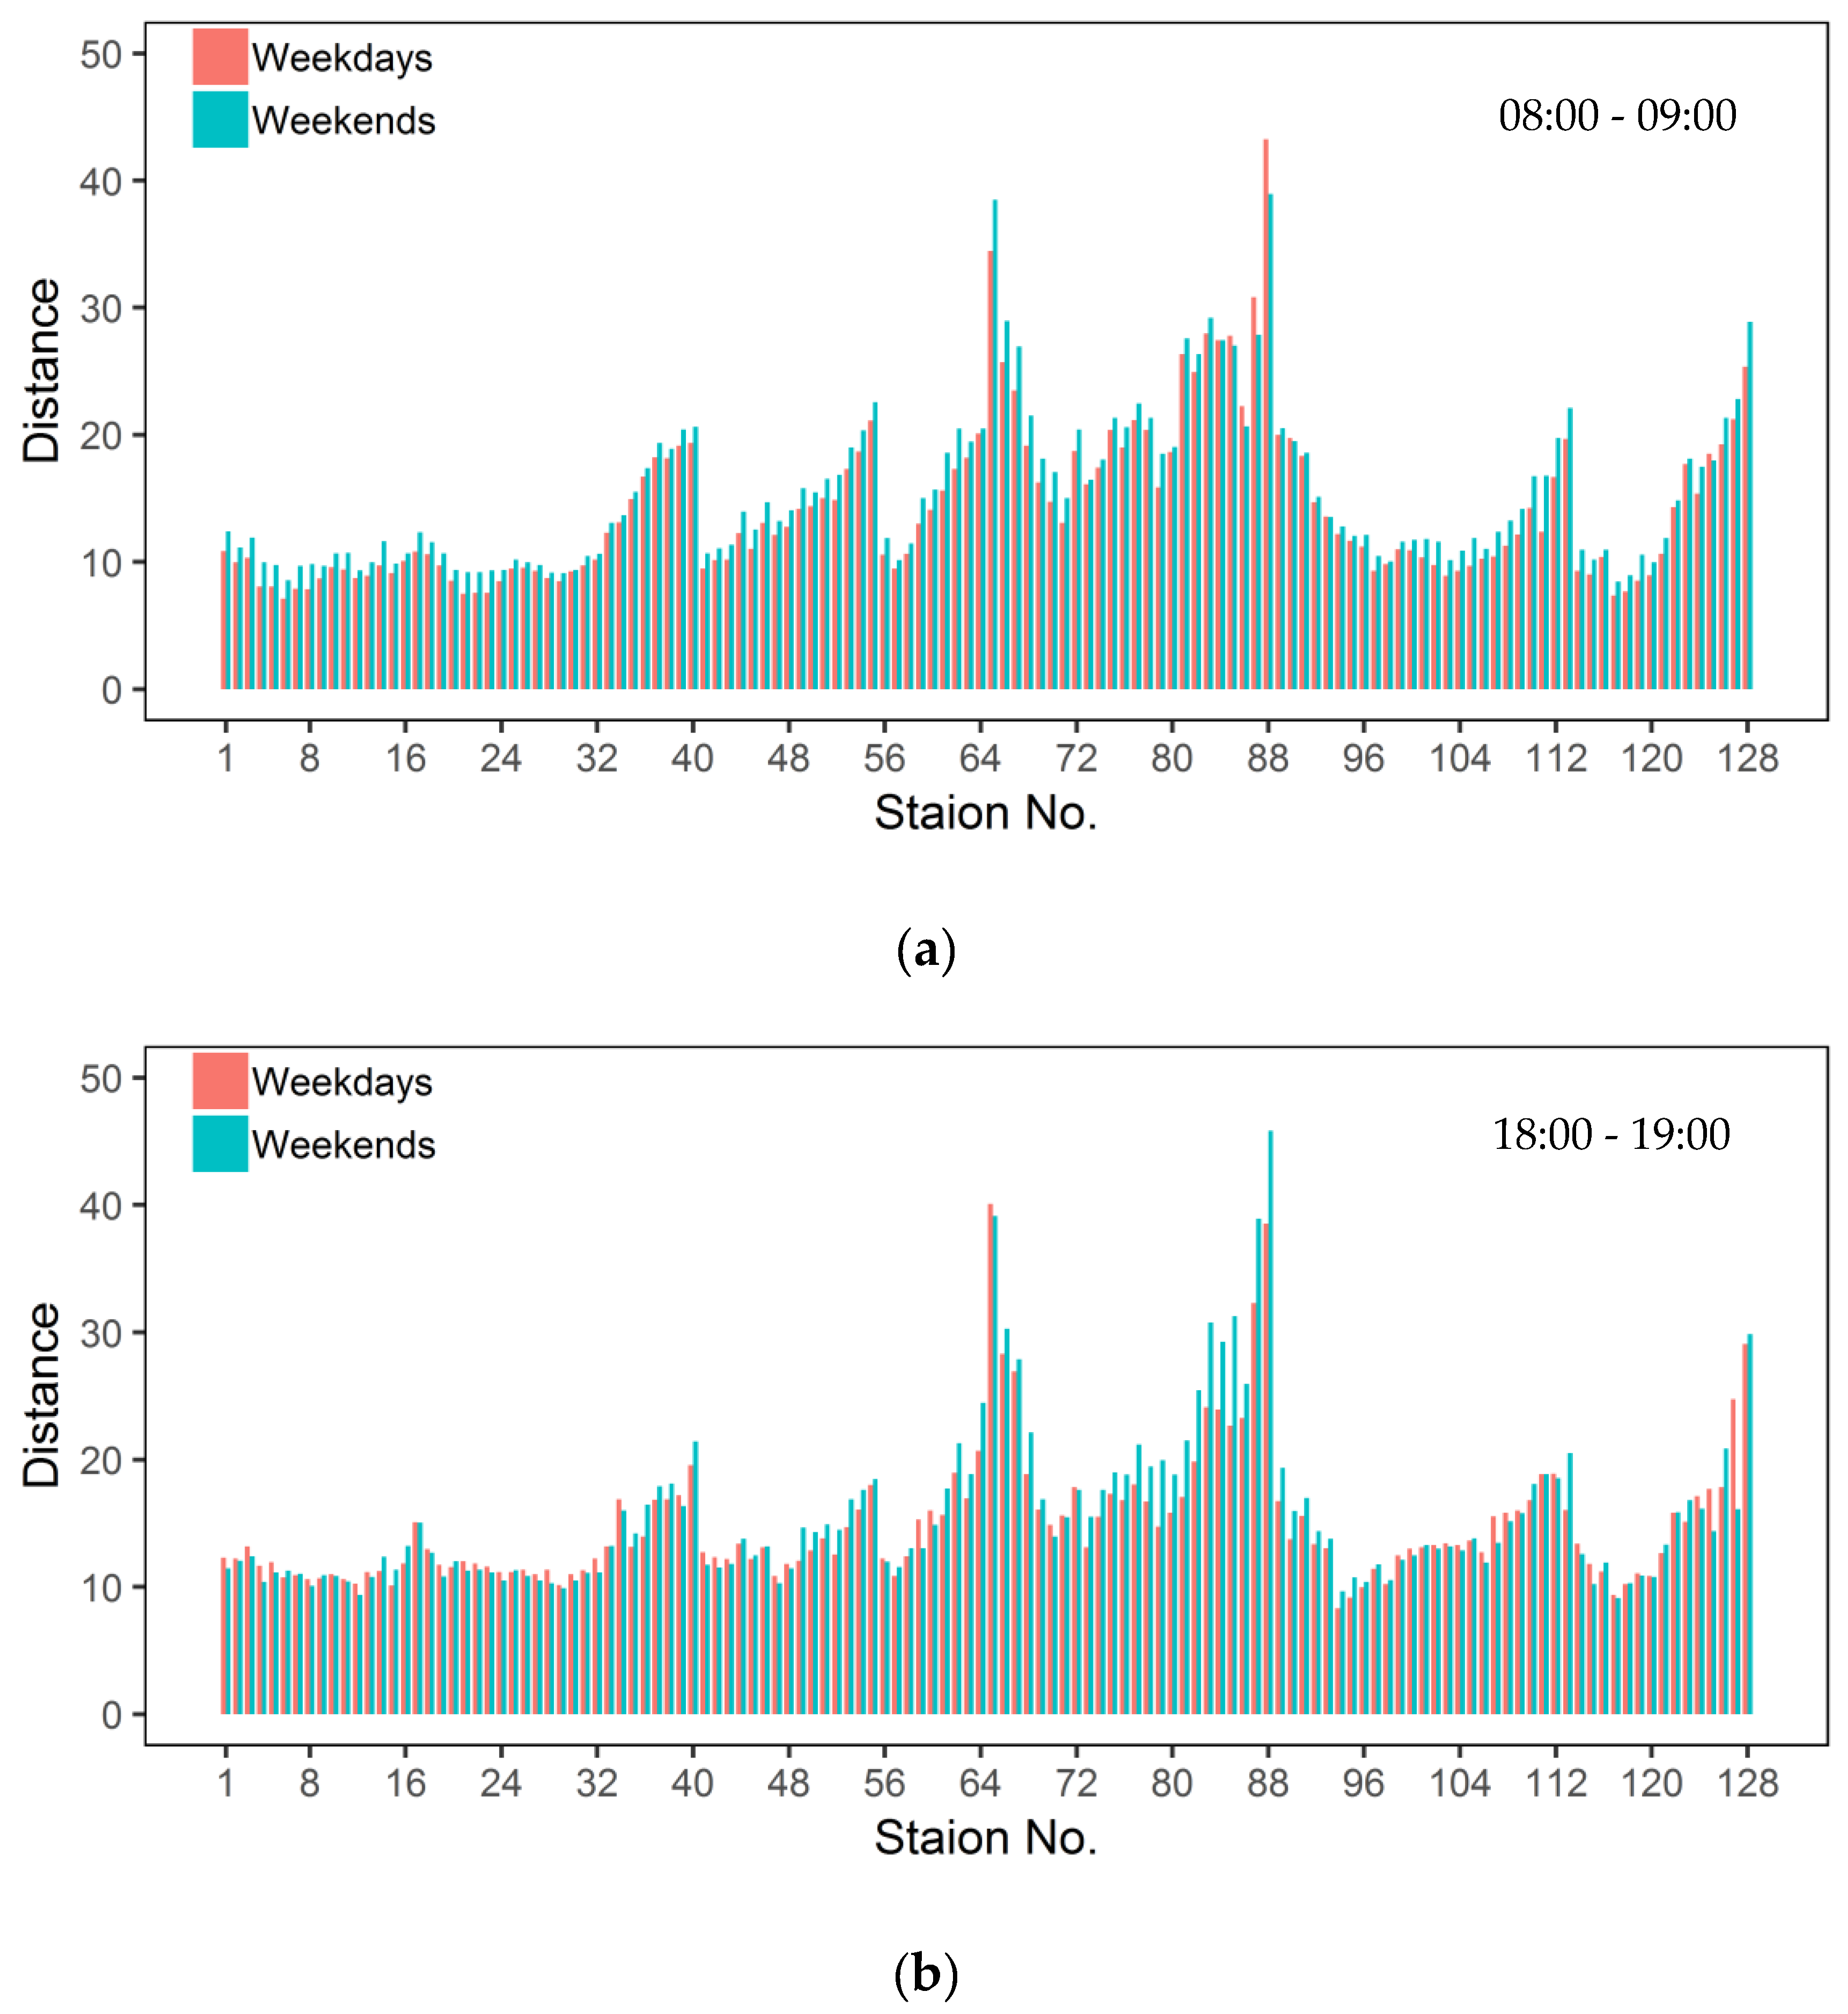
3.3. Variability of Station-Based Travel Distance
3.4. Dimensions of the Built Environment
4. Methodology
4.1. Geographically and Temporally Weighted Regression
4.2. Spatial and Temporal Autocorrelation Test
4.3. Shannon Entropy Index
5. Results
5.1. Model Calibrations
5.2. Comparative Analysis of Different Models
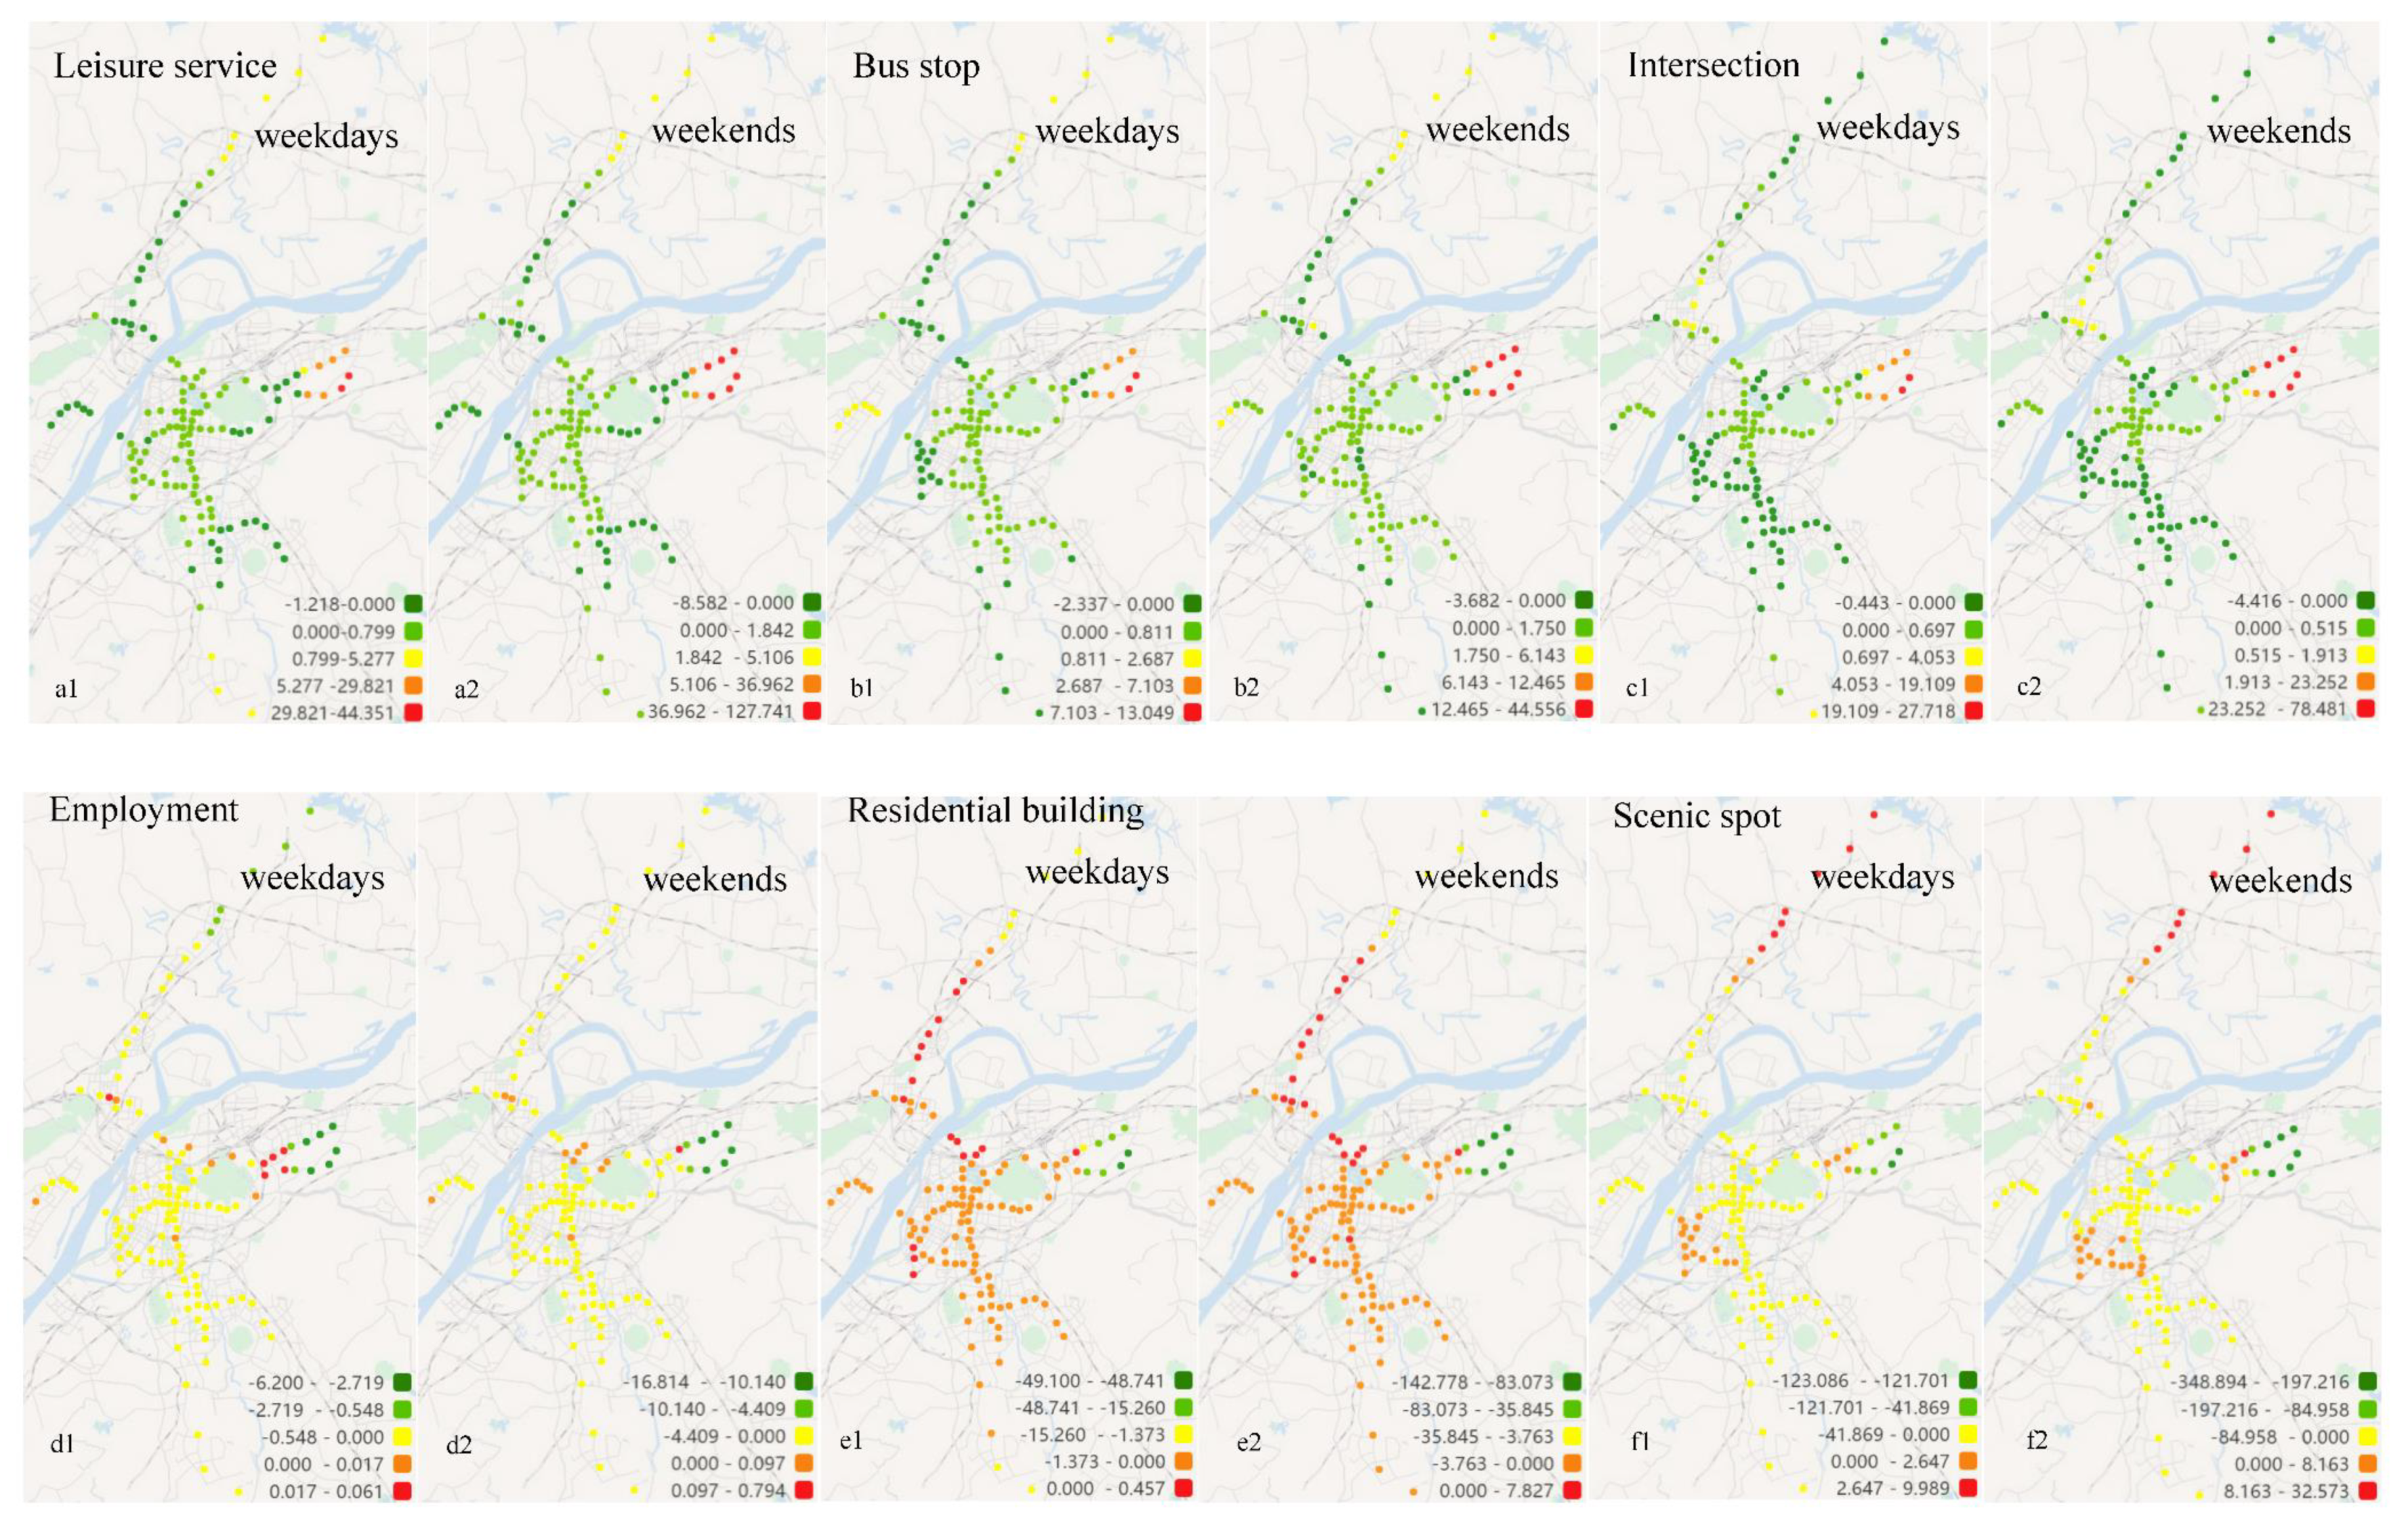
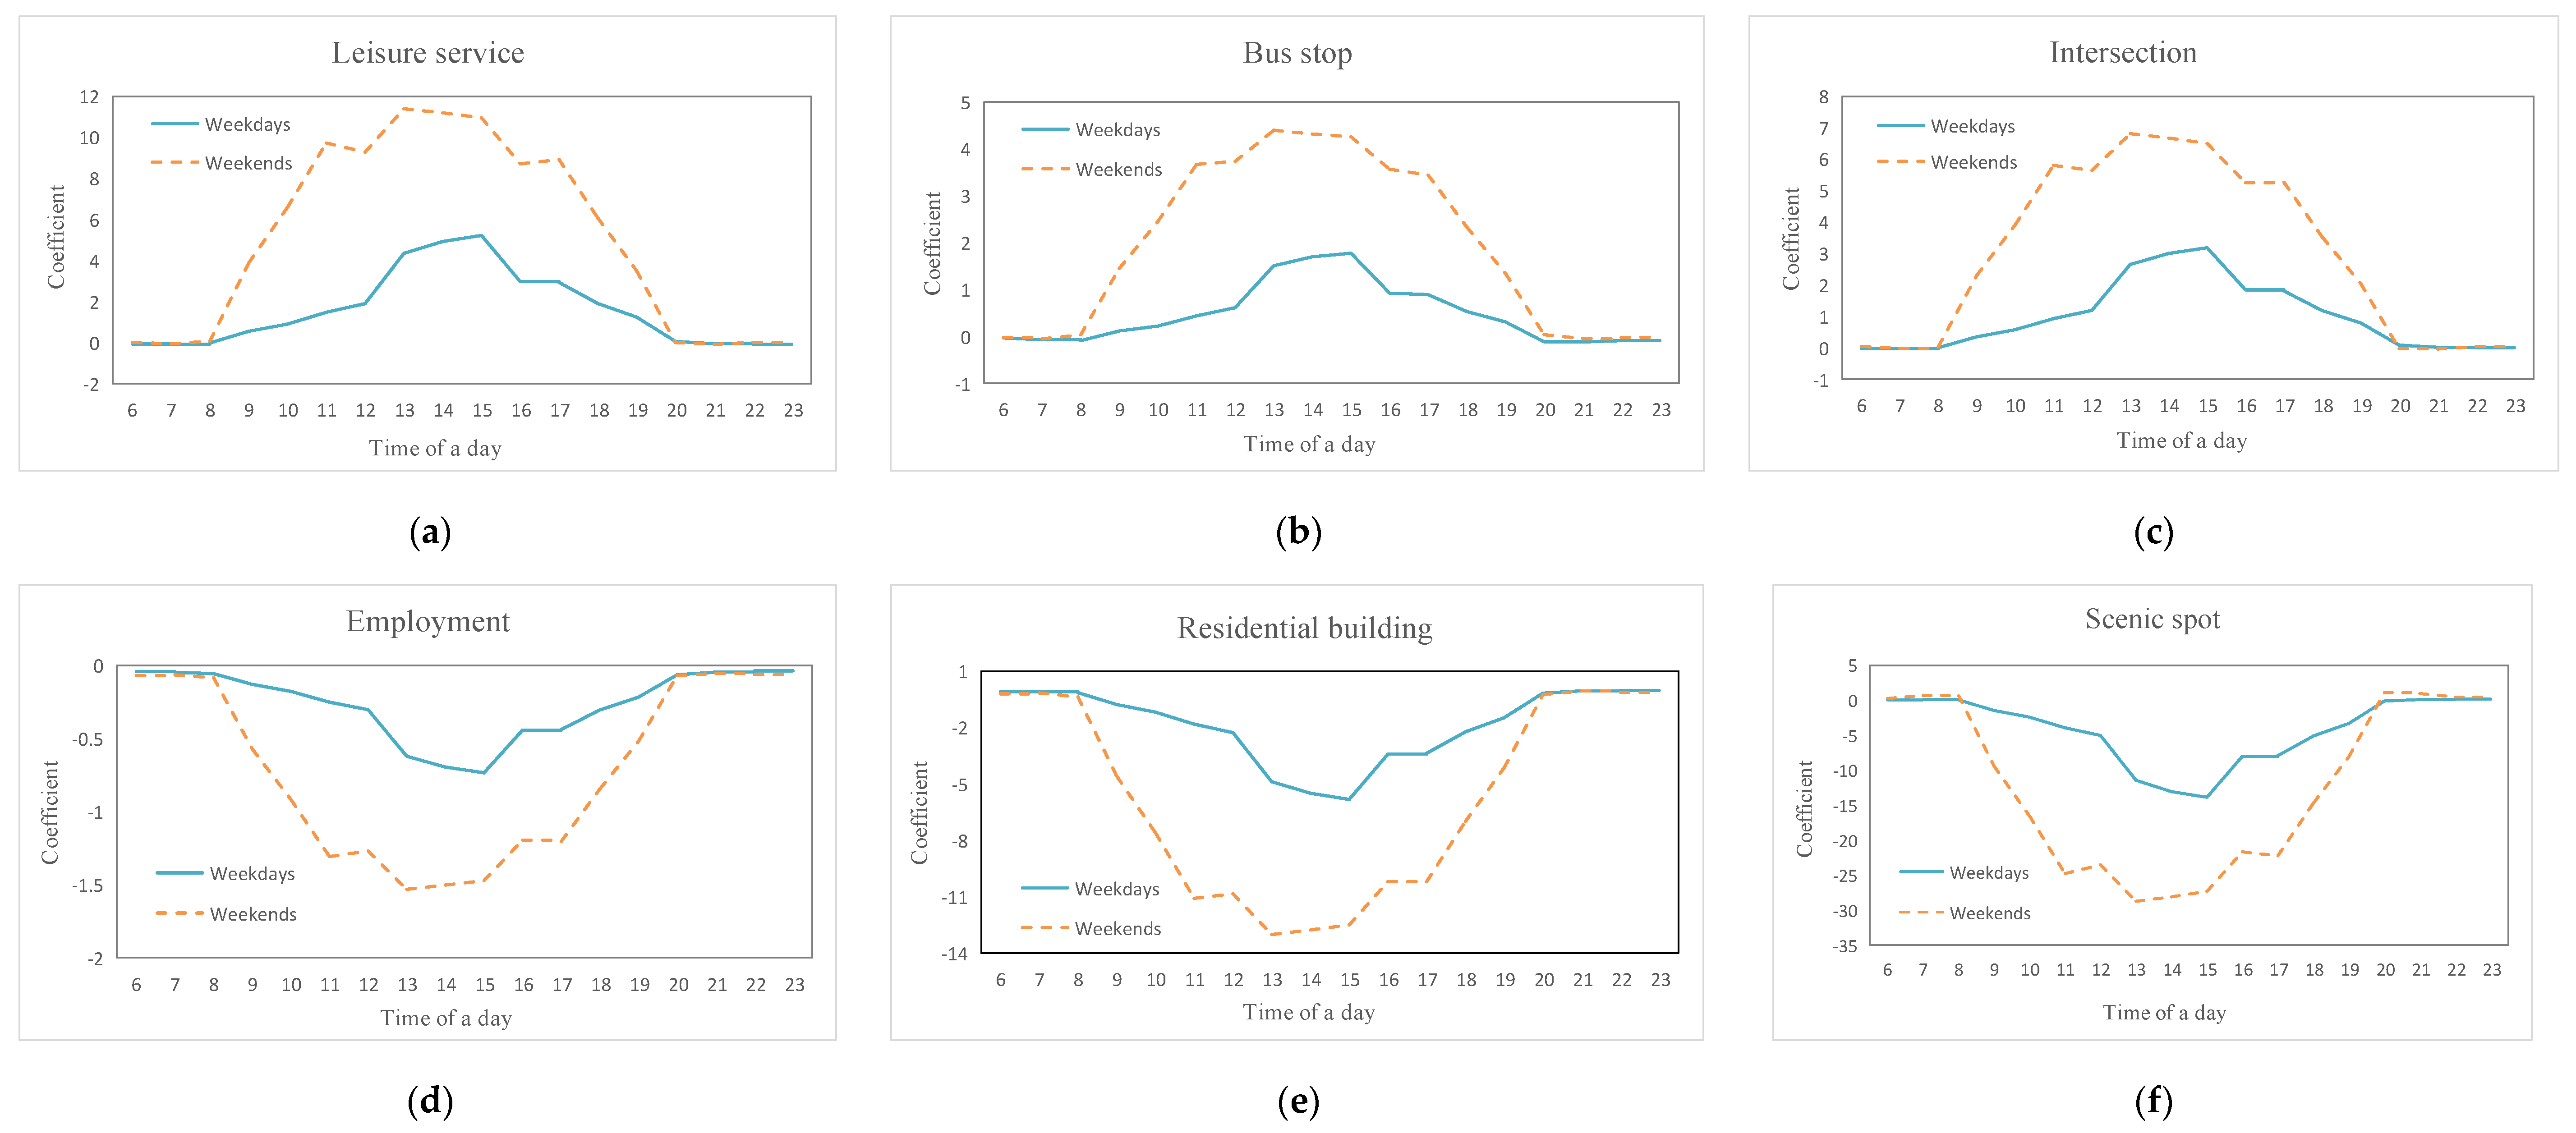
5.3. GTWR Estimates
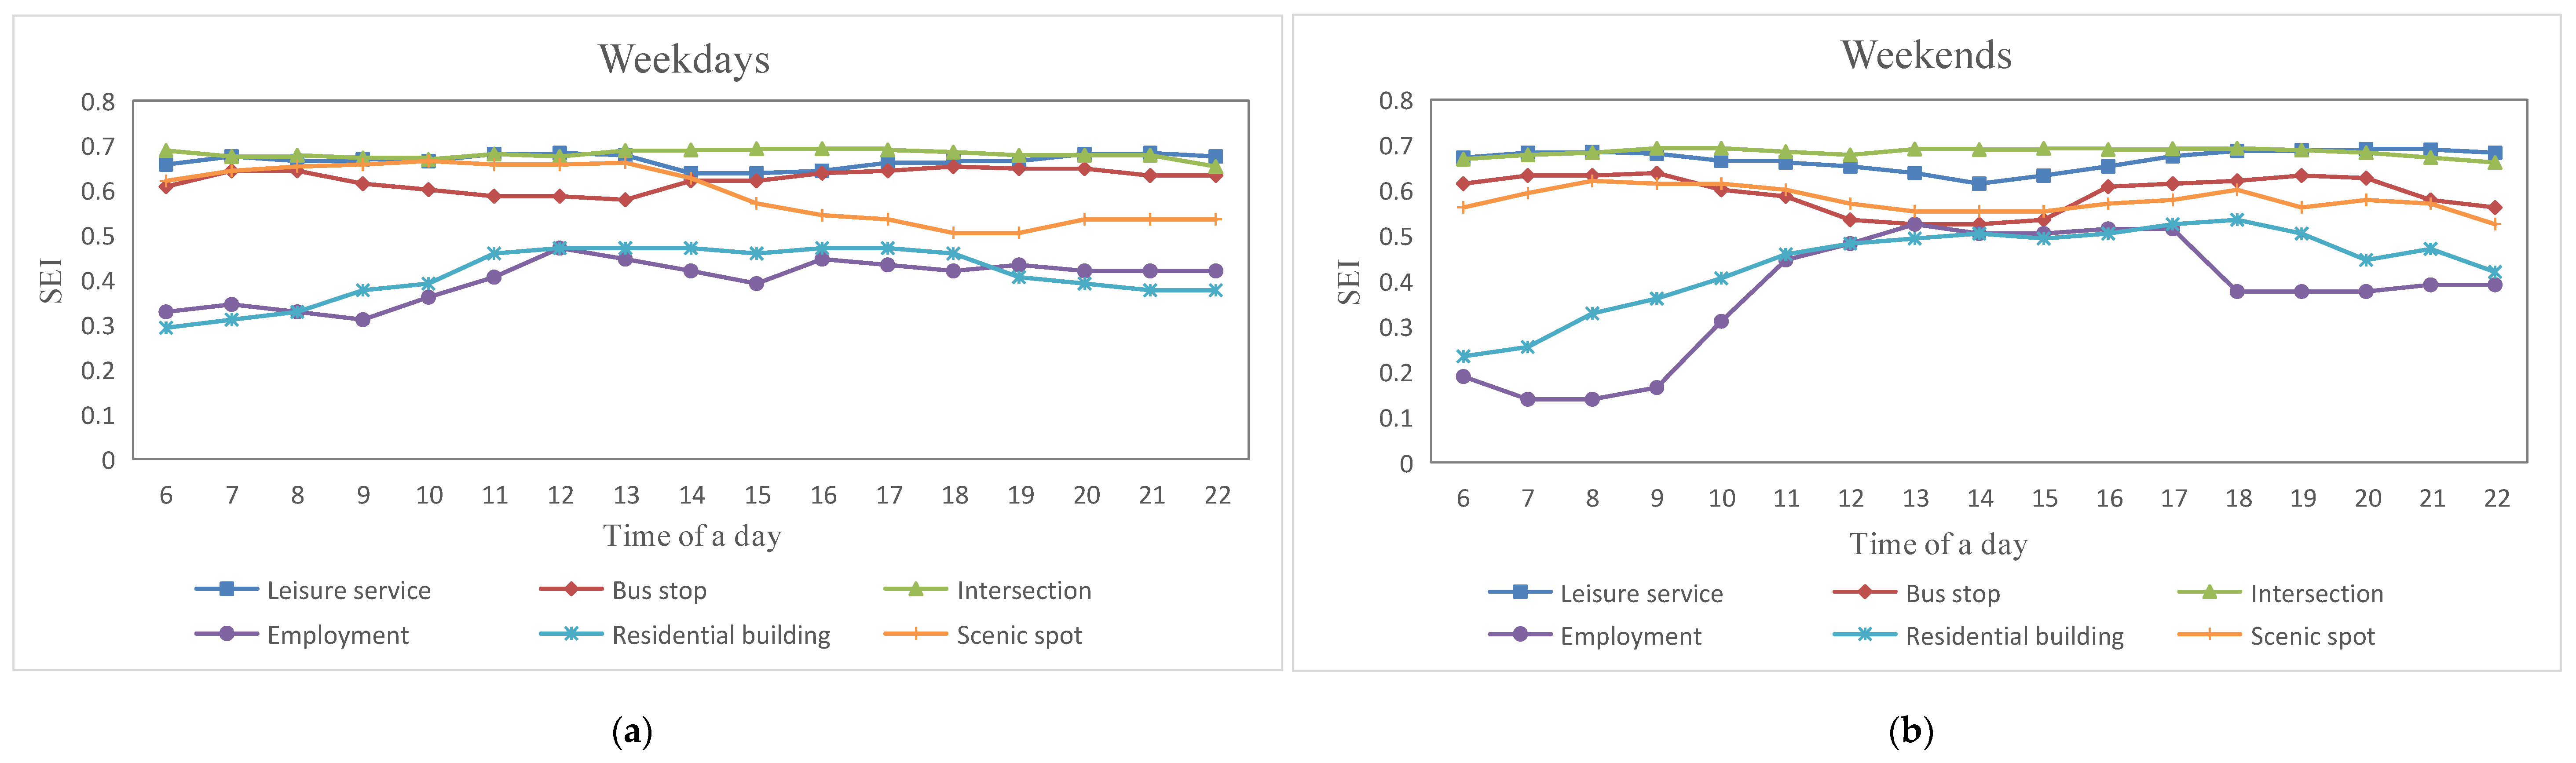
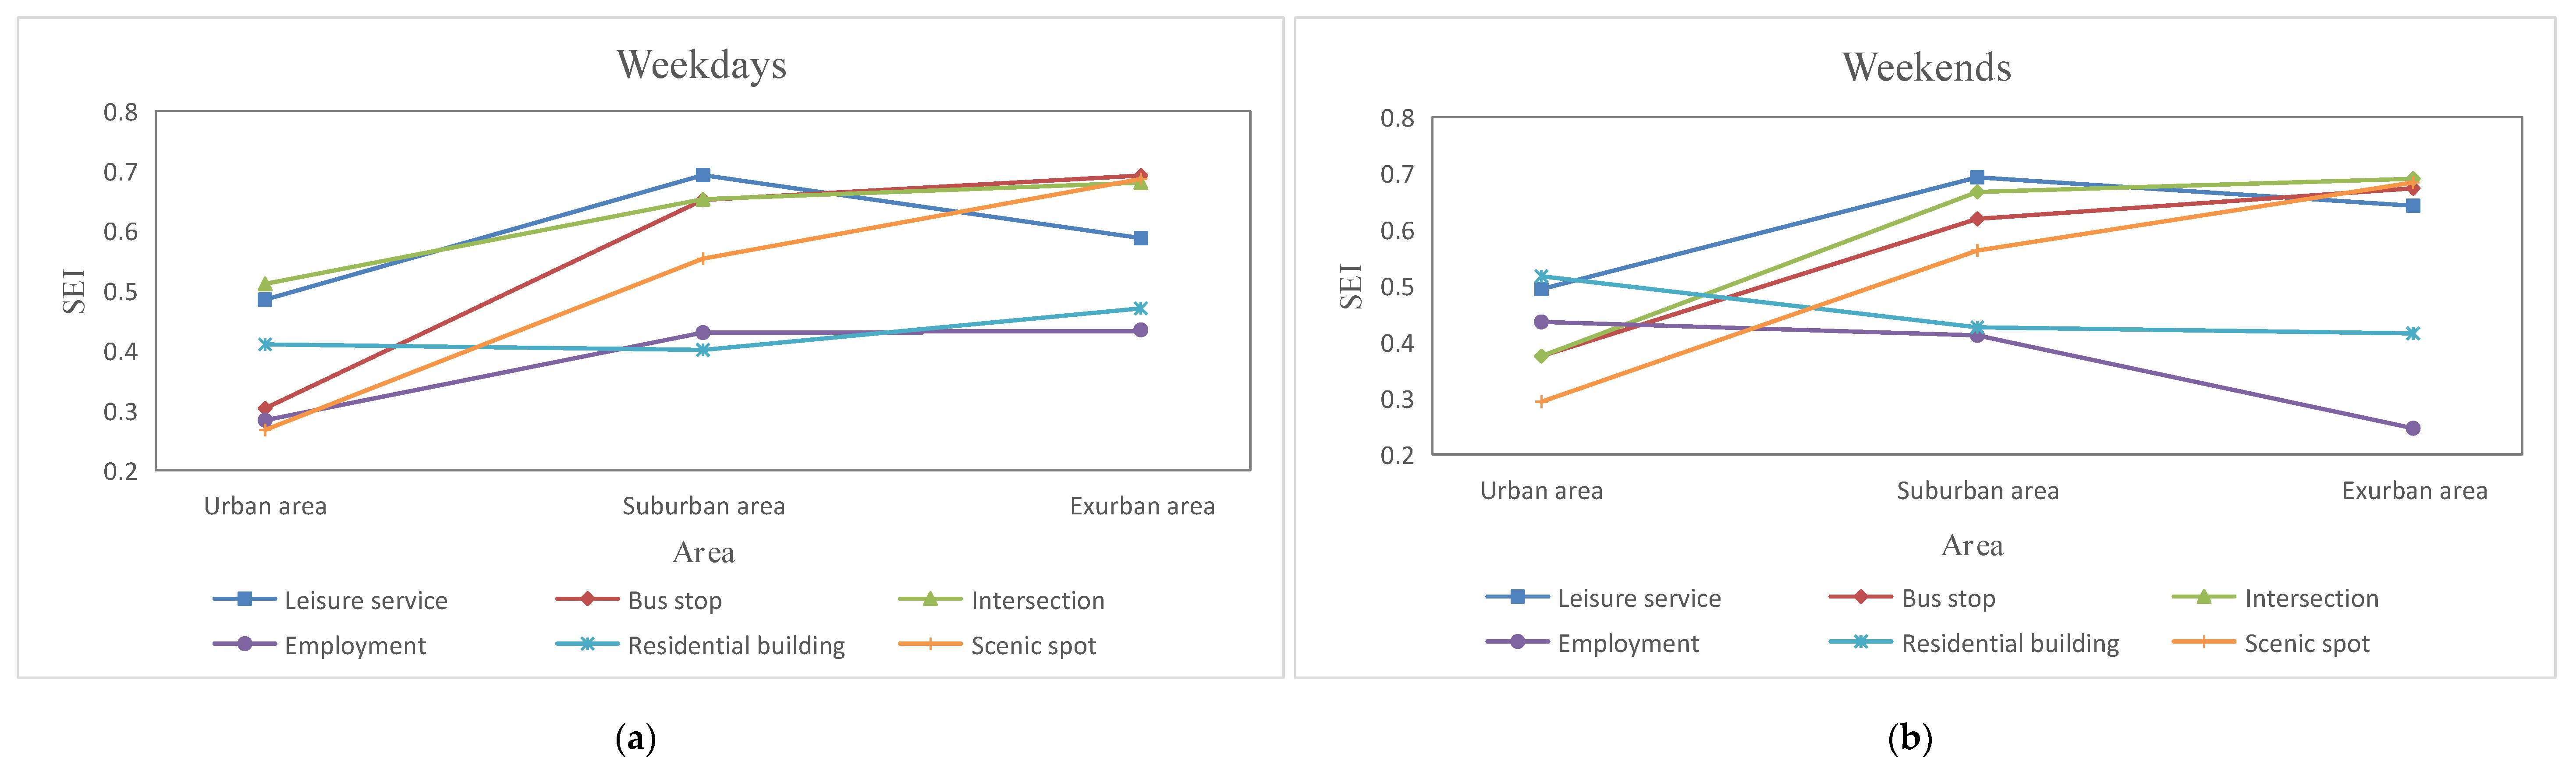
5.4. Spatial and Temporal Heterogeneity
6. Conclusions
Author Contributions
Funding
Acknowledgments
Conflicts of Interest
References
- Beijing Municipal Transportation Commission. Transportation Statistics. Available online: http://www.jtw.beijing.gov.cn (accessed on 20 March 2019).
- Nanjing Transportation Bureau. Transportation Statistics. Available online: http://www.jtj.nanjing.gov.cn (accessed on 20 March 2019).
- Shanghai Municipal Transportation Commission. Transportation Statistics. Available online: http://www.jt.sh.cn/jtw/index.html (accessed on 20 March 2019).
- Cao, X. Examining the effect of the Hiawatha LRT on auto use in the Twin Cities. Transp. Policy 2018, 81, 284–292. [Google Scholar] [CrossRef]
- Huang, X.; Cao, X.; Yin, J.; Cao, X. Effects of metro transit on the ownership of mobility instruments in Xi’an, China. Transp. Res. Part D Transp. Environ. 2017, 52, 495–505. [Google Scholar] [CrossRef]
- Cervero, R.; Murakami, J. Effects of built environments on vehicle miles traveled: Evidence from 370 US urbanized areas. Environ. Plan. A 2010, 42, 400–418. [Google Scholar] [CrossRef]
- Choi, K. The influence of the built environment on household vehicle travel by the urban typology in Calgary, Canada. Cities 2018, 75, 101–110. [Google Scholar] [CrossRef]
- Diao, M.I.; Ferreira, J., Jr. Vehicle miles traveled and the built environment: Evidence from vehicle safety inspection data. Environ. Plan. A 2014, 46, 2991–3009. [Google Scholar] [CrossRef]
- Ding, C.; Mishra, S.; Lu, G.; Yang, J.; Liu, C. Influences of built environment characteristics and individual factors on commuting distance: A multilevel mixture hazard modeling approach. Transp. Res. Part D Transp. Environ. 2017, 51, 314–325. [Google Scholar] [CrossRef]
- Manaugh, K.; Miranda-Moreno, L.F.; El-Geneidy, A.M. The effect of neighbourhood characteristics, accessibility, home–work location, and demographics on commuting distances. Transportation 2010, 37, 627–646. [Google Scholar] [CrossRef]
- Singh, A.C.; Astroza, S.; Garikapati, V.M.; Pendyala, R.M.; Bhat, C.R.; Mokhtarian, P.L. Quantifying the relative contribution of factors to household vehicle miles of travel. Transp. Res. Part D Transp. Environ. 2018, 63, 23–36. [Google Scholar] [CrossRef]
- Ding, C.; Wang, D.; Liu, C.; Zhang, Y.; Yang, J. Exploring the influence of built environment on travel mode choice considering the mediating effects of car ownership and travel distance. Transp. Res. Part A Policy Pract. 2017, 100, 65–80. [Google Scholar] [CrossRef]
- Van Acker, V.; Witlox, F. Car ownership as a mediating variable in car travel behaviour research using a structural equation modelling approach to identify its dual relationship. J. Transp. Geogr. 2010, 18, 65–74. [Google Scholar] [CrossRef]
- Anastasopoulos, P.C.; Bin Islam, M.; Perperidou, D.; Karlaftis, M.G. Hazard-Based Analysis Travel Distance in Urban Environments: Longitudinal Data Approach. J. Urban Plan. Dev. 2012, 138, 53–61. [Google Scholar] [CrossRef]
- Holz-Rau, C.; Scheiner, J.; Sicks, K. Travel distances in daily travel and long-distance travel: What role is played by urban form? Environ. Plan. A 2014, 46, 488–507. [Google Scholar] [CrossRef]
- Hong, J.; Shen, Q.; Zhang, L. How do built-environment factors affect travel behavior? A spatial analysis at different geographic scales. Transportation 2014, 41, 419–440. [Google Scholar] [CrossRef]
- Wu, W.; Hong, J. Does public transit improvement affect commuting behavior in Beijing, China? A spatial multilevel approach. Transp. Res. Part D Transp. Environ. 2017, 52, 471–479. [Google Scholar] [CrossRef]
- Sun, B.; Ermagun, A.; Dan, B. Built environmental impacts on commuting mode choice and distance: Evidence from Shanghai. Transp. Res. Part D Transp. Environ. 2017, 52, 441–453. [Google Scholar] [CrossRef]
- Pelletier, M.P.; Trépanier, M.; Morency, C. Smart card data use in public transit: A literature review. Transp. Res. Part C Emerg. Technol. 2011, 19, 557–568. [Google Scholar] [CrossRef]
- Gong, Y.; Lin, Y.; Duan, Z. Exploring the spatiotemporal structure dynamic urban space using metro smart card records. Comput. Environ. Urban Syst. 2017, 64, 169–183. [Google Scholar] [CrossRef]
- Loo, B.P.; Chen, C.; Chan, E.T. Rail-based transit-oriented development: Lessons from New York City and Hong Kong. Landsc. Urban Plan. 2010, 97, 202–212. [Google Scholar] [CrossRef]
- Tao, S.; Rohde, D.; Corcoran, J. Examining the spatial–temporal dynamics of bus passenger travel behaviour using smart card data and the flow-comap. J. Transp. Geogr. 2014, 41, 21–36. [Google Scholar] [CrossRef]
- Zhong, C.; Manley, E.; Arisona, S.M.; Batty, M.; Schmitt, G. Measuring variability of mobility patterns from multiday smart-card data. J. Comput. Sci. 2015, 9, 125–130. [Google Scholar] [CrossRef]
- Helminen, V.; Ristimaki, M. Relationships between commuting distance, frequency and telework in Finland. J. Transp. Geogr. 2007, 15, 331–342. [Google Scholar] [CrossRef]
- Chen, F.; Wu, J.; Chen, X.; Wang, J. Vehicle kilometers traveled reduction impacts of transit-oriented development: Evidence from Shanghai city. Transp. Res. Part D Transp. Environ. 2017, 55, 227–245. [Google Scholar] [CrossRef]
- Wang, D.; Zhou, M. The built environment and travel behavior in urban China: A literature review. Transp. Res. Part D Transp. Environ. 2017, 52, 574–585. [Google Scholar] [CrossRef]
- Ding, C.; Liu, C.; Zhang, Y.; Yang, J.; Wang, Y. Investigating the impacts of built environment on vehicle miles traveled and energy consumption: Differences between commuting and non-commuting trips. Cities 2017, 68, 25–36. [Google Scholar] [CrossRef]
- Maat, K.; Timmermans, H.J.P. A causal model relating urban form with daily travel distance through activity/travel decisions. Transp. Plan. Technol. 2009, 32, 115–134. [Google Scholar] [CrossRef]
- Klinger, T.; Lanzendorf, M. Moving between mobility cultures: What affects the travel behavior of new residents? Transportation 2016, 43, 243–271. [Google Scholar] [CrossRef]
- Ma, X.; Liu, C.; Wen, H.; Wang, Y.; Wu, Y.J. Understanding commuting patterns using transit smart card data. J. Transp. Geogr. 2017, 58, 135–145. [Google Scholar] [CrossRef]
- General Office of the People’s Government of Nanjing. Nanjing “13th Five-Year” Public Transport Development Planning; General Office of the People’s Government of Nanjing: Nanjing, China, 2017.
- Yang, M.; Wu, J.; Rasouli, S.; Cirillo, C.; Li, D. Exploring the impact of residential relocation on modal shift in commute trips: Evidence from a quasi-longitudinal analysis. Transp. Policy 2017, 59, 142–152. [Google Scholar] [CrossRef]
- Yang, S.; Fan, Y.; Deng, W.; Cheng, L. Do built environment effects on travel behavior differ between household members? A case study of Nanjing, China. Transp. Policy. 2019, 81, 360–370. [Google Scholar] [CrossRef]
- Baidu Open Platform. Available online: http://lbsyun.baidu.com/ (accessed on 20 November 2017).
- Yang, Y.; Wang, C.; Liu, W.; Zhou, P. Understanding the determinants of travel mode choice of residents and its carbon mitigation potential. Energy Policy 2018, 115, 486–493. [Google Scholar] [CrossRef]
- Bao, J.; Xu, C.; Liu, P.; Wang, W. Exploring Bikesharing Travel Patterns and Trip Purposes Using Smart Card Data and Online Point of Interests. Netw. Spat. Econ. 2017, 17, 1231–1253. [Google Scholar] [CrossRef]
- Wang, Y.; Correia, G.H.d.A.; de Romph, E.; Timmermans, H.J.P. Using metro smart card data to model location choice of after-work activities: An application to Shanghai. J. Transp. Geogr. 2017, 63, 40–47. [Google Scholar] [CrossRef]
- Jappinen, S.; Toivonen, T.; Salonen, M. Modeling the potential effect of shared bicycles on public transport travel times in Greater Helsinki: An open data approach. Appl. Geogr. 2013, 43, 13–24. [Google Scholar] [CrossRef]
- Gaode Open Platform. Available online: http://lbs.amap.com (accessed on 12 September 2017).
- Lee, S.; Yi, C.; Hong, S.P. Urban structural hierarchy and the relationship between the ridership of the Seoul Metropolitan Subway and the land-use pattern of the station areas. Cities 2013, 35, 69–77. [Google Scholar] [CrossRef]
- Pan, H.; Li, J.; Shen, Q.; Shi, C. What determines rail transit passenger volume? Implications for transit oriented development planning. Transp. Res. Part D Transp. Environ. 2017, 57, 52–63. [Google Scholar] [CrossRef]
- Jun, M.; Choi, K.; Jeong, J.; Kwon, K.; Kim, H. Land use characteristics of subway catchment areas and their influence on subway ridership in Seoul. J. Transp. Geogr. 2015, 48, 30–40. [Google Scholar] [CrossRef]
- Zhao, J.; Deng, W.; Song, Y.; Zhu, Y. What influences Metro station ridership in China? Insights from Nanjing. Cities 2013, 35, 114–124. [Google Scholar] [CrossRef]
- Bekhor, S.; Cohen, Y.; Solomon, C. Evaluating long-distance travel patterns in Israel by tracking cellular phone positions. J. Adv. Transp. 2013, 47, 435–446. [Google Scholar] [CrossRef]
- Huang, B.; Wu, B.; Barry, M. Geographically and temporally weighted regression for modeling spatio-temporal variation in house prices. Int. J. Geogr. Inf. Sci. 2010, 24, 383–401. [Google Scholar] [CrossRef]
- Abdulhafedh, A. How to Detect and Remove Temporal Autocorrelation in Vehicular Crash Data. J. Transp. Technol. 2017, 7, 133–147. [Google Scholar] [CrossRef]
- Hilbe, J. Modeling Count Data; Cambridge University Press: Cambridge, UK, 2017. [Google Scholar]
- Palan, N. Measurement of Specialization the Choice of Indices; Research Centre International Economics (FIW): Vienna, Austria, 2010. [Google Scholar]
- Ta, N.; Chai, Y.; Zhang, Y.; Sun, D. Understanding job-housing relationship and commuting pattern in Chinese cities: Past, present and future. Transp. Res. Part D Transp. Environ. 2017, 52, 562–573. [Google Scholar] [CrossRef]
- Nasri, A.; Zhang, L. The analysis of transit-oriented development (TOD) in Washington, DC and Baltimore metropolitan areas. Transp. Policy 2014, 32, 172–179. [Google Scholar] [CrossRef]


| Category | Variable | Description | Min | Max | Mean | S.D. | Moran’s I | Expected Value | p |
|---|---|---|---|---|---|---|---|---|---|
| Travel distance | DIS_WD | Travel distance from the metro station on weekdays (km) | 0 | 43.426 | 15.242 | 5.865 | 0.207 | −0.00046 | 0.000 |
| DIS_WK | Travel distance from the metro station on weekends (km) | 0 | 46.327 | 15.740 | 6.164 | 0.217 | −0.00046 | 0.000 | |
| Land use | Catering service | Number of Chinese, foreign restaurants, etc. | 0 | 840 | 121 | 167 | 0.150 | −0.00046 | 0.000 |
| Shopping service | Number of supermarkets, stores, appliance stores, etc. | 0 | 888 | 161 | 228 | 0.136 | −0.00046 | 0.000 | |
| Leisure service | Number of entertainment venues, gymnasiums, etc. | 0 | 186 | 17 | 27 | 0.160 | −0.00046 | 0.000 | |
| Medical service | Number of hospitals, clinics, pharmacies, etc. | 0 | 44 | 5 | 7 | 0.174 | −0.00046 | 0.000 | |
| Accommodation service | Number of hotels and guest houses | 0 | 187 | 19 | 31 | 0.109 | −0.00046 | 0.000 | |
| Employment | Number of government agencies, corporations, etc. | 0 | 974 | 110 | 182 | 0.213 | −0.00046 | 0.000 | |
| Scenic spot | Number of parks, plazas, tourist attractions, etc. | 0 | 20 | 3 | 6 | 0.259 | −0.00046 | 0.000 | |
| Residential building | Number of residential buildings | 0 | 22 | 6 | 6 | 0.156 | −0.00046 | 0.000 | |
| Education area | Number of schools, universities, etc. | 0 | 80 | 6 | 10 | 0.084 | −0.00046 | 0.000 | |
| CBD station | Station in the CBD (1 = yes, 0 = no) | 0 | 1 | N/A | N/A | 0.054 | −0.00046 | 0.000 | |
| Transport facility | Public parking lot | Number of parking lots | 0 | 120 | 27 | 24 | 0.235 | −0.00046 | 0.000 |
| Public bicycle station | Number of docked public bicycle stations | 0 | 10 | 2 | 2 | 0.104 | −0.00046 | 0.000 | |
| Bus stop | Number of bus stops | 0 | 10 | 4 | 2 | 0.070 | −0.00046 | 0.000 | |
| Bus line | Number of bus lines | 0 | 78 | 24 | 17 | 0.102 | −0.00046 | 0.000 | |
| Urban road | Number of roads | 0 | 20 | 5 | 5 | 0.222 | −0.00046 | 0.000 | |
| Urban intersection | Number of intersections | 0 | 57 | 13 | 12 | 0.194 | −0.00046 | 0.000 | |
| Transfer station | Transfer station (1 = yes, 0 = no) | 0 | 1 | N/A | N/A | -0.005 | −0.00046 | 0.000 | |
| Terminal station | Terminal station (1 = yes, 0 = no) | 0 | 1 | N/A | N/A | -0.004 | −0.00046 | 0.000 |
| Scenario | Goodness-of-Fit | OLS | GWR | GTWR |
|---|---|---|---|---|
| Weekdays | R2 | 0.378 | 0.874 | 0.894 |
| AICc | 12867.41 | 9637.35 | 9399.63 | |
| RSS | 46528.97 | 9430.47 | 7920.91 | |
| Weekends | R2 | 0.378 | 0.865 | 0.889 |
| AICc | 13084.41 | 9979.75 | 9747.19 | |
| RSS | 51361.15 | 11169.70 | 9202.34 |
| Variable | DIS_WD | DIS_WK | |||||||
|---|---|---|---|---|---|---|---|---|---|
| Min | Mean | Max | Significance | Min | Mean | Max | Significance | ||
| (Constant) | −30.996 | 14.898 | 32.955 | 0.000 ** | −56.485 | 14.015 | 44.886 | 0.000 ** | |
| Catering service | |||||||||
| Shopping service | −13.486 | 0.845 | 1.518 | 0.006 * | −18.612 | 1.488 | 4.836 | 0.004 * | |
| Leisure service | −5.922 | 1.654 | 161.564 | 0.005 * | −29.474 | 5.305 | 216.444 | 0.004 * | |
| Medical service | |||||||||
| Accommodation service | −6.241 | 0.069 | 10.200 | 0.005 * | |||||
| Employment | −21.640 | −0.271 | 0.296 | 0.002 * | −28.164 | −0.749 | 3.483 | 0.002 * | |
| Scenic spot | −425.749 | −4.398 | 12.171 | 0.005 * | −591.881 | −12.982 | 85.866 | 0.005 * | |
| Residential building | −174.579 | −1.957 | 6.043 | 0.003 * | −240.097 | −6.181 | 28.199 | 0.004 * | |
| Education area | −4.116 | −0.028 | 3.459 | 0.006 * | −10.053 | 0.073 | 8.132 | 0.004 * | |
| CBD station | −52.147 | 11.625 | 1486.557 | 0.142 | −296.008 | 35.604 | 2190.444 | 0.142 | |
| Public parking lot | −3.235 | 0.083 | 2.072 | 0.007 * | −2.968 | 0.022 | 1.877 | 0.007 * | |
| Public bicycle station | |||||||||
| Bus stop | −6.051 | 0.503 | 54.410 | 0.003 * | −10.739 | 2.055 | 76.644 | 0.004 * | |
| Bus line | |||||||||
| Urban road | −5.341 | 0.048 | 7.729 | 0.006 * | −8.312 | 0.689 | 17.946 | 0.008 * | |
| Urban intersection | −2.491 | 1.035 | 97.418 | 0.005 * | −16.863 | 3.164 | 132.275 | 0.003 * | |
| Transfer station | −17.295 | 0.898 | 240.860 | 0.130 | −113.909 | 5.704 | 284.608 | 0.131 | |
| Terminal station | −261.987 | −0.028 | 29.934 | 0.083 | −356.690 | −7.095 | 52.647 | 0.082 | |
| Goodness-of-fit | R2 | 0.894 | 0.889 | ||||||
| AICc | 9399.63 | 9747.19 | |||||||
© 2019 by the authors. Licensee MDPI, Basel, Switzerland. This article is an open access article distributed under the terms and conditions of the Creative Commons Attribution (CC BY) license (http://creativecommons.org/licenses/by/4.0/).
Share and Cite
Chen, E.; Ye, Z.; Bi, H. Incorporating Smart Card Data in Spatio-Temporal Analysis of Metro Travel Distances. Sustainability 2019, 11, 7069. https://doi.org/10.3390/su11247069
Chen E, Ye Z, Bi H. Incorporating Smart Card Data in Spatio-Temporal Analysis of Metro Travel Distances. Sustainability. 2019; 11(24):7069. https://doi.org/10.3390/su11247069
Chicago/Turabian StyleChen, Enhui, Zhirui Ye, and Hui Bi. 2019. "Incorporating Smart Card Data in Spatio-Temporal Analysis of Metro Travel Distances" Sustainability 11, no. 24: 7069. https://doi.org/10.3390/su11247069
APA StyleChen, E., Ye, Z., & Bi, H. (2019). Incorporating Smart Card Data in Spatio-Temporal Analysis of Metro Travel Distances. Sustainability, 11(24), 7069. https://doi.org/10.3390/su11247069