Abstract
Global warming will affect the heating and cooling energy demands of houses. Thus, it is necessary to measure this impact in different areas of a country to influence future public policies, guidelines, and regulations. This paper proposes to forecast the energy demand for five house archetypes located in eight cities in Chile. These archetypes are thermally insulated according to current regulatory standards given by the country. They were simulated using the simplified hourly model from the international standards ISO 13790, considering climatic conditions between 1990 and 2010 and projected climatic conditions between 2045 and 2054. Three climatology models: a) Model for Interdisciplinary Research on Climate (MIROC-ESM), b) Institut Pierre Simon Laplace Climate System Model 5 (IPSL-CM5A), and c) Community Climate System Model (CCSM4) in the context of two representative concentration pathways: 4.5 and 8.5 W/m2 are used to forecast future climate. The most significant results show that energy demand for heating could decrease by 35% on average while cooling energy demand could significantly increase for cities such as Antofagasta and Santiago.
1. Introduction
In recent decades, there has been increasing concern about climate change as a potential danger to the ecosystem and human beings. The scientific community has already registered and validated the consequences. In the last ten years, the ice caps in Greenland have lost 215 million tons annually, and, since 1979, the ice surface on the Arctic Ocean has decreased by 3.5%–4.1% [1] per decade. The year 2015 was the hottest in history, and the average temperature was 0.75 °C (33.35 °F) above the average from 1961 to 1990, being the highest temperature since 1850. The phenomenon of human-caused climate change has triggered approximately 25% of the drought in Chile in the past years [2].
Experts state that if these trends continue, the average air temperature from 2030 to 2052 will be 1.5 °C (34.7 °F) higher. The consequences could be irreversible for the environment and human beings if the temperature does not stabilize at a total increase of less than 2 °C (35.6 °F) by 2100 [1]. As a result of this situation, the first global climate agreement was executed in Paris in December 2015 and later ratified in New York in April 2016 [3]. In this context, the signatory countries commit to reduce their greenhouse gas (GHG) emissions to keep the temperature below 2 °C above pre-industrial levels (1880–1899). For that purpose, the member states have established the goal of reducing CO2 emissions up to 50% by 2050 and 100% by 2100 [1]. The Intergovernmental Panel on Climate Change (IPCC) used four Representative Concentration Pathways (RCPs) of GHGs for its short-term projections in the Assessment Report 5 [4]. These models are RCP2.6, RCP4.5, RCP6.0, and RCP8.5, which represent a radiative forcing from GHGs of 2.6, 4.5, 6.0, and 8.5 W/m2 in 2100, respectively. RCP8.5 is the most severe scenario, and it considers an increasing GHG concentration throughout the 21st century, while RCP2.6 is the most favorable scenario, and it considers a global peak of GHG emissions before 2020 [5].
Chile committed to reducing up to 30% of its GHG emissions by 2030, in comparison to 2007, as it is a signatory country of Paris. Besides, Chile undertakes to “ensure universal and equal access to modern, reliable, and affordable energy services to the entire population,” including the concept of “energy poverty” in its energy policy, named “Energy 2050”. Indeed, it is still a challenge in Chile to ensure sufficient access energy to reach thermal comfort for every household [6].
Climate change affects energy directly as well as through the thermal performance of buildings [7]. Studies have shown that the energy need for heating will decrease through the years, while the energy need for cooling will increase due to global warming [8]. Consequently, the impact of climate change on the energy needs of housings across the country should be studied.
In the last decades, around the world, experts have developed studies to analyze the climate impact on buildings. In Switzerland, Frank [9] researched the potential climate impact on heating and cooling energy consumption in residential and office buildings. For 2050–2100, four climatic scenarios were considered. In Zurich, the cooling energy consumption will increase by up to 223% in 2050 and 1050% in 2100, while the energy need for heating energy will decrease by up to 36% in 2050 and 58% in 2100. Possible mitigation measures include solar shading and night ventilation.
In Sweden, Dodoo et al. [10] researched the effects of global warming over the energy performance in residential buildings. They analyzed two types of residential buildings: a conventional construction and a passive one. The energy consumption for heating of the conventional building will decrease by 13% and 16% in 2050 and 2100, respectively, while the consumption for cooling will increase by 33% and 42%, respectively. The energy consumption for heating in the passive building will decrease by 17% and 22% in 2050 and 2100, respectively, while the consumption for cooling will increase by 39% and 49%, respectively.
Pilli-Sihvola et al. [11] analyzed the performance of residential and business buildings in five European countries: Finland, Germany, The Netherlands, France, and Spain. The main conclusion was that Northern and Central Europe would have reduced energy consumption due to global warming, while the energy needs for space cooling may increase in South Europe and exceed the needs for space heating.
Some studies have shown that the use of adaptation measures is essential to reduce energy needs in buildings to diminish the impact of climate change on them. Nik et al. [12] evaluated the energy-saving potential of nine energy readjustment measures and four combinations of these, for various residential buildings in Sweden. The combination of better thermal isolation on the building and energy-efficient windows was the best, and it could contribute to relevant energy savings.
Today, in Chile, the General Ordinance of Urbanism and Buildings sets mandatory thermal regulations for the thermal performance of new housing. The thermal regulation for new houses came into effect in two successive stages. The first stage stated the requirements for roofing complexes in 2000. The second stage stated the requirements for exterior walls, ventilated floors, and the percentage of glazing areas in 2007. However, it does not consider the standards for any overheating risk or the development of the standards given the changes in weather conditions, a clear result of climate change.
In this context, this proposal aims to diagnose the potential impact of climate change on the energy performance of Chilean houses and to guide regulatory energy policies that could lead to both standard adaptations and the incorporation of new standards to incentivize the reduction of energy need for heating and cooling in houses.
This paper contributes to an issue that has not been analyzed in Chile before. In addition, given the geography of the country, it is possible to study a wide variety of climates and thus deliver information in a country that is strongly affected by climate change [13]. This study estimated the possible future effects of climate change in energy need for heating and cooling in houses for various areas of the country to guide new future public policies regarding their thermal performances. A simple hourly method of calculation from the international standard ISO 13790:2008 [14] that Chile adopted as the national standard NCh3502:2017 has been used to evaluate the energy needs for heating and cooling. This model estimates energy needs for space heating and cooling using simple input data and acceptable accuracy. Kokogiannakis, Strachan, and Clarke [15] compared energy needs for cooling and heating simulated using the simple hourly method of the ISO 13,790 and building performance simulation (BPS) programs, such as ESP-r and EnergyPlus. From this, the conclusion was that, despite not focusing on the intermittent heating, the simplified models of the ISO 13,790 give consistent results with those of the BPS programs in terms of heating. Moreover, Millet [16] compared the results of the simplified method simulation in a base case with the results of various BPS-like programs like Clima2000m, TRNSYS, and ESP-r. The author concludes that the method presents the same precision level orders as these dynamic calculation programs, in both cooling and heating.
2. Method
The method divides itself into three main stages, namely: (i) evaluation and modification of climate data; (ii) defining the archetypes that represent the Chilean houses; and (iii) evaluation of energy needs for space heating and cooling currently and in future scenarios.
2.1. Evaluation and Modification of Climate Data
The climate characteristics in Chile vary considerably throughout an extensive length of 4329 km (2690 mi.). Nine climate zones divide Chile’s territory, and they change depending on the local latitude, the presence of the Andes and the Coastal Range, the Humboldt Current, the South Pacific High, and the Polar Front. Thus, based on the already mentioned variables, the north is deprived of rain. The central zone has more moderate climate conditions, with mild weather. The central south presents cold, rainy weather. The southern zone has intensely cold weather, which the great ice masses in the highest mountains.
Eight cities are selected to evaluate the effects of climate change in housing, from north to south: Calama, Antofagasta, Vallenar, Valparaíso, Santiago, Concepción, Temuco, and Punta Arenas. These cities are in eight different climate zones. Chile has nine climatic zones, but the Andean zone has been excluded in the analysis because of its low representation.
The temperature and precipitation estimations for 2045–2054 were possible using three climatology modeling: a) Model for Interdisciplinary Research on Climate [17] (MIROC-ESM), b) Institut Pierre Simon Laplace Climate System Model 5 [18] (IPSL-CM5A), and c) Community Climate System Model [19] (CCSM4). These models are calibrated with records from 1985 to 2015 and two RCP scenarios: RCP4.5 and RCP8.5. RCP4.5 scenario assumes that all countries implement mitigation policies with a peak of GHG emission around 2040, whereas RCP8.5 considering a non-climate policy and high population with a constant increase of GHG emissions [5]. Since a peak of CO2 emissions before 2020 (RCP2.6) seems an unlikely case, RCP4.5 and RCP8.5 appear to delimit the interval of projections.
The models present a monthly estimation of the average temperature and precipitations, which are processed by Meteonrorm V7.1 [20] software to obtain the hourly data needed for the hourly simulation. Figure 1 shows the many variations of the average projections for 2045–2054 and the data from 1991 to 2010. The majority of scenarios present a reduction in rainfall down to −92% of the historical registers for the IPSL-RCP4.5 scenarios in Calama. However, Punta Arenas (Figure 1), in every scenario, presents a precipitation increase, as well as the highest temperature increase, probably because of the models predicting a more significant presence in the frontal system of the area.
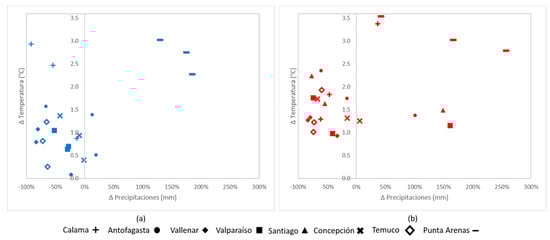
Figure 1.
Temperature variations vs. rainfall variations between present weather and the forecasts of the scenarios a) RCP 4.5, and b) RCP 8.5.
Meteonorm® V7 [17] (Meteotest, Bern, Switzerland) generates and exports the needed hourly climate data for the simple hourly method such as outside temperature, global and diffuse radiation, and the soil temperature. For this, general circulation models (GCM) will obtain the main variables like temperature, wind speed, and rainfall in the RCP 4.5 and 8.5 scenarios with valid estimations for 2050. Downscaling will process these variables, which can adjust and correct biases and inaccuracies, and take them to an appropriate, temporary level. Developed linear functions, with historical data for the climate zones, will obtain secondary variables, like relative humidity.
The calculation of the outside temperature’s weighted average, defined in Equation (1) and the EN 15,251 [21], determines the start and termination date of the presented heating period, considering that the below-average outside temperature of 15 °C (59 °F), where a heating system is necessary to maintain a comfortable indoor environment according to this standard.
where Trm is the running mean outdoor temperature and Ted-i (i vary from for 1 to 7), are the daily mean of outdoor temperature from the previous seven days.
Unlike heating, there is not a precise method to define the cooling period. Consequently, it is defined as the cooling period for the rest of the year to avoid heating and cooling needs simultaneously.
2.2. Defining the Archetypes that Represent the Chilean Residential Construction
A single-family house archetype representing each city is selected based on the data brought by the FONDEF D10I1025 project [22] (Figure 2). In this project, various architectural projects supplied by construction companies were studied to select real dwelling architecture that reflects typologies offered on the market across Chile [23].
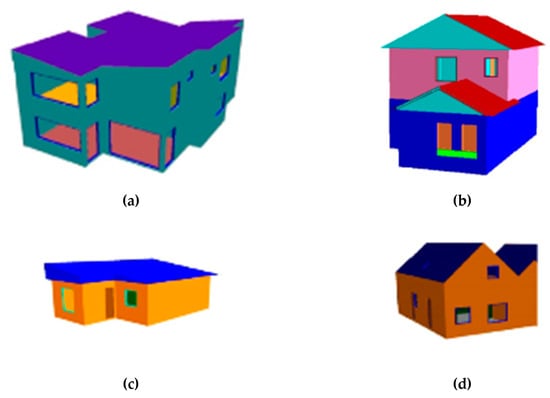
Figure 2.
Three-dimensional (3D) archetype representation: (a) VH2A; (b) VAL2A and VALM2A; (c) VM1A; and (d) VM2P.
Figure 2 shows the three-dimensional (3D) archetype representation used in this study, namely: a) VH2A, a two-story detached house made of concrete, b) VAL2A, a two-story detached house made of masonry, and VALM2A, a two-story detached house made of masonry (1st floor) and wooden frame (2nd floor), c) VM1A, a one-story detached house made of wooden frame, and d) VM2P, a two-story semi-detached house made of wooden frame. The building models assigned by city represent 35% of residential archetypes of Chile, not including reinforced concrete height buildings which correspond to 29% of the residential buildings [22].
Table 1 defines the thermal transmittance in the walls and roofs, based on the current building code of Chile, which establishes the minimum transmittance through thermal zones [23]. The transmittance values for floors and windows are not regulated, which means the default values are 1.5 W/m2K, and 3.6 W/m2K, respectively.

Table 1.
Residential archetypes [22] and thermal transmittance of building elements [24].
Lastly, Table 2 summarizes the main characteristics of the five selected residential archetypes. Wood is the main building material in the south of Chile, mostly because of its availability in these regions. However, this building system registers high air leakage, whereas these regions are colder than center and north regions. Furthermore, most of these houses are two-story houses with a form factor that varies between 1.1 and 1.24, except for Temuco, where most of the homes are single-story [23].
Table 2.
Summary of the characteristics of the representative archetypes of single-family homes in Chile [22].
2.3. Evaluation of Energy Needs for Space Heating and Cooling, Currently and in Future Scenarios
The simplified hourly basis model stated in the ISO13790 [14], which Michalak [26] detailed its calculation process, was used to estimate energy needs for heating and cooling in houses in present weather and the projection 2045–2054. This simplified thermal balance model 5R1C (see Figure 3) allows the calculation of energy need for space heating and cooling hourly in three steps: 1) no heating (or cooling); 2) working on a 10% of the nominal power; 3) power proportional to the temperature jump compared to the resulting interior air temperature with the defined thermostat. The heating thermostat sets on 20 °C (68 °F) from 6:00 to 22:00, and 17 °C (62.6 °F) at night during the heating period, while the cooling thermostat sets on an adjustment temperature of 25 °C (77 °F) from 6:00 to 22:00, and 27 °C (80.6 °F) at night, during the cooling period.
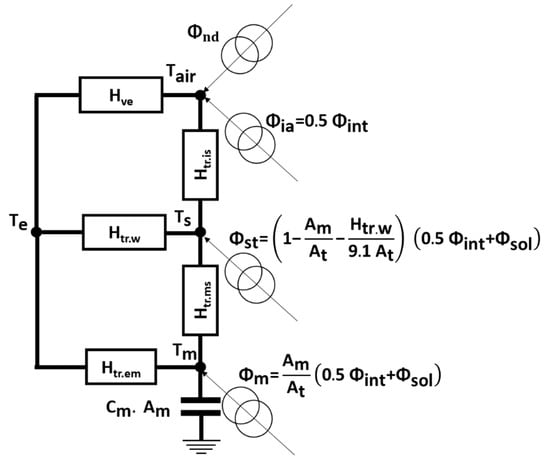
Figure 3.
Energy balance diagram of the calculation method ISO 13,790 Source: Prepared by authors based on ISO 13,790.
In a similar form to BPS software, simplified hourly calculation method estimates space heating and cooling needs (Φnd) through the energy balance between the solar gain (Φsol) and internal gain (Φint) and the heat transfer via ventilation (Hve), the transmission through windows (Htr,w), and opaque surfaces (Htr,ms and Htr,em). The thermal inertia of opaque surfaces depends on internal heat capacity (Cm) and effective mass surface (Am).
Concerning the remote sun blocking, a hypothesis considered that every residence surrounds others of the same height in all four cardinal directions at a distance of 10 meters (32 ft).
3. Results and Discussion
The previous hypotheses simulated the selected houses in each city, under the current climate conditions, and the six climate change estimations averaged for 2045–2054. According to the presented values in Figure 4, the heating period between actual and 2050 conditions reduces by 54 days on average, and in the IPSL8.5 scenario in Vallenar, 180 days maximum. The RCP8.5 scenario of the MIROC model shows that the heating period disappears in Antofagasta.
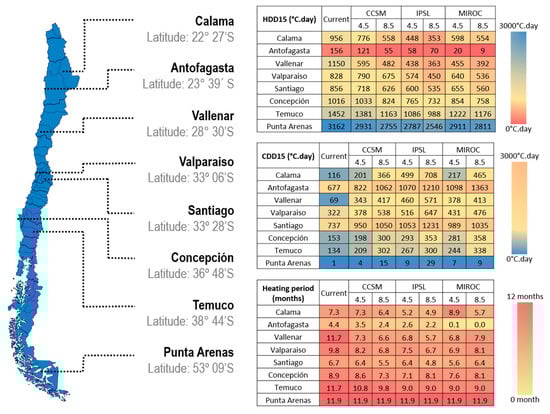
Figure 4.
Heating degree days, cooling degree days, and heating period length for the eight cities.
Figure 4 shows the length of heating periods and cooling as well as heating degree days (base 15 °C) for different scenarios. Heating and cooling degree days base 15 °C (HDD15 and CDD15) are respectively calculated as the sum of positive and negative values of the differences between daily average temperatures and the base temperature [27]. Degree days have been historically used as a simple method to estimate heating and cooling needs in buildings [28,29,30]. While the CCD15 increases by 213 °C.day (+282%), the HDD15 reduces by 313 °C. day (−34%) on average of all cases. Vallenar presents the highest reduction in HDD15, −696 °C.day on average, and Antofagasta presents the highest increase in CCD15, 427 °C.day, on average concerning the current situation. In terms of reduction of the heating degree-days, this color scale shows that, in general, the most sensitive scenarios towards climate change are the two IPSL model scenarios. Although there is a CDD15 variation in all scenarios, no model shows more or less sensitive than others.
Regarding the current estimation of energy needs, while the general tendency is that energy need for heating goes up from north to south (Figure 5), there are three exceptions: Antofagasta and Santiago, which consume less energy than Calama and Valparaiso respectively, and Temuco, which consumes more energy than Punta Arenas. The HDD15 explains the differences in Santiago and Antofagasta scenarios. For example, Calama’s HDD15 is 956 °C.day, while in Antofagasta, it is 156 °C.day. Concerning Temuco, which has a less cold climate than Punta Arenas, according to the HDD15 shown in Figure 4, the house typology is the main discrepancy factor since the residential archetype in Temuco is a one-story house, and Punta Arenas’s archetype is a semi-detached two-story house with a small area of the thermal envelope.
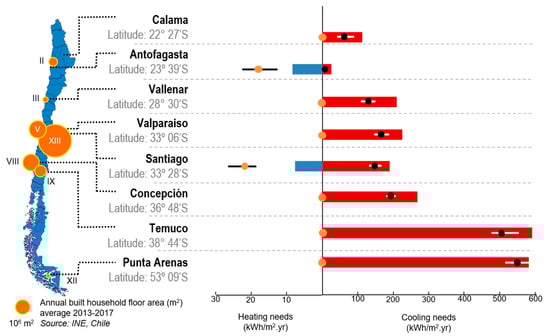
Figure 5.
Current heating energy needs for space heating (red bars) and cooling (blue bars), and 2050 estimated average energy need for heating (black dots) and cooling (orange dots). The min/max lines (black and white lines) represent the 2050 estimated scenarios.
Figure 5 shows the results of the current estimation of energy needs for heating and cooling, as well as average calculations, minimum and maximum of estimations for 2045–2054. Considering the 2045–2054 estimations, the energy need for heating decreases for all cities, as expected from an average of 35%, proportional to the HDD15 decrease. However, Figure 5 shows that the initial energy needs for heating exceed 200 kWh/m2/yr from Vallenar to Punta Arenas. Thus, despite this reduction, the 2045–2054 estimated energy needs are still high and surpass the 85 kWh/m2/yr (HVAC, DHW, and lighting) goal set by the Production Development Corporation’s (CORFO) Construye 2025 program, for a more sustainable built heritage [31].
Frank [9] estimated that heating needs for a multifamily building with low thermal insulation located in Zurich, Switzerland could fall from 420 MJ/m2/yr (117 kWh/m2/yr) to 280 MJ/m2/yr (78 kWh/m2/yr) in 2050, which represents a reduction of 33% of the initial needs. On the other hand, the author evaluated that the heating period for the same building would fall by 52 days. The architectural and construction characteristics of the houses are different from the present study, as well as the current and projected climatic conditions. However, the presented results agree since it was estimated that the heating needs are reduced by 35%, and the heating period was reduced by 54 days on average by 2050.
As for energy needs for space cooling, Antofagasta and Santiago are the only cities that currently present a critical energy need of 8.51 and 7.51 kWh/m2/yr, respectively. The 2045 and 2054 energy need for space cooling estimations in these two cities show an increase of 153% average, reaching an average of estimated energy need of 18.4 kWh/m2/yr for Antofagasta and 22 kWh/m2/yr. This increase might seem minor compared to the energy need for heating, but the Metropolitan Region (XIII Region), with 5,070,407 m2 of newly built homes every year (2013–2017 average), represents 57% of these housing in the country [32] Thus, this represents a potential increase in the installing of air conditioning systems in houses. Air conditioning systems harm the mitigation of climate change because of energy consumption and the use of refrigerants, which are greenhouse gases. If there are no purging procedures for air conditioning systems, the refrigerants evaporate into the atmosphere when uninstalled. For example, the R410a coolant, which is commonly used in split systems, has a global warming potential 2088 times higher than carbon dioxide [33].
In the next years, Chile will implement a new thermal regulation (NMT 11) still under discussion. It will increase the house standards in terms of thermal insulation and air leakage requirements to reduce energy needs for heating. Chile must keep the regulatory efforts to decrease the energy need for heating since it is quite high. Moreover, it is necessary to consider the risks of overheating in houses during the summer and the potential energy need for cooling. Figure 6 and Figure 7 show psychrometric charts of the most critical estimations in Santiago and Antofagasta, which are IPSL-8.5 and MIROC 8.5, respectively. These diagrams are generated in Climate Consultant 6.0 [34] (University of California, Los Angeles, California, USA), using climate data generated in Meteonorm.
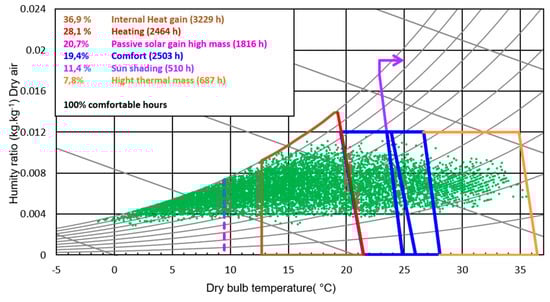
Figure 6.
Psychrometric chart IPSL RCP 8, five of Santiago and various architectonic solutions based on the comfort model ASHRAE 2005 [36] using Climate Consultant 6.0.

Figure 7.
Psychrometric chart MIROC RCP 8, five of Antofagasta and various passive architectonic solutions based on the comfort model ASHRAE 2005 [36] using Climate Consultant 6.0.
Psychrometric charts depict the humidity ratio as a function of the dry bulb temperature of the outdoor atmosphere. The top left panel suggests to the user a set of passive and active solutions such as thermal mass, natural and forced ventilation, or passive solar gain. The zone of action of design strategies initially is displayed in the chart. These design strategies and their associated zones of action were initially defined by Givoni [35] and adapted by Climate Consultant 6.0, according to the comfort model ASHRAE 2005 [36]. It is important to note that for temperature above 20 °C, zones of action consider that spaces are shaded. Selecting the button “Show best strategies,” the software selects the minimum set of solutions with the maximum hours of comforts. Selected strategies are presented in the panel, and the zone of action of selected strategies is depicted in the graph. Hours covered by the selected strategies are green whereas hours out of the range are red.
Figure 6 and Figure 7 show that both scenarios cover almost all hours of possible overheating with passive solutions. In Santiago, these solutions are mostly the use of thermal inertia associated with night ventilation to release the heat accumulated during the day and glazing external shading (Figure 6). In Antofagasta, experts propose the use of thermal inertia (Figure 7), but natural ventilation and fan-forced ventilation have a similar effect. In this case, Palme et al. showed the potential for natural ventilation to maintain a comfortable indoor environment [37]. However, humidity is the main problem to reach a comfortable environment in summer because dehumidification of 4.6% is needed according to Figure 7.
4. Conclusions
Climate change is now a reality, and various societies will have to face it. The housing built today will remain during all 21st century, and their users will have to handle all possible overheats inside their houses. Thus, it is vital to think about the impact of climate change on energy needs for space heating and cooling in houses built with the current regulations. Future public policies should enhance architectonic designs, adapted to climate change and mitigate climate change, avoiding the use of air conditioning in houses.
The simulation included five residential archetypes, which represented Chile’s various big cities, from Calama, in Atacama’s Desert, to Punta Arenas, the harbor of the Chilean Patagonia. The results of the current conditions show that the energy need for heating is very high, except for Antofagasta. While the 2045–2054 estimations reduced the energy need for heating to 35% average, it is necessary to keep increasing the requirements that started with the two-staged thermal regulation in the years 2000 and 2007, and the next NMT 11 regulation. The reduction of energy consumption is another essential factor for climate change mitigation.
Lastly, the estimated increase of the energy need for space cooling in Antofagasta and Santiago is worrying. Above all, Santiago belongs to the Metropolitan Region, the most populated region of Chile. A generalization of air conditioning in Chilean houses should be avoided because of its negative impact associated with energy consumption and climate change. It is necessary to regulate the new constructions, incorporating the risk estimations for overheating with climate data for 2050 or even 2100, and enhance passive solutions to mitigate the indoor environment overheating, like thermal inertia and natural or forced ventilation.
Author Contributions
Conceptualization F.R. and F.O.; resources, F.R., F.O., and F.M.; formal analysis, F.R. and P.G.-L.; visualization F.R. and F.O.; writing―original draft preparation F.R. and P.G.-L.; writing―review and editing, F.R., F.O., and F.M.
Funding
This research was funded by Fondecyt grant number 1170429 and the academic incorporation program of F.R. and F.O. from Pontificia Universidad Católica de Chile. The APC was funded by School of Civil Construction.
Conflicts of Interest
The authors declare no conflict of interest
Nomenclature
| Am | Effective mass area (m2) |
| At | Area of all internal surfaces (m2) |
| Cm | Internal Heat capacity (J/kg) |
| Htr,em | Heat transfer coefficient between exterior and mass wall (W/K) |
| Htr,is | Heat transfer coefficient between indoor air and internal surface (W/K) |
| Htr.ms | Heat transfer coefficient between thermal mass and internal surface (W/K) |
| Htr,w | Heat transfer coefficient through windows (W/K) |
| Hve | Heat transfer coefficient through ventilation (W/K) |
| Tair | Indoor air temperature (°C) |
| Te | Outdoor air temperature (°C) |
| Ted | daily average of outdoor temperature (°C) |
| Tm | Temperature of thermal mass (°C) |
| Trm | Running mean outdoor temperature (°C) |
| Ts | Temperature of internal surface |
| Φia | Heat flow rate from internal heat sources to indoor air (W) |
| Φint | Heat flow rate due to internal heat sources (W) |
| Φm | Heat flow rate applied to thermal mass |
| Φnd | Space heating and cooling rate (W) |
| Φsol | Heat flow rate from solar heat source (W) |
| Φst | Heat flow rate applied to internal surface |
References
- IPCC. Global Warming of 1.5 °C. In An IPCC Special Report on the Impacts of Global Warming of 1.5 °C above Pre-Industrial Levels and Related Global Greenhouse Gas Emission Pathways, in the Context of Strengthening the Global Response to the Threat of Climate Change; IPCC: Geneva, Switzerland, 2018. [Google Scholar]
- World Meteorological Organization. WMO Statement on the State of the Global Climate in 2016; World Meteorological Organization: Geneva, Switzerland, 2017. [Google Scholar]
- United Nations Office at Geneva. Adoption of the Paris Agreement; United Nations Office at Geneva: Geneva, Switzerland, 2015. [Google Scholar]
- Kirtman, B.; Power, S.B.; Adedoyin, A.J.; Boer, G.J.; Bojariu, R.; Camilloni, I.; Doblas-Reyes, F.; Fiore, A.M.; Kimoto, M.; Meehl, G.; et al. Near-term Climate Change: Projections and Predictability. In Climate Change 2013: The Physical Science Basis. Contribution of Working Group I to the Fifth Assessment Report of the Intergovernmental Panel on Climate Change; Stocker, T.F., Qin, D., Plattner, G.-K., Tignor, M., Allen, S.K., Boschung, J., Nauels, A., Xia, Y., Bex, V., Midgley, P.M., Eds.; Cambridge University Press: Cambridge, UK; New York, NY, USA, 2013; Volume 9781107057, pp. 953–1028. [Google Scholar]
- Meinshausen, M.; Smith, S.J.; Calvin, K.; Daniel, J.S.; Kainuma, M.L.T.; Lamarque, J.-F.; Matsumoto, K.; Montzka, S.A.; Raper, S.C.B.; Riahi, K.; et al. The RCP greenhouse gas concentrations and their extensions from 1765 to 2300. Clim. Chang. 2011, 109, 213–241. [Google Scholar] [CrossRef]
- de Energía, M. Energía 2050; Política Energética de Chile: Santiago, Chile, 2015. [Google Scholar]
- Olonscheck, M.; Holsten, A.; Kropp, J.P. Heating and cooling energy demand and related emissions of the German residential building stock under climate change. Energy Policy 2011, 39, 4795–4806. [Google Scholar] [CrossRef]
- Invidiata, A.; Ghisi, E. Impact of climate change on heating and cooling energy demand in houses in Brazil. Energy Build 2016, 130, 20–32. [Google Scholar] [CrossRef]
- Frank, T. Climate change impacts on building heating and cooling energy demand in Switzerland. Energy Build 2005, 37, 1175–1185. [Google Scholar] [CrossRef]
- Dodoo, A.; Gustavsson, L.; Bonakdar, F. Effects of future climate change scenarios on overheating risk and primary energy use for Swedish residential buildings. Energy Procedia 2014, 61, 1179–1182. [Google Scholar] [CrossRef]
- Pilli-Sihvola, K.; Aatola, P.; Ollikainen, M.; Tuomenvirta, H. Climate change and electricity consumption-Witnessing increasing or decreasing use and costs? Energy Policy 2010, 38, 2409–2419. [Google Scholar] [CrossRef]
- Nik, V.M.; Mata, E.; Sasic Kalagasidis, A.; Scartezzini, J.L. Effective and robust energy retrofitting measures for future climatic conditions - Reduced heating demand of Swedish households. Energy Build 2016, 121, 176–187. [Google Scholar] [CrossRef]
- Kreft, S.; Eckstein, D.; Melchior, I. Global Climate Risk Index 2017. In Who Suffers most from Extreme Weather Events? Weather-Related Loss Events in 2015 and 1996 to 2015; Germanwatch: Bonn, Germany, 2016. [Google Scholar]
- E. EN/ISO 13790. Energy Performance of Buildings–Calculation of Energy Use for Space Heating and Cooling; EN ISO 13790: 2008; European Committee for Standardization (CEN): Brussels, Belgium, 2008. [Google Scholar]
- Kokogiannakis, G.; Strachan, P.; Clarke, J. Comparison of the simplified methods of the ISO 13790 standard and detailed modelling programs in a regulatory context. J. Build. Perform. Simul. 2016, 1, 209–219. [Google Scholar] [CrossRef]
- Millet, J.-R. The simple hourly method of prEN 13790: A dynamic method for the future. In Proceedings of the Clima 2007 WellBeing Indoors, Helsinki, Filand, 10–14 June 2007. [Google Scholar]
- Watanabe, S.; Hajima, T.; Sudo, K.; Nagashima, T.; Takemura, T.; Okajima, H.; Nozawa, T.; Kawase, H.; Abe, M.; Yokohata, T.; et al. MIROC-ESM 2010: model description and basic results of CMIP5-20c3m experiments. Geosci. Model Dev. 2011, 4, 845–872. [Google Scholar] [CrossRef]
- Dufresne, J.L.; Foujols, M.-A.; Denvil, S.; Caubel, A.; Marti, O.; Aumont, O.; Balkanski, Y.; Bekki, S.; Bellenger, H.; Benshila, R.; et al. Climate change projections using the IPSL-CM5 Earth System Model: From CMIP3 to CMIP5. Clim. Dyn. 2013, 40, 2123–2165. [Google Scholar] [CrossRef]
- Shields, C.A.; Danabasoglu, G.; Jochum, M.; Kiehl, J.T.; Levis, S.; Park, S. The low-resolution CCSM4. J. Clim. 2012, 25, 3993–4014. [Google Scholar] [CrossRef]
- Meteotest. Meteonorm. Available online: http://meteonorm.com/ (accessed on 10 October 2013).
- European Committee for Standardization. Indoor Environmental Input Parameters for Design and Assessment of Energy Performance of Buildings Addressing Indoor Air Quality, Thermal Environment, Lighting and Acoustics; EN 15251; European Committee for Standardization: Brussels, Belgium, 2007. [Google Scholar]
- Citec UBB and Decon UC. Project Report Establecimiento de Clases de Infiltración Aceptables de Edificios Para Chile, FONDEF D10I1025; Citec UBB and Decon UC: Santiago, Chile, 2016. [Google Scholar]
- Bobadilla, A.; Ossio, F.; Figueroa, R.; González, A.; Díaz, M.; Arriagada, R. the Energy Impact of Envelope Leakage. The Chilean Case. In Proceedings of the 35th AIVC Conference, 4th TightVent Conference and 2nd Venticool Conference, Poznań, Poland, 24–25 September 2014; pp. 25–35. [Google Scholar]
- Instituto de la Construcción. Manual de Aplicación de la Reglamentación Térmica; Instituto de la Construcción: Santiago, Chile, 2006. [Google Scholar]
- Bobadilla, A.; Díaz, M.; Figueroa, R.; Arriagada, R. Proposal of Acceptable Air Tightness Classes for Buildings in Chile. Rev. la construcción 2014, 13, 15–23. [Google Scholar] [CrossRef]
- Michalak, P. The simple hourly method of EN ISO 13790 standard in Matlab/Simulink: A comparative study for the climatic conditions of Poland. Energy 2014, 75, 568–578. [Google Scholar] [CrossRef]
- American Society of Heating Refrigerating and Air-Conditioning Engineers. Climatic Design Information. In ASHRAE Handbook-Fundamentals (SI); ASHRAE: Antlanta, GA, USA, 2017. [Google Scholar]
- Quayle, R.G.; Diaz, H.F. Heating degree day data applied to residential heating energy consumption. J. Appl. Meteorol. 1980, 19, 241–246. [Google Scholar] [CrossRef]
- Downton, M.W.; Stewart, T.R.; Miller, K.A. Estimating Historical Heating and Cooling Needs. Per Capita Degree Days. J. Appl. Meteorol. 1988, 27, 84–90. [Google Scholar] [CrossRef][Green Version]
- Sarak, H.; Satman, A. The degree-day method to estimate the residential heating natural gas consumption in Turkey: A case study. Energy 2003, 28, 929–939. [Google Scholar] [CrossRef]
- PMG. Hoja de ruta Productividad y Construcción Sustentable 2025; PMG: Santiago, Chile, 2016. [Google Scholar]
- Instituto National de Estadisticas Chile. Authorized Area of Building Permit. Available online: https://www.ine.cl/estadisticas/economicas/construccion/edificación-superficie-autorizada (accessed on 15 July 2019).
- Mota-Babiloni, A.; Navarro-Esbrí, J.; Barragán-Cervera, Á.; Molés, F.; Peris, B. Analysis based on EU Regulation No 517/2014 of new HFC/HFO mixtures as alternatives of high GWP refrigerants in refrigeration and HVAC systems. Int. J. Refrig. 2015, 52, 21–31. [Google Scholar] [CrossRef]
- Liggett, R.; Milne, M.; Gomez, C.; Leeper, D.; Benson, Y.; Bhattacharya, A. Climate consultant 6.0. In UCLA Energy Design Tools Group, Department of Architecture and Urban Design; University of California: Merced, CA, USA, 2016; Available online: http://energy-design-tools.aud.ucla.edu/climate-consultant/request-climate-consultant.php. (accessed on 15 July 2019).
- Givoni, B. Comfort, climate analysis and building design guidelines. Energy Build. 1992, 18, 11–23. [Google Scholar] [CrossRef]
- ASHRAE. Thermal Environmental Conditions for Human Occupancy; ASHRAE Standard 55; ASHRAE: Atlanta, GA, USA, 2013. [Google Scholar]
- Palme, M.; Carrasco, C.; Ángel Gálvez, M.; Inostroza, L. Natural Ventilation: A Mitigation Strategy to Reduce Overheating in Buildings under Urban Heat Island Effect in South American Cities. IOP Conf. Ser. Mater. Sci. Eng. 2007, 245. [Google Scholar] [CrossRef]
© 2019 by the authors. Licensee MDPI, Basel, Switzerland. This article is an open access article distributed under the terms and conditions of the Creative Commons Attribution (CC BY) license (http://creativecommons.org/licenses/by/4.0/).