Method for Selecting the Safety Integrity Level for the Control-Command and Signaling Functions

Abstract
1. Introduction
2. Literature Review
3. Materials and Methods
- S—potential consequences of the event
- E—exposure (time/frequency of exposure to the event)
- A—possibility to avoid or limit damages
- O—probability of the occurrence of the event
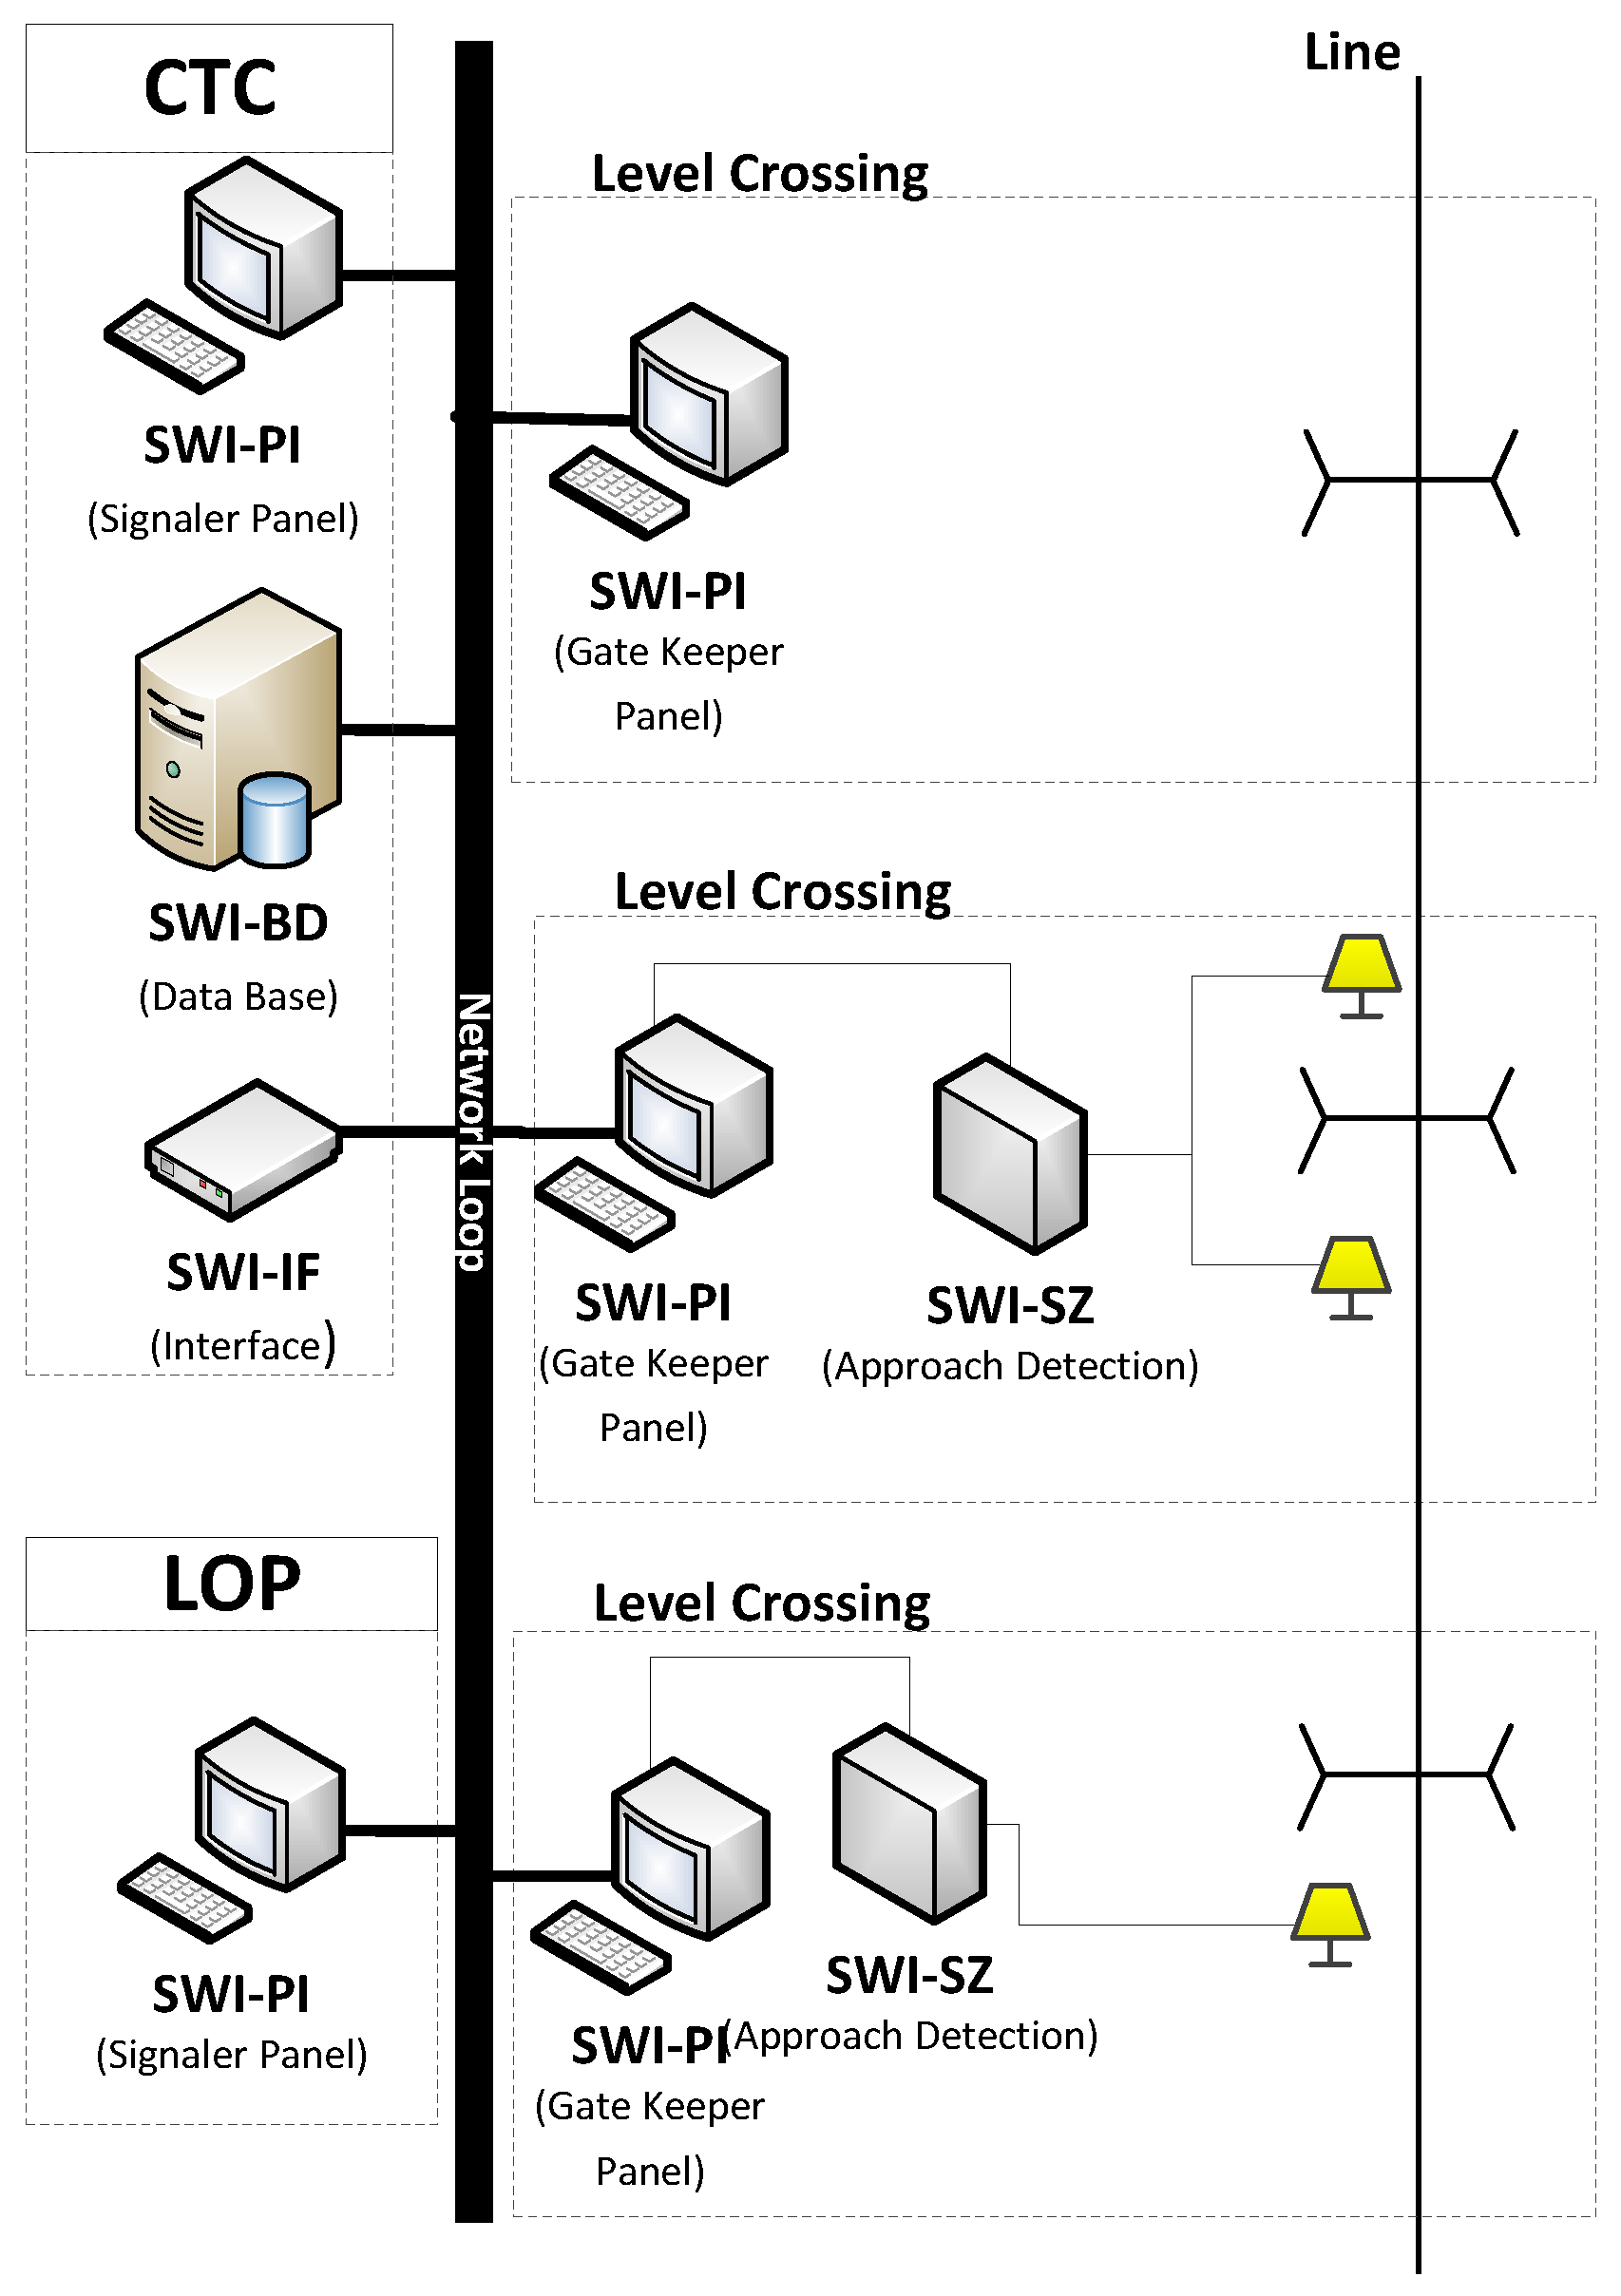
- There is a procedure of bidirectional communication between the train dispatcher and the level crossing attendant (currently in an analogue mode, telephone communication)
- There is no dependence between track/station side devices and communication devices between the train dispatcher and the attendant
- SWI system cannot be worse than the existing communication system.
- S0—event not affecting safety
- S1—event affecting safety (no fatalities)
- S2—event with a serious consequence (one fatality)
- S3—event with catastrophic consequences (more than one fatality)
- E1—possible exposure to the event
- E2—frequent exposure to the event
- A1—possible avoidance or significant limitation of damages
- A2—is not possible
- O1—the event can happen often (more often than once every 10 years; 1 × 10⁻⁵)
- O2—the event can happen sometimes during the lifecycle of the system
- O3—the event can happen rarely (more rarely than once every 20 years; 5 × 10⁻⁶).
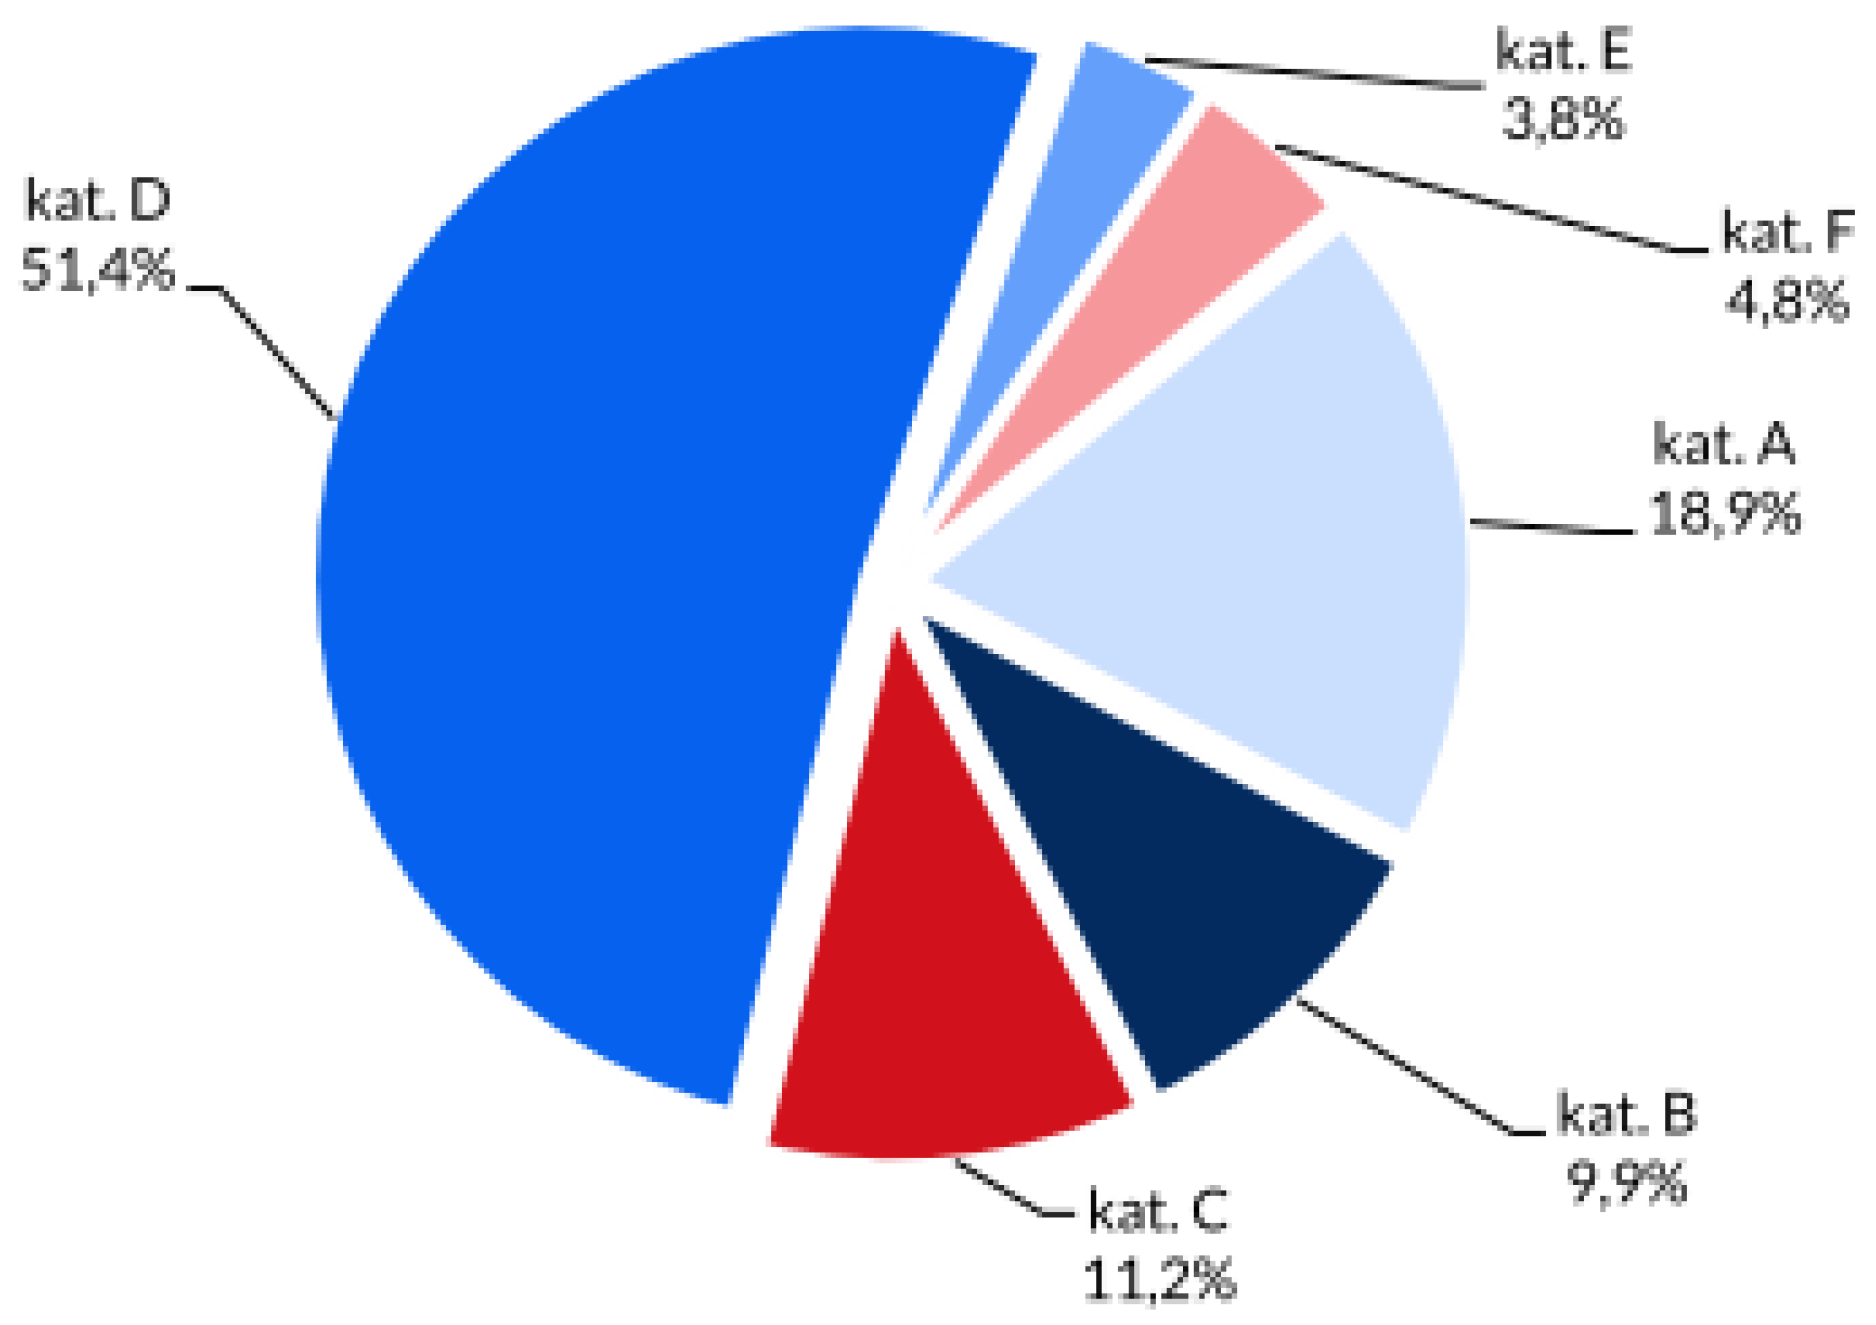
- Kat. A—means level crossing category A—Manually operated level crossing (by signalman or gatekeeper)
- Kat. B—means level crossing category B—Automatic level crossing equipped with road signals and barriers
- Kat. C—means level crossing category C—Automatic level crossing equipped with road signals only
- Kat. D—means level crossing category D—Level crossing not equipped with any LX system
- Kat. E—means level crossing category E—Level crossing for pedestrians equipped with systems like for cat. A or B
- Kat. F—means level crossing category F—Private level crossings equipped like for cat. A or B.
4. Results
- “Loss of function”,
- “Excess of function”,
- “Inverse of intended function”,
- “Function done too early”,
- “Function done too late” and
- “Other than intended function”.
5. Discussion
6. Conclusions
Author Contributions
Funding
Acknowledgments
Conflicts of Interest
Appendix A

| Notation | Explanation |
|---|---|
| SIL | Safety integrity level targets |
| S | Potential consequences of the event |
| E | Exposure (time/frequency of exposure to the event) |
| A | Possibility to avoid or limit damages |
| O | Probability of the occurrence of the event |
| P | the frequency of the occurrence of the event, resulting from the hazard. Letter “P” adopts a total value between 1 and 10; |
| W | probability of the detection of the hazard when the risk control measures applied so far are used. Letter “W” adopts a total value between 1 and 10; |
| S | the numbers specifying the value of the consequences of the event, and if during the period subject to the assessment more than one event occurs, the average value for the consequences resulting from the hazard. Letter “S” adopts a total value between 1 and 10; |
| Abbreviations | Explanation |
|---|---|
| FMEA | Failure Mode and Effect Analysis |
| FMECA | Failure mode, effects and criticality analysis |
| HAZOP | Hazard and Operability study |
| ETA | Event tree analysis |
| FTA | Fault Tree Analysis |
| THR | Tolerable Hazard Rate |
| SIL | Safety Integrity Level |
| SWI | Polish language: System Wymiany Informacji (Bi-directional communication system) |
| RPN | Risk Priority Number |
| PKBWK | Polish language: Panstwowa Komisja Badan Wypadkow Kolejowych (Polish Committee for Railway Accidents Investigation) |
| CENELEC | European Committee for Electro technical Standardization |
| PHA | Preliminary Hazard Analysis |
| SRS | System Requirements Specification |
| SRAC | Safety Related Application Condition |
| PN-EN | Polish Norms – European Norms |
References
- Szopa, T. Niezawodność i Bezpieczeństwo (Eng. Reliability and Safety); Warsaw Technical Universtiy: Warsaw, Poland, 2009. [Google Scholar]
- Aven, T. Misconception of Risk; University of Stavanger: Stavanger, Norway; John Wiley & Sons Ltd.: Hoboken, NJ, USA, 2010. [Google Scholar]
- Andrzej, L. Current and New Signalling Systems; TTS 2-3/2012; Research Institute: Radom, Poland, March 2012; pp. 28–35. [Google Scholar]
- Nancy, G. Leveson, Safeware. In System Safety and Computers; University of Washington, Addison Wesley: Boston, MA, USA, 1995. [Google Scholar]
- PKP PLK S.A. (Infrastructure Manager), Ie-113. Requirements for the Information Exchange System between Traffic Posts Employees Participating in the Service of the Railway-Road Crossing and the Employee in Charge of the Railway-Road Crossing; PKP PLK S.A.: Warsaw, Poland, 2015. [Google Scholar]
- Aven, T. On how to define, understand and describe risk. University of Stavanger, Norway. Reliab. Eng. Syst. Saf. 2010, 95, 623–631. [Google Scholar] [CrossRef]
- Aven, T. The risk concept—Historical and recent development trends. University of Stavanger, Norway. Reliab. Eng. Syst. Saf. 2012, 99, 33–44. [Google Scholar] [CrossRef]
- Elise, G.C.; Kift, R.L. Keeping track of railway safety and the mechanisms of risk. Saf. Sci. 2018, 110, 195–205. [Google Scholar]
- Commission Implementing Regulation of the European Commission No 402/2013 of 30 April 2013 on the Common Safety Method for Risk Evaluation and Assessment and Repealing Regulation (EC) No 352/2009. Available online: https://eur-lex.europa.eu/LexUriServ/LexUriServ.do?uri=OJ:L:2013:121:0008:0025:EN:PDF (accessed on 16 October 2019).
- Standard PN-EN 50126:2018 Railway Applications—Specification of Reliability, Accessibility, Maintainability and Safety; CEN-CENELEC Management Center: Brussels, Belgium, 2018.
- Standard PN-EN 50129:2007 Railway Applications—Communication, Data Processing and Traffic Control Systems—Electronic Systems of Traffic Control Related to Safety; CEN-CENELEC Management Center: Brussels, Belgium, 2007.
- Standard PN-EN 61508-1:2010 Functional Safety of Electrical/Electronical/Programmable Electronic Systems Related to Safety—Part 1: General Requirements; CEN-CENELEC Management Center: Brussels, Belgium, 2010.
- Fuchs, P.; Zajíček, J. Safety Integrity Level (SIL) versus full quantitative risk value. Maint. Reliab. 2013, 15, 99–105. [Google Scholar]
- Gulland, W.G. Methods of Determining Safety Integrity Level (SIL) requirements—Pros and Cons, Practical Elements of Safety; Springer: London, UK, 2004; pp. 105–122. [Google Scholar]
- Redmill, F.; Chudleigh, M.; Catmur, J. System Safety: HAZOP and Software HAZOP; John Wiley & Sons: Chichester, UK, 1999. [Google Scholar]
- Ericson, C.A., II. Hazard Analysis Techniques for System Safety; John Wiley & Sons: Hoboken, NJ, USA, 2005. [Google Scholar]
- Standard PN-EN 61882:2016-07 Studies of hazards and operability (HAZOP studies). In Application Guide; CEN-CENELEC Management Center: Brussels, Belgium, 2016.
- Hwang, J.; Jo, H. Hazard Identification of Railway Signalling System Using PHA and HAZOP Methods. Int. J. Autom. Power Eng. 2013, 2, 32–39. [Google Scholar]
- Baybutt, P. Calibration of risk matrices for process safety, Primatech Inc., Columbus, OH, USA. J. Loss Prev. Process Ind. 2015, 38, 163–168. [Google Scholar] [CrossRef]
- Baybutt, P. An improved risk graph approach for determination of safety integrity levels (SILs). Process Saf. Prog. 2006, 26, 66–76. [Google Scholar] [CrossRef]
- Zhang, W.; Lan, N.; Li, X. Estimation Technology of Safety Integrity Level of Safety-Related Systems in High Speed Train, School of Reliability and System Engineering, Beihang University. IERI Procedia 2012, 1, 172–177. [Google Scholar]
- Berrado, A.; El-Koursi, E.; Cherkaoui, A.; Khaddour, M. A Framework for Risk Management in Railway Sector: Application to Road-Rail Level Crossings. Open Transp. J. 2011, 5, 34–44. [Google Scholar] [CrossRef]
- Restel, F.; Wolniewicz, L. Tramway Reliability and Safety Influencing Factors. Procedia Eng. 2017, 187, 477–482. [Google Scholar] [CrossRef]
- Szmel, D.; Wawrzyniak, D. Application of FMEA Method in Railway Signalling projects. J. KONBiN 2017, 42, 93–110. [Google Scholar] [CrossRef]
- Standard PN-EN 60812:2009 System Fault Analysis Techniques Fault Modes and Effects Analysis (FMEA); CEN-CENELEC Management Center: Brussels, Belgium, 2009.
- Baybutt, P. On the completeness of scenario identification in process hazard analysis (PHA), Primatech Inc., Columbus, OH, USA. J. Loss Prev. Process Ind. 2018, 55, 492–499. [Google Scholar] [CrossRef]
- Standard PN-EN 61025:2007 Fault Tree Analysis (FTA). 2007. Available online: https://infostore.saiglobal.com/en-us/Standards/PN-EN-61025-2007-949989_SAIG_PKN_PKN_2232975/ (accessed on 16 October 2019).
- Standard PN-EN 62502:2011 Reliability Analysis Techniques Events Tree Analysis (ETA). 2011. Available online: https://shop.bsigroup.com/ProductDetail?pid=000000000030169893 (accessed on 16 October 2019).
- The State Committee for Railway Accidents, Ministry of Infrastructure and Construction, Annual Reports for 2011–2017 on the Activities of the State Committee for Railway Accidents; National Safety Authority: Warsaw, Poland, 2018.
- National Safety Authority Safety Report for Year 2018; Railway Transport Authority: Warsaw, Poland, 2019; ISBN 978-83-65709-35-6.
- Materials of Thales company (agreed to be presented in the paper as they are official documents)
- PKP PLK, S.A. SMS/MMS-PR-02 Technical and Operational Risk Assessment; PKP PLK S.A Procedure: Warsaw, Poland, 2014. [Google Scholar]
- Sobral, J.; Soares, C.G. Assessment of the adequacy of safety barriers to hazards. Saf. Sci. 2019, 114, 40–48. [Google Scholar] [CrossRef]
- Aven, T.; Kristensen, V. How the distinction between general knowledge and specific knowledge can improve the foundation and practice of risk assessment and risk-informed decision-making. Reliab. Eng. Syst. Saf. 2019, 119, 106553. [Google Scholar] [CrossRef]
- Le Coze, J.C. Safety as Strategy: Mistakes, failures and fiascos in high-risk systemas. Saf. Sci. 2019, 116, 259–274. [Google Scholar] [CrossRef]
- Jensen, A.; Aven, T. A new definition of complexity in risk analysis setting. Reliab. Eng. Syst. Saf. 2018, 117, 169–173. [Google Scholar] [CrossRef]


| No. | Functions | No. of Inf. | Information |
|---|---|---|---|
| F1 | Informing the level crossing attendant that the train has been sent on track | Inf_1 | Sending the message about the train sent on track |
| Inf_10 | Sending the confirmation of the receipt of the message about the train sent on track | ||
| Inf_12 | Confirmation of the closed level crossing for the train | ||
| Inf_23 | Confirmation of the train having passed | ||
| F2 | Revocation of the train departure from the station | Inf_2 | Revocation of the message about the train departure from the station |
| Inf_11 | Confirmation of the revocation message | ||
| F6 | Suspension of shunting movement over the level crossing | Inf_04 | Sending the message about the shunting suspension |
| Inf_15 | Confirmation of the message about the shunting suspension |
| No. | Part of the System | ID_SRS | Function | Sub-Function | Guide Word | Effect | Hazard |
|---|---|---|---|---|---|---|---|
| 1 | SWI-PI | SRS_001 | F1 Informing the level crossing attendant that the train has been sent on track | Inf_1 Sending the message about the train sent on track | Loss of function | In emergency no possibility to inform users | Several possibilities |
| 2 | Excess of function | Lack of influence | No fully operated panel | ||||
| 3 | Inverse of intended function | Lack of influence | - | ||||
| 4 | Function done too early | Lack of influence | - | ||||
| 5 | Function done too late | Loss of function | Wrong operation of panel can lead to event at level crossing | ||||
| 6 | Other than intended function | Loss of function | Wrong operation of panel can lead to event at level crossing | ||||
| 7 | SRS-011 | F2 - Revocation of the train departure from the station | Revocation of the message about the train departure from the station | Loss of function | Unnecessary closing of the barriers | Level crossing closed. | |
| 8 | Excess of function | Unnecessary opening of the barriers when train left | Hazard: the train with higher then 20km/h at level crossing | ||||
| 9 | Inverse of intended function | See above | See above | ||||
| 10 | Function done too early | No influence | - | ||||
| 11 | Function done too late | Unnecessary closing of the barriers | Level crossing closed. | ||||
| 12 | Other than intended function | No influence | - | ||||
| 13 | SRS-020 | F6 - Suspension of shunting movement over the level crossing | Sending the message about the shunting suspension | Loss of function | Unnecessary closing of the level crossing | - | |
| 14 | Excess of function | Possible shunting movement over the level crossing | Train movement with speed higher than 20 km/h over the level crossing which is not closed | ||||
| 15 | Inverse of intended function | Unnecessary closing of the level crossing | - | ||||
| 16 | Function done too early | No influence | - | ||||
| 17 | Function done too late | Unnecessary closing of the level crossing | - | ||||
| 18 | Other than intended function | No influence | - | ||||
| 19 | SRS-021 | Confirmation of the message about the shunting suspension | Loss of function | No influence | - | ||
| 20 | Excess of function | Possible unnecessary speed limitation | - | ||||
| 21 | Inverse of intended function | No influence | - | ||||
| 22 | Function done too early | No influence | - | ||||
| 23 | Function done too late | No influence | - | ||||
| 24 | Other than intended function | No influence | - |
| ID_SRS | SRS_001 |
|---|---|
| Function | Informing the level crossing attendant that the train has been sent on track |
| S – potential consequences of the event | In the worst case, if the function breaks down, it is not possible to inform other users about the situation |
| S level | S3 |
| E – exposure | Traffic control procedures entail that the function is performed often |
| E level | E2 |
| A – possibility to avoid or limit damages | If the SWI communication module failed/broke down, users are obliged to use the level crossing communication (in accordance with Par. 8 p. 4 of the instruction Ie-113 [2] |
| A Level | A1 |
| O – probability of the occurrence of the event | By analyzing annual PKBWK reports [12], frequency of the occurrence of dangerous situations has been determined, a railway vehicle running into a road vehicle at level crossings cat. A accounts for 8 times/7 years, i.e., around once every year |
| Level O | O1 |
| Designated SIL | 4 (on the basis of the table from the standard [5] THR has been determined at the level of 10E-09≥ THR ≥ 10E-08 |
| ID_SRS | SRS-011 |
| Function | F2 - Revocation of the train departure from the station |
| S – potential consequences of the event | The worst case is the train approaching the level crossing and operator do not close the barriers due to miscommunication |
| S level | S3 |
| E – exposure | Rare exposure, because the revocation is not regular procedure |
| E level | E1 |
| A – possibility to avoid or limit damages | There is no possibility to avoid |
| A Level | A2 |
| O – probability of the occurrence of the event | By analyzing annual PKBWK reports [12], frequency of the occurrence of dangerous situations has been determined, a railway vehicle running into a road vehicle at level crossings cat. A accounts for 8 times/7 years, i.e., around once every year |
| Level O | 01 |
| Designated SIL | 4 (on the basis of the table from the standard [5] THR has been determined at the level of 10E-09≥ THR ≥ 10E-08 |
| ID_SRS | SRS-020 |
| Function | Sending the message about the shunting suspension |
| S – potential consequences of the event | Train movement with speed higher than 20 km/h over the level crossing which is not closed |
| S level | S1 |
| E – exposure | Rare |
| E level | E1 |
| A – possibility to avoid or limit damages | It is not possible to avoid the situation when train is already shunting in the area of the level crossing |
| A Level | A1 |
| O – probability of the occurrence of the event | By analyzing annual PKBWK reports [12], frequency of the occurrence of dangerous situations has been determined, a railway vehicle running into a road vehicle at level crossings cat. A accounts for 8 times/7 years, i.e., around once every year |
| Level O | O1 |
| Designated SIL | 2 |
| ID_SRS | SRS-021 |
| Function | Confirmation of the message about the shunting suspension |
| S – potential consequences of the event | Possible unnecessary speed limitation |
| S level | S0 |
| E – exposure | - |
| E level | Not applicable |
| A – possibility to avoid or limit damages | - |
| A Level | Not applicable |
| O – probability of the occurrence of the event | - |
| Level O | Not applicable |
| Designated SIL | No SIL assigned. |
© 2019 by the authors. Licensee MDPI, Basel, Switzerland. This article is an open access article distributed under the terms and conditions of the Creative Commons Attribution (CC BY) license (http://creativecommons.org/licenses/by/4.0/).
Share and Cite
Szmel, D.; Zabłocki, W.; Ilczuk, P.; Kochan, A. Method for Selecting the Safety Integrity Level for the Control-Command and Signaling Functions. Sustainability 2019, 11, 7062. https://doi.org/10.3390/su11247062
Szmel D, Zabłocki W, Ilczuk P, Kochan A. Method for Selecting the Safety Integrity Level for the Control-Command and Signaling Functions. Sustainability. 2019; 11(24):7062. https://doi.org/10.3390/su11247062
Chicago/Turabian StyleSzmel, Dariusz, Wiesław Zabłocki, Przemysław Ilczuk, and Andrzej Kochan. 2019. "Method for Selecting the Safety Integrity Level for the Control-Command and Signaling Functions" Sustainability 11, no. 24: 7062. https://doi.org/10.3390/su11247062
APA StyleSzmel, D., Zabłocki, W., Ilczuk, P., & Kochan, A. (2019). Method for Selecting the Safety Integrity Level for the Control-Command and Signaling Functions. Sustainability, 11(24), 7062. https://doi.org/10.3390/su11247062