Article

Method for Selecting the Safety Integrity Level for the Control-Command and Signaling Functions

Department of Traffic Control and Infrastructure, Faculty of Transport, Warsaw University of Technology, 00001 Warsaw, Poland
*
Author to whom correspondence should be addressed.
Sustainability 2019, 11(24), 7062; https://doi.org/10.3390/su11247062
Submission received: 29 October 2019 / Revised: 2 December 2019 / Accepted: 4 December 2019 / Published: 10 December 2019
(This article belongs to the Special Issue Sustainable Value Management–New Concepts and Contemporary Trends)

Abstract

:
The purpose of the article is to present selected method of risk assessment of railway control and signaling systems, including current normative and legal bases, such as directives and regulations that regulate the interoperability and safety of the railway system. Selected methods used at the initial stage of creating safety requirements and referring to the initial definition of the system defined at a high level of abstraction are considered. Issues of holistic approach and residual risk management are also discussed. Risk models are presented as well as individual steps of risk analysis, evaluation, and assessment, including hazard identification, impact analysis, and selection of the risk acceptance principle. Selected model based on hazard and operability studies (HAZOP) and an adapted risk graph was applied to the real signalling equipment. The key aspect undertaken in the article is the proposal to set quantitative safety objectives based on the safety integrity level/tolerable hazard rate (SIL/THR) indicator, as an important parameter in further analysis of the system, especially in computer applications. The result of study showed that application of proposed combination HAZOP and adapted risk graph method are efficient and suitable for a railway signalling application. The results and conclusion are presented in Chapters 4 and 6 of the article.

1. Introduction

The most vulnerable part of any system, including railway signalling systems, is human. Not only humans who use technical equipment, but people who design and manufacture equipment. Railway signalling systems become more and more complicated and complex. The overarching aim at the designing stage is to automatize work in order to eliminate human errors in the signalling process [1,2,3,4]. Therefore, technical problems are a significant problem of safety and risk analysis. The main problem now is to apply reasonable and practicable method to perform risk assessment in order to identify the safety requirements that shall be considered during the signalling system development. It is desired that the method is no time and resources consuming in the dynamic world with so many changes occurring so fast. The purpose of the article is to present selected method of risk assessment of railway control and signaling systems, including current normative and legal bases, such as directives and regulations that regulate the interoperability and safety of the railway system. These problems differ because the devices and systems vary significantly. Engineers solve these problems mainly at the stage of designing. They are legally and morally responsible for the safety of future users of designed devices. The engineers design and supervise production processes of these devices to maintain the safety level required by law [5]. It is especially difficult to specify the expected safety level, which is linked to the social risk acceptance level. In order to specify the safety level, we use the term risk, which is inextricably linked with the randomness of phenomena and events in the world [6,7]. Risk assessment is a key part of the safety management strategy [8]. In the article, the authors focus on the initial stage of the risk assessment: from defining the system to specifying safety requirements. The goal of the article was to present the hazard and operability studies (HAZOP) and adapted risk graph method to perform initial risk assessment process and determine safety integrity level/tolerable hazard rate (SIL/THR) requirement and as well to meet the requirements of railway regulation especially regulation 402/2013 [9,10,11]. The SIL and THR in the context of this article is applied interchangeably. The reason for that is because the used method is qualitative. Authors are aware that the two parameters represent different requirements, however in authors opinions, it has impact and meaning at further steps of safety analysis of a given system [12]. The authors propose the combination of HAZOP and adapted risk graph as practical and comprehensive method to determine the safety targets for the system. There are many other qualitative and quantitative methods available. However, the goal of the method selection was to use well proven, but adapted methods, easy to apply at this level of the system analysis, and easy to understand by railway authorities and/or decision makers. The notations and abbreviations can be found in Appendix A, Table A2.
This publication is part of the research constituting statutory activity and as part of other research programs.

2. Literature Review

Risk assessment of the railway system has been specified in the Implementing Regulation of the European Commission (EU) No 402/2013 of 30 April, 2013 on the common safety method for risk evaluation and assessment and repealing Regulation (EC) No 352/2009 [9]. If a risk assessment is required by the relevant technical specification for interoperability (TSI) then the TSI shall, where necessary, specify which parts of this Regulation apply and, in the case of a railway signalling system, the Commission Regulation (EU) 2016/919 of 27 May, 2016 on the technical specification for interoperability relating to the ‘control-command and signalling’ subsystems of the rail system in the European Union says that CENELEC standards shall apply [10,11]. Currently the SIL investigation methods in railway signalling is not clearly defined. Most of the standards propose several methods to perform the analysis without pointing out the one that is the most suitable [10]. The idea of applying SIL concept is based on the standard PN-EN 61508-1 [12], where also several methods are proposed for the generic E/E/PE systems including risk graph. Most of the scientific papers related to SIL determination is outside of the railway signalling domain [13,14].
The HAZOP method has its deficiencies [15,16,17], however it is commonly used in railway system for identification of hazards and when carefully applied still provide very good value for the risk assessment process. In paper [18] authors discuss the new HAZOP method is to be applied for the Train Control System in the railway environment with modified parameters. The approach in this article was to use selected guide words to specific functions of the system. It is the typical use of the HAZOP system with application to signalling domain. The risk graph method is not often used in main line signalling systems and more often you can see the risk matrices applied [19], however the risk graph method provides very good values as a qualitative method that does not require huge effort and provides higher levels of details to consider during the decision making [20,21].
In the new version of the PN-EN 50126 standard [10] and in the regulation [9], the description of risk assessment is similar and differs mainly in terms of details at the stage of implementation. In the standard [10], a simplified model has been presented, showing safety activities. It has been named Hourglass model and it separates the risk analysis process, which is a part of the risk assessment at the stage of the concept of the system, from hazards analysis, which is a part of the hazards control at the stage of system implementation. The Hourglass model is well illustrated in the standard PN-EN 50126 [10].
In considerations and analyses regarding safe systems, the concept of a risk model is used because a real risk is not known and cannot be specified. Therefore, the risk analysis must be preceded by a risk model that takes into account, in turn, the human being, real risk, description of the risk (concept mapping), risk model, and risk analysis [11,22,23].
The risk model adopted in Commission Implementing Regulation (2013) [9] shows relations between the causes, hazards, and accidents and their consequences. It is especially assumed that: a single cause can lead to a few hazards, a hazard can consequently lead to a number of accidents of different types, depending on the context of the operation process and environmental parameters. Therefore, such an accident can have various consequences. An exemplary risk model has been shown at Figure 1. It specifies how a hazard at the level of a considered subsystem or system, as a result of operational or technical factors, can be moved to the railway system level, and can lead to an accident, taking into account trigger events and availability of external barriers. The risk graph was applied to consider the below risk model and include evaluation of causes, external barriers, and consequences.
One of the key and difficult stages of a risk analysis is hazards identification. It is a continuous stage, which should be conducted on a regular basis, during the whole lifecycle of the system. Here, a hazards identification process at the initial stage of system development is described. Firstly, parts of the system are selected, where an unwanted event can take place. Causes and consequences of these events are specified. This task encompasses many methods which support hazard identification. FMECA [24] and HAZOP are the most widespread, described in detail by standards [17,25]. It is also recommended to determine principles and criteria of hazards identification beforehand. The risk model needs to be supplemented by information about consequences of a potential accident. For this purpose, induction and deduction methods are applied, or combination thereof, among others the ones described above and such methods as ETA and FTA [26], described in detail by standards [27,28]. The above activities provide information which is essential in order to classify hazards and estimate risk. In order to evaluate risk, it is necessary to specify risk acceptance criteria. Each analysis starts with a qualitative approach, followed by a quantitative one. However, it is not always possible to estimate risk mathematically. In [9,10], three risk acceptance criteria have been adopted: codes of practice, a comparison with a reference system, and an explicit risk estimation. Such an approach provides for an overview of the whole system, not just the part that can be assessed quantitatively. Proposals regarding the estimation of an explicit risk have been presented in Chapters 3 and 4 of the publication. By using the code of practice or by comparing with a reference system, hazards can be controlled. The code of practice can include principles which are recognized and applied in the railway environment (e.g., standard [5], registers of railway plans). New principles can be applied, but they need to meet the requirements indicated in [9] and be justified. A comparison with a reference system consists of applying safety measures already checked in the system with safety acceptance and is operated. When it comes to residual risk, the process management of the established Safety Related Application Conditions (SRAC) is very important [10].

3. Materials and Methods

Risk assessment means the overall, multi-stage process comprising: system definition, hazards identification, risk estimation, and risk evaluation. Risk assessment is linked to the management of hazards through a hazard record. The system definition should, among others, specify the objective of the system, its functions and elements, as well as boundary, interfaces and environment. After hazards identification, risk acceptance is specified, using the following risk acceptance principles: the application of codes of practice, a comparison with similar systems and an explicit risk estimation [9]. At the stage of risk estimation, it needs to be shown that the risk acceptance principle has been applied accordingly. Application of these risk acceptance principles will make it possible to identify possible safety measures which will make the risk of the assessed system acceptable. Out of the identified safety measures, measures which serve the purpose of risk control will be selected, which will become safety requirements that the system needs to meet [4]. The whole process should be documented in the hazards record, which means the document in which identified hazards, their related measures, their origin, and the reference to the organization which has to manage them are recorded and referenced.
In order to apply risk estimation as the principle of risk acceptance, it is necessary to specify an acceptable risk level. Estimating an explicit risk is possible through specifying the frequency of hazard occurrence and its seriousness. The frequency and seriousness can be specified qualitatively or quantitatively (e.g., by matrix methods or ratio methods). For the purposes of technical systems, taking into account the frequency and seriousness, a safety objective will be set in the form of THR. It determines SIL. This chapter describes the risk graph method as the method chosen for further consideration.
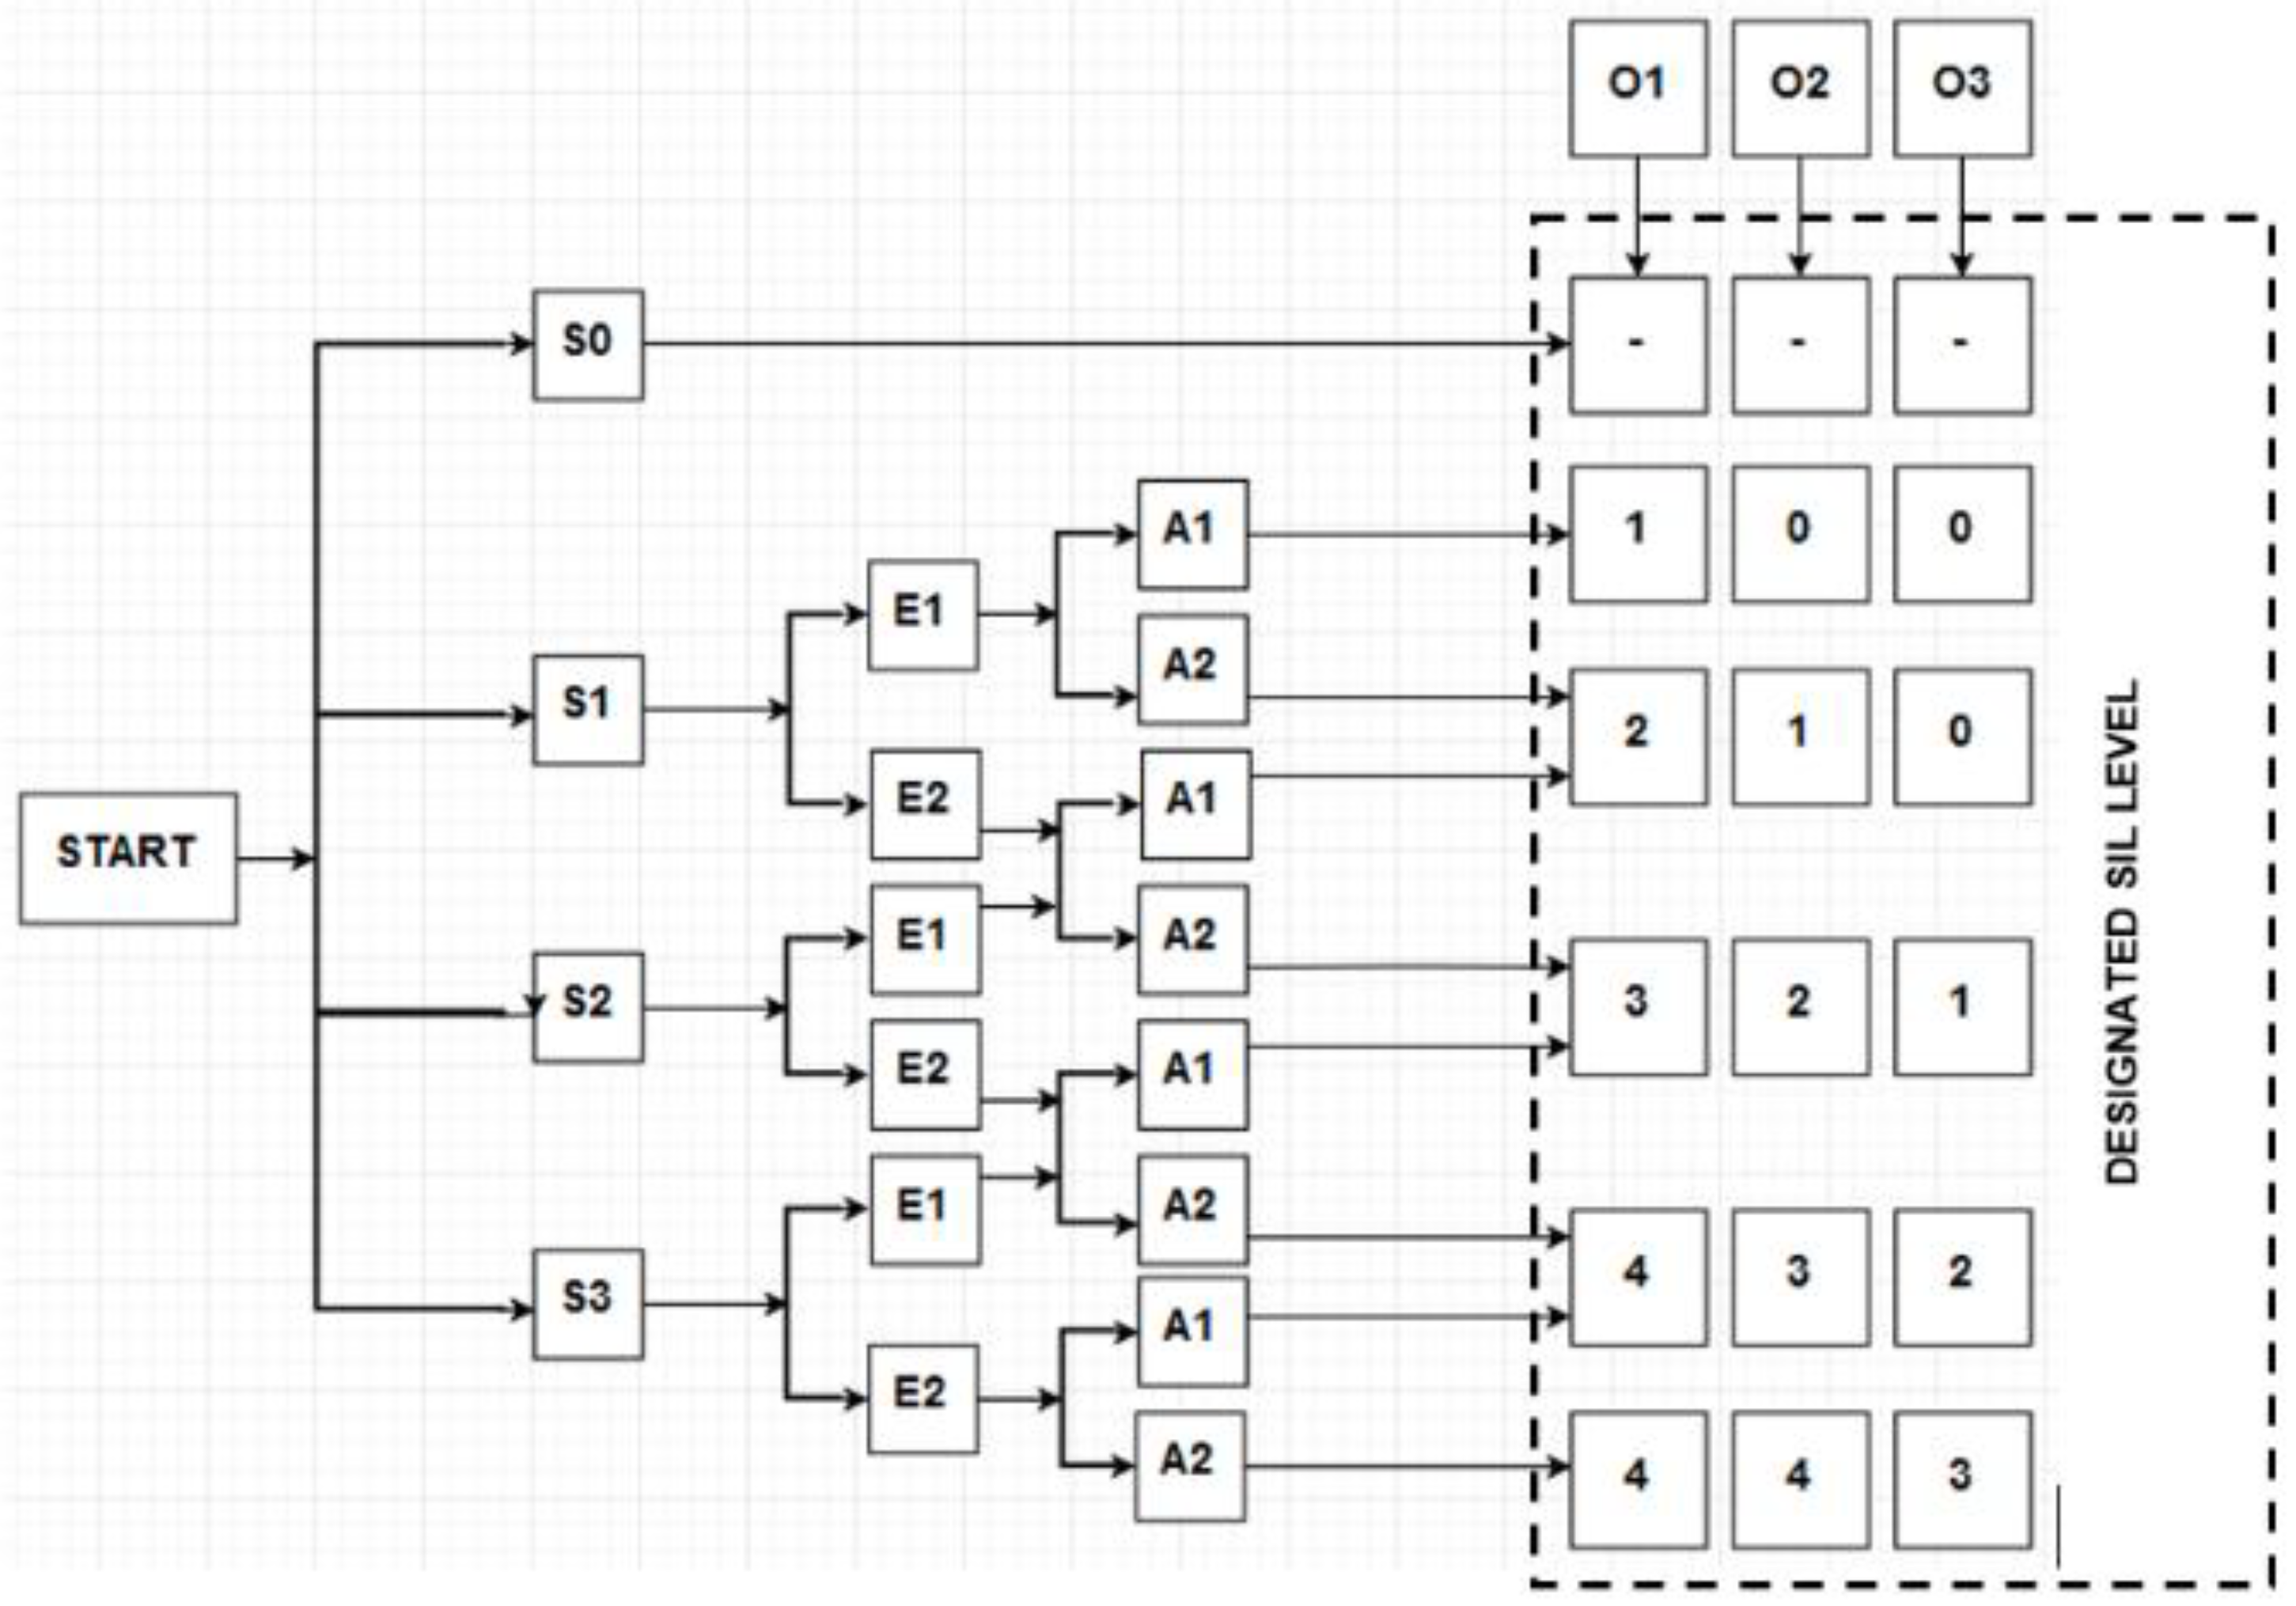
The risk graph method, in accordance with the recommendations of the standard IEC 61508 [12], as well as of the standard PN-EN 50126 [4], makes it possible to estimate risk and determine the required safety integrity level targets or THR, using the following risk elements
S I L = f ( S ; E ; A ; O )
The parameters of the equations definition:
  • S—potential consequences of the event
  • E—exposure (time/frequency of exposure to the event)
  • A—possibility to avoid or limit damages
  • O—probability of the occurrence of the event
The relationship between the elements of the method and the passage through the subsequent assessment steps is shown in Figure 2.
The method is relatively easy to use and takes into account in explicit way more parameters then risk matrices methods when specifying the risk level. However, it needs to be adjusted for the right application.
Other data should be determined using hazards identification methods (such as HAZOP) and consequences analysis (e.g., ETA). The determined hazard rate constitutes tolerable hazard rate (THR) for a given system. The adaptation of the method was presented in Section 4 as it is the part of the HAZOP method and no new approach has been identified.
For each factor, criteria based on quantitative and qualitative values have been adopted. For the purpose of the analysis it was necessary to adapt the initial parameters/criteria of the graph. They have been defined in the following way:
START
Set up of initial conditions for the analysis
  • There is a procedure of bidirectional communication between the train dispatcher and the level crossing attendant (currently in an analogue mode, telephone communication)
  • There is no dependence between track/station side devices and communication devices between the train dispatcher and the attendant
  • SWI system cannot be worse than the existing communication system.
A risk analysis executed with a risk graph method has been used for the SWI communication system between the train dispatcher and the level crossing attendant. The system shall support bi-directional communication based on telegrams and confirmation of messages. The initial conditions are related with applied system and are referenced for the further steps in the analysis. The authors decided to establish the initial conditions as reference base for the criteria analysis. The conditions and graduation have been analyzed at workshop together with railway experts. At the workshop, people responsible for safety, engineering, maintenance, and operation were invited. At the meeting the method was explained. The goal of the meeting was to analyze the propose definition of parameters based on the brainstorming. The parameters have been as well verified by the railway infrastructure manager.
S—potential consequences of the event
  • S0—event not affecting safety
  • S1—event affecting safety (no fatalities)
  • S2—event with a serious consequence (one fatality)
  • S3—event with catastrophic consequences (more than one fatality)
The potential consequences of the event have been developed in a way to meet the regulation applied in Poland [5] and represent the 4-step order of magnitude increasing from S0 to S3.
E—exposure (time/frequency of exposure to the event)
  • E1—possible exposure to the event
  • E2—frequent exposure to the event
Exposure to the event was selected base on two possible options. In the authors opinion, these two options actually define if the function is in demand mode or in continuous mode. This was the assumption made for further analysis.
A—possibility to avoid or limit damages
For technical reasons (the system equipped with existing technical safety measures), human reasons (skills, awareness, knowledge, psychophysical predispositions), and organizational reasons.
  • A1—possible avoidance or significant limitation of damages
  • A2—is not possible
These two parameters have been designed to draw attention for analysts to external barriers minimizing the frequency or the consequences of the event. This category considers the external barriers from the risk model are presented in Figure 1 above. It is important to notice that at the bottom of the graph there is no difference in resulting SIL (SIL = 4) when selecting A1 or A2. Authors assumed here that the goal of the analysis was aimed at determining the SIL level for the electronic system. Any other additional external measures have to be analyzed together with the railway infrastructure manager and were not considered in the analysis. This assumption is further discussed in Chapter 5.
O—probability of the occurrence of the event
The history of accidents for the same or similar systems.
  • O1—the event can happen often (more often than once every 10 years; 1 × 10⁻⁵)
  • O2—the event can happen sometimes during the lifecycle of the system
  • O3—the event can happen rarely (more rarely than once every 20 years; 5 × 10⁻⁶).
Probability of the occurrence of the event is established based on the history data. As mentioned at the start of the analysis, one of the assumption is that the new system cannot be worse than the one used before. The three-step approach and the ranges were selected in workshop with railway experts. The main issue with selecting the parameter is to established the contribution level of the system under consideration to the event scenario. The authors see the possibility to further research in this area.
On the basis of these data, a risk analysis report has been prepared. Results for an exemplary function have been presented in Chapter 4.
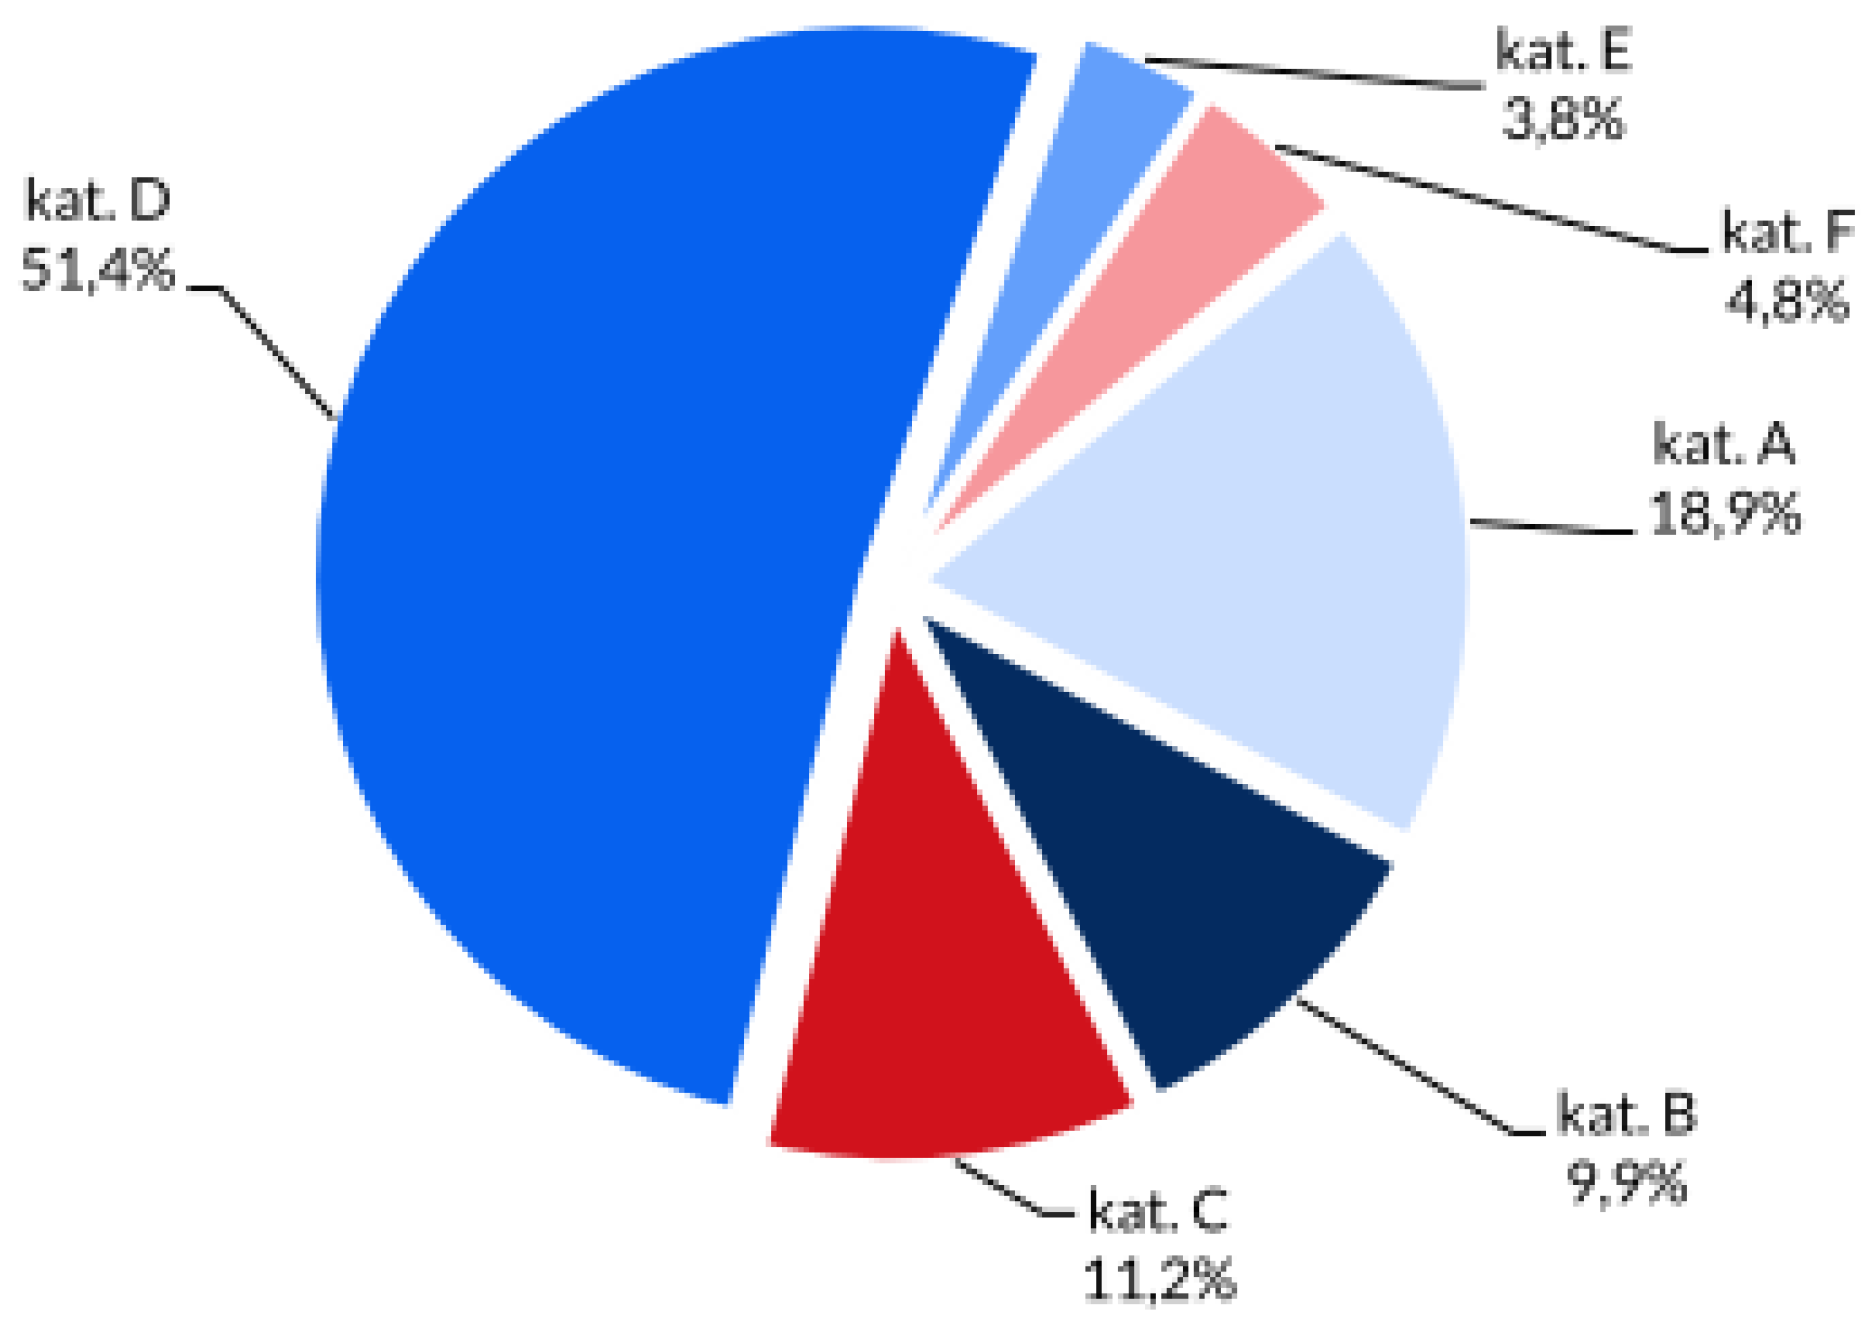
The method has been used in order to calculate the required value of THR/SIL parameters for specific system functions and in order to verify the parameter SIL4 imposed by the railway infrastructure manager for the whole SWI system. The SWI system is the system to be used by the train dispatcher and the level crossing operator to support the communication between them. The manually operated level crossing is used in the area where there is huge road and railway traffic. At the moment, in Poland, there are 2415 such operating level crossings (category A), which is 18.9% of all level crossings in Poland [29,30]. The Figure 3 represents the share of the level crossing categories in Poland [30].
Legend for the Figure 3:
  • Kat. A—means level crossing category A—Manually operated level crossing (by signalman or gatekeeper)
  • Kat. B—means level crossing category B—Automatic level crossing equipped with road signals and barriers
  • Kat. C—means level crossing category C—Automatic level crossing equipped with road signals only
  • Kat. D—means level crossing category D—Level crossing not equipped with any LX system
  • Kat. E—means level crossing category E—Level crossing for pedestrians equipped with systems like for cat. A or B
  • Kat. F—means level crossing category F—Private level crossings equipped like for cat. A or B.
From 2013 to 2018 there was, in average, 12.5 accidents per year [30], which shows clearly the need to improve the level crossing operation. The SWI system shall improve that at the level of the communication. The system in principle shall support bi-directional communication based on telegrams and confirmation of messages and shall be primary mean to communicate between two operators and the current analogue phone communication will serve as a fallback system.
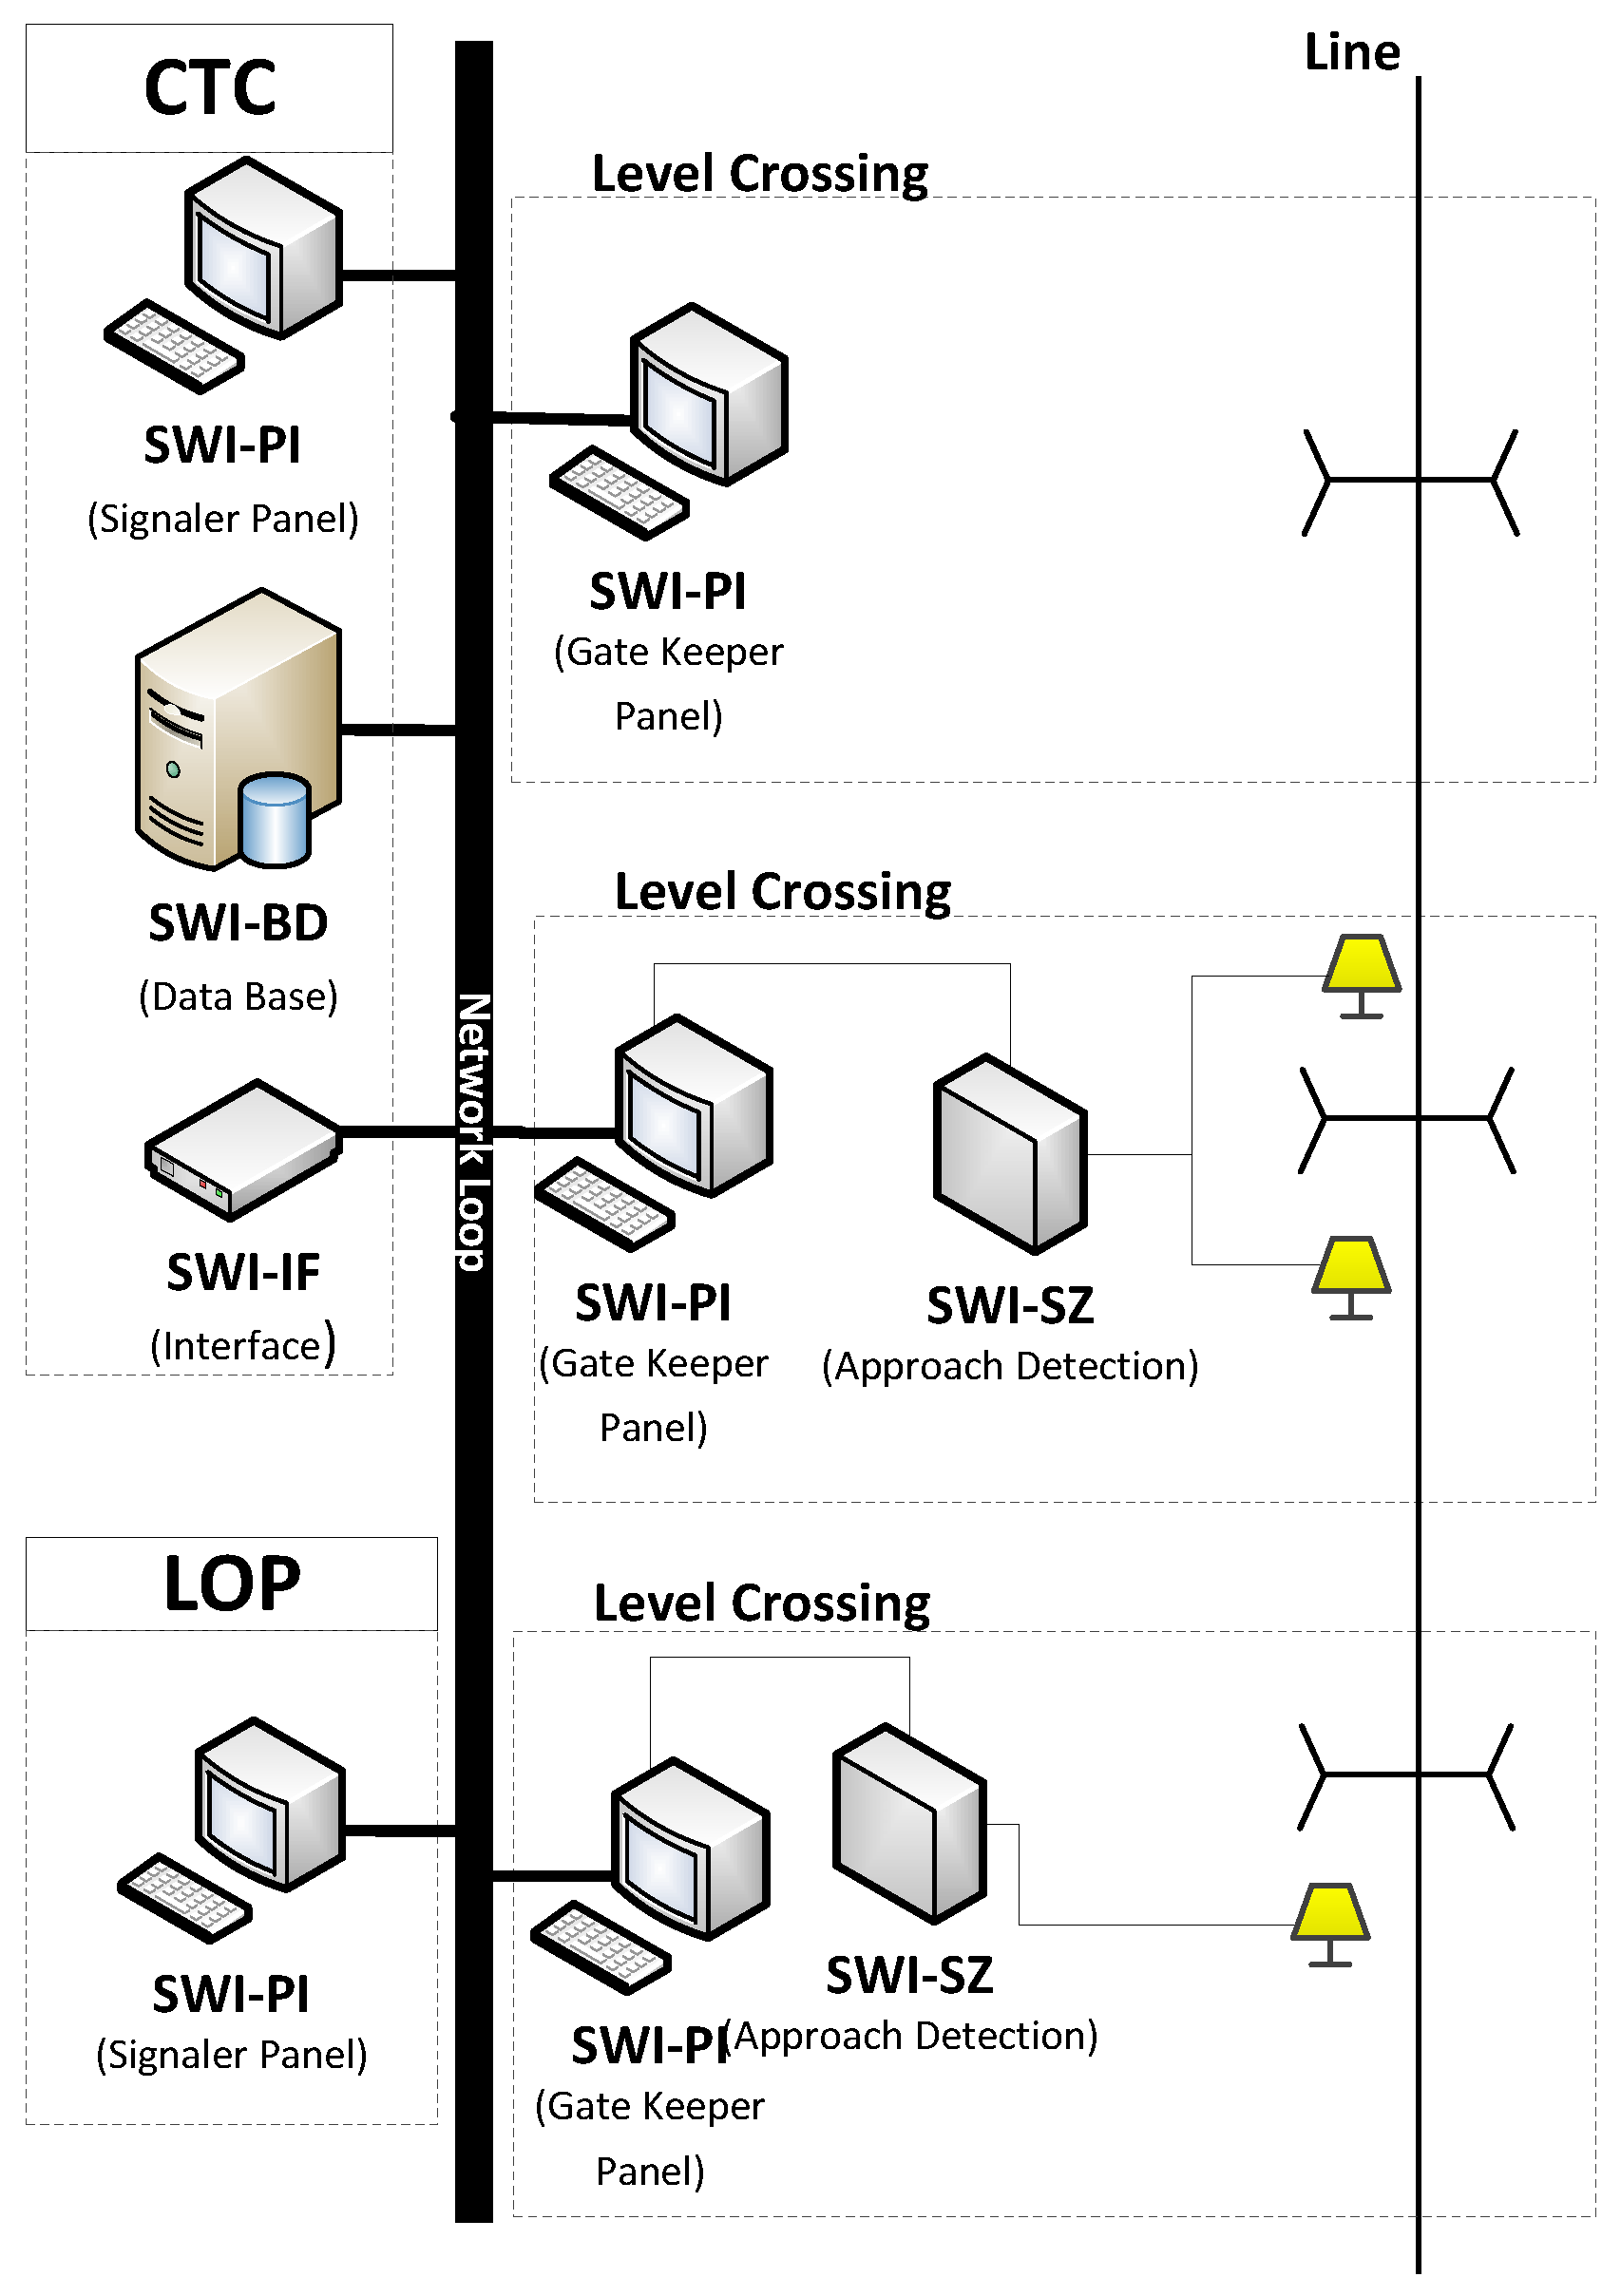
The SWI system has several components i.e., SWI-BD—database is a recording system, and a place for his administration and configuration files, SWI-IF—transferring data interface with external systems, SWI-PI—human machine interface system unit, responsible for exchanging telegrams between signaler and gatekeeper and SWI-SZ—approach detection unit notifying of the gatekeeper of incoming railway vehicle to level crossing (optional) [31]. The general decomposition of the system is presented in Figure 4.

4. Results

At the first stage of the analysis, railway instruction regulating requirements for SWI has been analyzed, and a functional analysis has been done in order to identify the necessary functions that will be performed by the system. The application of the system for railway line no. 7 Warsaw–Lublin at level crossings category A was taken into consideration. As a result of the latter, system functions have been determined, for which an identification number has been assigned and a preliminary information flow has been specified as required in order to perform the function. Below you can find the example of several functions and its decomposition to information flow. In total, there was 52 functions and they were further broke down to 81 information. The Table 1 presents the examples of the SWI system functions.
On the basis of the determined functions, system requirements have been developed and in total there were 81 system requirements. All of the system requirements have been analyzed with application of HAZOP method, with use of the key words:
  • “Loss of function”,
  • “Excess of function”,
  • “Inverse of intended function”,
  • “Function done too early”,
  • “Function done too late” and
  • “Other than intended function”.
The HAZOP method is commonly used in the railway signalling domain and enables the identification of critical elements in the system functionality. The Table 2 presents the extract from HAZOP analysis.
As a result of the HAZOP analysis, consequences of incorrect execution of a given function have been determined and generic hazards have been assigned, which had been identified earlier, as a result of a preliminary hazards analysis. The PHA was actually to derive the generic hazards in form of the preliminary hazard lists. It was done based on the brainstorm meeting and analysis of Hazards Log of the railway infrastructure. The HAZOP was to detail the hazards related with the identified high level functions.
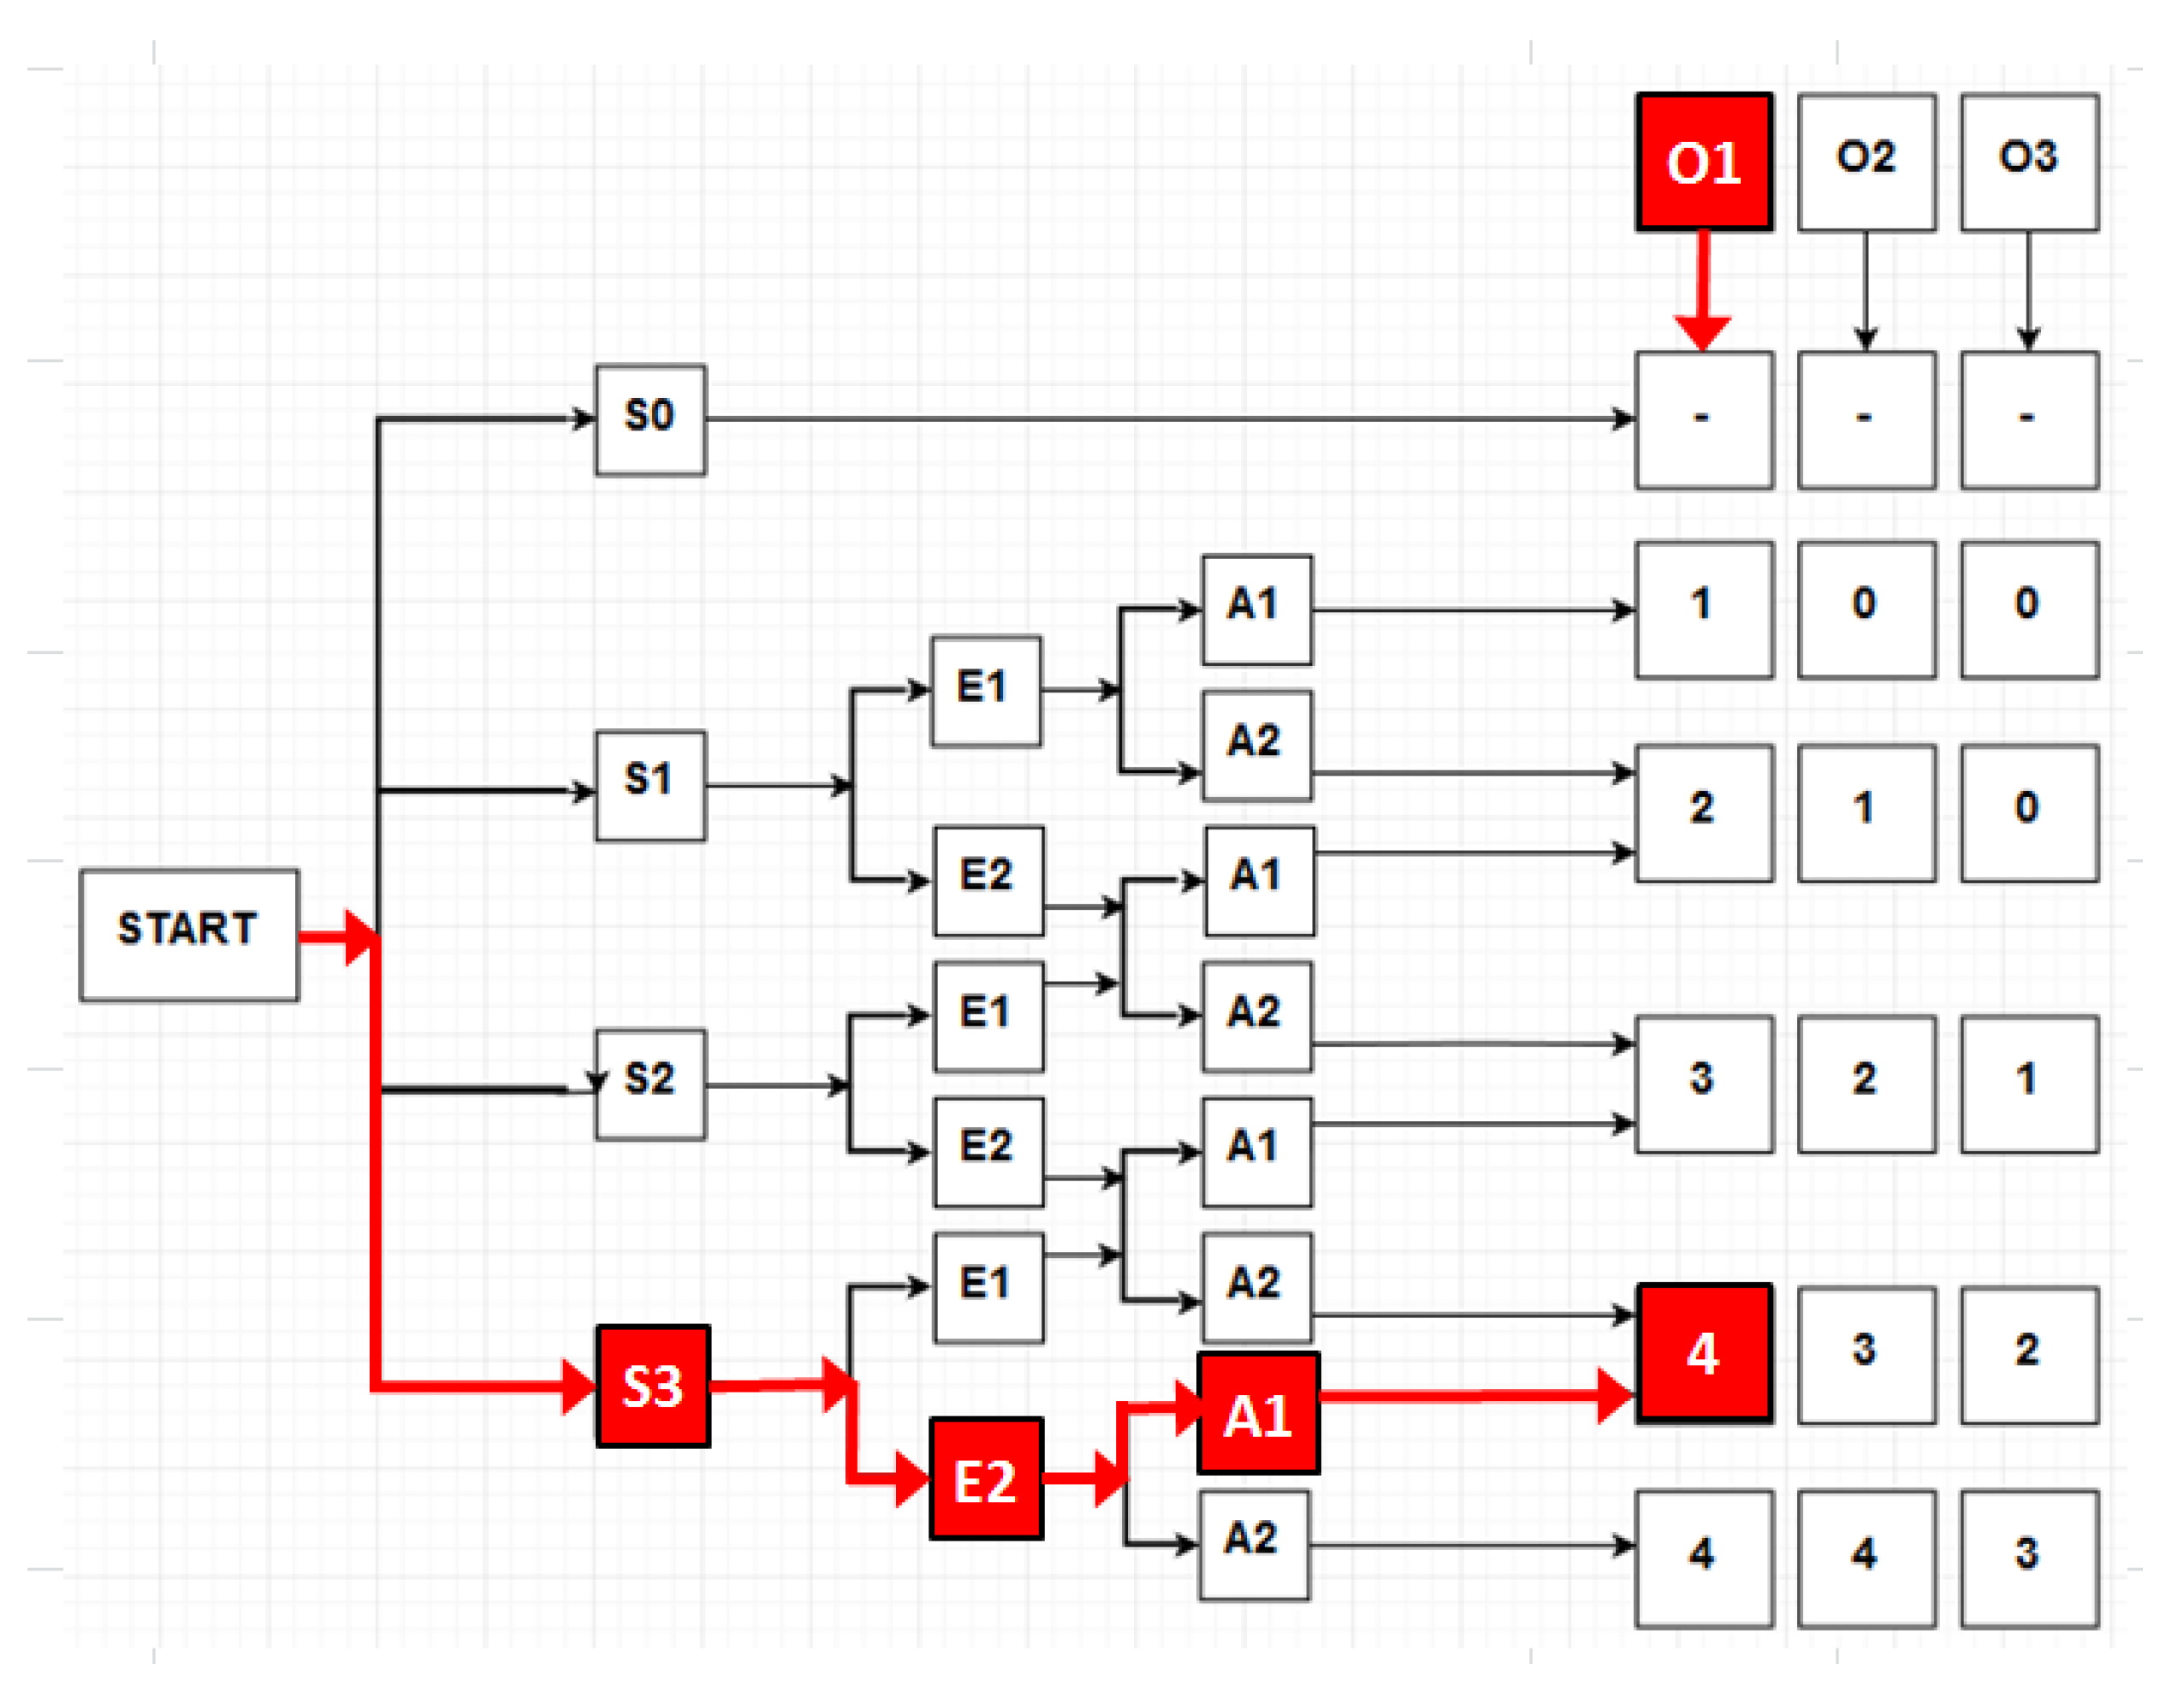
The next step of the analysis was the application of the risk graph. The risk graph method was introduced in Chapter 2 and an example for mentioned functions is graphically shown in Figure 5.
The Table 3 presents exemplary result of the risk analysis for several functions.
The result of the analysis has provided very good screening of the requirements. The full scope of the analysis was done in 6 sessions with relatively small team. At the workshop the people responsible for safety, engineering, maintenance, and operation were invited. There was in total five people participated with two people experienced in risk assessment (five years’ experience) and three people experienced in signalling (from five to eight years). The results have been verified by the safety authority and further by the railway authority at separate meeting. The necessary effort was easy to consider in the project activities including clarification with the user. For the total of 81 functions, 23 were identified as S3 level, so the worst case scenario, no S2 level parameter have been identified, and 4 S1 level were identified. Other functions were estimated at S0 so no further steps in the analysis were necessary. In total, there were 16 SIL3/4 functions identified, but the most important point was the possibility to justify 65 functions at lower safety level i.e., SIL0,1,2, or non SIL.

5. Discussion

The results of the analysis for all performed system functions meet the expectation of the Railway Authority. The interesting fact related with adaptation of risk graph shows that with the highest severity (S3) there was only 65% of functions with the highest safety requirements (SIL4). The remaining 35% of cases, after careful analysis, show that two functions have high exposure and only due to the low value of parameters A and O, it was possible to limit the achieved requirement.
The results of the analysis have been presented to the railway infrastructure manager and the next step was to jointly review it. The standard method used by railway infrastructure manager is based on FMEA and RPN analysis. The method is regulated by the Technical and Operational Risk Analysis procedure [32]. Therefore, the authors contrasted their own approach to the methods used so far. As a result of this activity, the value of the parameter “O” has been reduced in some situations, given the fact that the SWI system can only partly contribute to accidents at level crossings, consisting in a railway vehicle running into a road vehicle. It further reduced the achieved SIL [13]. Additionally, in reference to the initial stage of the analysis, where a set of technical devices performing specific functions was not clearly defined and was treated like a “black box”, the following principle has been adopted: “Worst possible scenario”, “Reasonable estimates”, “Reasonable worst case”. Nevertheless it was not further considered in the article and this approach can be further investigated. Taking into account the principle introduced in [33], which stipulates that the risk related to technical systems, with a plausible likelihood of catastrophic consequences as a direct result of a breakdown, does not need to be further reduced if the frequency of such breakdowns equals or is lower than 10–9 per hour of the system’s working time. On the basis of the above mentioned activities, the required SIL and THR have been assigned to every function of the system, instead of, like it was the case in earlier analyses made by the infrastructure manger, to the system as a whole.

6. Conclusions

The article presents a general description of the risk assessment process and the consequences of setting safety requirements. Especially, explicit risk estimation methods were presented, based on the methods used to meet the safety targets in binding standards and norms dedicated for railway signalling systems. Next, an example has been presented of a risk assessment made with an adapted risk graph for one of the systems used in railway signalling. The system has been chosen because of its relatively short period of operation and taking into account the new requirements of the infrastructure manager. In this light, making a risk assessment was a difficult task. Using the risk graph made it possible to effectively set safety objectives and was warmly received by the infrastructure manager. The results of the study showed that good practice is to consider more parameters in the analysis then only probability and severity. Moreover the semi-qualitative approach was beneficial as well in the deeper analysis and making a better decision as it was possible to investigate better in the review of the analysis results and justification. The really interesting conclusion here is that the analysis initially limit the original requirements of the user, which were done in the more traditional way i.e., based on the experience. The method, with the proposal of adapted parameters of risk graph can be used for classifying safety requirements in this area of railway signalling project. The complexity of the solutions provided in railway environment is getting bigger and bigger and there is strong movement to adopt newest technology in the operation, which of course results in higher risk [34,35,36], that is why more simple methods are needed to follow this trend in the railways.

Author Contributions

Conceptualization, W.Z. and D.S.; methodology, A.K. and P.I.; validation, W.Z. and A.K.; formal analysis, P.I.; investigation, D.S.; resources, A.K. and D.S.; data curation, D.S.; writing—original draft preparation, D.S.; writing—review and editing, P.I.; visualization, D.S. and P.I.; supervision, W.Z.; project administration, D.S. and P.I.; funding acquisition, A.K.

Funding

This research receives no funding.

Acknowledgments

Special thanks to Wiesław Zabłocki who passed away this year in June. He was a great man, great scientist, and expert in the signalling automation field. He always gave huge support for colleagues, workers, students, and the whole transport community. The authors would like to also thank Cezary Czarkowski who lead the analysis and has big contributions in the analysis principles and its application in Thales company.

Conflicts of Interest

The authors declare no conflict of interest.

Appendix A

Notations and abbreviations
Table A1. Notations.
NotationExplanation
SILSafety integrity level targets
SPotential consequences of the event
EExposure (time/frequency of exposure to the event)
APossibility to avoid or limit damages
OProbability of the occurrence of the event
P the frequency of the occurrence of the event, resulting from the hazard. Letter “P” adopts a total value between 1 and 10;
Wprobability of the detection of the hazard when the risk control measures applied so far are used. Letter “W” adopts a total value between 1 and 10;
Sthe numbers specifying the value of the consequences of the event, and if during the period subject to the assessment more than one event occurs, the average value for the consequences resulting from the hazard. Letter “S” adopts a total value between 1 and 10;
Table A2. Abbreviations.
AbbreviationsExplanation
FMEA Failure Mode and Effect Analysis
FMECAFailure mode, effects and criticality analysis
HAZOPHazard and Operability study
ETAEvent tree analysis
FTAFault Tree Analysis
THR Tolerable Hazard Rate
SIL Safety Integrity Level
SWIPolish language: System Wymiany Informacji (Bi-directional communication system)
RPNRisk Priority Number
PKBWKPolish language: Panstwowa Komisja Badan Wypadkow Kolejowych (Polish Committee for Railway Accidents Investigation)
CENELECEuropean Committee for Electro technical Standardization
PHAPreliminary Hazard Analysis
SRSSystem Requirements Specification
SRACSafety Related Application Condition
PN-ENPolish Norms – European Norms

References

  1. Szopa, T. Niezawodność i Bezpieczeństwo (Eng. Reliability and Safety); Warsaw Technical Universtiy: Warsaw, Poland, 2009. [Google Scholar]
  2. Aven, T. Misconception of Risk; University of Stavanger: Stavanger, Norway; John Wiley & Sons Ltd.: Hoboken, NJ, USA, 2010. [Google Scholar]
  3. Andrzej, L. Current and New Signalling Systems; TTS 2-3/2012; Research Institute: Radom, Poland, March 2012; pp. 28–35. [Google Scholar]
  4. Nancy, G. Leveson, Safeware. In System Safety and Computers; University of Washington, Addison Wesley: Boston, MA, USA, 1995. [Google Scholar]
  5. PKP PLK S.A. (Infrastructure Manager), Ie-113. Requirements for the Information Exchange System between Traffic Posts Employees Participating in the Service of the Railway-Road Crossing and the Employee in Charge of the Railway-Road Crossing; PKP PLK S.A.: Warsaw, Poland, 2015. [Google Scholar]
  6. Aven, T. On how to define, understand and describe risk. University of Stavanger, Norway. Reliab. Eng. Syst. Saf. 2010, 95, 623–631. [Google Scholar] [CrossRef]
  7. Aven, T. The risk concept—Historical and recent development trends. University of Stavanger, Norway. Reliab. Eng. Syst. Saf. 2012, 99, 33–44. [Google Scholar] [CrossRef]
  8. Elise, G.C.; Kift, R.L. Keeping track of railway safety and the mechanisms of risk. Saf. Sci. 2018, 110, 195–205. [Google Scholar]
  9. Commission Implementing Regulation of the European Commission No 402/2013 of 30 April 2013 on the Common Safety Method for Risk Evaluation and Assessment and Repealing Regulation (EC) No 352/2009. Available online: https://eur-lex.europa.eu/LexUriServ/LexUriServ.do?uri=OJ:L:2013:121:0008:0025:EN:PDF (accessed on 16 October 2019).
  10. Standard PN-EN 50126:2018 Railway Applications—Specification of Reliability, Accessibility, Maintainability and Safety; CEN-CENELEC Management Center: Brussels, Belgium, 2018.
  11. Standard PN-EN 50129:2007 Railway Applications—Communication, Data Processing and Traffic Control Systems—Electronic Systems of Traffic Control Related to Safety; CEN-CENELEC Management Center: Brussels, Belgium, 2007.
  12. Standard PN-EN 61508-1:2010 Functional Safety of Electrical/Electronical/Programmable Electronic Systems Related to Safety—Part 1: General Requirements; CEN-CENELEC Management Center: Brussels, Belgium, 2010.
  13. Fuchs, P.; Zajíček, J. Safety Integrity Level (SIL) versus full quantitative risk value. Maint. Reliab. 2013, 15, 99–105. [Google Scholar]
  14. Gulland, W.G. Methods of Determining Safety Integrity Level (SIL) requirements—Pros and Cons, Practical Elements of Safety; Springer: London, UK, 2004; pp. 105–122. [Google Scholar]
  15. Redmill, F.; Chudleigh, M.; Catmur, J. System Safety: HAZOP and Software HAZOP; John Wiley & Sons: Chichester, UK, 1999. [Google Scholar]
  16. Ericson, C.A., II. Hazard Analysis Techniques for System Safety; John Wiley & Sons: Hoboken, NJ, USA, 2005. [Google Scholar]
  17. Standard PN-EN 61882:2016-07 Studies of hazards and operability (HAZOP studies). In Application Guide; CEN-CENELEC Management Center: Brussels, Belgium, 2016.
  18. Hwang, J.; Jo, H. Hazard Identification of Railway Signalling System Using PHA and HAZOP Methods. Int. J. Autom. Power Eng. 2013, 2, 32–39. [Google Scholar]
  19. Baybutt, P. Calibration of risk matrices for process safety, Primatech Inc., Columbus, OH, USA. J. Loss Prev. Process Ind. 2015, 38, 163–168. [Google Scholar] [CrossRef]
  20. Baybutt, P. An improved risk graph approach for determination of safety integrity levels (SILs). Process Saf. Prog. 2006, 26, 66–76. [Google Scholar] [CrossRef]
  21. Zhang, W.; Lan, N.; Li, X. Estimation Technology of Safety Integrity Level of Safety-Related Systems in High Speed Train, School of Reliability and System Engineering, Beihang University. IERI Procedia 2012, 1, 172–177. [Google Scholar]
  22. Berrado, A.; El-Koursi, E.; Cherkaoui, A.; Khaddour, M. A Framework for Risk Management in Railway Sector: Application to Road-Rail Level Crossings. Open Transp. J. 2011, 5, 34–44. [Google Scholar] [CrossRef] [Green Version]
  23. Restel, F.; Wolniewicz, L. Tramway Reliability and Safety Influencing Factors. Procedia Eng. 2017, 187, 477–482. [Google Scholar] [CrossRef]
  24. Szmel, D.; Wawrzyniak, D. Application of FMEA Method in Railway Signalling projects. J. KONBiN 2017, 42, 93–110. [Google Scholar] [CrossRef] [Green Version]
  25. Standard PN-EN 60812:2009 System Fault Analysis Techniques Fault Modes and Effects Analysis (FMEA); CEN-CENELEC Management Center: Brussels, Belgium, 2009.
  26. Baybutt, P. On the completeness of scenario identification in process hazard analysis (PHA), Primatech Inc., Columbus, OH, USA. J. Loss Prev. Process Ind. 2018, 55, 492–499. [Google Scholar] [CrossRef]
  27. Standard PN-EN 61025:2007 Fault Tree Analysis (FTA). 2007. Available online: https://infostore.saiglobal.com/en-us/Standards/PN-EN-61025-2007-949989_SAIG_PKN_PKN_2232975/ (accessed on 16 October 2019).
  28. Standard PN-EN 62502:2011 Reliability Analysis Techniques Events Tree Analysis (ETA). 2011. Available online: https://shop.bsigroup.com/ProductDetail?pid=000000000030169893 (accessed on 16 October 2019).
  29. The State Committee for Railway Accidents, Ministry of Infrastructure and Construction, Annual Reports for 2011–2017 on the Activities of the State Committee for Railway Accidents; National Safety Authority: Warsaw, Poland, 2018.
  30. National Safety Authority Safety Report for Year 2018; Railway Transport Authority: Warsaw, Poland, 2019; ISBN 978-83-65709-35-6.
  31. Materials of Thales company (agreed to be presented in the paper as they are official documents)
  32. PKP PLK, S.A. SMS/MMS-PR-02 Technical and Operational Risk Assessment; PKP PLK S.A Procedure: Warsaw, Poland, 2014. [Google Scholar]
  33. Sobral, J.; Soares, C.G. Assessment of the adequacy of safety barriers to hazards. Saf. Sci. 2019, 114, 40–48. [Google Scholar] [CrossRef]
  34. Aven, T.; Kristensen, V. How the distinction between general knowledge and specific knowledge can improve the foundation and practice of risk assessment and risk-informed decision-making. Reliab. Eng. Syst. Saf. 2019, 119, 106553. [Google Scholar] [CrossRef]
  35. Le Coze, J.C. Safety as Strategy: Mistakes, failures and fiascos in high-risk systemas. Saf. Sci. 2019, 116, 259–274. [Google Scholar] [CrossRef]
  36. Jensen, A.; Aven, T. A new definition of complexity in risk analysis setting. Reliab. Eng. Syst. Saf. 2018, 117, 169–173. [Google Scholar] [CrossRef]
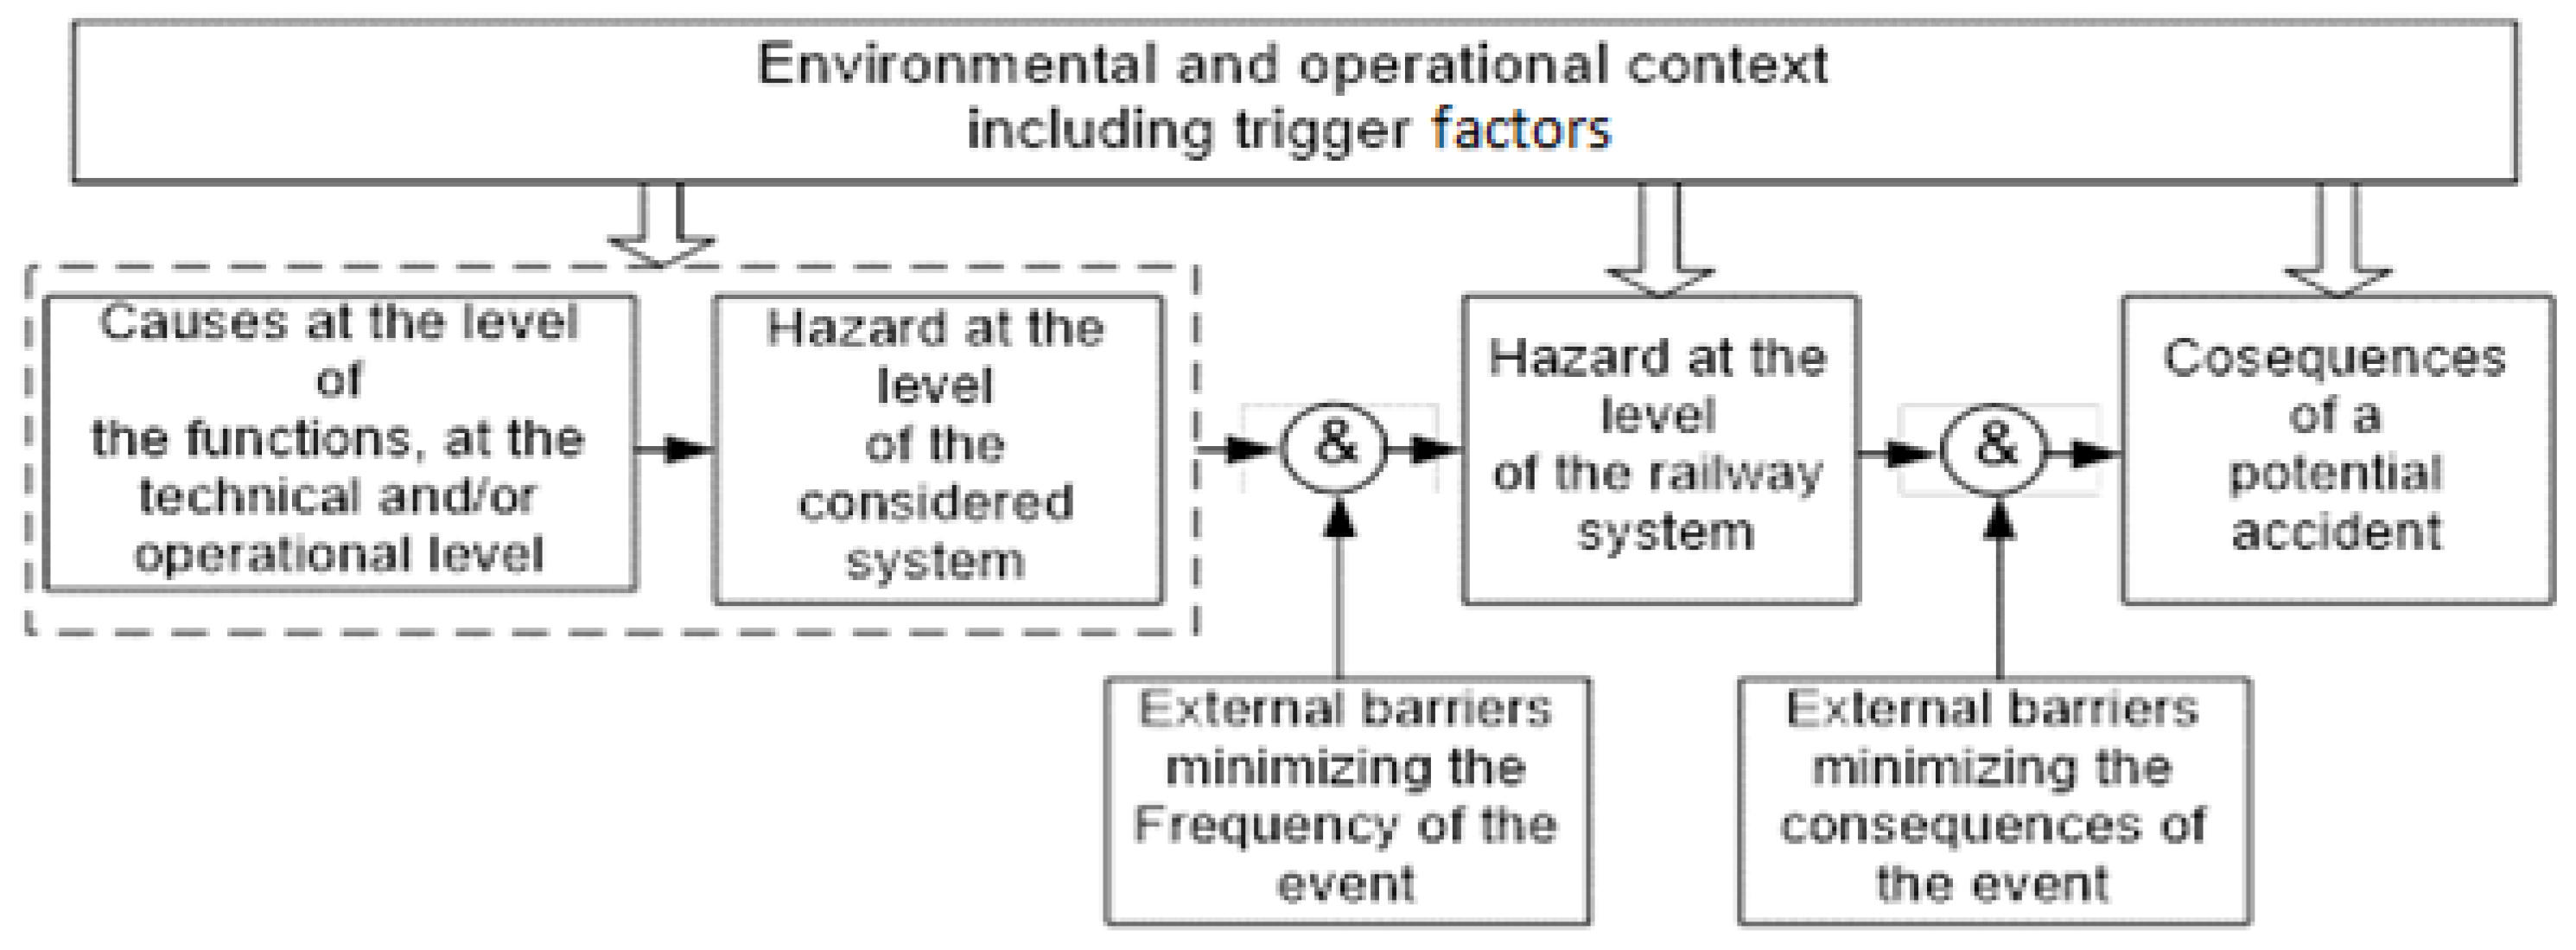
Figure 1. Example of a risk model (source: own work on the basis of [10]).
Sustainability 11 07062 g001
Figure 2. Risk graph (source: own work on the basis of [19]).
Sustainability 11 07062 g002
Figure 3. The share of the level crossing categories in Poland.
Sustainability 11 07062 g003
Figure 4. SWI system decomposition [28].
Sustainability 11 07062 g004
Figure 5. The example of the analysis with risk graph for a given function.
Sustainability 11 07062 g005
Table 1. Examples of the SWI system functions.
No.FunctionsNo. of Inf.Information
F1Informing the level crossing attendant that the train has been sent on trackInf_1Sending the message about the train sent on track
Inf_10Sending the confirmation of the receipt of the message about the train sent on track
Inf_12Confirmation of the closed level crossing for the train
Inf_23Confirmation of the train having passed
F2Revocation of the train departure from the stationInf_2Revocation of the message about the train departure from the station
Inf_11Confirmation of the revocation message
F6Suspension of shunting movement over the level crossingInf_04Sending the message about the shunting suspension
Inf_15Confirmation of the message about the shunting suspension
Table 2. Extract from HAZOP analysis.
No.Part of the SystemID_SRSFunctionSub-FunctionGuide WordEffectHazard
1SWI-PISRS_001F1 Informing the level crossing attendant that the train has been sent on trackInf_1 Sending the message about the train sent on trackLoss of functionIn emergency no possibility to inform usersSeveral possibilities
2Excess of functionLack of influenceNo fully operated panel
3Inverse of intended functionLack of influence -
4Function done too earlyLack of influence-
5Function done too lateLoss of functionWrong operation of panel can lead to event at level crossing
6Other than intended functionLoss of functionWrong operation of panel can lead to event at level crossing
7SRS-011F2 - Revocation of the train departure from the stationRevocation of the message about the train departure from the stationLoss of functionUnnecessary closing of the barriersLevel crossing closed.
8 Excess of functionUnnecessary opening of the barriers when train leftHazard: the train with higher then 20km/h at level crossing
9Inverse of intended functionSee aboveSee above
10Function done too earlyNo influence-
11Function done too lateUnnecessary closing of the barriersLevel crossing closed.
12Other than intended functionNo influence-
13 SRS-020F6 - Suspension of shunting movement over the level crossingSending the message about the shunting suspensionLoss of functionUnnecessary closing of the level crossing-
14Excess of functionPossible shunting movement over the level crossingTrain movement with speed higher than 20 km/h over the level crossing which is not closed
15Inverse of intended functionUnnecessary closing of the level crossing-
16Function done too earlyNo influence-
17Function done too lateUnnecessary closing of the level crossing-
18Other than intended functionNo influence-
19SRS-021Confirmation of the message about the shunting suspensionLoss of functionNo influence-
20Excess of functionPossible unnecessary speed limitation-
21Inverse of intended functionNo influence-
22Function done too earlyNo influence-
23Function done too lateNo influence-
24Other than intended functionNo influence-
Table 3. Exemplary result of the risk analysis for several functions.
ID_SRSSRS_001
FunctionInforming the level crossing attendant that the train has been sent on track
S – potential consequences of the eventIn the worst case, if the function breaks down, it is not possible to inform other users about the situation
S levelS3
E – exposureTraffic control procedures entail that the function is performed often
E levelE2
A – possibility to avoid or limit damagesIf the SWI communication module failed/broke down, users are obliged to use the level crossing communication (in accordance with Par. 8 p. 4 of the instruction Ie-113 [2]
A LevelA1
O – probability of the occurrence of the eventBy analyzing annual PKBWK reports [12], frequency of the occurrence of dangerous situations has been determined, a railway vehicle running into a road vehicle at level crossings cat. A accounts for 8 times/7 years, i.e., around once every year
Level OO1
Designated SIL4 (on the basis of the table from the standard [5] THR has been determined at the level of 10E-09≥ THR ≥ 10E-08
ID_SRSSRS-011
FunctionF2 - Revocation of the train departure from the station
S – potential consequences of the eventThe worst case is the train approaching the level crossing and operator do not close the barriers due to miscommunication
S levelS3
E – exposureRare exposure, because the revocation is not regular procedure
E levelE1
A – possibility to avoid or limit damagesThere is no possibility to avoid
A LevelA2
O – probability of the occurrence of the eventBy analyzing annual PKBWK reports [12], frequency of the occurrence of dangerous situations has been determined, a railway vehicle running into a road vehicle at level crossings cat. A accounts for 8 times/7 years, i.e., around once every year
Level O01
Designated SIL4 (on the basis of the table from the standard [5] THR has been determined at the level of 10E-09≥ THR ≥ 10E-08
ID_SRSSRS-020
FunctionSending the message about the shunting suspension
S – potential consequences of the eventTrain movement with speed higher than 20 km/h over the level crossing which is not closed
S levelS1
E – exposureRare
E levelE1
A – possibility to avoid or limit damagesIt is not possible to avoid the situation when train is already shunting in the area of the level crossing
A LevelA1
O – probability of the occurrence of the eventBy analyzing annual PKBWK reports [12], frequency of the occurrence of dangerous situations has been determined, a railway vehicle running into a road vehicle at level crossings cat. A accounts for 8 times/7 years, i.e., around once every year
Level OO1
Designated SIL2
ID_SRSSRS-021
FunctionConfirmation of the message about the shunting suspension
S – potential consequences of the eventPossible unnecessary speed limitation
S levelS0
E – exposure-
E levelNot applicable
A – possibility to avoid or limit damages-
A LevelNot applicable
O – probability of the occurrence of the event-
Level ONot applicable
Designated SILNo SIL assigned.