Review

Review of Methods for Documentation, Management, and Sustainability of Cultural Heritage. Case Study: Museum of King Jan III’s Palace at Wilanów

1
Documentation and Digitalization Department, Museum of King Jan III’s Palace at Wilanów, ul. Stanisłąwa Kostki Potockiego 10/16, 02-958, Warsaw, Poland
2
Faculty of Geodesy and Cartography, Warsaw University of Technology, Pl. Politechniki 1, 00-661 Warsaw, Poland
3
Department of Material Culture History, University of Wrocław, Szewska 49, 50-137 Wroclaw, Poland
4
Built Environment and Sustainable Technologies (BEST) Research Institute, Faculty of Engineering and Technology, Liverpool John Moores University, L3 3AF, Liverpool, UK
*
Author to whom correspondence should be addressed.
Sustainability 2019, 11(24), 7046; https://doi.org/10.3390/su11247046
Submission received: 13 November 2019 / Revised: 5 December 2019 / Accepted: 5 December 2019 / Published: 9 December 2019
(This article belongs to the Special Issue Technology-Powered Strategies for Sustainability of Cultural Heritage)

Abstract

:
All countries around the world are blessed with particularly rich cultural heritage. Nowadays, many researchers are exploring different methods for documentation, management, and sustainability of cultural heritage. The aim of this article is to review the state-of-the-art documentation, management, and sustainability techniques in the field of cultural heritage based on the case study in the Museum of King Jan III’s Palace at Wilanów. Various 2D/3D image and range-based methods are discussed demonstrating their applications and drawbacks. The geographical information system (GIS) is presented as a method for management, storage, and maintenance of cultural heritage documentation.

1. Introduction

The processes of contemporary social and cultural transformation have been undergoing profound changes in which the important role of cultural factors is increasingly being recognized. In this context, it is worth quoting the position of the Polish National Commission for UNESCO: “In the 21st-century of our era, the fundamental, although still developing and emerging, element of culture, which is the essence of sustainable development, has gained significance. A condition sine qua non for the concept of sustainable development to be fully implemented is its implementation in all societies. On the other hand, culture can be both a goal and a subject of development, as well as a means for such development, and a conditioning and directing regulator of development generated by individual causative factors” [1].
It should be noted that the 21st century approach to the protection of monuments, and cultural heritage in general, is radically different from the activities undertaken even a quarter of a century ago. At present, it is increasingly becoming an expression of an interdisciplinary approach to culture and its importance in the process of sustainable development. “Postmodernity” and “globalization” are the vectors that most often describe the dynamics of modern transformation processes. Among the most important changes affecting the perception and reception of culture as the third decade of the 21st century is approaching, one should certainly mention technological progress. It is radically changing the way information is created and transmitted, and it increases public participation in the processes relating to both culture in general and documenting monuments in particular. For example, advanced high-tech methods now allow for a non-invasive examination of a building’s condition.
The aim of this article, prepared by a multidisciplinary research group with representatives of both engineering sciences and humanities, is to demonstrate how modern technologies can change the current state of cultural heritage and contribute to its protection and promotion. Using the example of activities undertaken at the Museum of King Jan III’s Palace at Wilanów, the aim is to show that the development and popularization of culture can take place in accordance with the principles of sustainable development.

2. Sustainability in Cultural Heritage

The essence of alternative development known as “sustainable development” has become a fundamental element of modern culture—the culture of late modernity. It is worth remembering that sustainable development was a term that initially described only an economic perspective. Nowadays, it has gained a significantly broader interpretation, as a process that meets the needs of the present without compromising the ability of future generations to meet their own needs, and in which economic, cultural, social, and environmental aspects of sustainable development complement each other [2]. “The protection, promotion and maintenance of cultural diversity are an essential requirement for sustainable development for the benefit of present and future generations” (Article 2.6), which contribute to the development of social and cultural wellbeing for both individuals and collectives, and to sustaining creativity and vitality within cultures and institutions [3]. The inclusion of culture in development policy at all levels (local, national, regional, and international) contributes to the protection and promotion of the diversity of cultural expression, and also to the accessibility and participation of everyone.
It seems that the idea of the protection of cultural heritage being a factor slowing down economic development—something that has been present in the social mentality for generations– is falling out of favor, since both local authorities and private sector representatives are becoming increasingly aware that cultural heritage and its preservation can bring numerous economic benefits. Among these benefits there are the creation of income and jobs, opportunities for vocational training and the preservation of crafts, the revitalization of city centers, and an increase in tourism related to cultural heritage, all of which can lead to an increase in real estate value, the strengthening of small businesses, and other bonuses.
Numerous academic publications have contributed to the shift in this paradigm, as have national and EU programs that encourage the implementation of sustainable development politics in the cultural sector [4,5,6,7]. Sustainable development is now an area of interest for many international organizations, such as the United Nations Environment Program (UNEP) [8], United Nations Development Program (UNDP) [9], and the European Union institutions, such as the European Parliament, the European Commission, and the European Economic and Social Committee. Dedicated EU initiatives that address the issues of sustainable developments—such as Horizon 2020 [10] and the European Fund for Sustainable Development in the regions [11]—are also worth mentioning.
However, it is necessary to recognize cultural heritage as a valuable resource and an incentive for development in order to implement a strategy of sustainable development and improvement of the quality of life. Cultural heritage can contribute to the improvement of communities’ wellbeing and quality of life, it can help mitigate the effects of cultural globalization, and it can become a stimulus for sustainable economic development. The Museum of King Jan III’s Palace at Wilanów is a cultural center that attempts to carry out its tasks in accordance with the principles of sustainable development. A confirmation of this can be found in its statute, Article 5, which states that: “The purpose of the Museum is to preserve for the future generations the cultural heritage, namely the historic residence in Wilanów with its historical museum pieces, acquired collections and existing, within the institution and in its vicinity, historic buildings, gardens and parks with historical artistic designs and technical equipment” [12]. The Museum also conducts a number of activities that demonstrate the implementation of the principles of sustainable development in this institution. The first principle is a comprehensive educational mission led by the museum, which aims to bring visitors closer to the cultural heritage of Wilanów. This is implemented through such initiatives as themed lessons and outdoor events, as well as through extensive academic promotional activity on websites and social media channels. It is worth mentioning “The Passage to Knowledge”, an educational portal available on the museum’s website [13], where the museum publishes articles on Old-Polish history and culture by experts in various fields of knowledge such as academic communities, museologists, columnists, and opinion journalists. This makes “The Passage to Knowledge” a reliable source, offering some revealing insights into the Polish-Lithuanian Commonwealth as seen against the background of modern Europe.
The second area of the institution’s interest relates to the development of the wider Wilanów district—the palace’s neighborhood—for which the museum has been an active partner in maintaining the principles of sustainable development. This activity is carried out in three main areas: Development of public space, monument protection, and environmental protection. The palace’s surroundings in Wilanów provide exceptional wealth that, on the one hand, should be protected from increasing urbanization, while on the other hand should also be popularized and made accessible to the public. The institution also undertakes numerous initiatives aimed at protecting the natural environment—it is worth mentioning that the museum is the guardian of two historic parks: The Wilanów Park and the Morysin reserve, which includes a lake, a stream, and 13,000 trees. The Wilanów Palace Museum observes changes in the landscape of its surroundings and points out to investors engaging their capital in its vicinity that the implementation of the principle of sustainable development in their own spatial and ownership structure is the fundamental requirement.
Also, among the museum’s activities that have an impact on environmental sustainability (understood as respect for the natural environment) are those initiated and undertaken by the museum itself, often carried out thanks to external funding. It should be noted that the 90-hectare terrain that makes up the palace’s estate features a rich natural area including a historic park and garden, as well as 32 historic buildings. Therefore, the museum initiates a range of historical and archaeological research works, often using innovative technologies, necessary for the efficient management of a large and varied cultural site and maintaining its historic nature. Some of these will be presented further in this paper, which will aim to demonstrate new approaches for studying and managing cultural heritage sites, and in turn allow a broader view and verification of contemporary paradigms of working with monuments.

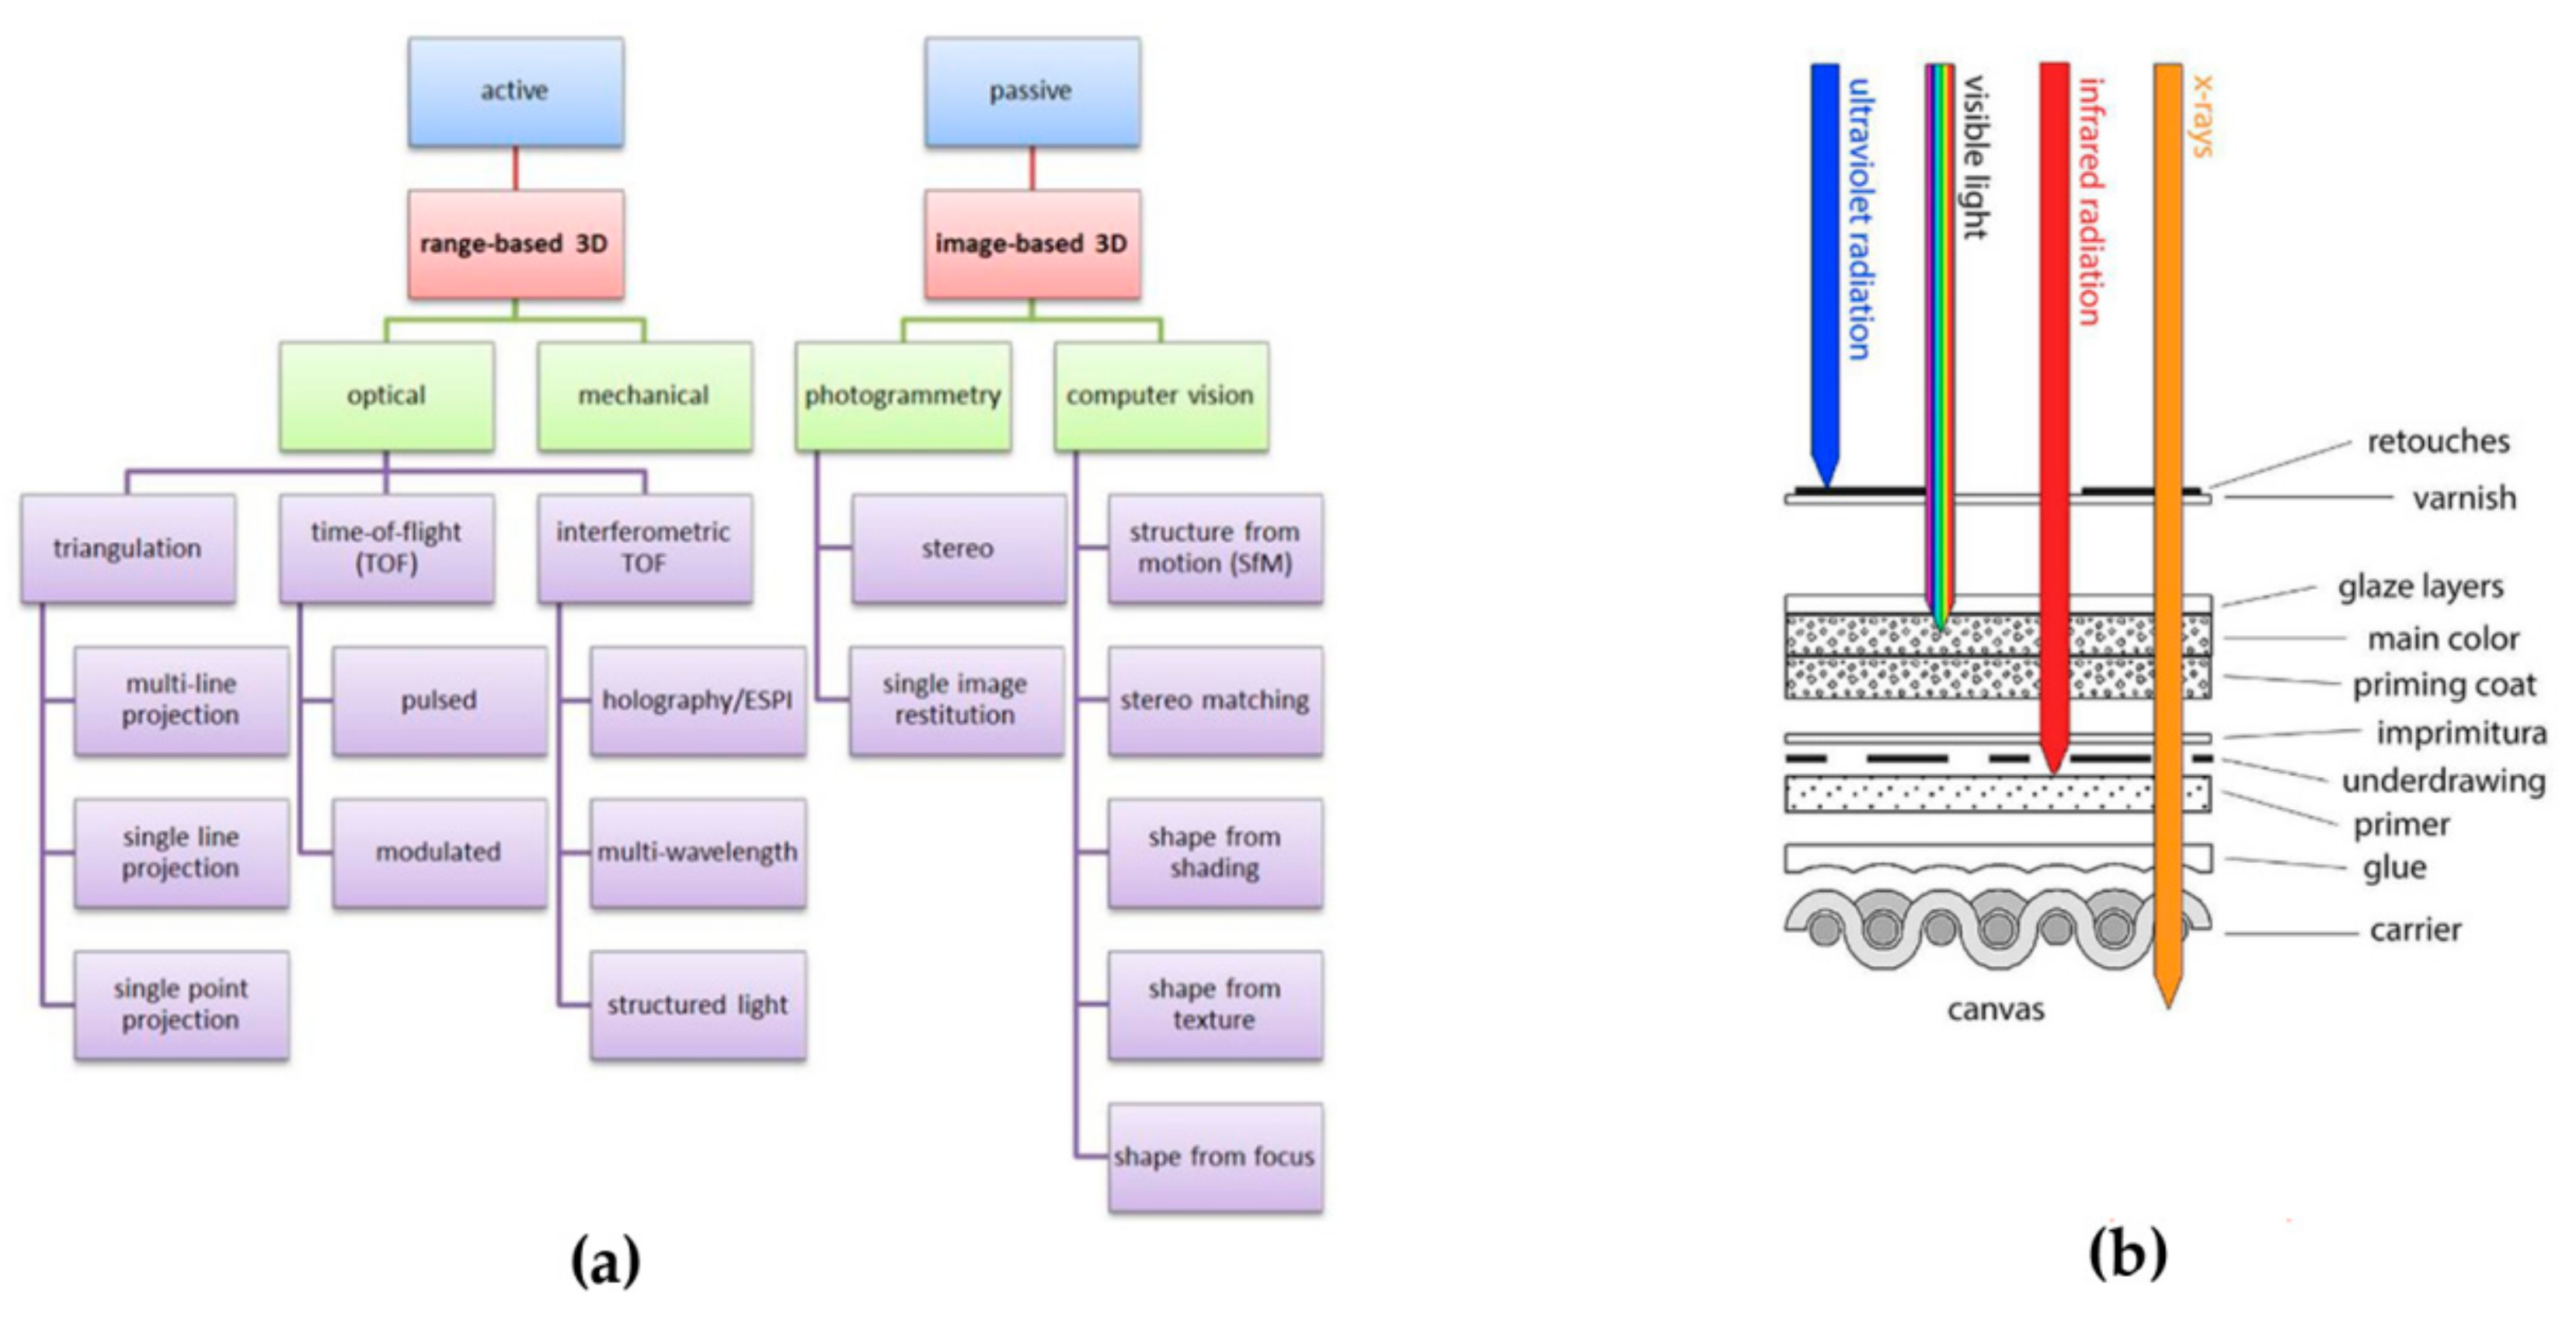
3. The 2D/3D Image- and Range-Based Methods Used for Cultural Heritage Objects Documentation

In order to prepare appropriate and accurate architectural and archaeological documentation for management and suitability of culture heritage objects, it is necessary to define the aims and scopes of further work on this type of documentation as well as to be aware of the possibilities and limitations of applied measuring techniques. Nowadays, there is no versatile standard or one methodology for architectural documentation preparation. However, different organizations such as Comité International de la Photogrammétrie Architecturale (English: International Committee of Architectural Photogrammetry) and The London Charter for the Computer-based Visualization of Cultural Heritage or national organizations such as National Heritage Board of Poland or Department for Digital, Culture, Media, and Sport in the United Kingdom prepare their own regulations [14,15,16]. Currently, digital architectural documentation can be divided into the two main groups: Geometric documentation (Figure 1a) representing the object’s shape for measuring purposes (i.e., site plans, sections, elevations, three-dimensional models) i.e., [17] and documentation based on remote sensing observations (Figure 1b) i.e., [18,19]. There are many active and passive measuring techniques [20]. Passive 3D (Figure 1a) shape reconstruction techniques are based on recording of reflected ambient radiation and they do not involve the emission of any kind of radiation by applied measuring device. Computer vision algorithms are used for image analysis and processing such as:
  • For the detection of corresponding primitives extracted from images, which are converted into 3D point cloud using the mathematical model (photogrammetry, computer vision– Structure-from-Motion, and Stereo Matching) [21];
  • For the computation of the shape, which relies on the analysis of the changes of the image intensity, texture, or focus [22]. Another group of 3D shape reconstruction techniques is active range-based, which are focused on the analysis of the sent and received electromagnetic waves [23].
Another category of documentation methods is the remote sensing techniques (Figure 1b), which are commonly based on observations performed indifferent wavelength ranges: Infrared (800–2000 nm), ultraviolet (300–400 nm), and X- or even γ-ray range (< 1 nm). Unlike the 3D shape reconstruction methods, these techniques are not used for 3D shape reconstruction but mostly for the analytic purposes, e.g., to examine and visualize the object’s features [24].
Selection of an appropriate method for 3D shape reconstruction depends on many factors such as the objective of the inventory, the object’s size, the complexity of architectural design, the object’s accessibility, required terms, and accuracy of work [1]. With the aim to complement the documentation of old buildings, historic walls, or other cultural heritage objects, image-based (Structure-from-motion/photogrammetry) as well as range-based (e.g., terrestrial laser scanning) techniques are commonly used [25,26,27]. The structural health and the condition of the object can be monitored and analyzed using remote sensing/electromagnetic sensors (based on the acquisition of spectral reflectance at different wavelength ranges). These methods make it possible to obtain the data and information about the object, which usually cannot be seen with the naked eye. The results of photogrammetric surveying (TLS and Structure-from-motion/photogrammetry) are products, namely base maps, vector drawings, point clouds, digital object models, and 3D models orthoimages in different spectral ranges. For data storage, management, and analysis, geographic information systems (GIS) and building information modelling (BIM)/historical building information modelling (HBIM) are frequently used [28,29].
This section will cover the review of methods applied in cultural heritage documentation, management, and sustainability followed by the presentation of existing state-of-the-art sensors together with the discussion considering their advantages and disadvantages as well as possible further improvements.

3.1. Classical Surveying

Classical surveying is commonly used for ground-truth data acquisition and as such is treated as a reference for other image-based and range-based measurements. It should be noted that this technique is also used to measure object’s shape and to determine its location on the Earth’s surface. In order to determine the point position, classical surveying based on total station measurements and levelling is performed. Distances and angles are measured with the aim to specify the point’s position in space and therefore, to calculate its plane coordinates. Additionally, to determine the point’s height, one must measure the distance between the point and the reference surface (or reference points of known height) along the vertical. X, Y, and Z coordinates may be determined directly either via tacheometric surveying (with reference to known coordinates of geodetic network points) or by using GNSS (global navigation satellite systems) measurements—RTK (real time kinematic). Among several types of geodetic measurements, topographic surveying and engineering surveying [30] can be identified. According to the authors of [30], topographic surveying deals with generation of maps at various scales, supporting a variety of uses starting with reconnaissance assisting flood management in civil engineering, mapping spatially changing features (e.g., changes in wetland perimeter in environmental monitoring), ending with soil type maps supporting land management decisions.
Map making is a great support for cultural heritage [31]. The map scale and its level of detail depends on the purpose of its creation and tasks to which it will be applied. Preparing a map concerning cultural heritage objects usually is preceded by the object’s inventory, i.e., the exact determination of its shape and position in relation to other objects in space. Two main types of object inventory can be distinguished: Architectural inventory and archaeological inventory. Architectural inventory involves preparing a very detailed object documentation including cross sections, floor plans, sanitary and electrical fittings, and plumbing inside and outside the building, together with mapping the damaged areas. On the other hand, archaeological inventory involves surveys carried out during excavations and other archaeological works.
Base maps for design purposes are substantial for management of cultural heritage objects. This type of a map is usually made prior to scheduled renovation works or planned investments. Apart from topographic features, it contains other elements required by the designer, e.g., the inventory of green areas or garden irrigation installations.
A fundamental part of any geodetic survey is the establishment of a control network. Geodetic control network consists of a mathematically specified set of points, which coordinates are specified in a chosen reference system. Control networks may be divided into several types, which are further described in Latoś [32]. Furthermore, depending on the level of detail of performed work various accuracy requirements are stated starting from several millimeters [33] up to several centimeters.
In contrast to the aforementioned topographic surveying, engineering surveying deals mainly with construction and deformation monitoring in industrial and built environment [30]. However, measurements of deformations and displacements may be successfully applied in the field of cultural heritage [34]. The main purpose of such measurements is the preservation of cultural heritage objects including damage prevention and evaluation of their technical state in order to ensure their safety. There are several methods of displacement and deformation measurements. Some of them are based on classical geodetic surveys (precise levelling, precise angular, and linear measurements and GNSS observations). The second group of methods involves the use of devices like inclinometers, load cells, feeler gauges, and fiber-optic-based sensors [35,36,37].
In the Museum of King Jan III’s Palace at Wilanów, the master map (Figure 2) is a basic spatial reference and a source of data supplying the geographic information system (GIS) functioning in the museum. The master map has been developed throughout many years and is updated on a regular basis. This allows for the monitoring of changes occurring in the museum area and its surroundings. Alongside topographic features, many other objects, facilities, and phenomena are mapped for current needs of the institution, e.g., irrigation installations located in the gardens, paths (with current evaluation of their technical state derived from the inventory), plants, and trees in the park, and other features.
The development of GIS is also supported by data from architectural documentation and building inventories. Floor plans, cross-sections, and elevations are the source of geometry and descriptive data for spatial objects in the database. The abovementioned documentations are frequently used as a background for project documentation prepared for planned refurbishment, new facility installation, or restoration works. In addition, it is necessary to record archaeological works properly because the museum is located in a historic area. Figure 3 shows exemplary architectural and archaeological documentation stored in the museum.
The abovementioned documentation (both current and archival) is essential for the development of the GIS and can be used as a basis for the creation of building information model (BIM) and historic information model (HBIM) in the future.

3.2. Terrestrial Laser Scanning (TLS) and Close-Range Photogrammetry

Reliable documentation is essential for proper management and preservation of cultural heritage objects and sites. Due to the rapid development of modern photogrammetric methods, the preparation of architectural documentation has become easier than ever. As a result, object documentation based on terrestrial laser scanning (TLS) and photogrammetry has become a standard in investigation and restoration of historical objects and sites. The pipeline of preparation of architectural documentation based on photogrammetry and TLS contains the following steps: (1) Preparatory works, (2) data acquisition—scanning and image taking, (3) data pre-analysis, (4) data processing, and (5) final products generation [23,38].
To carry out the preliminary work, the fieldwork including scans acquisition or obtaining images is necessary. Firstly, it is essential to familiarize with the requirements of the project in order to select appropriate equipment and methodology for data processing. This step determines the accuracy and completeness of the resulting documentation. The next step is to analyze the design assumptions and the subject of measurement, which includes planning of the scanner and camera positions to minimize the risk of blind spots (lack of data), bearing in mind the strengths and limitations of applied surveying methods. In the following subsection, the advantages and disadvantages of TLS and close-range photogrammetry are covered.

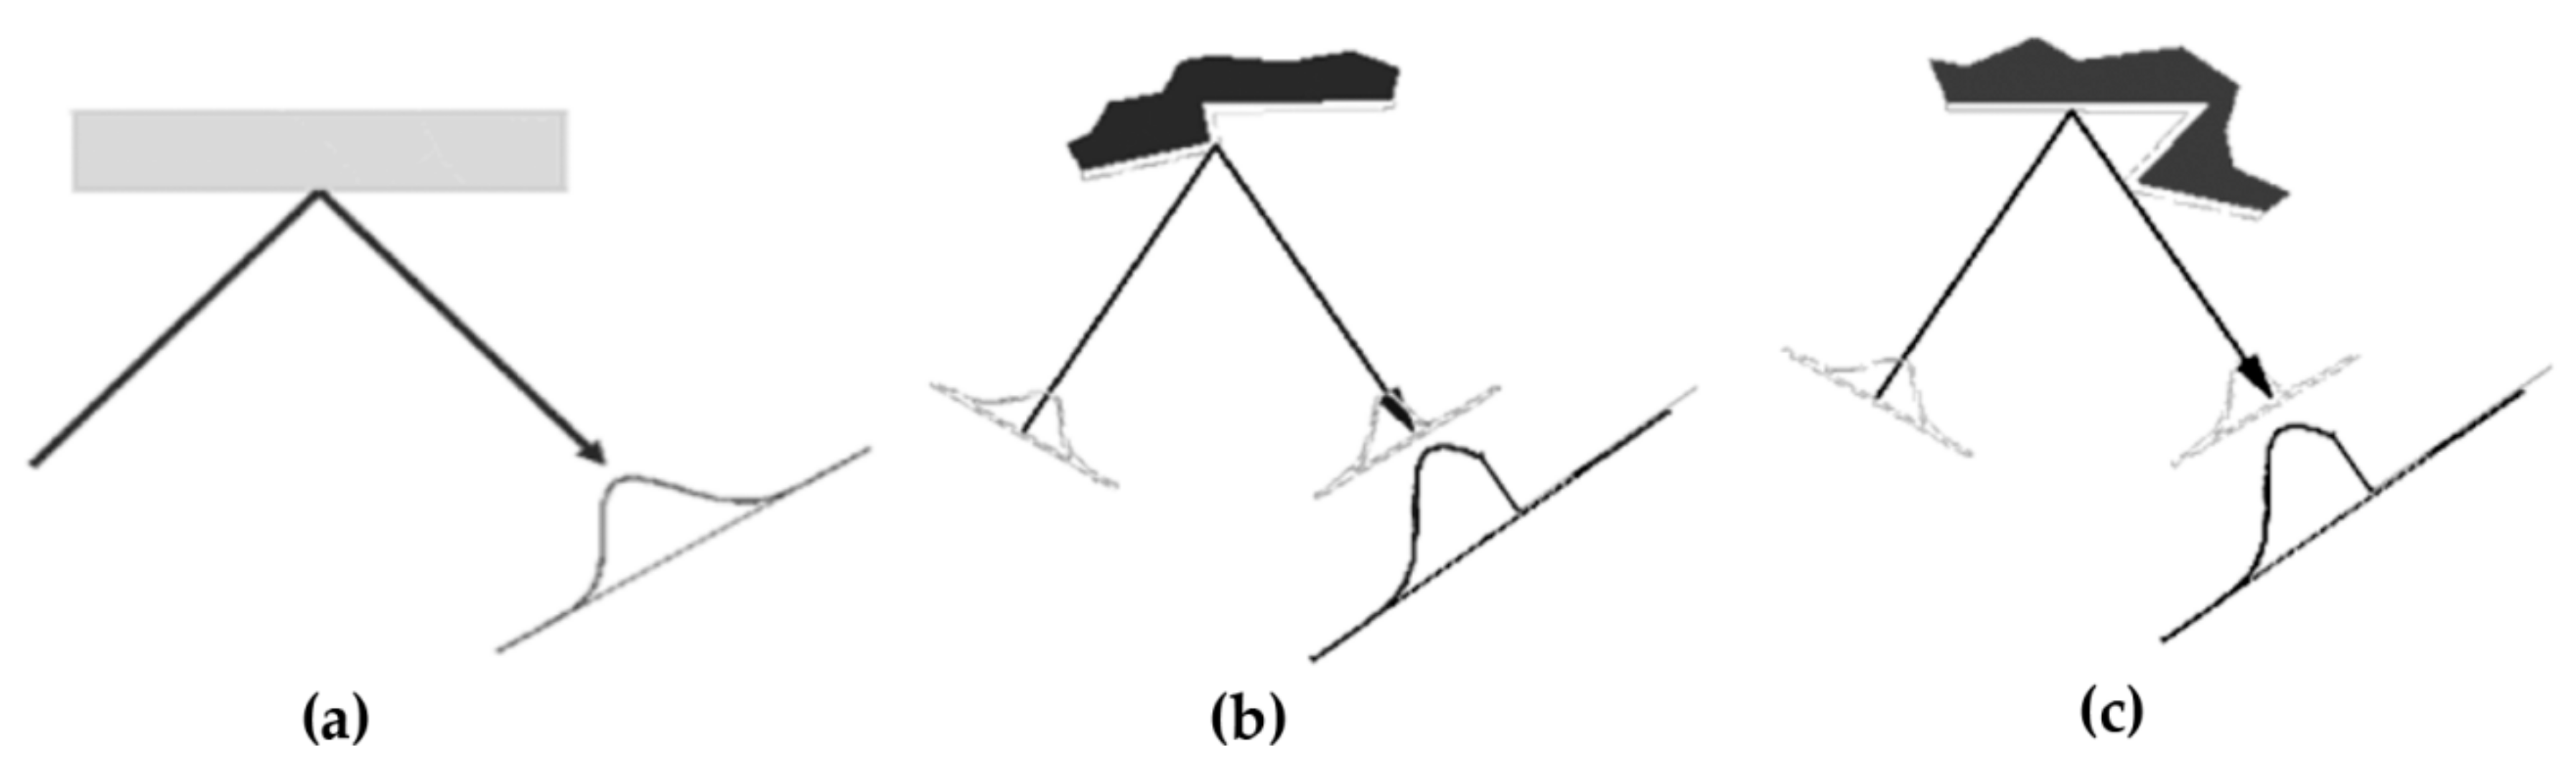
3.2.1. Terrestrial Laser Scanning

Nowadays, terrestrial laser scanning (TLS) is one of the most important techniques applied for the 3D investigation of historical objects and monuments. The unquestionable assets of this technology are its high accuracy, the possibility of measuring billions of 3D points, and high level of measurements automation [39]. Terrestrial laser scanning is a 3D measurement technique based on laser beam deflection [39]. Modern TLS devices consist of three main components: (1) A rotary mirror, which collects data at different heights and from different directions, (2) a laser source that sends and receives the signal, and (3) the data storage module.
In the case of terrestrial electro-optical scanners, the source of information is provided by a laser beam. Based on this dependence, the distance and both vertical and horizontal angles are measured. As a result of computation performed by the computer, the point cloud is generated in the structured hierarchical way. The measurement of the distance from the scanner to the examined point can be performed in two ways. The first one is called TOF (time of flight) or LIDAR (light detection and ranging) measurement and is based on the determination of the time of flight of the beam travelled from the instrument to the object and returned to the instrument. The second one is based on the measurement of the phase shift of the wave sent by the instrument—this kind of distance measurement is performed by so-called phase-shifted scanners. The mathematical method of determination of the point position is based on the so-called polar coordinates. In addition, the fourth parameter is recorded—the intensity of the returning light signal sent by the scanner, which can be used to investigate properties of the analyzed object [40]. The intensity (often in the near-infrared wavelength range) is presented in an artificial palette of grey or in natural RGB (red, green, and blue) colors. In some scanners, a built-in camera takes images assigning RGB values to each point of the cloud.
TLS allows for the collection of a large amount of information rapidly and with a high degree of detail. Laser scanning systems can obtain data that can vary in terms of point density, field-of-view (FOV), the amount of noise, incident angle, waveform, and texture information [41], but the main advantage is the possibility to measure un-textured areas. Despite that, during the TLS survey several problems and errors influencing the acquisition accuracy and final documentation might occur.
Similar to measurements performed with geodetic instruments, data acquired by terrestrial laser scanners are affected by errors related to both the equipment used and the measurement environment [42,43,44,45,46,47,48,49]. Each manufacturer of laser scanners provides the user with the information about the device’s achievable accuracy in technical specifications. However, it should be noted that tests performed on scanners take place in laboratory conditions and, therefore, the information on the instrument’s accuracy provided by the manufacturer should not be considered permanent, as it depends on both operating conditions and a specific series of manufactured devices. As a result, while using different types of scanners, the same point cloud accuracy of the measured object cannot be guaranteed. Available literature describes a number of methods applied for testing shape mapping accuracy [42,43,44,45,46,47,48,49].
According to literature, different methods of division of TLS errors based on different criteria can be distinguished, i.e., [42,44,45,46]. In Table 1, the division of TLS errors was presented.
As it can be seen in Table 1, there are many factors causing errors affecting terrestrial laser scanner measurements. The elimination of some of them, e.g., instrumental errors, is possible thanks to the instrument calibration or by applying corrections to measured angles and distances [51]. Errors related to the observer’s mistakes and their impact on processing accuracy and the development of final products can be largely minimized by introducing the highest possible level of measurement and data processing automation. In order to characterize the errors occurring during the measurement with the terrestrial laser scanner, the division proposed by Lichti and Gordon [50] was used.
a)  Internal errors
The first group of errors affecting the quality, accuracy, and completeness of photogrammetric documentation are instrumental errors. Considering the applied measurement method and the equipment used, instrumental errors are classified as systematic and random errors. One of the most important factors influencing the accuracy of determined points location in three-dimensional space is the accuracy of distance measurement [50], which is affected by both systematic and random errors [53].
Another type of error is related to the laser beam propagation. For instance, the size of the laser beam (so-called divergence) increases with the increase of the scanning distance. This phenomenon significantly affects the uncertainty of determined point position and decreases the scanning resolution [54]. It is assumed that the reflection of the laser beam from the object is expressed approximately by the Gaussian distribution. In case of large distances, it is stated that the beam divergence is approximately linear, and the position of a given point is determined on the basis of the Gaussian distribution of the laser beam reflection intensity for values no less than 86% of the total beam power [55]. Due to refraction and reflection of the laser beam from various surfaces, the return of the signal to the receiver may be fully or partially complete. The occurrence of such a situation affects the angular accuracy and correctness of the point location (Figure 4).
The phenomena of reflection and divergence of the laser beam affect the accuracy of angular point mapping. The position of the laser beam is determined along the center of the mapped laser spot despite the fact that the theoretical position of the point should be in the center of the incident laser dot (footprint). It is assumed that the accuracy of determining the point location is equal to one-quarter of the diameter [50].
Errors related to the refraction of the laser beam at the edges are called the mixed edge problem [23]. When the laser beam hits the edge of the object, it “splits” into two parts, one of which returns to the receiver after reflection from the edge (Figure 5). The rest of the beam travels further until it is reflected from the first surface it encounters. As a result of such measurement, for each single signal sent, different values of the distance between the surface of the tested object and the scanner are obtained. The determination of distance of the scanner from the measured surface is based on the average value, hence the accuracy of the point location is burdened with errors and it may turn out that the measured distance value is not on the desired plane but lies somewhere in between. The expected error value can range from single millimeters up to several centimeters [46]. In the case of using close-range scanners and high scanning resolutions, the risk of this type of error increases the formation of a rare line of points on edges (Figure 5c,d) or their irregular arrangement.
The described problem can be reduced only by using scanners emitting a laser beam with a smaller diameter, which unfortunately also translates into a shorter measurement range (distance). So far, the problem of shape mapping errors has not been solved unequivocally, so it cannot be ignored during the measurements. While measuring with a terrestrial laser scanner, the distance between the tested object and the instrument is determined, as well as vertical and horizontal angles are measured. There are two more error groups associated with angle measurement: (1) Encoder reading error related to the scanning resolution affecting the accuracy of vertical and horizontal line mapping and (2) errors caused by lack of instrument calibration. These include collimation and inclination errors, which can be determined within the calibration process analogous to the total station calibration. The impact of collimation and inclination errors has been presented in many works, among others [57,58,59,60,61].
b)  External errors
The second category of errors is external errors. One of the most important factors associated with the mapping of the measured surface is the laser beam reflection intensity, which can be treated as a ratio of the reflected intensity value to the value of sent laser beam. The intensity of laser beam reflection is affected by the material of which the object was made, the object’s color, used wavelength, the size of the laser spot, the angle of incidence of the laser beam, surface roughness/smoothness, light polarization, temperature of the tested object, and moisture content. Lambert’s law describes the reflection from the tested surface, and thus the dependence of light propagation in different directions. The laser beam is affected directly and proportionally by the type of medium, the reflection coefficient of the measured wave, and the angle of incidence of the beam on the tested surface. The intensity of the laser scanner signal reflection (in near infrared) is similar to natural color perception; which means that the darker is the color of the scanned object, the weaker is the reflection of the beam. According to this principle, white objects are reproduced better than black ones. Figure 6a presents the original object color pattern with partially applied result of measurement (various shades of grey).
The reflection intensity directly affects the measurement accuracy. For example, the manufacturer of Z + F laser scanner says that in the case of measuring a perfectly black surface, the obtained accuracy is 3 times lower than in the case of a white surface. In the publication, Markiewicz and Zawieska [62] present the influence of color on the received values of the laser beam reflection intensity investigated for the short-range Z + F 5006h scanner. In order to assess the quality of obtained intensity, depending on the distance and color of the scanned surface, a number of test field measurements (DatacolorSpyder CHECKER) were carried out. The relationship between the intensity of laser beam reflection and the plane mapping accuracy was also examined. The test confirmed that light colors (Figure 7a) are reproduced with a higher intensity value (the grayscale image is lighter; Figure 7b) while darker colors are characterized by a lower intensity value (the grayscale image is darker).
In addition, the graph (Figure 8) illustrates the relationship between the intensity value (x-axis) and the determined reference plane mapping error (y-axis). Furthermore, a trend line in the form of a power function was fitted with the coefficient R2 = 0.7867.
The vertical line (Figure 8) indicates the threshold of the minimum intensity value automatically treated by the scanner software as too low and consequently skipped in further studies (so-called filtration) [62].
Another problem that might occur when an object, which contains the reflectance or partly reflectance fragments, is measured in the low intensity reflectance. This results in data gaps within the point cloud (Figure 9). In the case of high-reflectivity surfaces, the reflected laser beam does not reach the detector, and therefore the locations of points are incorrectly determined [21] (Figure 10).
Another issue significantly affecting the accuracy of mapping objects is the material translucency. One example of a partially translucent material commonly present in cultural heritage objects is marble. The laser beam sent is only partially reflected from the surface, while the remaining part of the beam penetrates deeper into the material. The translucency of materials significantly influences distance measurement and is responsible for the formation of so-called “the effect of measuring too large a distance” and the systematic shift of the measured surface [62].

3.2.2. Close-Range Photogrammetry

Modern image-based close-range photogrammetry based on the combination of structure-from-motion (SfM) and multi-view stereo (MVS) allows for digital reconstruction of the object with the required accuracy and high level of detail [64,65,66]. The main goal of this combined approach is to produce metric documentation in a fully automated 3D reconstruction process involving simultaneous estimation of camera orientation, self-calibration, and dense point cloud generation [4].The SfM method, generally used for image orientation, is based on four main steps [67,68,69]: (1) Detection of key-points (characteristic points) using computer vision (CV) algorithms such as SIFT or SURF [70,71]; (2) description of the detected key-points [70,71]; (3) preliminary image point matching; and (4) reconstruction of the geometry of acquired image net and geo-referencing data in an external coordinate system (e.g., national coordinate system) either by using reference points (measured with GNSS or by classic surveying with total station) or known camera locations, via iterative bundle adjustment. The MVS method is used for dense point cloud generation e.g., [27,63,71,72].
Three-dimensional shape reconstruction systems, which are based on digital images and utilize CV algorithms to create three-dimensional models automatically are still being developed (e.g., [66,72,73,74,75,76]). The idea of a photogrammetric image-based approach is to establish correspondences between primitives extracted from minimum two (but usually more) images. These corresponding primitives are converted into a 3D point cloud using the mathematical model [20]. The main aspect connected with the image-based method is the image correlation, which is the most important issue during the process of 3D reconstruction as it affects the quality and accuracy of the photogrammetric elaboration. This matter has been studied for more than 30 years, but still many problems exist such as lack of full automation and errors resulting from occlusions, poorly textured or un-textured areas, repetitive structures/patterns, etc. [73]. The main disadvantage of the image matching method regarding objects of uniform texture is the impossibility to find homologous points in order to reconstruct the 3D shape. To reduce the influence of mentioned problems and generate dense and accurate point cloud, the camera’s stations should be properly distributed. In the process of photogrammetric network design, a set of rules on how to collect images, where to set up camera positions, or how many images to capture should be fulfilled. According to the literature [64,77,78,79], these factors are:
  • The base-to-depth (b/d) ratio: The network accuracy increases with the increase of this ratio and using convergent images rather than images with parallel optical axes.
  • The number of captured images: The accuracy improves significantly with the increasing number of images where a certain point appear, but measuring the point in more than four images gives less significant improvement.
  • The number of the measured points in each image: The accuracy increases with the number of measured points per image, however the increase is not significant when the geometric configuration is strong and the points being measured are well defined (like targets) and well distributed over the image. In addition, this fact can be applied to the utilized control points.
  • The image resolution (number of pixels): In case of natural features, the accuracy improves significantly with the image resolution, while the improvement is less significant on well-defined largely resolved targets.

3.2.3. The Integration of Image-Based and Range-Based Techniques

Both image-based and range-based measuring methods are burdened with specific errors, which have negative impact on measurements accuracy. Accuracy requirements for photogrammetric documentation prepared for cultural heritage objects and sites are still growing. On the other hand, objects of this kind usually consist of elements of various textures, shapes, and materials, posing a great challenge for any method of documentation. In this case, the best results are possible to obtain by applying the integration of complementary methods and multisource data [39]. Laser scanning performs 3D measurements of such objects within a short time, but at the same time, does not allow for correct determination of the locations of all details. Dense point clouds generated from images may complement point clouds obtained by TLS (Figure 11 and Figure 12) [80,81].
Based on performed experiments and research works presented in [21,81], several practical comments regarding the use of TLS and matching of digital images in cultural heritage analyses and documentation can be made:
  • Terrestrial laser scanning is preferred for processing of these historical objects or their parts, which do not have an explicit texture;
  • The use of TLS is limited not only by the way this method works, but also by the size and weight of the device and resulting impossibility to locate the scanner in an arbitrary place. The use of a block of terrestrial images characterized by relevant geometry can be an alternative solution;
  • The block of terrestrial photographs ought to be acquired in relevant illumination conditions, in order to obtain results of high accuracy. However, it is important to avoid reflexes;
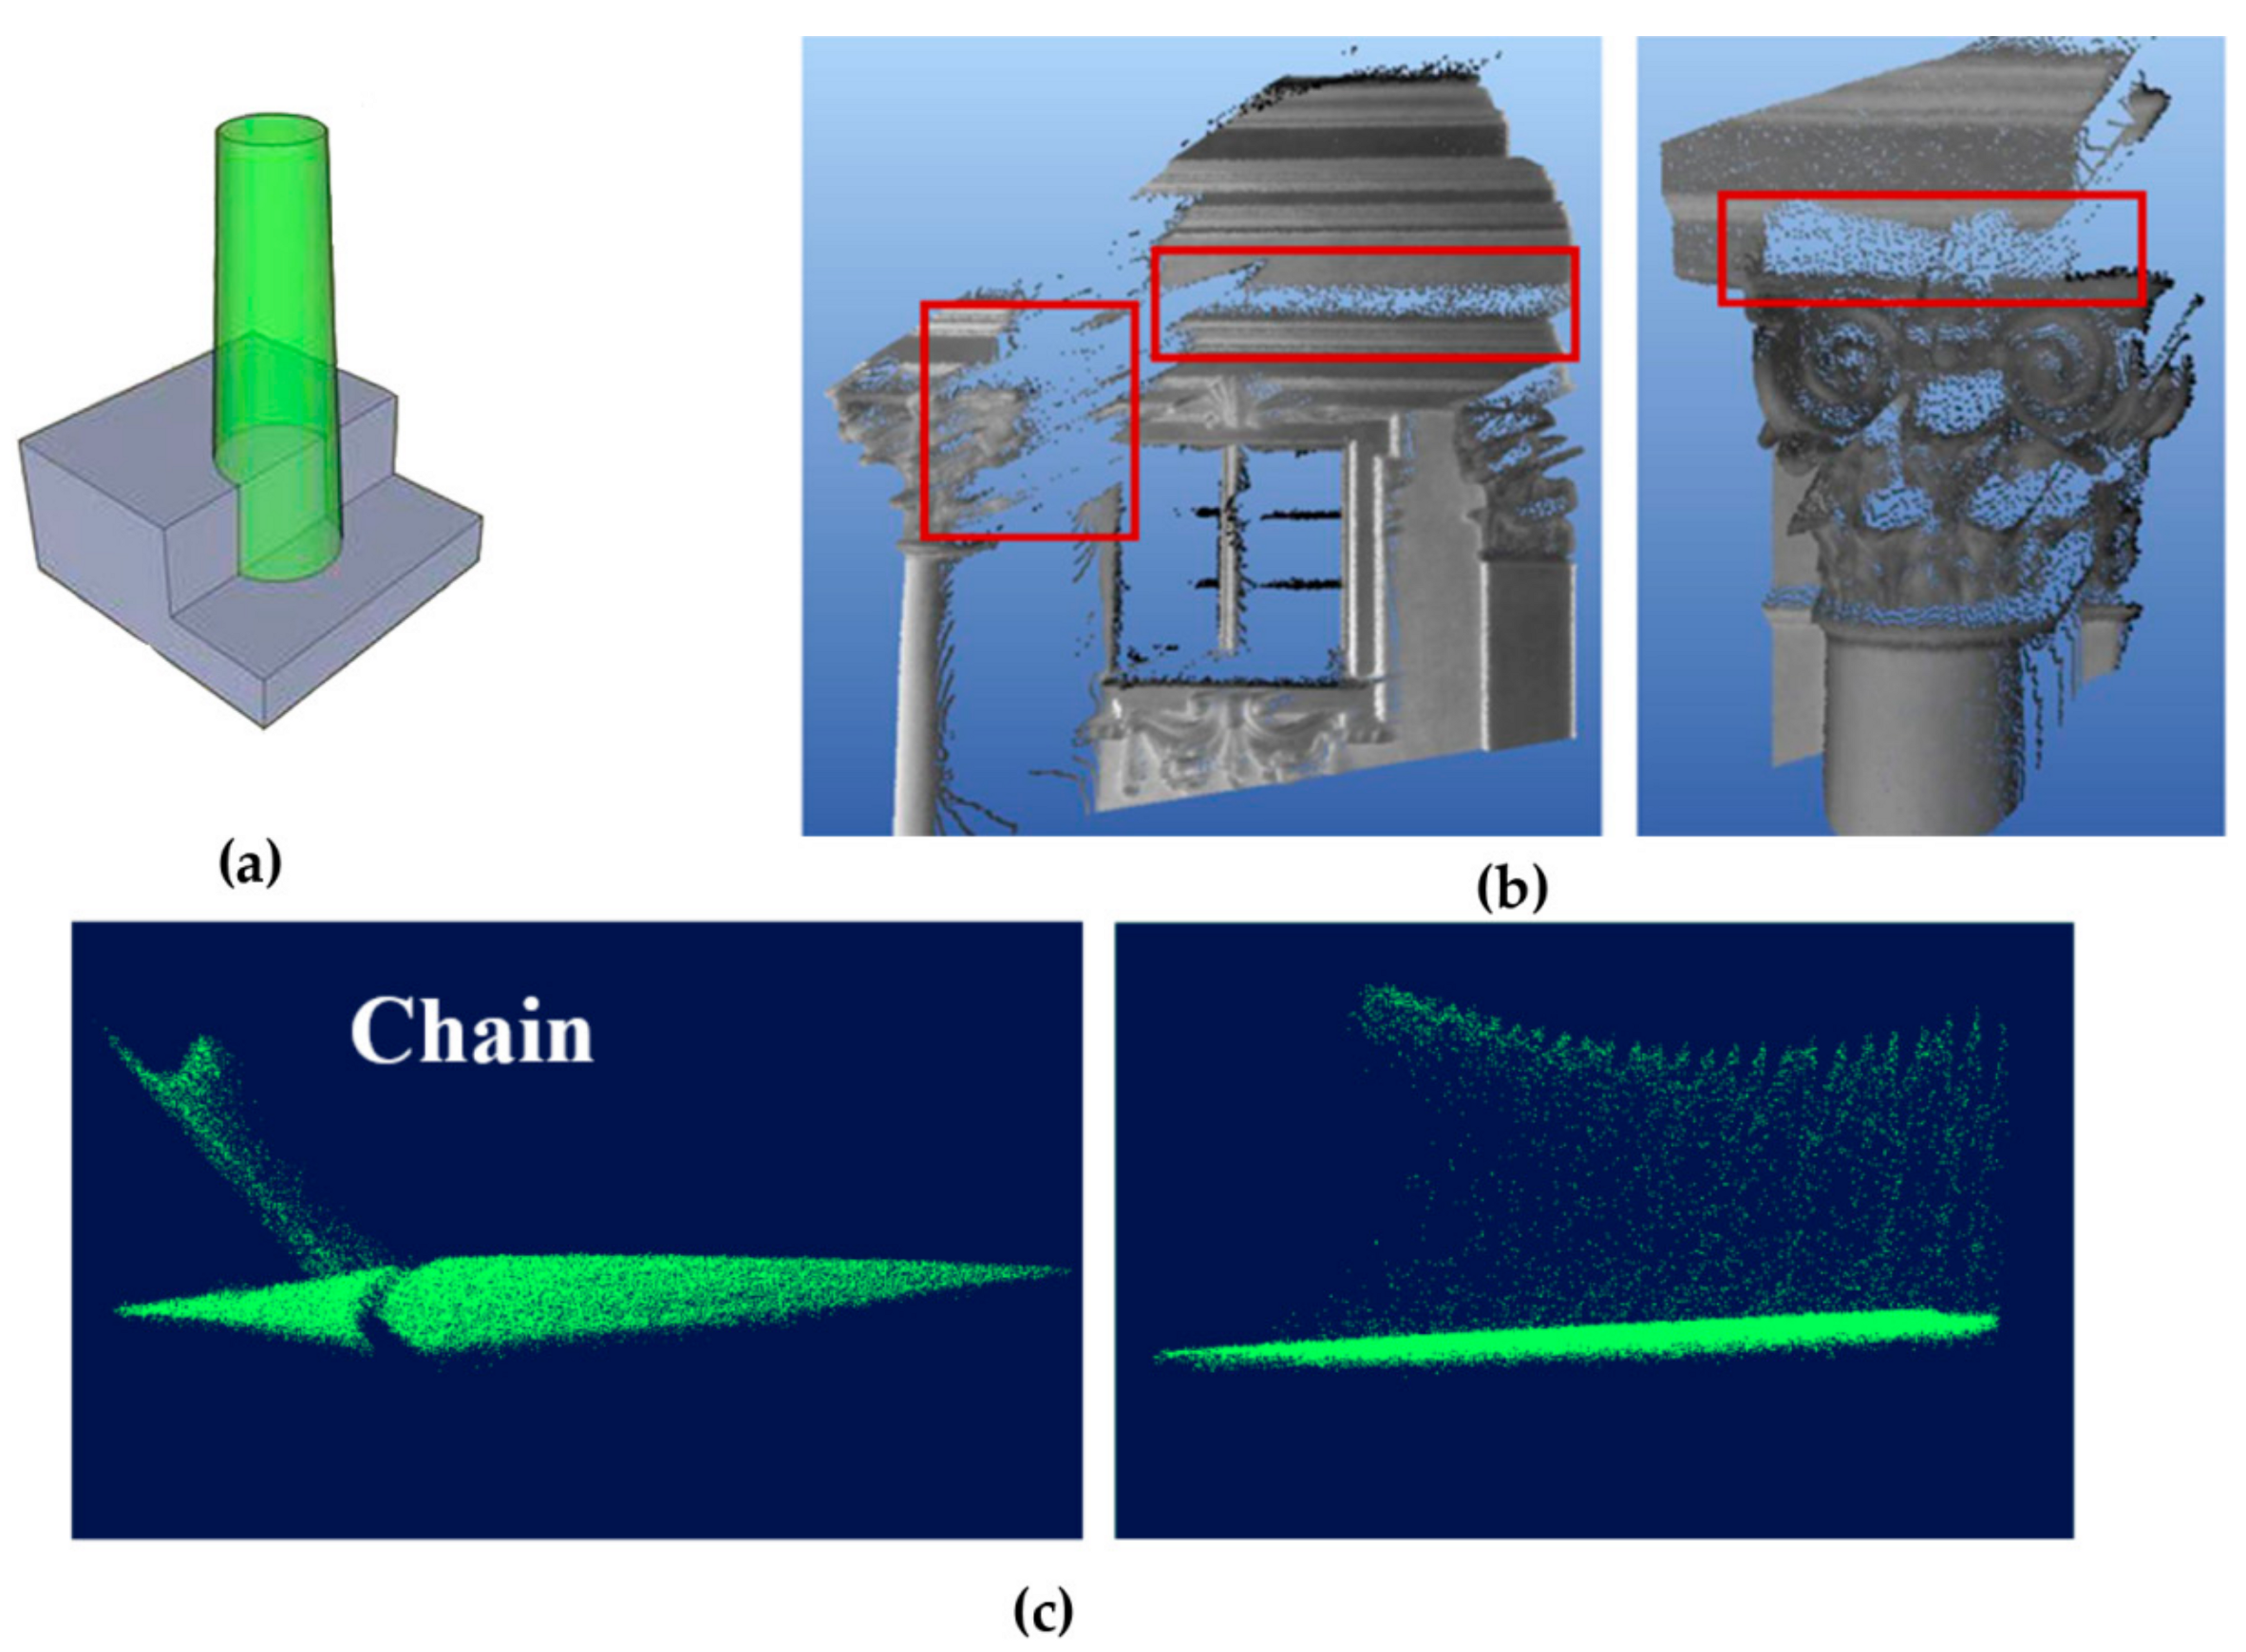
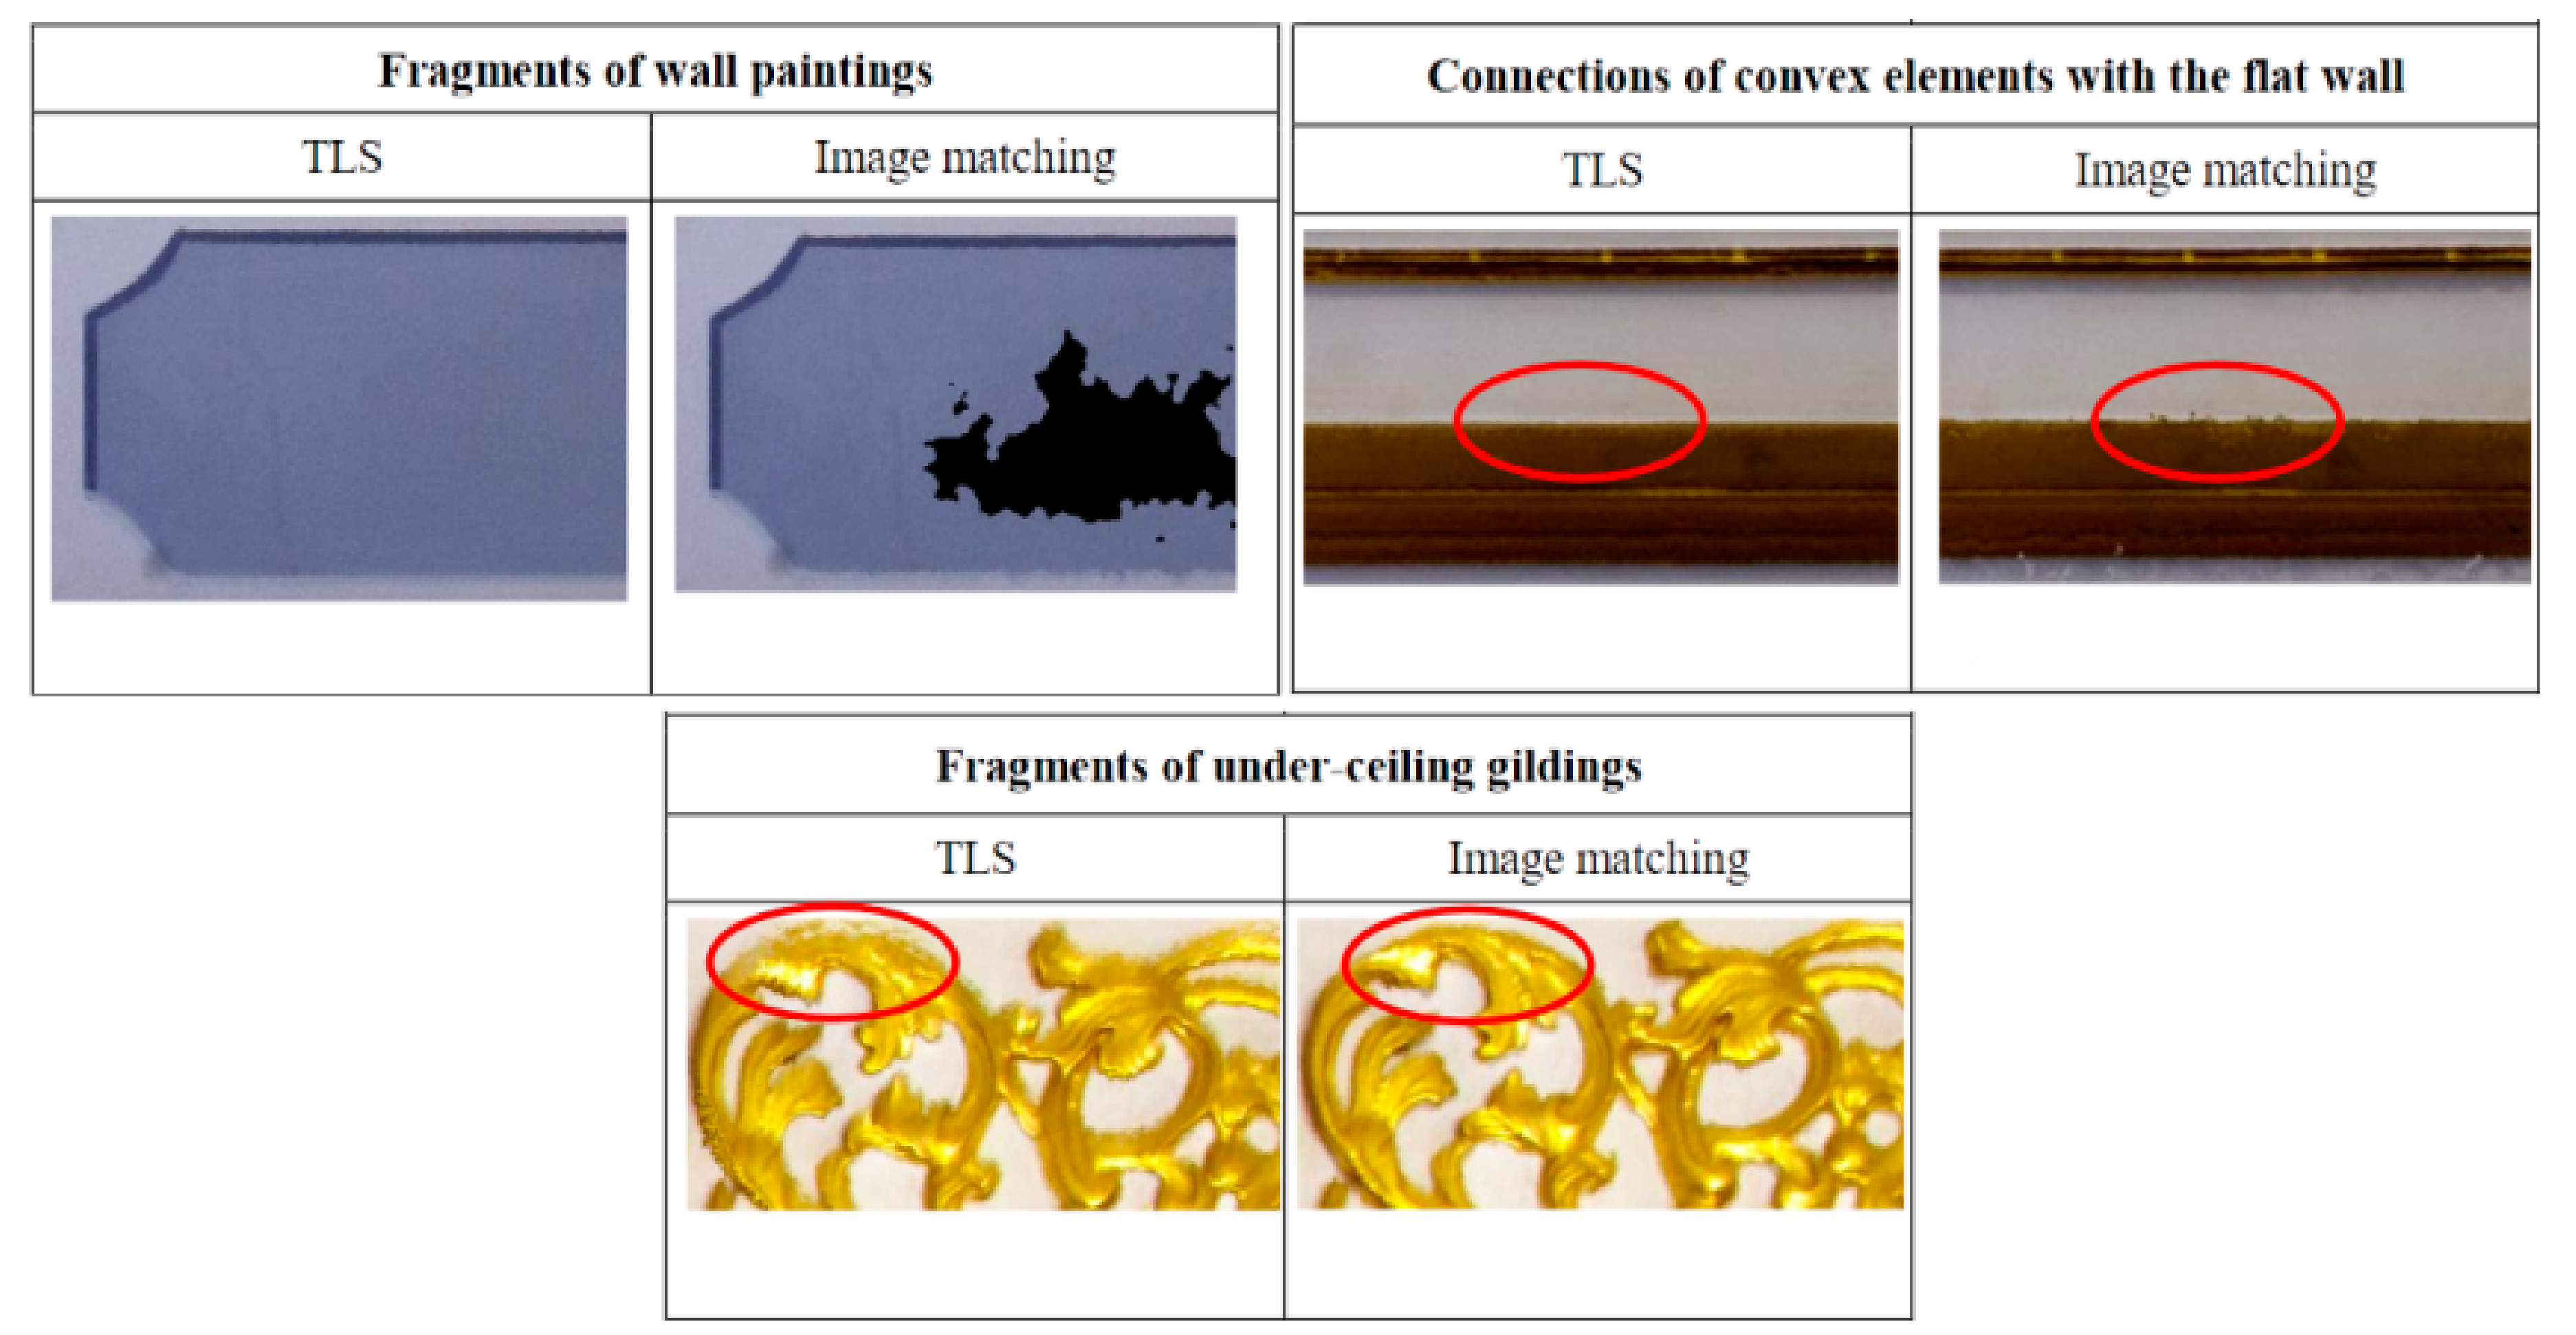
  • Gilded decorations should be processed with the use of data derived from dense matching, since the positioning errors appearing in case of terrestrial laser scanning are not systematic and they cannot be eliminated in an explicit way;
  • In case of fabrics and decorative tapestries, point clouds derived from dense image matching should be applied, since the utilization of TLS can lead to errors in surface reconstruction and the effect of noise caused by the mixed edge problem.
The result of the final orthoimage based on combination of TLS and dense image matching is shown in Figure 13.

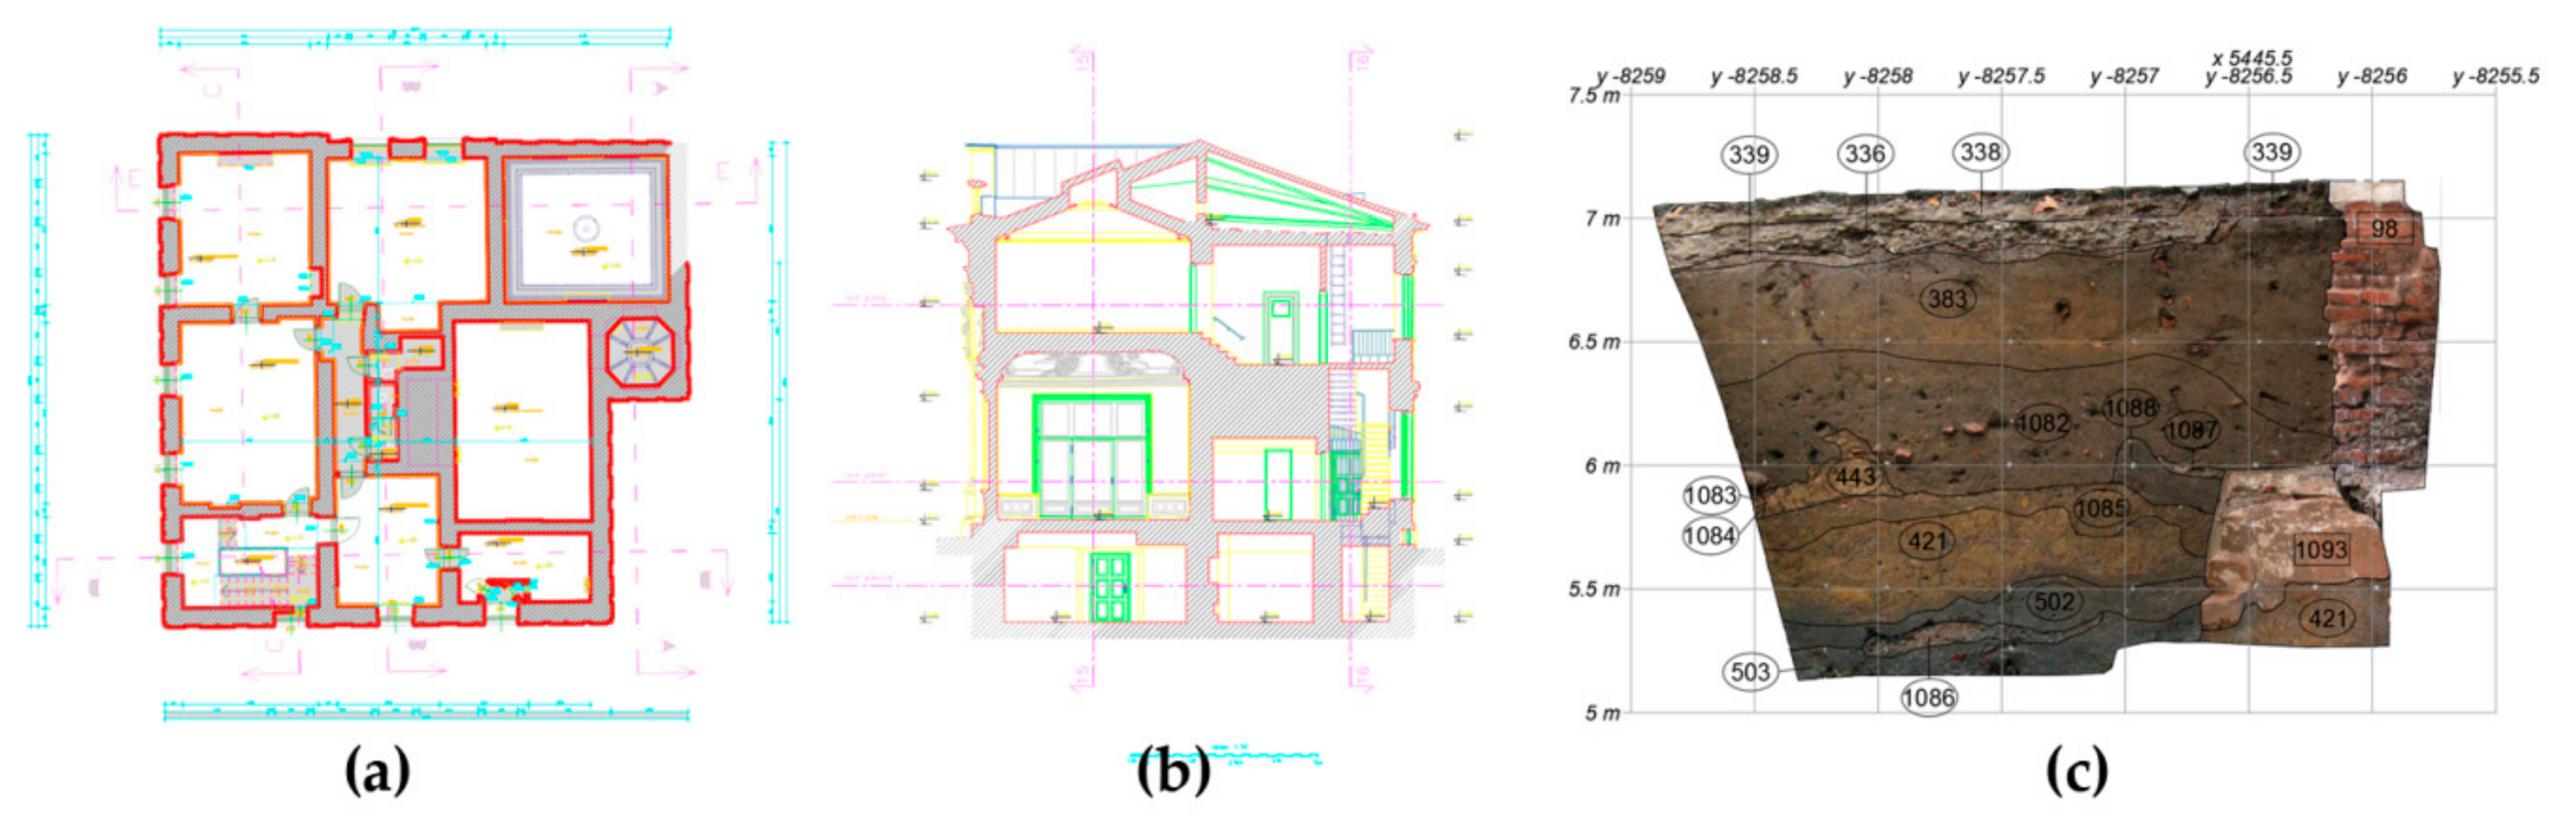
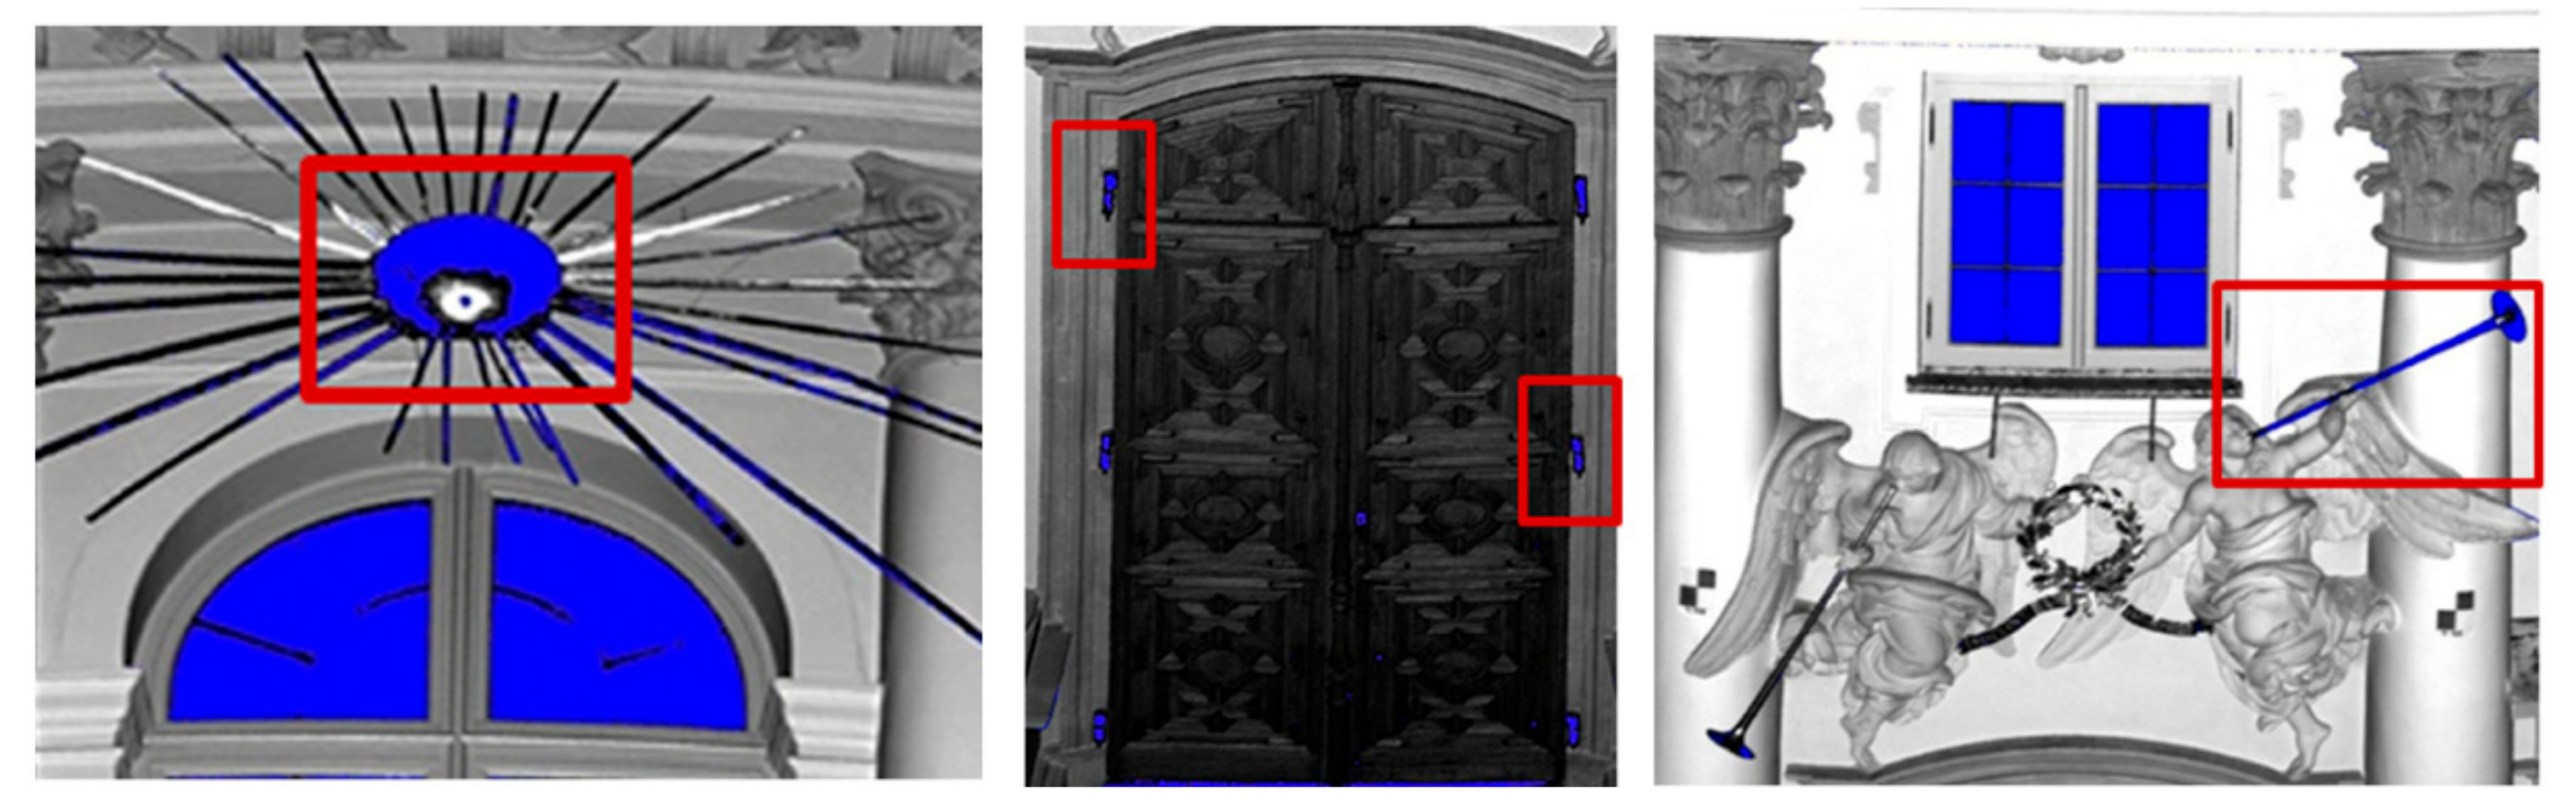
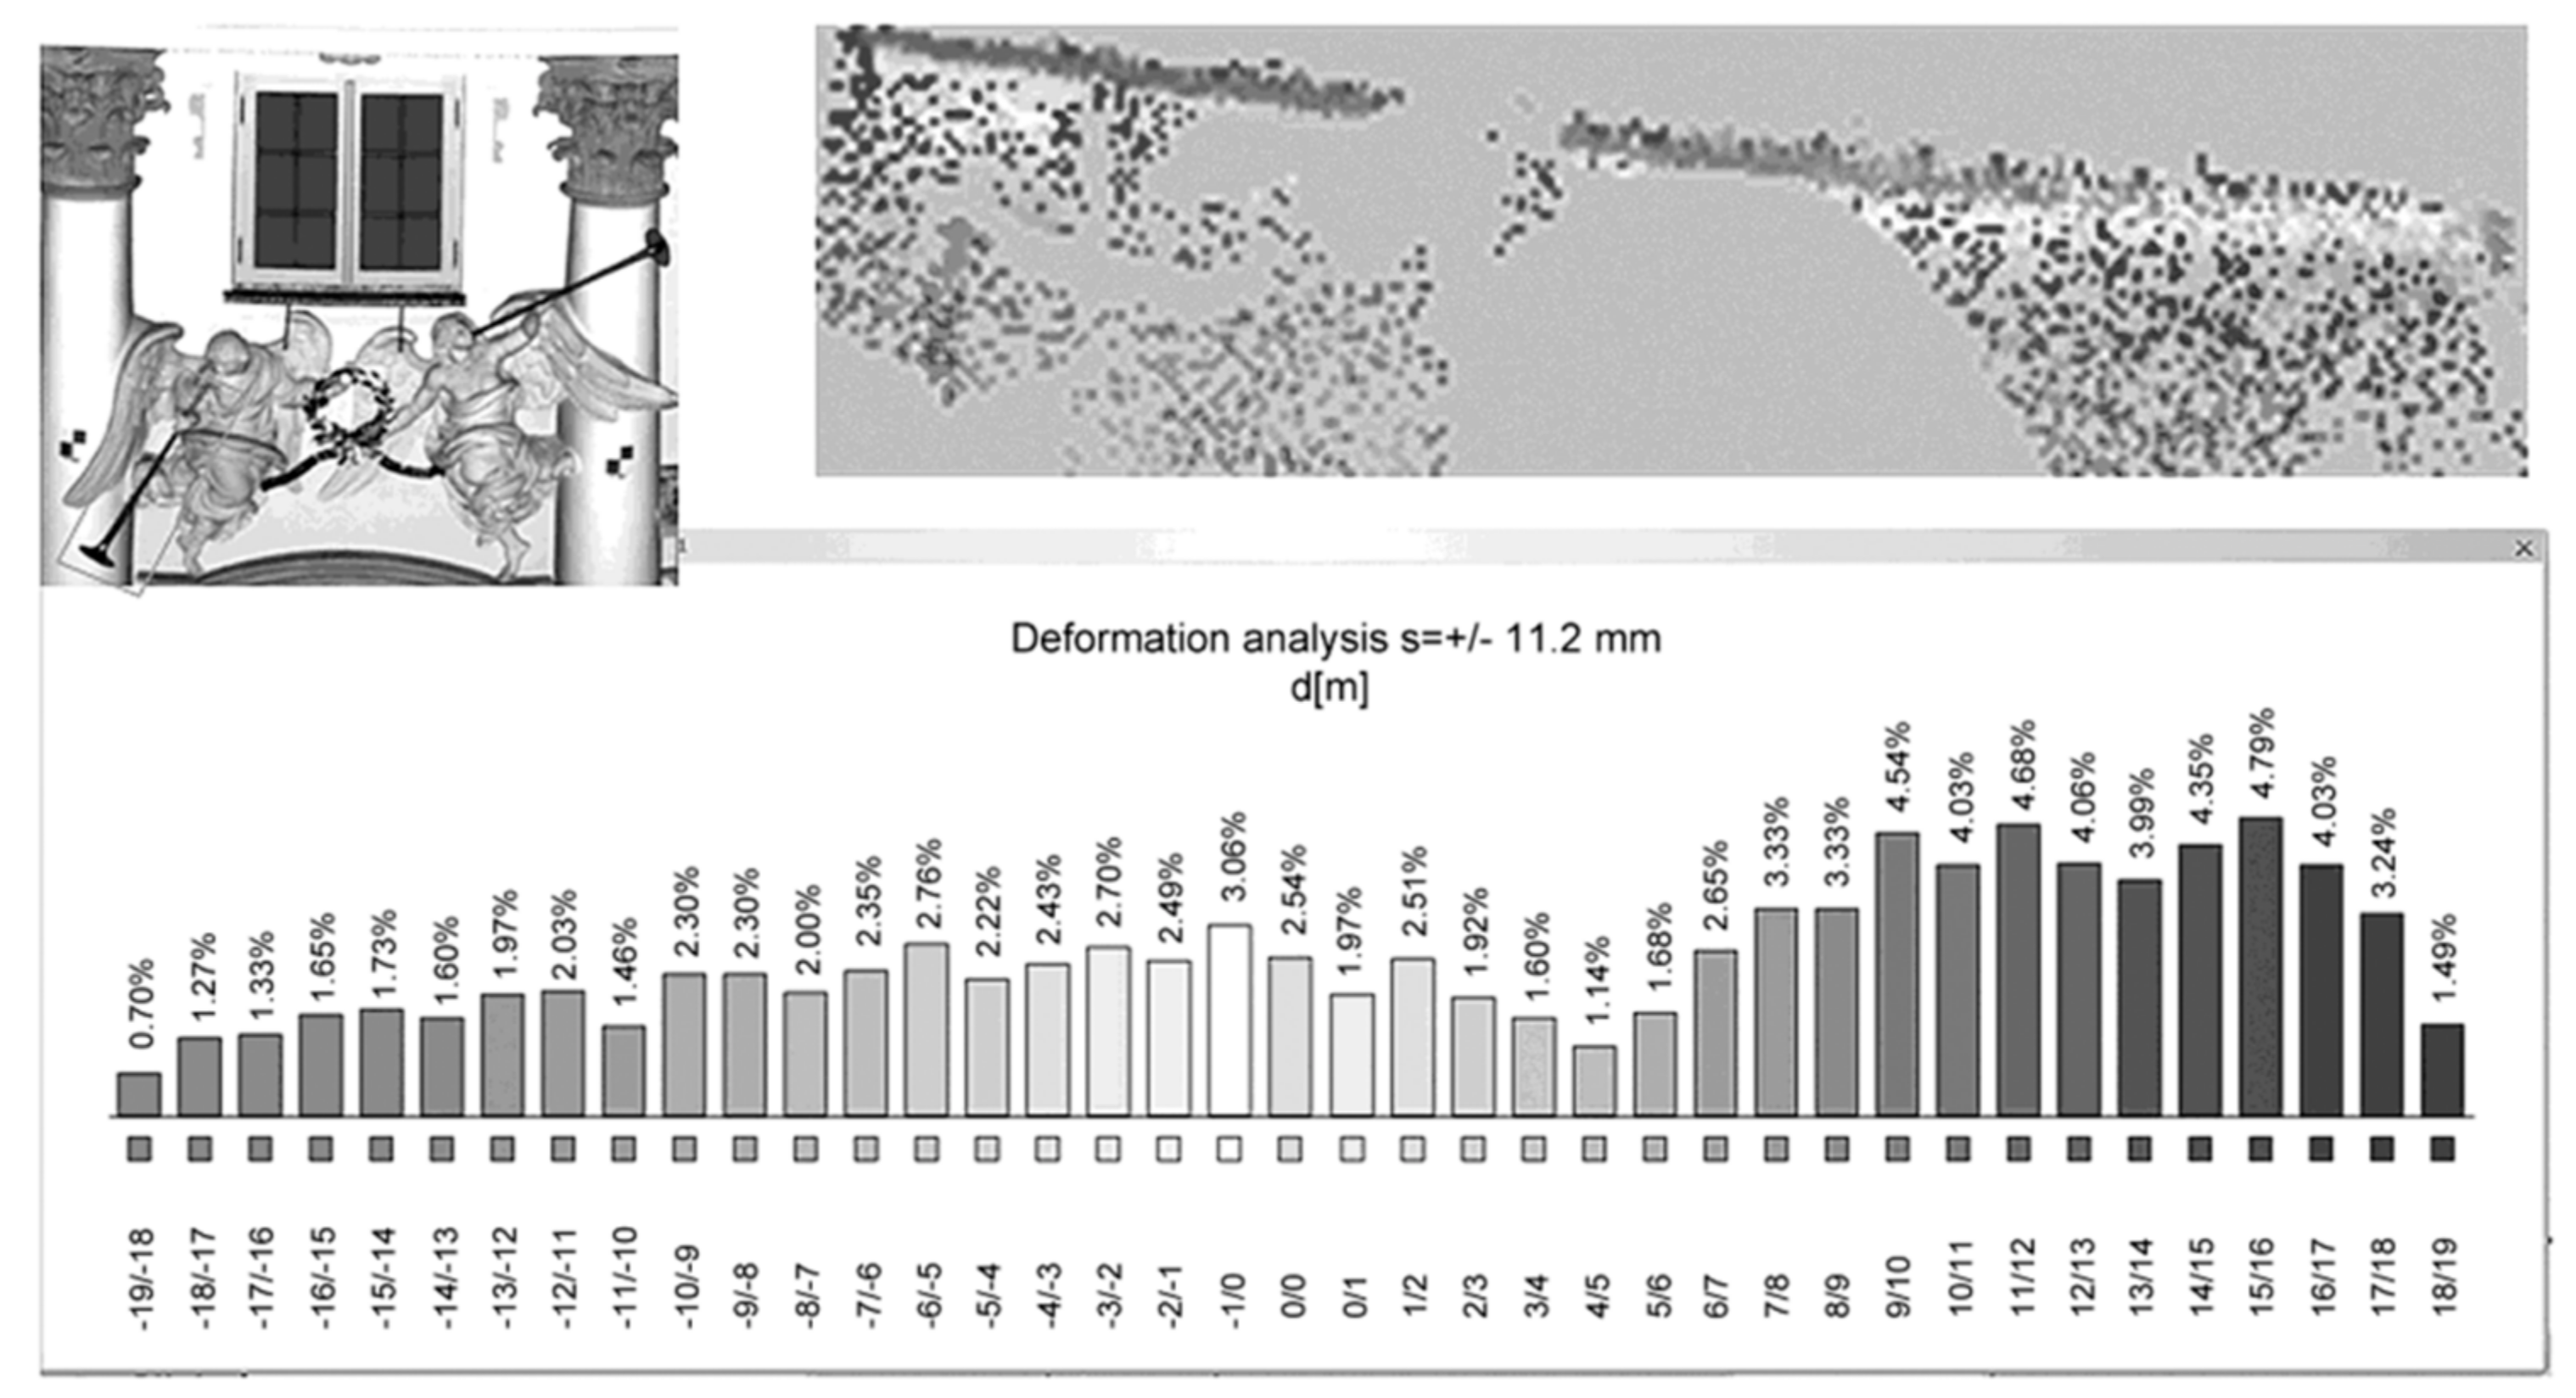
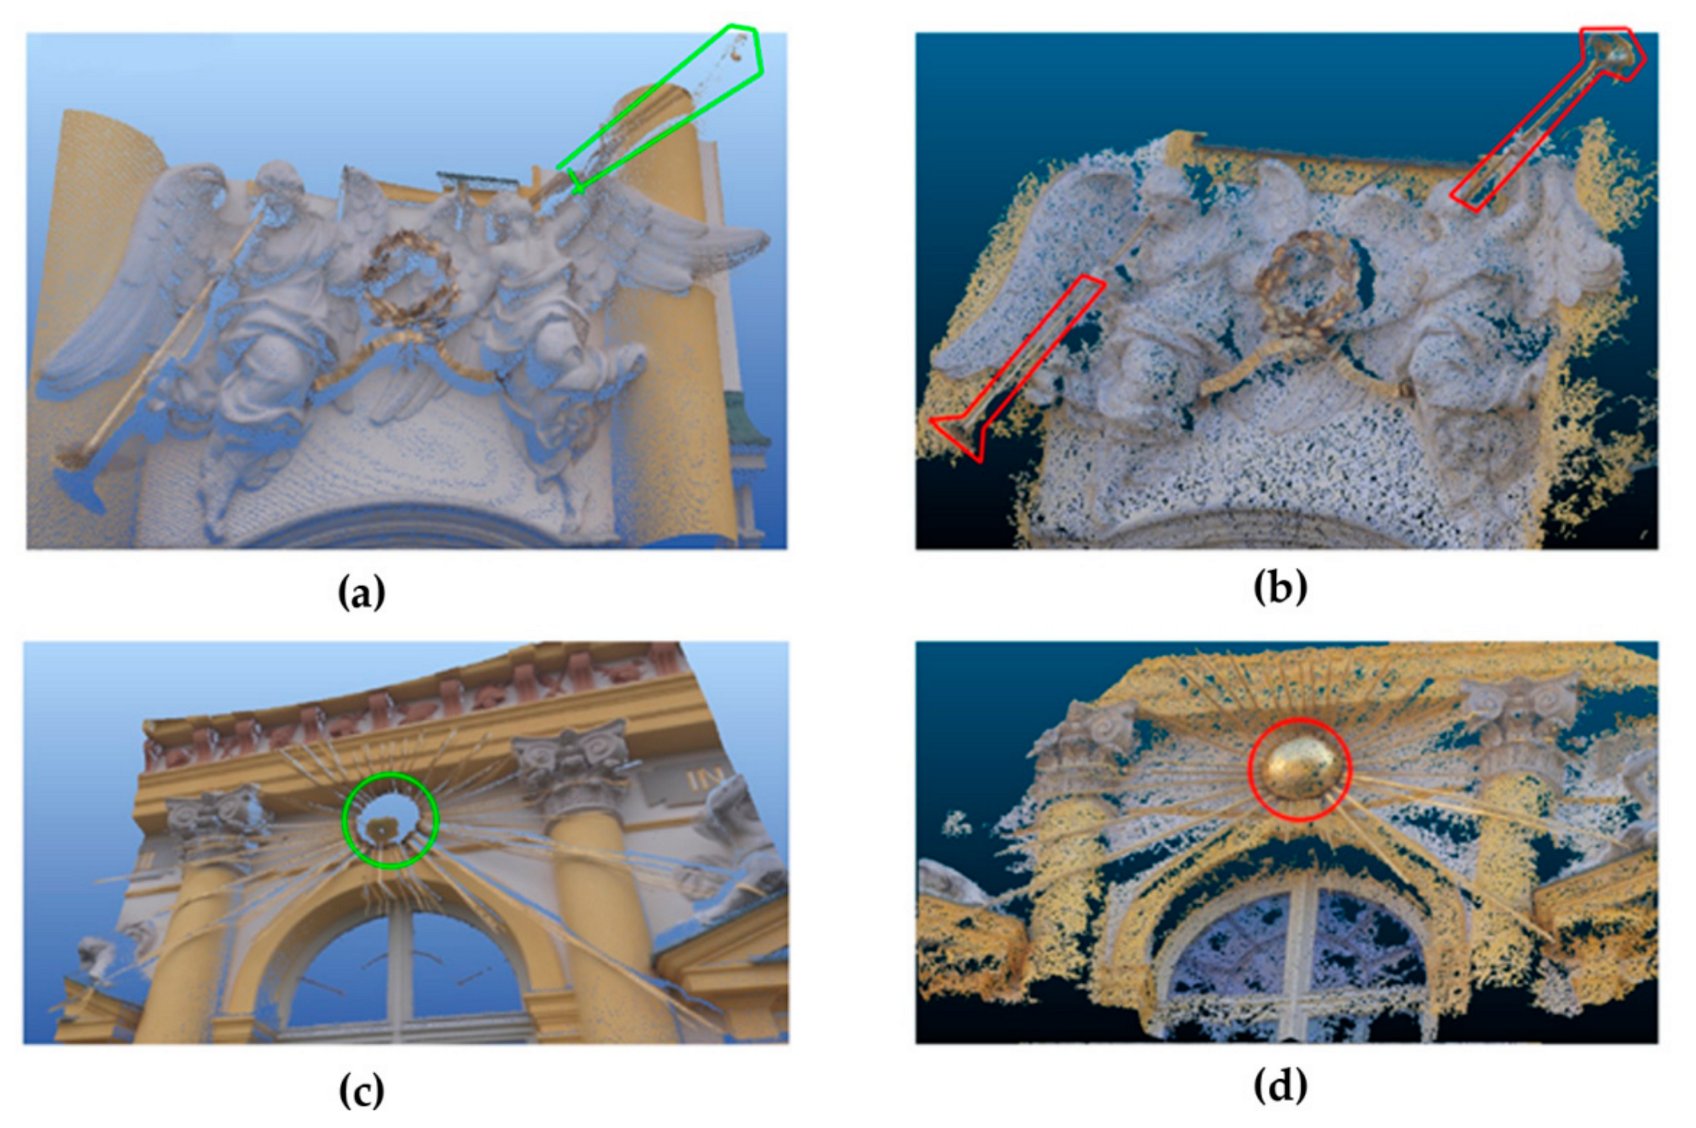
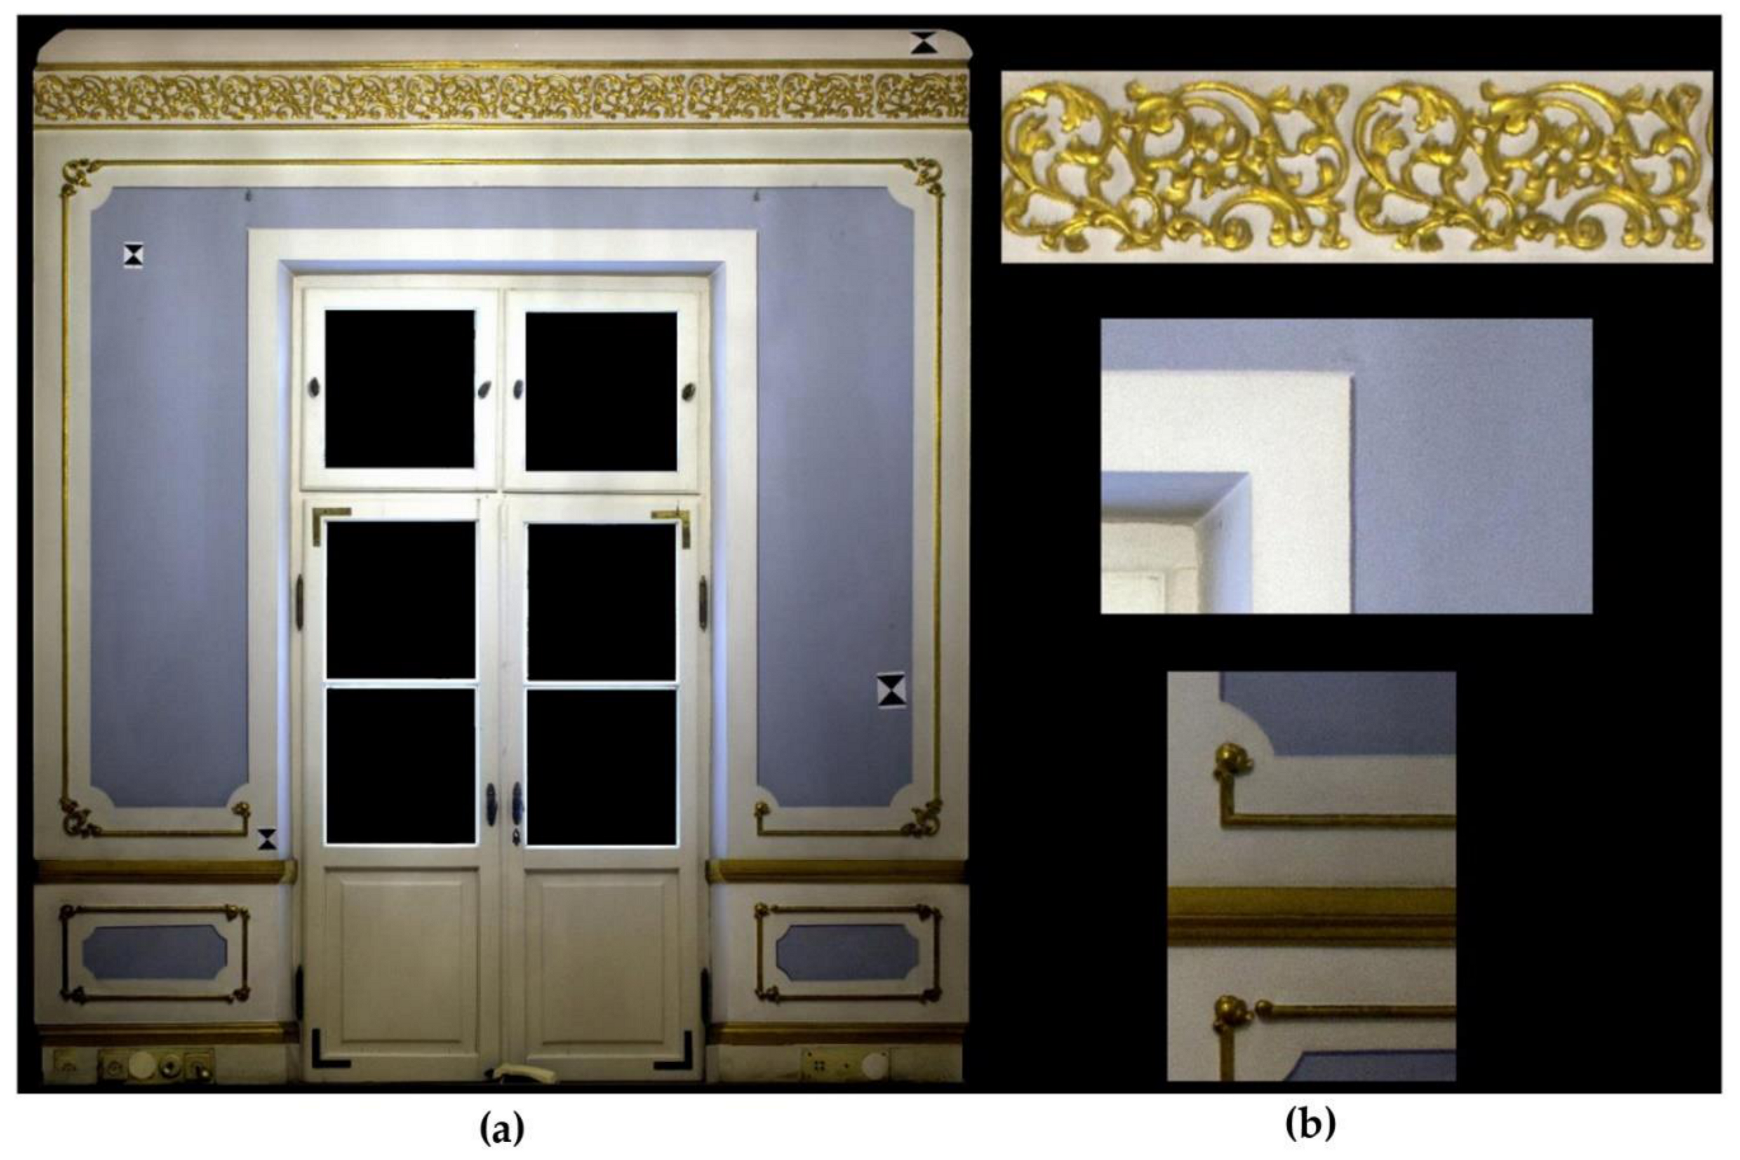
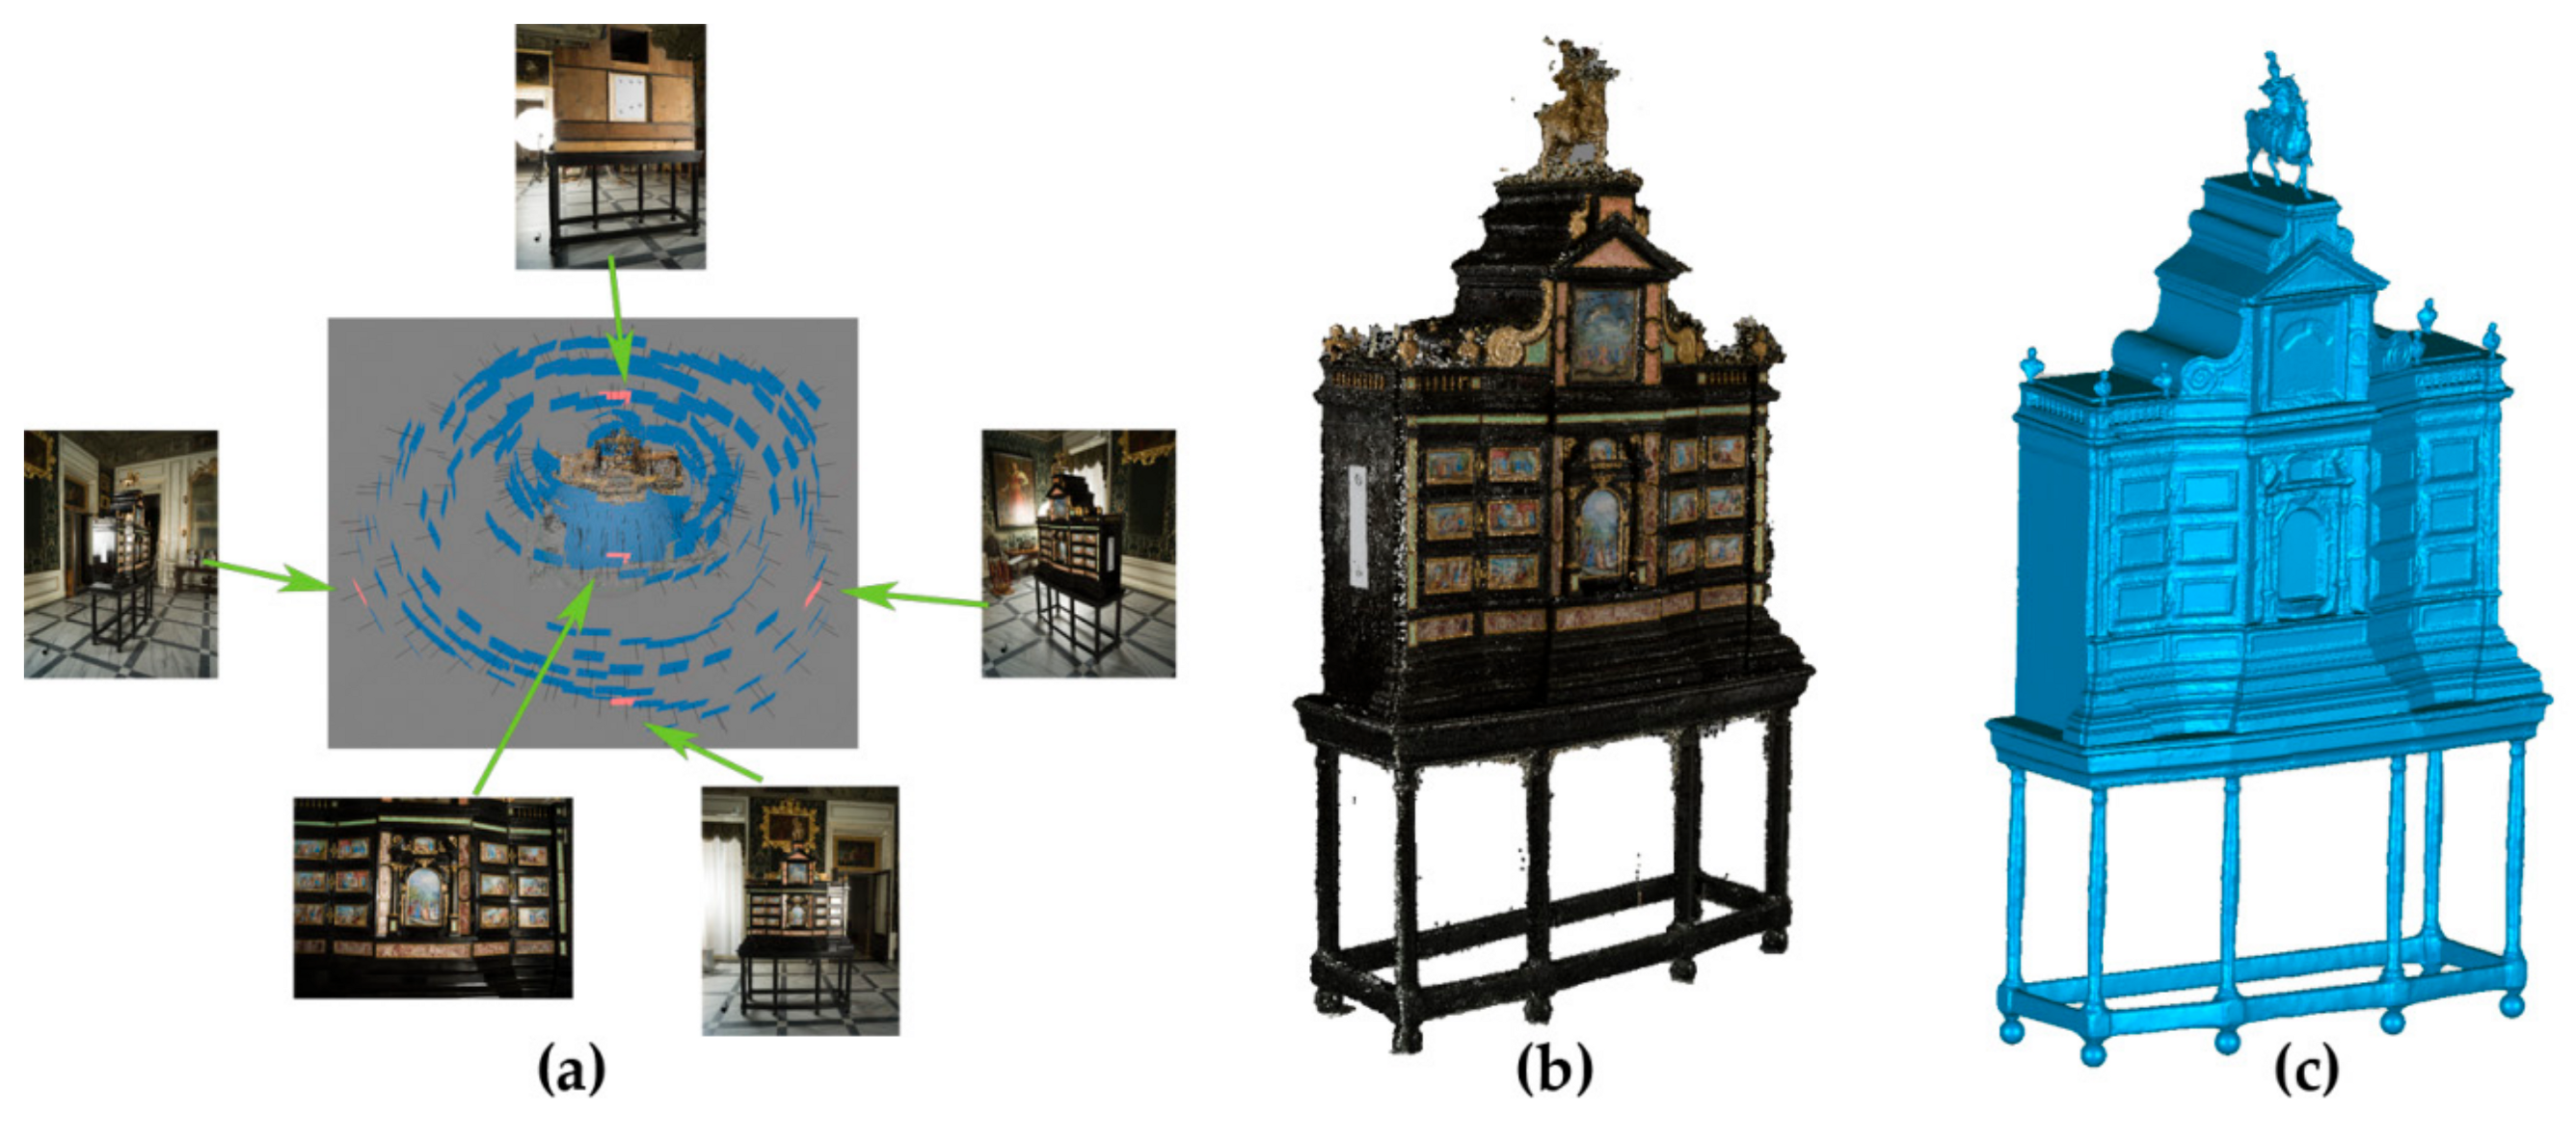
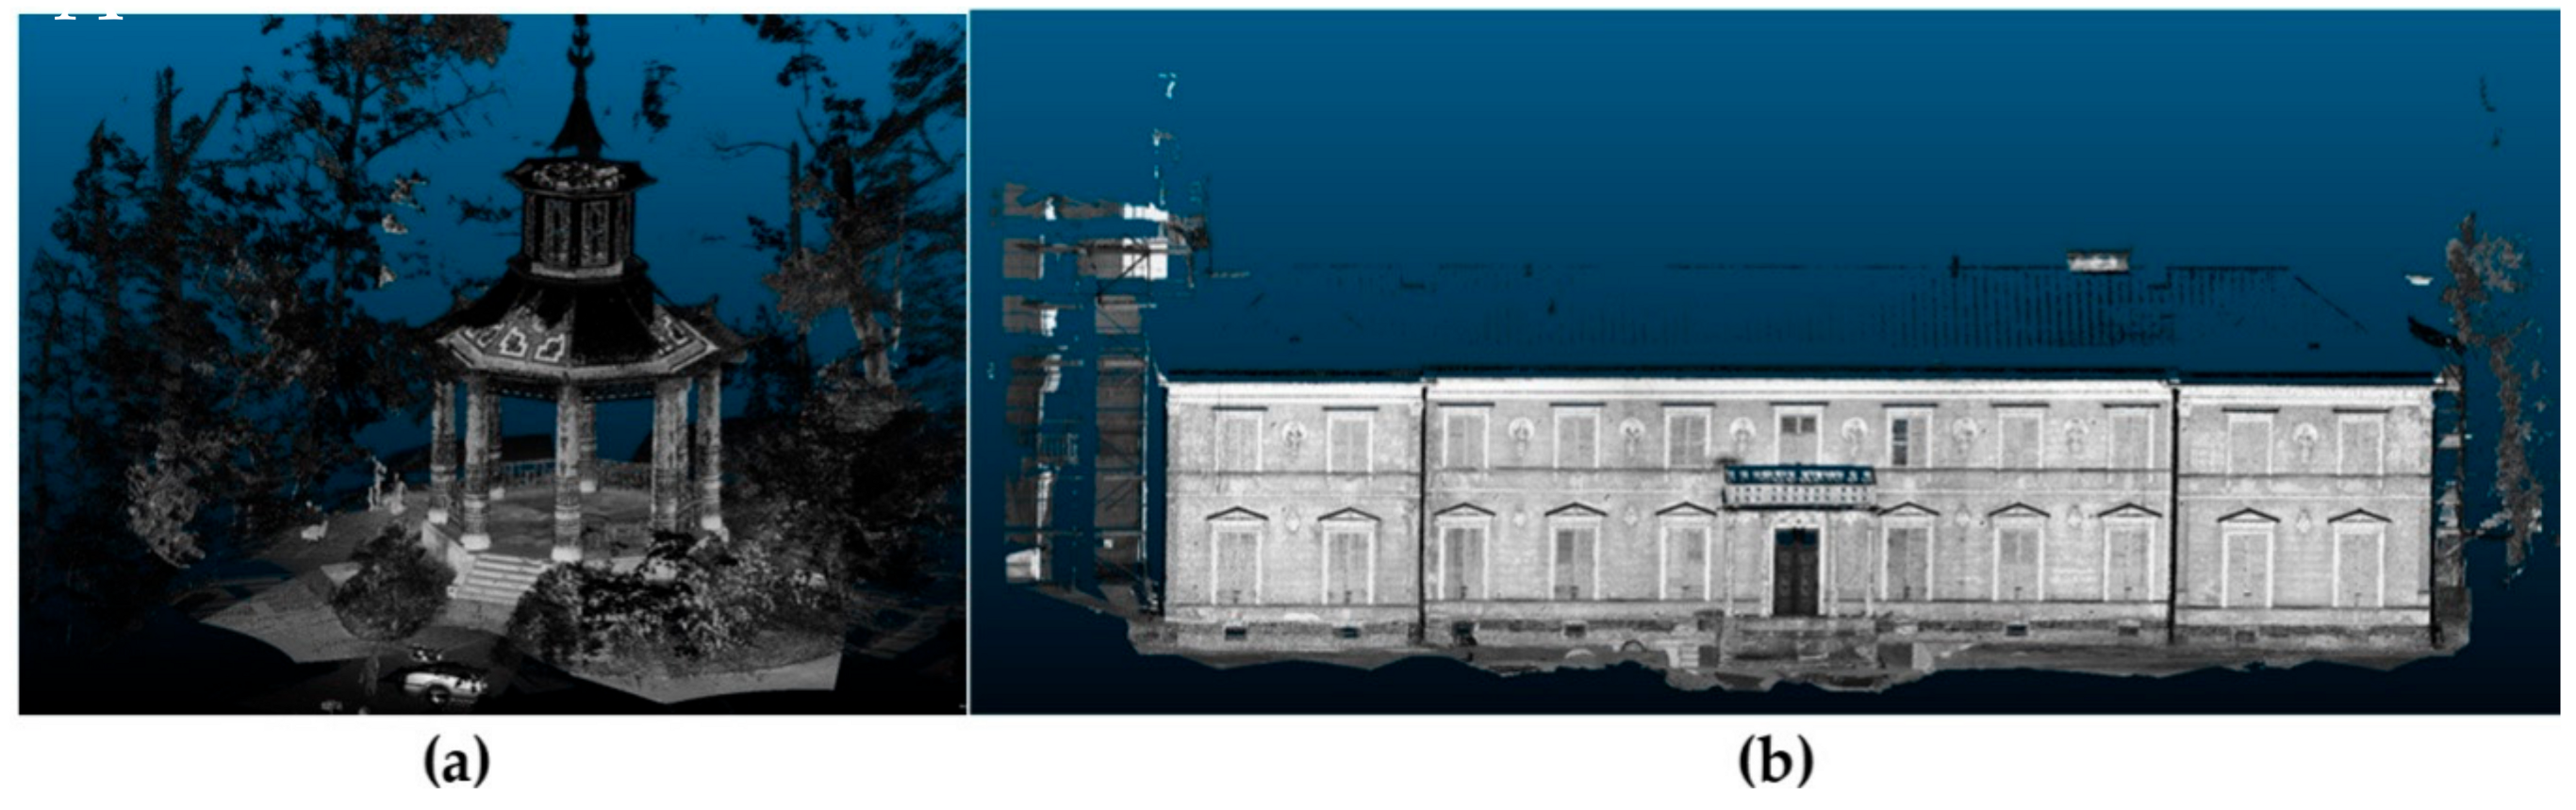
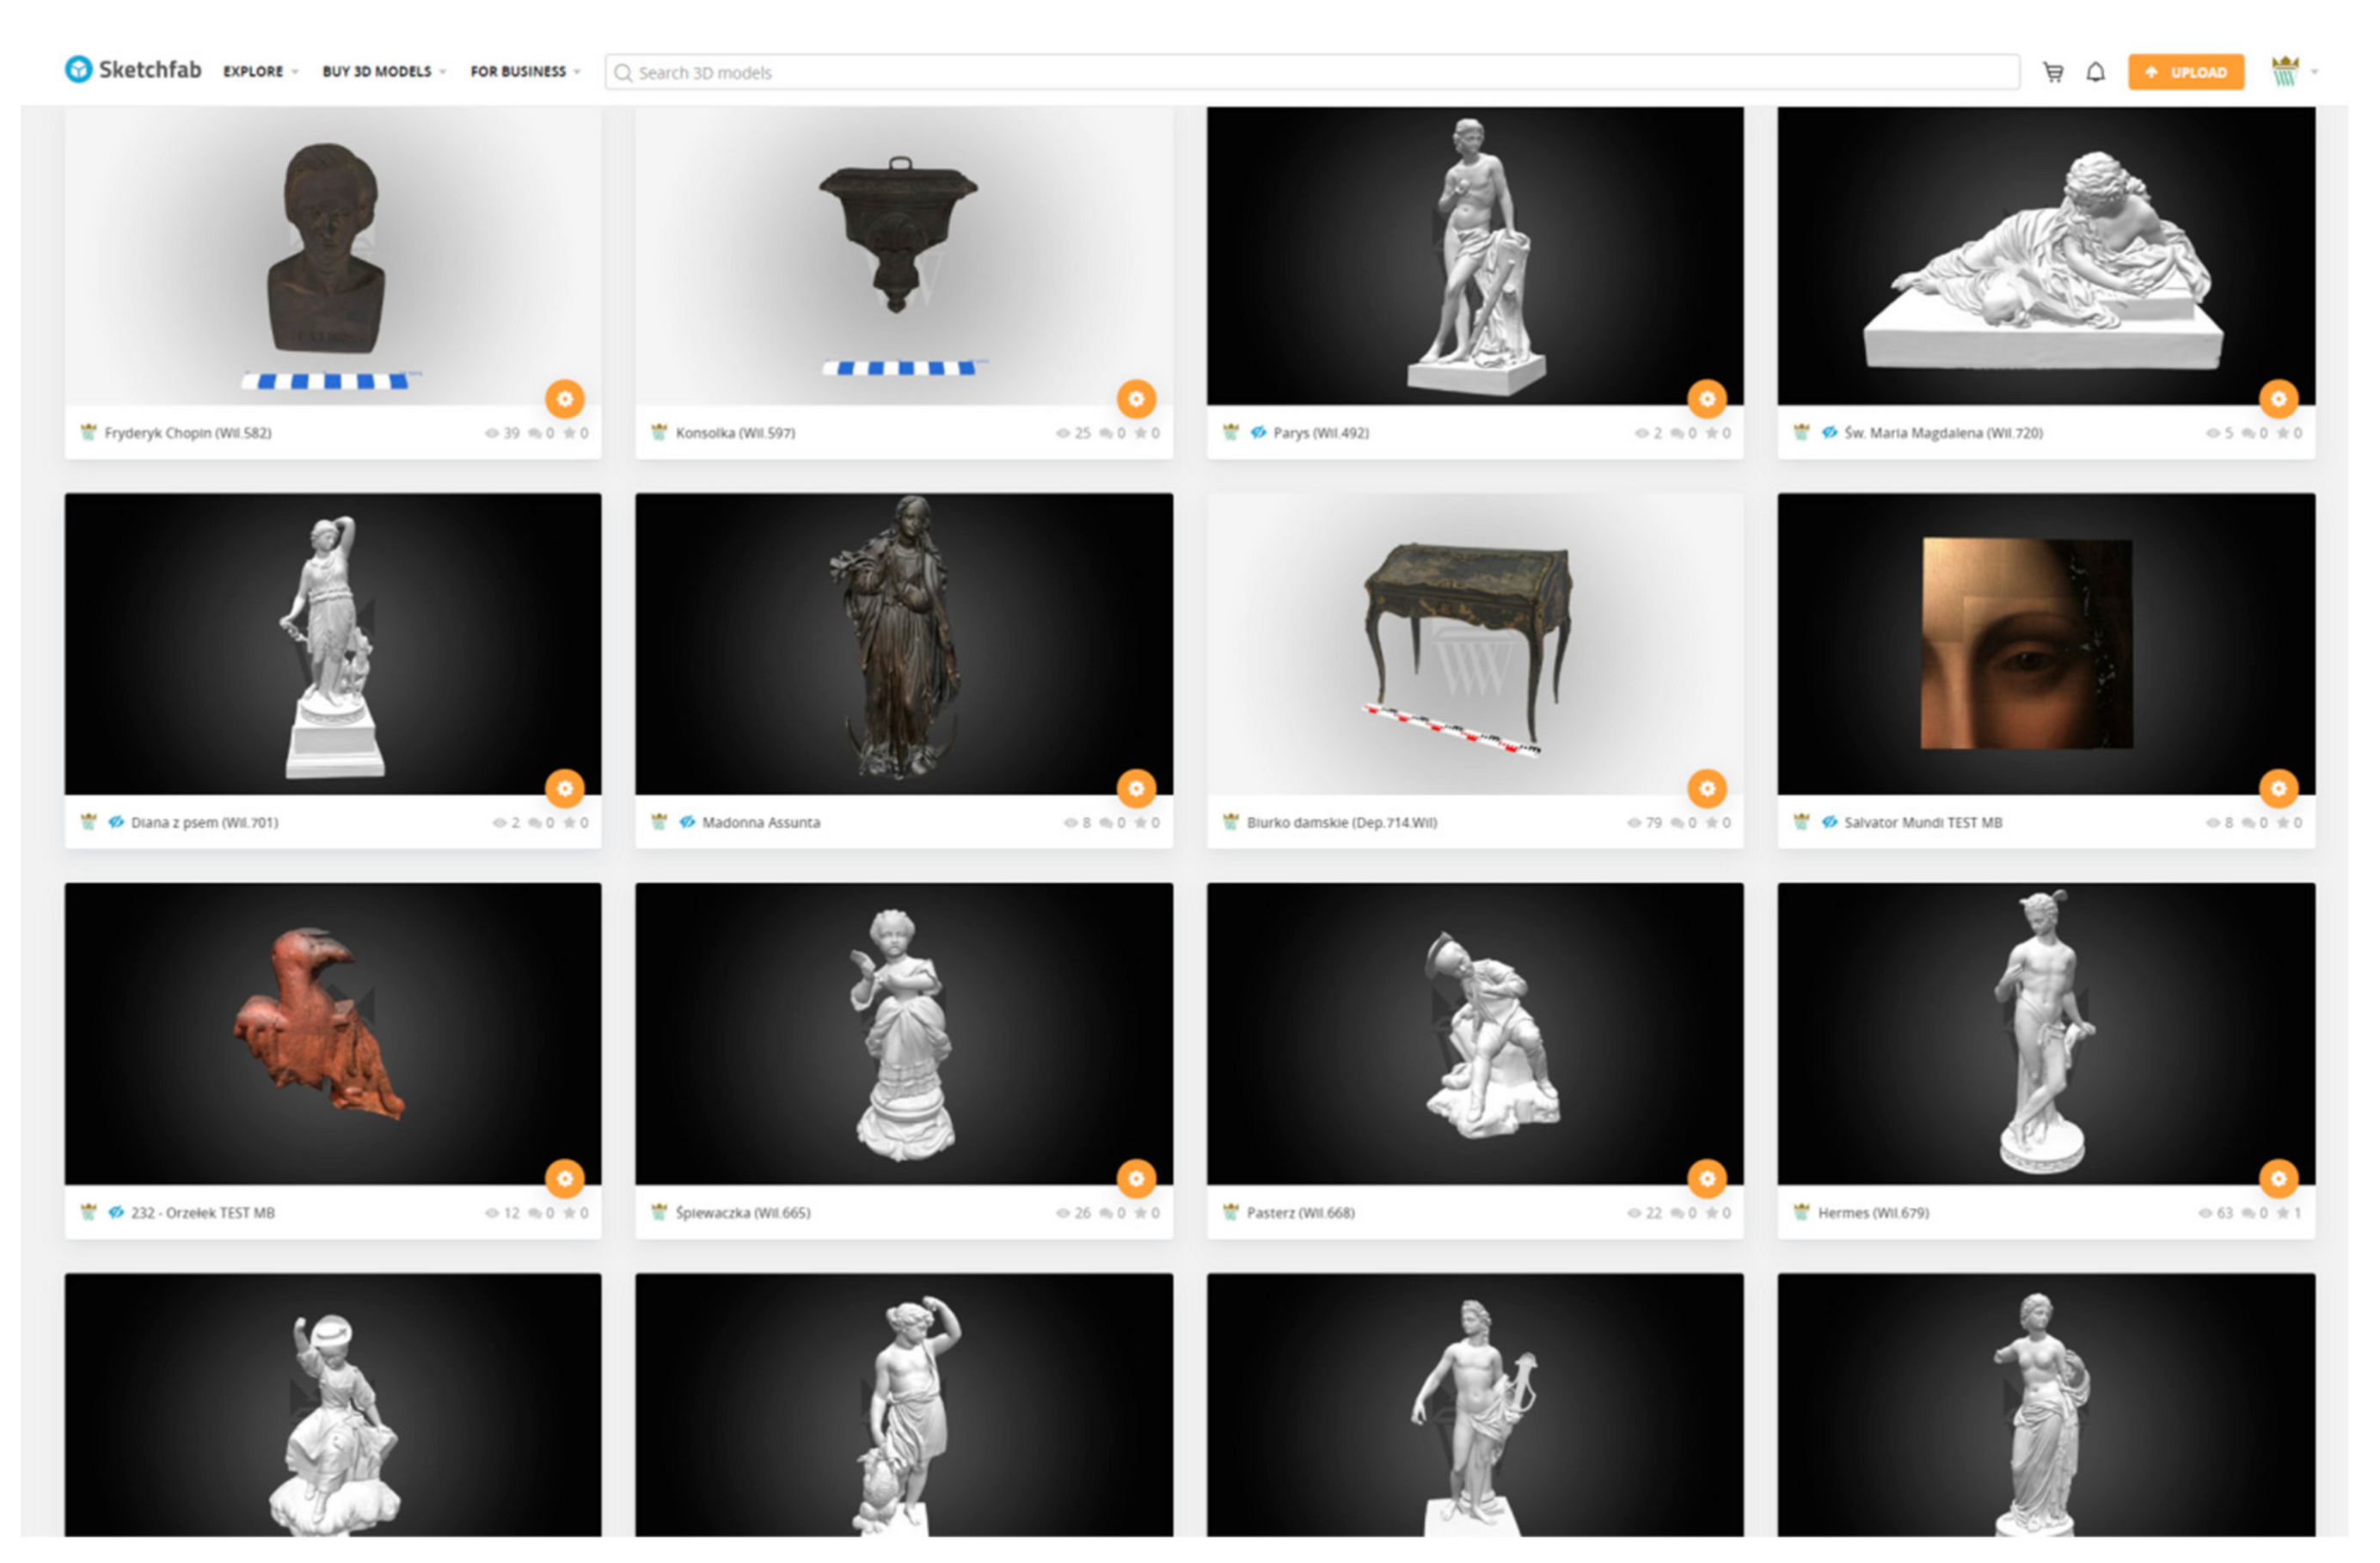
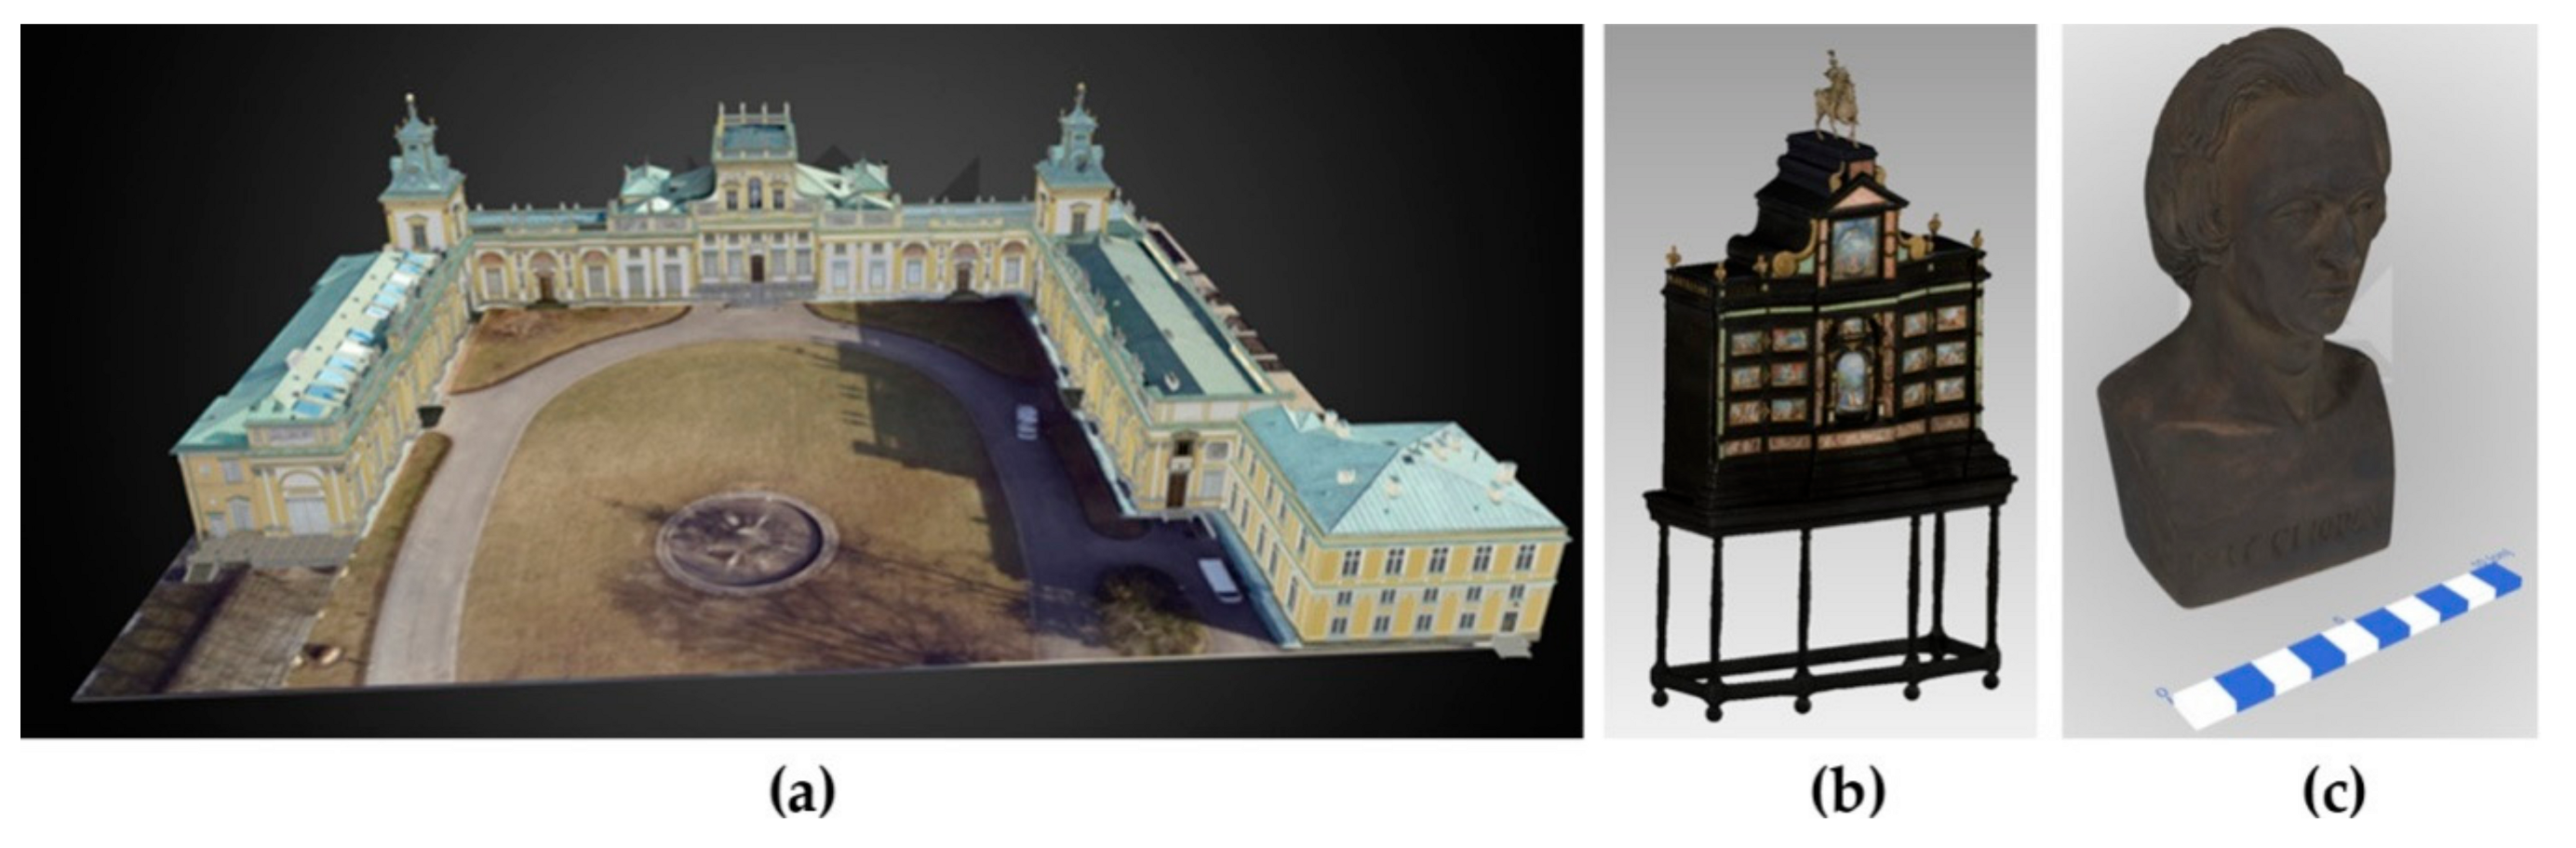
3.2.4. The Application of the TLS and Photogrammetric Techniques in Museum of King Jan III’s Palace at Wilanów

The Museum of King Jan III’s Palace at Wilanów is an example of a cultural institution where both traditional and modern methods of cultural heritage documentation are successfully applied. The combination of photographic, architectural, technical, and conservatory documentation with such measurement techniques as photogrammetry and terrestrial laser scanning allows for the integration of data and expertise in many different fields to provide the most complete and informative image of historic objects possible to obtain. Close-range photogrammetry is one of the 3D shape reconstruction methods intensively exploited in the museum and is used in a variety of applications. As mentioned before, close-range photogrammetry is a documentation method allowing to record the current state of an object in 3D, with high accuracy and level of detail. As such, this technique can be used to record subsequent stages of the object’s conservation. Moreover, photogrammetry supports conservatory works while making a copy of a historic artefact. Such a situation usually takes place either when the original previously presented on the exhibition must undergo conservation works or when it requires special environment parameters impossible to be provided in its original location. Conservators can use the results of a photogrammetric elaboration including point clouds, 3D models, orthoimages, cross-sections, and profiles as a reference while taking necessary measurements. Furthermore, a textured 3D model is an attractive object presentation, which is used with a great success as a way of sharing the information about museum collections with the audience on the Internet (Figure 14).
Photogrammetry is an affordable measurement technique from the museum’s point of view since the necessary equipment is much cheaper than terrestrial laser scanner. The museum of King Jan III’s Palace at Wilanów possesses a photographic studio and necessary equipment including two medium-format digital Hasselblad cameras and three high-resolution Nikon SLR cameras with exchangeable lenses. To provide the best lightning conditions possible, Profoto lights along with umbrellas and softboxes are used. Additionally, to acquire correct radiometry of texture, two X-Rite color checkers are used. This allows one to obtain results of satisfying quality and accuracy.
However, there are some difficulties occurring while applying photogrammetry in the museum as a documentation method. Firstly, to get photos of best quality, it is recommended to take them in studio conditions. Yet, it is a common case that the object cannot be transported to the studio because of its weight or fragility. Therefore, while taking photographs, one must cope with poor lightning conditions or the inaccessibility of some parts of the object as well as the tourist traffic. Moreover, control points usually cannot be placed directly on the object. In some cases, it makes high accuracy quite difficult to achieve.
Terrestrial laser scanning is another technology, of which use in a typical museum is still not a common practice. Nevertheless, the scope of TLS applications in this field is quite wide and as a measurement technique, TLS proved its applicability and usefulness for purposes relating to the institution’s activities.
In the Museum of King Jan III’s Palace at Wilanów, several cultural heritage objects were recorded by using this technology. TLS was applied for the documentation of elevations (Figure 15b) and a set of interiors of the Palace and the adjacent building—Markoniówka. TLS data were also acquired for several smaller buildings like the Chinese Gazebo or small palace with rotunda as well as for several sculptures located in the park (Figure 15a). The data include raw point clouds, 3D models, and orthoimages.
TLS intensity orthoimages were also used as a data source for vector architectural documentation (Figure 16). Both intensity and RGB orthoimages, which are the result of TLS and photogrammetry data integration, are components of the geographic information system developed in the museum. RGB orthoimages served as a basis for the separation of decorations located on elevations in the Palace and in the rooms of the Palace and the adjacent Markoniówka. The orthoimages were the source of geometry of polygon objects representing the decorations. Enriched with extensive descriptions prepared by art historians and conservators, the GIS provides complete information about the objects illustrated by the orthoimages in a clear, approachable, and visually attractive way. It is particularly important in the case of online data publication on the museum’s website.
Furthermore, the orthoimages are used as a background for various conservatory analyses, e.g., for damage mapping.
3D models derived from TLS point clouds are currently used mainly as a virtual representations of heritage objects owned by the museum. A great example is a 3D model of the Palace (Figure 15), which is a result of the integration of TLS and photogrammetry. The model is available online on museum’s Sketchfab profile (https://sketchfab.com/muzeum_wilanow; Figure 17).
Analogically, 3D models based on photogrammetry are also available on this website (Figure 18b,c). However, the range of possible applications of TLS in the museum is wider. 3D models can be used for the evaluation of cracks and other damage affecting cultural heritage objects, for instance, to calculate the volume of materials needed for the object’s renovation as well as to perform other measurements needed for the proper maintenance of the object. As mentioned above, like 3D models acquired by using photogrammetry, TLS 3D models can support the production of the objects’ copies—it is nevertheless essential to choose a proper measurement technique suitable for the chosen object providing sufficient accuracy and resolution. Sometimes it is required to perform the integration of these two techniques—especially in the field of cultural heritage, where the information about the object color provided by image-based techniques is as important as the accuracy of its shape.
Despite the multiplicity of applications and strong potential of the use of TLS in the field of cultural heritage, still there are several troublesome issues to be confronted. It is a common belief that TLS is a non-invasive measurement technique, which is safe for fragile monuments and artworks. However, it must be noted that the data acquisition usually must be preceded by several operations, which can pose a threat to museum artefacts. In the case of terrestrial laser scanning performed in historic interiors, it is usually required to remove all furniture, paintings, sculptures, etc., that may cover up the area of interest before the scanning. This causes a great risk of damage for the historical objects and sometimes it is even impossible to move them, as they are too fragile. Moreover, all actions relating to the elements of museum collections must be taken under conservators’ supervision and sometimes with the participation of art historians and other experts. The works schedule must also take into account such matters as temporary exhibitions or conservatory/renovation works taking place in selected rooms. Bearing in mind all these aspects and the fact that the works also should not interfere with the everyday tourist traffic, the organization of such measurements turns out to be a complicated task. Finally, although the use of TLS in cultural heritage documentation and preservation is becoming more and more popular, this technology is still rather expensive, especially for a museum whose budget is usually limited. In contrast to photogrammetry, the TLS data cannot be acquired by the museum on its own since the museum does not possess the necessary equipment and software.

3.3. Remote Sensing Techniques

Remote sensing techniques involve contactless measurements focused on detecting and identifying objects as well as exploring their features while geometric accuracy of reconstruction of their shape is a secondary need. These methods differ in use, range, character of data, and sensor systems needed to acquire data. Among these techniques involving the use of both passive and active devices, spectral imaging plays a key role in investigating physical phenomena affecting cultural heritage objects. In this section, the most common non-invasive measuring methods will be briefly presented while the emphasis will be put on spectral imaging as the most promising form of documentation developed in the Museum of King Jan III’s Palace at Wilanów.
FORS (fiber optic reflectance spectroscopy) is a variant of diffuse reflectance spectrophotometry in ultraviolet, visible, and NIR (and sometimes MWIR—mid-wave infrared) wavelength ranges, which is now commonly used as a non-invasive analysis of cultural heritage objects. It is a point-based method allowing for the measurement of spectral reflectance in selected points of the object via portable devices based on fiber optics. FORS is particularly useful in case of investigation of pigments, binders, and fiber type of canvas used in paintings and frescoes [82,83,84,85]. It is also used to analyze the materials and to examine the state of the object and the stage of degradation [86]. FORS reflectance spectra may serve as a reference data for measurements made with different techniques (e.g., hyperspectral imagery) [87]. It can also complement hyperspectral imagery in selected points to get higher spectral resolution [88]. There is also a library of spectral reflectance prepared for certain materials, which is available online [89].
X-ray techniques: XRF (X-ray fluorescence), XRD (X-ray diffraction), and X-ray radiography are non-invasive techniques involving the application of X-ray radiation (10–7 to 10–11 m). XRF and XRD are spot analysis methods allowing for identification of characteristic elements contained by object materials, especially pigments, and offer the possibility of elemental mapping [90,91,92,93]. X-rays penetrate the material and allow for recording fluorescence signals from layers of material below its surface [94], but the depth of penetration is limited. On the other hand, X-ray radiography may be used to depicture the structure of the object because of different absorption of X-ray radiation of materials varying in thickness and a power of atomic number (e.g., pigments of a painting). As a result, measuring methods based on X-ray may be successfully applied for pigment identification [95], revealing hidden details on a painting [96], or the construction of an archaeological artefact [93].
Spectrofluorimetry (fluorescence spectroscopy) is a contactless method aiming to make objects (materials, pigments) fluoresce; that is, to emit photons with longer wavelengths (usually visible light) than incoming exciting radiation (usually ultraviolet), but unlike phosphorescence, visible light is emitted only under UV stimulation [95]. Spectrofluorimetry (and microspectrofluorimetry—if a microscope is involved) may be successfully applied in pigment identification [91,97] as well as in detecting hidden drawings and signatures [95] and micro defects such as scratches e.g., on a varnish layer [98].
Infrared reflectography (IRR) involves the incidence of infrared radiation on the object (usually by a tungsten lamp) and recording the reflected radiation by an infrared camera. Conventional IRR is performed by acquiring the image in wide near infrared band, but recently multispectral sensors collecting several narrower NIR bands are becoming increasingly popular [99]. Since the pigment’s layer of a painting absorbs much less infrared radiation compared to visible radiation, the presence of underdrawings may be detected as well as changes in the composition [95,100,101]. Near infrared reflectography has proved its usefulness in pigment identification and distinguishing replicas [102]. Infrared radiation is also involved in thermographic analyses.
Infrared thermography (IRT) may be a powerful tool to examine the state of cultural heritage objects. IRT is applied either as “passive thermography” when only the occurring temperature vibrations of the object are analyzed or “active thermography” if the registered radiation is emitted by an external source [103]. The passive approach provides mostly qualitative information about the distribution of IR radiation. It has been successfully applied in the study of buildings and the monitoring of daily temperature variations. It has also been proved that by detecting heat flows, it is possible to discover hidden architectural elements [104] as well as cracks causing moisture and microbiological invasion and therefore the degradation of wall structure. This active approach allows obtaining both qualitative and quantitative information about the temperature change induced in artefacts by adequate artificial heating [104]. It can be used to detect cracks, delamination, and other damage relating walls and frescos [105] as well as to monitor the moisture on the building surface [106]. In case of sculptures, IRT may also be used to detect voids and cracks and other signs of degradation [103,104].
Presented measuring methods are proved to be complementary in many applications in the field of cultural heritage and consequently they are usually combined either with each other and with other contactless techniques such as multi- and hyperspectral imaging [87,91], technical photography [107], RTI [108,109], Raman microscopy [110,111,112,113], and with classical laboratory tests [84].

3.3.1. Multispectral and Hyperspectral Imaging

The use of close-range multispectral and hyperspectral imagery dates back to the early 1990s [114]. Although spectral observations were carried out several years earlier by means of spectrophotometry (which is still popular in this field), spectral imagery enriched these point measurements by adding additional information to spectral data—spatial distribution of spectral characteristics of the whole objects surface [115]. Since then, spectral imaging has been applied in many works regarding objects in wide range of scales.
Spectral characteristics of cultural heritage objects are acquired by means of technical photography as well as multi- and hyperspectral imagery.
Technical photography involves the use of cameras sensitive to various wavelength ranges (visible, ultraviolet, and infrared), different sources of light (e.g., UV, IR, sodium light), and various types of radiation (reflected light, fluorescence). Common documentation method in visible light is raking light photography (RAK), which involves taking photos with lamps placed at chosen angles to clearly show the texture of the object. Technical photography may also contain false color band compositions, for instance IRCF—infrared false color.
The distinction between multispectral and hyperspectral imaging is not clearly defined but it is agreed that hyperspectral imaging provides higher spectral resolution collecting several thousand (200 or more) contiguous, narrow bands, thus allowing for the reconstruction of almost continuous reflectance spectrum [116] (Figure 19). In contrast, an imaging sensor is considered as multispectral if it registers a small number (usually not more than 20) of discrete spectral bands of bandwidths ranging from 20 to 50 nm [117], which may not be equal in bandwidth and are not necessarily adjacent to each other [115].
Essential components of any spectral imaging system are lightning, focusing optics, detector, a means of wavelength selection, and a computer supported with image acquisition software [114,118]. It is necessary to reach compromise between imaging efficiency and object preservation while setting lightning conditions as the cultural heritage objects require minimum light exposure to minimize the risk of light-induced ageing [114].
According to the data acquisition method, imaging systems may be classified into point (whiskbroom), line (pushbroom), and area scanners [114,119]. The detector type applied in imaging system depends on exploited range of bandwidths: CCD cameras for ultraviolet, visible light, and near infrared (400 nm–1000 nm), InGaAs (indium gallium arsenide) for the wavelength range of 900–1700 nm, or MCT (mercury cadmium telluride) for the range of 900–2500 nm [118,120].
Wavelength selection may be carried out in two ways: Via illumination where only one selected wavelength range is incident on the object at one time or via reflected light where the light reflected from the object is separated spectrally by the detector [114]. The first method involves the use of a light source—a halogen-tungsten lamp (THL) or light-emitting diodes (LEDs). The second wavelength selection method may be achieved through either filtering or dispersing the light reflected from the object. Filtering allows for sequential bands collection usually by placing the filtering system (band-pass interference filters) placed on a wheel between the lens and the detector [114]. Filtering systems that do not require any movement include tunable filters—liquid crystal tunable filters (LCTF) and acousto-optical tunable filters (AOTF) [119]. Simultaneous registration of all bands is possible by dispersing the light using a slit combined with a diffraction grating, providing higher spectral resolution than tunable filters but with reduced flexibility [114].
In the field of cultural heritage, it is impossible to specify one pipeline of data acquisition and processing—each case requires a dedicated approach considering the purpose of the experiment as well as the object features. Nevertheless, there are some issues that have to be considered.
One of the crucial matters is waveband selection, as different parts of the spectrum may reveal different object features and therefore may be used for various purposes. To acquire the imagery of high quality, calibration of the imaging system is needed. It includes radiometric calibration: The removal of fixed pattern noise (dark current), pixel sensitivity normalization, denoising, illumination correction, and finally spectral calibration to reflectance factor [83,121]. For low-cost imaging systems, additional corrections may also have to be applied, e.g., a vignette effect [122].
The next step is image processing including spatial co-registration and mosaicking. Co-registration is necessary in the case of imagery consisting of different bands, which are joint together into a single image cube [121]. If the object is covered by many images, they should be joint together by mosaicking during orthomosaic generation [122] or by panoramic photographic method [120].
In order to identify the materials forming the object, different classification algorithms are used. It is a common practice to use supervised and unsupervised classification strategies interchangeably [123]. Classes detected in laboratory conditions may serve as pigment libraries [124], which may be then used as reference for further field work [115,125,126]. A small number of spectral bands provided by multispectral imagery makes it possible to generate band composites from selected band sets, allowing for visual investigation of acquired data [98,127,128]. Eventually, selected sets of bands acquired by hyperspectral sensors may be also used in this way after the identification of most informative bandwidths [129], but still it is not a common approach. In contrast, combining different bands is a very frequent practice in case of technical photography, where false color photographs are intensively exploited [91,130,131,132,133,134].
Due to high dimensionality of hyperspectral data, pixel classification requires algorithms like spectral angle mapper (SAM), spectral correlation mapper (SCM), support vector machines (SVM) as well as random forests or K-nearest neighbors (K-NN). Artificial neural networks may also be applied in this case [128,135]. The evaluation of bands separation and dimension reduction is performed via algorithms such as principal component analysis (PCA) or t-stochastic distributed neighborhood embedding (t-SNE) [135]. Investigating the mixtures of different materials or pigments requires spectral separation allowing for the estimation of the percentage of each material (i.e., certain pigment) in each mixed pixel [115,136,137].
Spectral imagery is usually used in research relating to flat, 2D objects like paintings, walls, or documents, and as a result, it is commonly associated with 2D documentation, e.g., orthoimages, pigment maps, or simply photographs. However, the scope of information possible to obtain increases if the spectral information is combined with 3D shape reconstruction. The integration of spectral and geometric data was a subject of many works [17,40,83,138,139,140,141,142]. Nevertheless, this issue remains a challenge in the near future.
Combination of spectral data with other documentation and measurement techniques commonly used in the field of cultural heritage increases the potential of such analyses in fields of art history, conservation, and even forensics.
Damage detection is one of the most important applications of spectral imaging. Many works prove the usefulness of multi- and hyperspectral imagery in this field. Integration of two cameras (including a multispectral one) and TLS data operating in different wavelengths was proved to provide spectral data allowing for generation of moisture classification map [123]. As the range between 1.4 um and 1.9 um is considered as “water absorption bands” [114], SWIR (shortwave infrared) sensors operating in this wavelength may also be used for this purpose. SWIR region may be applied in the monitoring of the degradation of painting materials [143]. Multispectral imaging has also been successfully applied in documentation of parchment degradation [144,145] and the analysis of pigment discoloration [140,146] used hyperspectral imagery to map corrosion products on outdoor bronze sculptures.
Pigment identification is a vast field of research regarding the use of spectral imagery. From the conservator’s point of view, the knowledge about the materials used in the original painting is very important since it determines the materials and suitable methods of restoration and conservation. On the other hand, this knowledge allows the art historians for verification of the object’s authenticity. Pigment identification commonly involves the use of VIS-NIR range of spectrum [117,120,124,126,147,148] as the signatures of most inorganic pigments vary significantly in this range, so the spectral information is sufficient to differentiate them. However, to tell apart organic materials like binders, varnishes, or organic pigments, the spectrum of longer wavelengths like SWIR and MWIR is usually needed [149]. Analyses based on SWIR imagery (1000–2500 nm) also proved their usefulness for recognition of materials under the paint (e.g., cardboard) [115]. Moreover, [125] proposed a method of using two hyperspectral imaging systems (one active, laser-based, operating in mid-infrared, and one passive working in the near-infrared spectrum) to prepare a small spectral library of pigments and proved that classification based on imagery acquired in further wavelength range may be successfully used in forgery detection. However, in the case of checking the authentication of paintings, NIR photography also allowed for satisfying results [150].
Data provided by spectral imagery are very informative, but sometimes are not sufficient for exact material identification and to check the hypothesis, the use of additional measurement techniques is needed. To verify the results of pigment mapping based on HSI, XRF [91] or FORS analyses may be used [83,124].
Multi- and hyperspectral imagery can be applied in the detection of past interventions and under drawings on similar basis as aforementioned technical photography. For this purpose, imagery containing near infrared bands have been proved to be particularly useful [114,151]. Hidden features may be detected not only on separate bands or their compositions, but also on their linear combinations [83]. Multispectral imagery may also be used to improve historical documents readability [145].

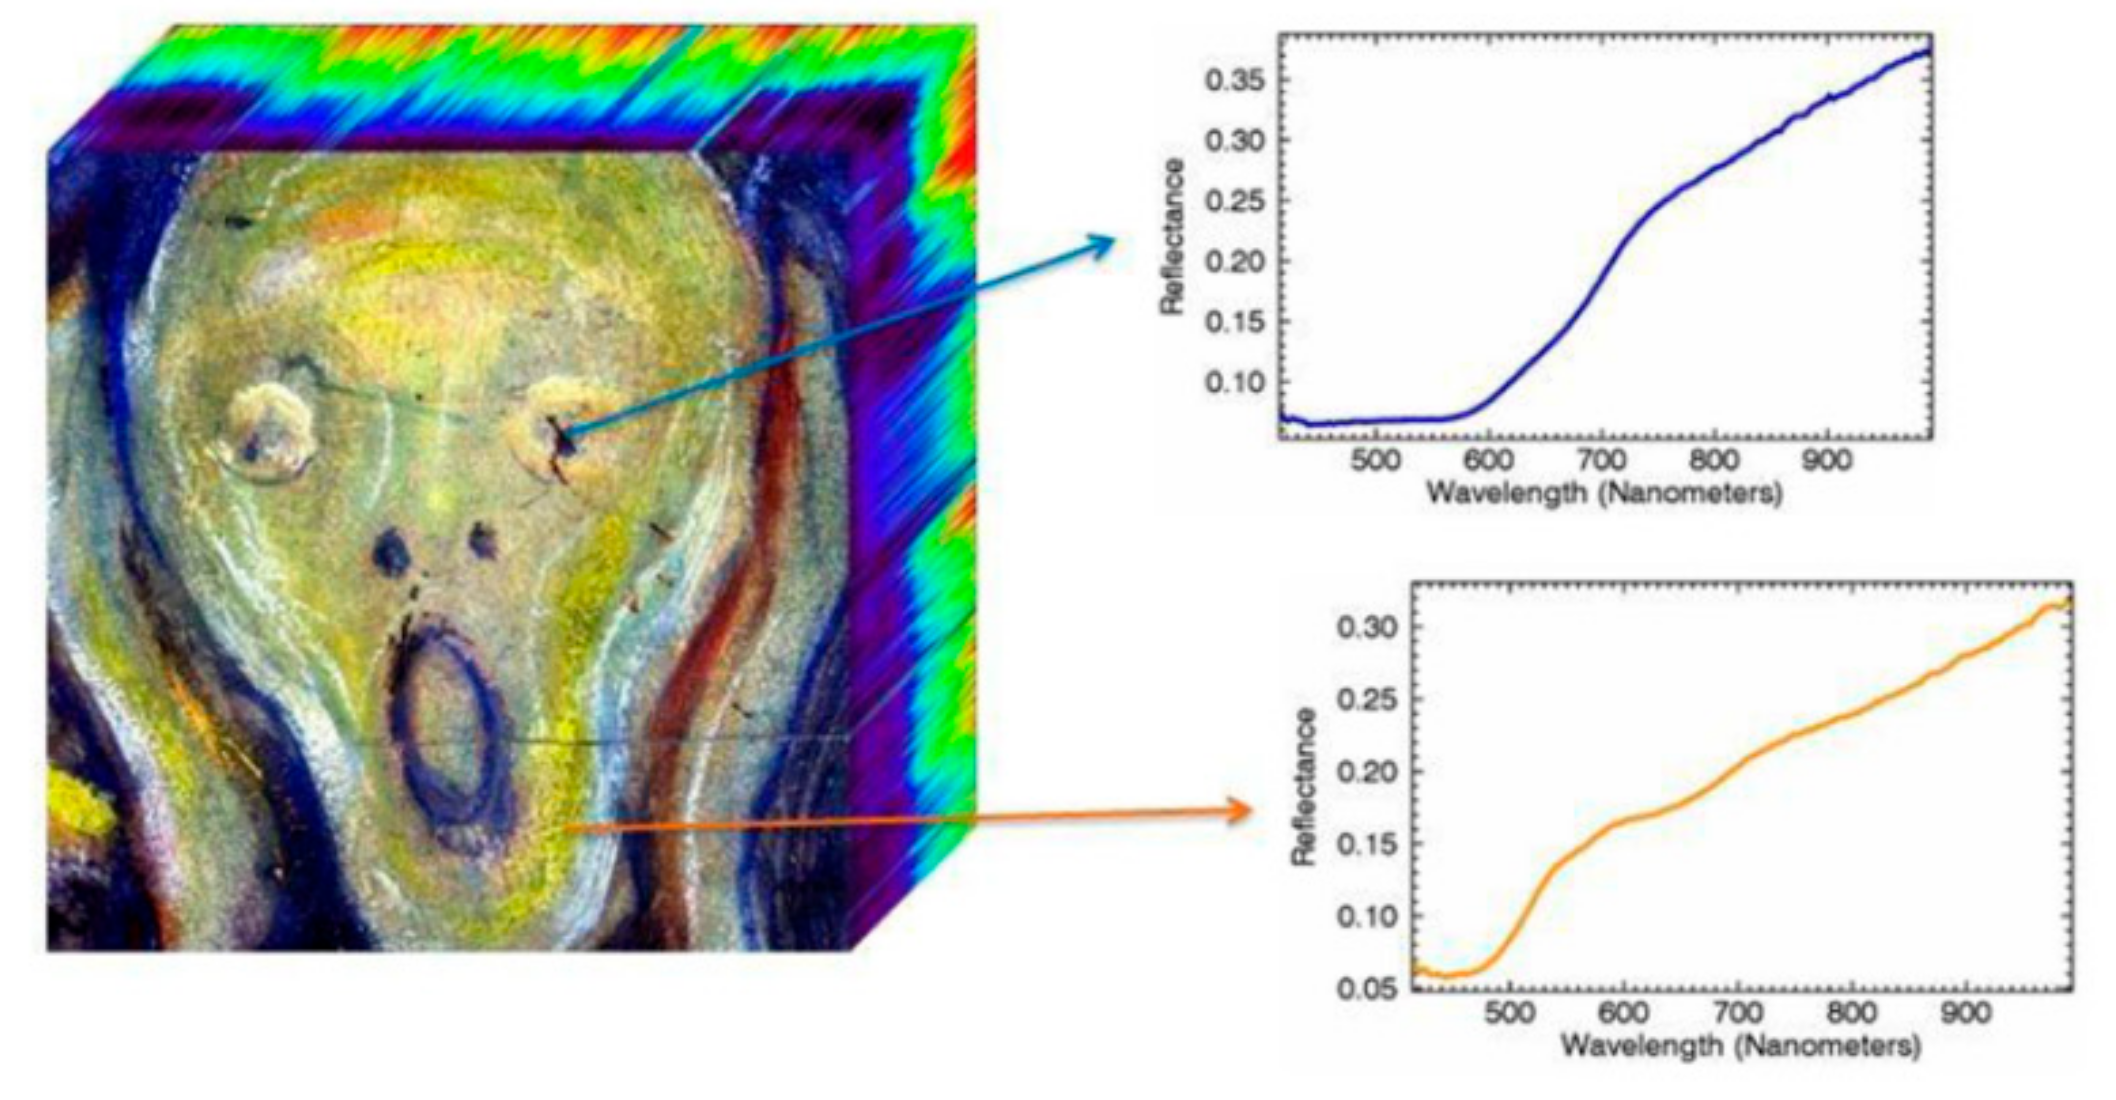
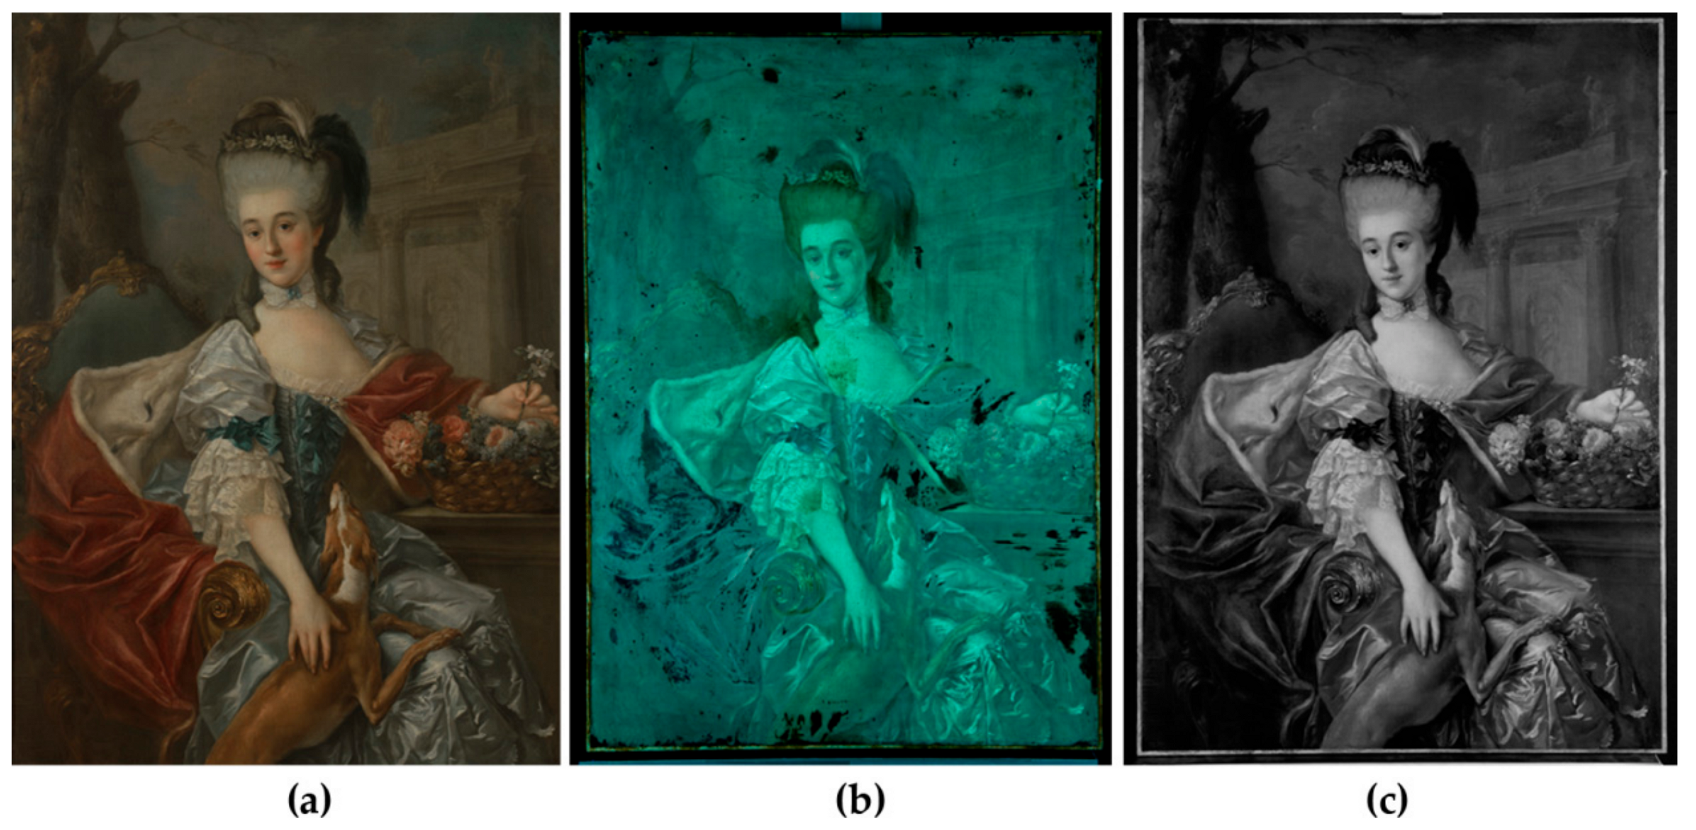
3.3.2. The Application of the Remote Sensing Techniques in Museum of King Jan III’s Palace at Wilanów

In Museum of King Jan III’s Palace, remote sensing measurement techniques are applied in the process of cultural heritage documentation and preservation.
Technical photography is a standard method of documentation of museum collections. Museum of King Jan III’s Palace at Wilanów possesses necessary equipment to acquire photographic documentation, which include RAK photos, UV photos (with and without yellow filter), IR photos, and photos taken under incident sodium light (Figure 20). Depending on the object, pictures in different spectral regions are taken at different stages of the conservation as it was performed during the clearing of the Japanese nanban table in Painting Conservation Studio being a part of Conservation and Prevention Department [152]. UVf and IR images allowed for the identification of varnish and repaintings [153,154] of several paintings contained in Wilanów collections. All photos are stored in an information system collecting all photographs (including scanned archival negatives) along with their metadata and object description and are available in intranet for users within the museum. Photographs are an internal part of conservatory documentation stored by the Documentation and Digitalization Department. Other non-invasive techniques involving the use of UVf, IRR, and XRF were used for extensive analyses performed on two paintings belonging to the museum during the project carried out in cooperation with three polish universities: Academy of Fine Arts in Warsaw, Nicolaus Copernicus University in Toruń, and Eugeniusz Geppert Academy of Art and Design [155].
Another field of interest for non-invasive observations is related to the state of the palace itself as well as the objects permanently linked with it, for instance, wall paintings and frescoes. The state of such objects depends on the environment conditions, but in contrast to mobile objects like sculptures or paintings, they cannot be moved to another place in order to provide stable and convenient temperature or relative humidity. In such case, frequent and regular monitoring of environment parameters is needed as well as the knowledge of the building structure. However, architectural documentation of a historical building providing continuous information about all stages of the building extension is not always available.
Both problems—the need for monitoring of the artwork and incomplete architectural documentation—may be solved via spectral imaging integrated with other non-invasive measurement techniques providing information both of the characteristics of the artwork’s surface and the object inner structure. Such knowledge may be a key to explain the phenomena posing threat to the artworks such as microbiological invasion and damage caused by wall freezing and condensation.

4. The Geographic Information System (GIS)

The idea of geographic information systems is not new—its beginnings are in the 1960s, when GIS was first applied in Canada by Canada Land Inventory with CGIS (Canada geographic information system) [156]. Since then, many definitions of GIS have appeared (much discipline dependent), but in this study, GIS is considered as a technology, science, and methodology applied for problem solving [157], which involves computer-based systems and software capable of managing and analyzing location-linked data and information regarding various phenomena occurring in geographic space. Since GIS allows for the integration of data and information concerning space and objects with their localization, the scope of its possible applications is quite wide starting with geography and life sciences, economics, industry, social sciences [158,159], and ending with extensive use in cultural heritage management and preservation. The possibility to integrate GIS and BIM makes the spectrum of applications even wider. In this section, the methodology and most popular applications of spatial information systems in cultural heritage will be presented and followed by brief characterization of the GIS developed in the Museum of King Jan III’s Palace at Wilanów.
The GIS includes four main functional subsystems regarding data input, data storage, retrieval, manipulation, and analysis of data, as well as output and display of data [160]. The GIS applied for cultural heritage purposes, just like systems supporting any other area, must be designed considering two main aspects: The model of reality (i.e., the way phenomena, objects, and their relations will be presented in the system) and the practical implementation of this model in the system with regard to its future applications, data security, access control, software and hardware limitations, system interoperability, backup polity, etc. Since the Internet has become the main tool for both acquiring and sharing the data and information, geographic information systems have evolved and adapted to this environment. So-called “WebGIS” provides GIS functionality on the Web and usually is an integral or even a main feature of a created system [161,162,163]. According to Pascaul et al. [164] and Luaces et al. [165], the fundamental components of a GIS are: (1) User interface layer, which serves as a graphic user interface (GUI) presenting spatial data, allowing the end users for the interaction with backend services; (2) the application server layer communicating with data sources via the integration layer and allowing users to analyze and manipulate data coming from provider service; (3) the database layer consisting of database management system, which provides the data storage and queries. The problem of system architecture design has been thoroughly investigated in several works [165,166,167].
The creation of a GIS involves a variety of available tools and solutions (both commercial and open-source) including different database management systems (DBMS) (e.g., MS SQL Server, Oracle, PostgreSQL with its spatial extension PostGIS, MySQL) as well as software (e.g., ESRI ArcGIS, GeoMedia, MapInfo, QGIS, GRASS), frameworks, and methods of data dissemination. As a result, interoperability among data and services is necessary. There have been many works regarding standardization aspects of GIS technology performed particularly by the open geospatial consortium (OGC) and the ISO. The OGC proposed the system architecture and recommended data formats [164,168]. Among more than 30 others, OGCset standard of GML (geographic markup language) to exchange data between the WebGIS and web client, and defined comprehensive set of web services including WMS (web map service) and WCS (web coverage service) for raster data and WFS (web feature service) for vector data as well as CSW (catalogue service for web) for sharing metadata. The INSPIRE Directive established the guidelines “regarding the availability, quality, organisation, accessibility and sharing of spatial information”, guaranteeing the interoperability of spatial datasets through network services across Europe [169,170]. Regarding cultural heritage, the CIDOC conceptual reference model (CIDOC-CRM) developed by ICOM/CIDOC Documentation Standard Group is the best known and widespread proposal of modelling the information and preparing documentation of cultural heritage objects [171].

4.1. GIS Applications

In the area of cultural heritage, GIS began to be applied in the 1990s, first in the field of archaeology [172,173,174,175,176]. Since then, GIS has been successfully adopted as a tool for the identification, documentation, management, and conservation of cultural heritage objects as well as for sharing the knowledge about them with people, providing the opportunity to understand phenomena and relations between them from spatiotemporal and multi scalar point of view [158,177]. The use of GIS may support research concerning both tangible/material heritage (archaeology, architecture, landscape) and intangible/immaterial heritage (routes of pilgrimages, the area of using a certain language) [158,170].

4.1.1. Archaeology

In the field of archaeology, the application of GIS technology is probably the most conscious and sophisticated. GIS has been used as a tool for documentation of an archaeological site together with setting up an integrated management plan for sites [177,178]. With integration of other data such as LiDAR and remote sensing satellite imagery, it was proven useful for assessing the overall risk relating cultural heritage sites (erosion, landslides, sea level rise, anthropogenic risks) by linking hazard database with threatened sites location [179] together with cultural resources management (CRM) and performing spatial analyses regarding archaeological prospection, i.e., detection of new archaeological sites [180,181,182]. GIS may be also successfully applied in recording single archaeological sites during excavation works. Since accurate and reliable stratigraphic information is crucial for archaeological analyses, the application of so-called 3D GIS is particularly reasonable, especially due to increasing popularity and availability of 3D measurement techniques such as photogrammetry and TLS. Unlike 2D GIS with added digital elevation model (DEM), 3D GIS makes it possible to reconstruct 3D relations between objects and, as such, it may support the identification of relations between trenches or post-deposition disturbances [183], assessing the damage of an archaeological site [184], conducting visibility analyses [184,185], reconstructing ancient landscape in VR environment [186], or performing volumetric calculations [187,188]. By adding the temporal information to 3D spatial data and database containing descriptive information, it is more and more common to build a temporal GIS (or 4D GIS) allowing one to query and visualize objects belonging to cross-cut different time periods [189]. Depicting archaeological data complexity, 4D GIS has been used in many archaeological applications [100,190,191,192,193].

4.1.2. Architectural and Cultural Landscape

Cultural heritage management and preservation involve a range of activities conducted at different scales and levels of detail. GIS serves as a tool to retrace historical, geographical, and environmental context of historic objects located in a certain region, helping to understand changes of the historical landscape [163,194] and linking information regarding tangible and intangible heritage with each other [195]. On the other hand, known environment context provides the possibility to predict and map potential threats, both natural and human-induced [196,197,198] as well as to plan revitalization and restoration works and appoint priority areas [196,199] pointed out that the ability to query data stored in an orderly manner in GIS allows monitoring the changing number of cultural heritage objects protected by the government while preparing official reports. Furthermore, the combination of database containing information about the object and its attractive representation via 3D model could have an impact on the increase of cultural tourism and encourage the audience (especially young people who are major users of new technologies) to take interest in their culture in a spontaneous way [200].

4.1.3. Architectural Heritage—Building Information Modelling

Historical architectural heritage objects are in constant need of maintenance, repair, and restoration. Several works involved the use of GIS technology to map and monitor signs of cultural heritage degradation [201]. However, to manage architectural heritage in high scale, that is, to meet the needs of conservation engineering and provide detailed documentation of building properties and structure, GIS is often not sufficient [195]. In such case, building information modelling (BIM) [202] may be applied, especially as a complementary tool for GIS. Derived from the management necessities of architectural and engineering industry, it provides an integrated representation of both physical and functional characteristics of a building [203], based on 3D survey techniques (photogrammetry, TLS, classical surveying, and their integration). 3D geometric models showing current physical condition of a historic building combined with GIS database collecting information about its historic evolution, material composition, state of conservation, etc., enhance the potential of cultural heritage modelling and consequently gains popularity in this field.
Being primarily developed for the design, building, and future management of new buildings, BIM may be successfully used as HBIM (historic BIM) for automatic generation of conservatory documentation, analyses of historic structures, as well as to produce visualizations supporting historical building preservation [204,205,206]. Dora et al. [205] developed HBIM in order to visualize the current state of damage of a historic building (here: Four Courts in Dublin) and carry out structural analyses and decay mapping, serving as a basis for the proposed conservation interventions. On the other hand, in the case of the Basilica di Collemaggio, which was severely damaged as a result of an earthquake, HBIM was applied for multiple purposes, including simulation of different scenarios of making decisions about the crashed dome, for the construction site management during different phases of restoration as well as to support structural analyses [207]. HBIM may also be helpful while performing stratigraphic analyses of the structure elements—especially to understand the construction rules, which are no longer in use [208] as well as to gain information about temporal stratification of a building [209,210,211]. This allows the experts to identify different chronological sequences of the building construction, but also to monitor progressing process of materials transformation and degradation and evaluate the risk and vulnerability elements [212]. It may be also used to monitor the building performance considering factors such as acoustic, thermal, moisture, or energy performance [213]. Consequently, HBIM creates new possibilities for sharing different information inside a single digital environment [212,214] investigated the possibilities of integration of two approaches in the conservation of architectural heritage: BIM and integrated project delivery (IPD)—a new delivery system gaining popularity in construction industry. Implementation of BIM/IPD would enhance conservation projects being a mechanism for involving key participants and multi-discipline knowledge as well as data sharing to support the decision-making process and minimize potential risk. Some authors see the future potential of BIM in cultural heritage as a way of increasing portability and providing data to a wider user community for different purposes, e.g., via virtual reality (VR) and augmented reality (AR) technologies [209,213,215].
However, the application of BIM to heritage objects stages multiple challenges arising from the specific nature of such objects. As BIM exploits the objects segmentation into parametrically described shapes, it is difficult to model historical buildings since they are characterized by varied shapes and composed of the complex components. Such shapes usually do not exist in BIM libraries, making the issue of providing data interoperability still open. The task becomes even harder considering the objects changes due to deterioration over time. Furthermore, the construction of a model is often hampered by lack of complete source architectural documentation. Also, the tools provided by the software available are usually not sufficient to model hierarchical relationships of architectural elements and store attributes necessary from the conservator’s point of view [203].
The research performed on artworks during conservation and restoration works involves a variety of measurement techniques, the results of which may be successfully integrated in GIS environment for documentation purposes as well as for further analyses including multitemporal approach in order to document and evaluate present conservation and restoration techniques [216]. Some research carried out in recent years proved the usefulness of this technology as a tool for monitoring of safety of museum collections [217]. Another example of such use of GIS is the case of GIS developed in the Museum of King Jan III’s Palace at Wilanów. GIS may also be used for supporting sustainable tourism serving as a visitor information service while planning the visit or during the visit as well [218].
The abovementioned applications of GIS and BIM do not exhaust the issue of possible use of these technologies in the field of cultural heritage management and preservation. The potential of multidisciplinary knowledge and skills combination in this field has been spotted and resulted in increasing number of collaboration projects involving conservators, art historians, archaeologists, GIS specialists, and photogrammetrists. This gives rise to the hope that cultural heritage preservation will be more and more efficient.

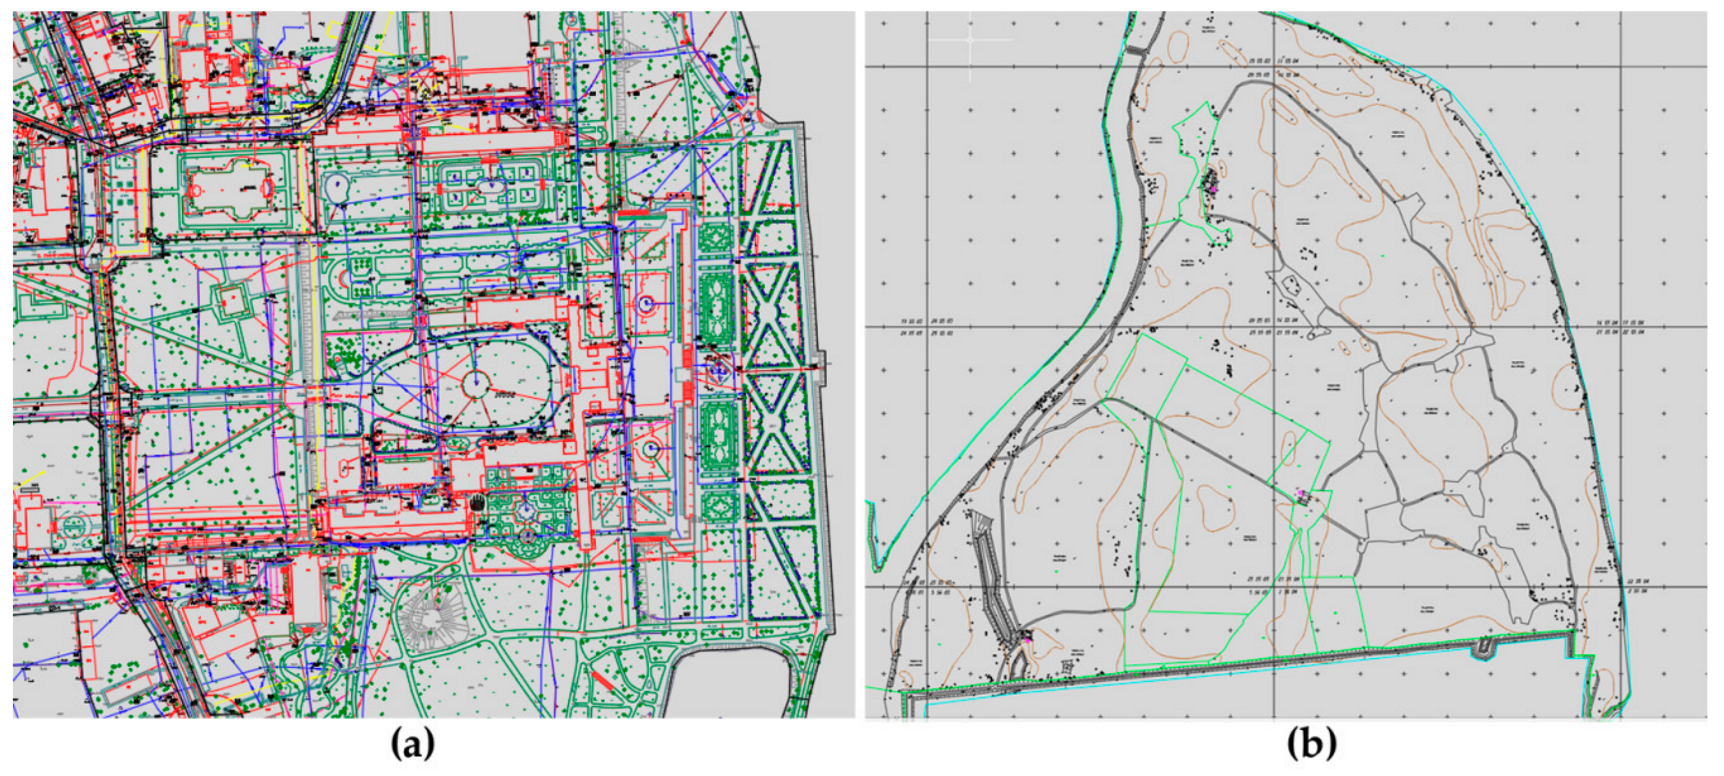
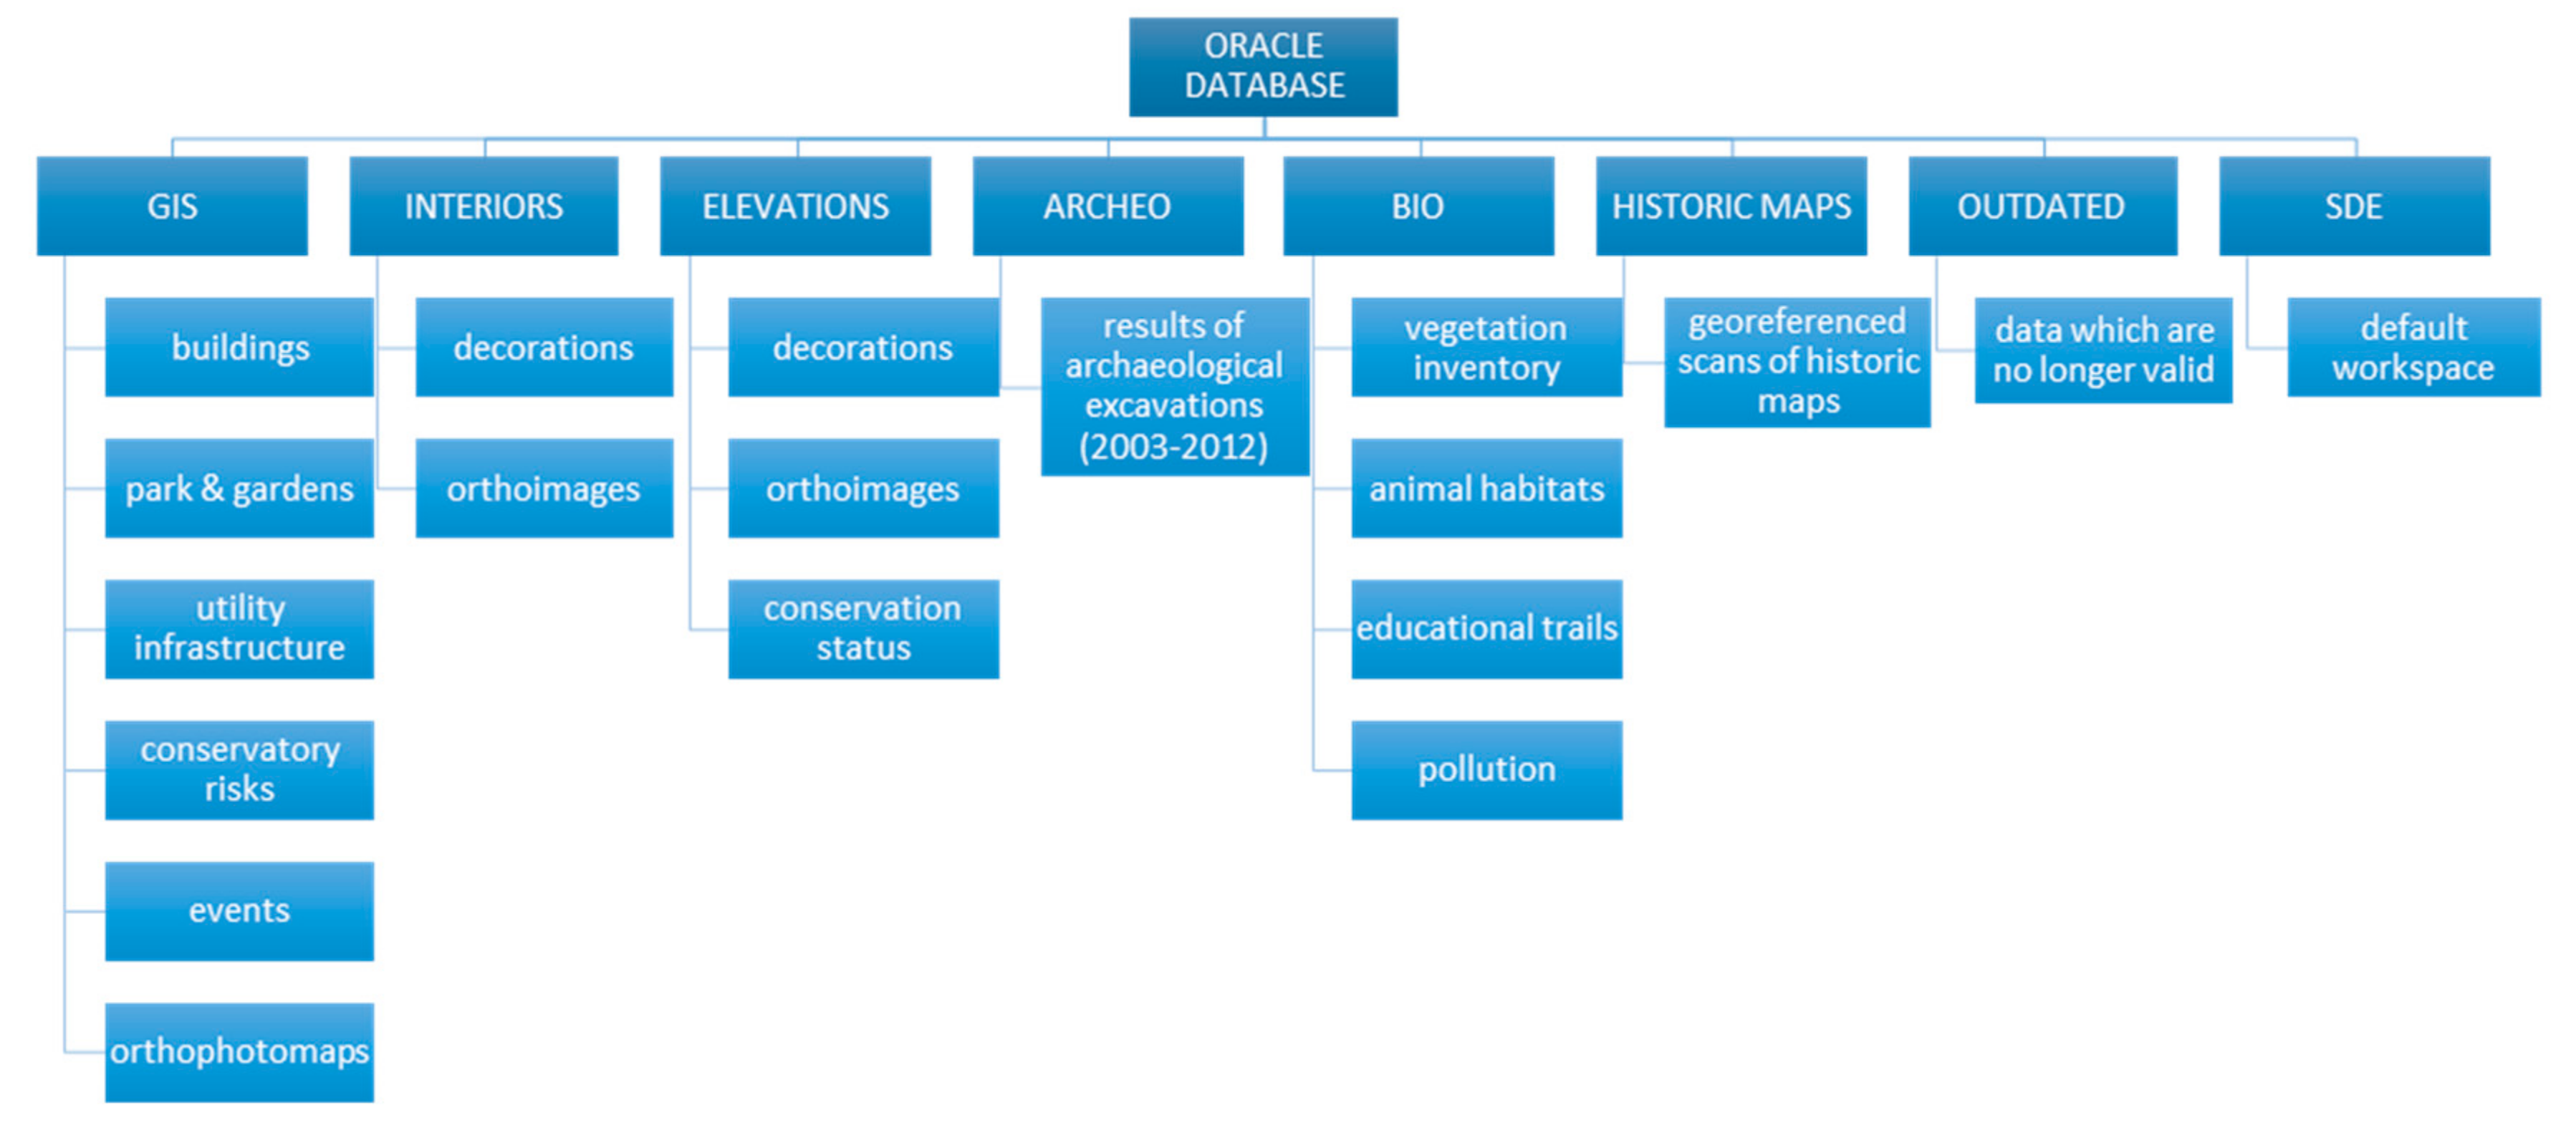
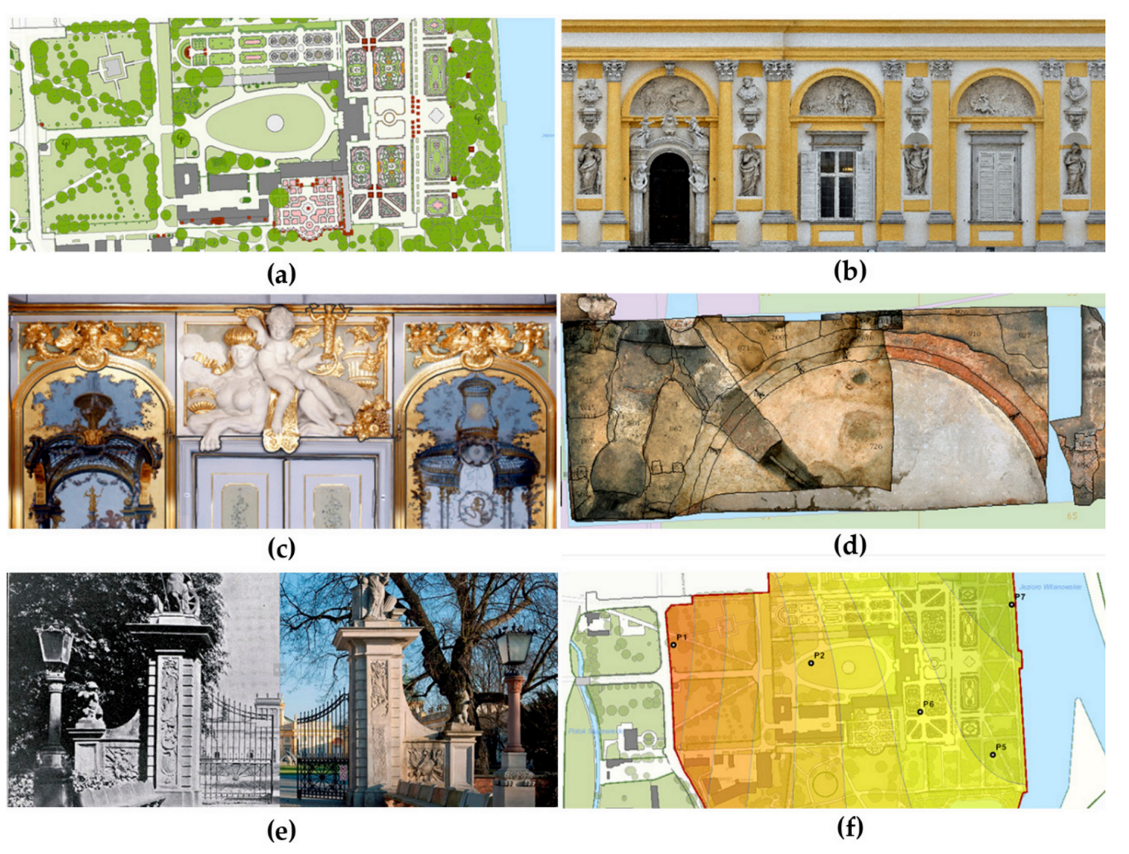
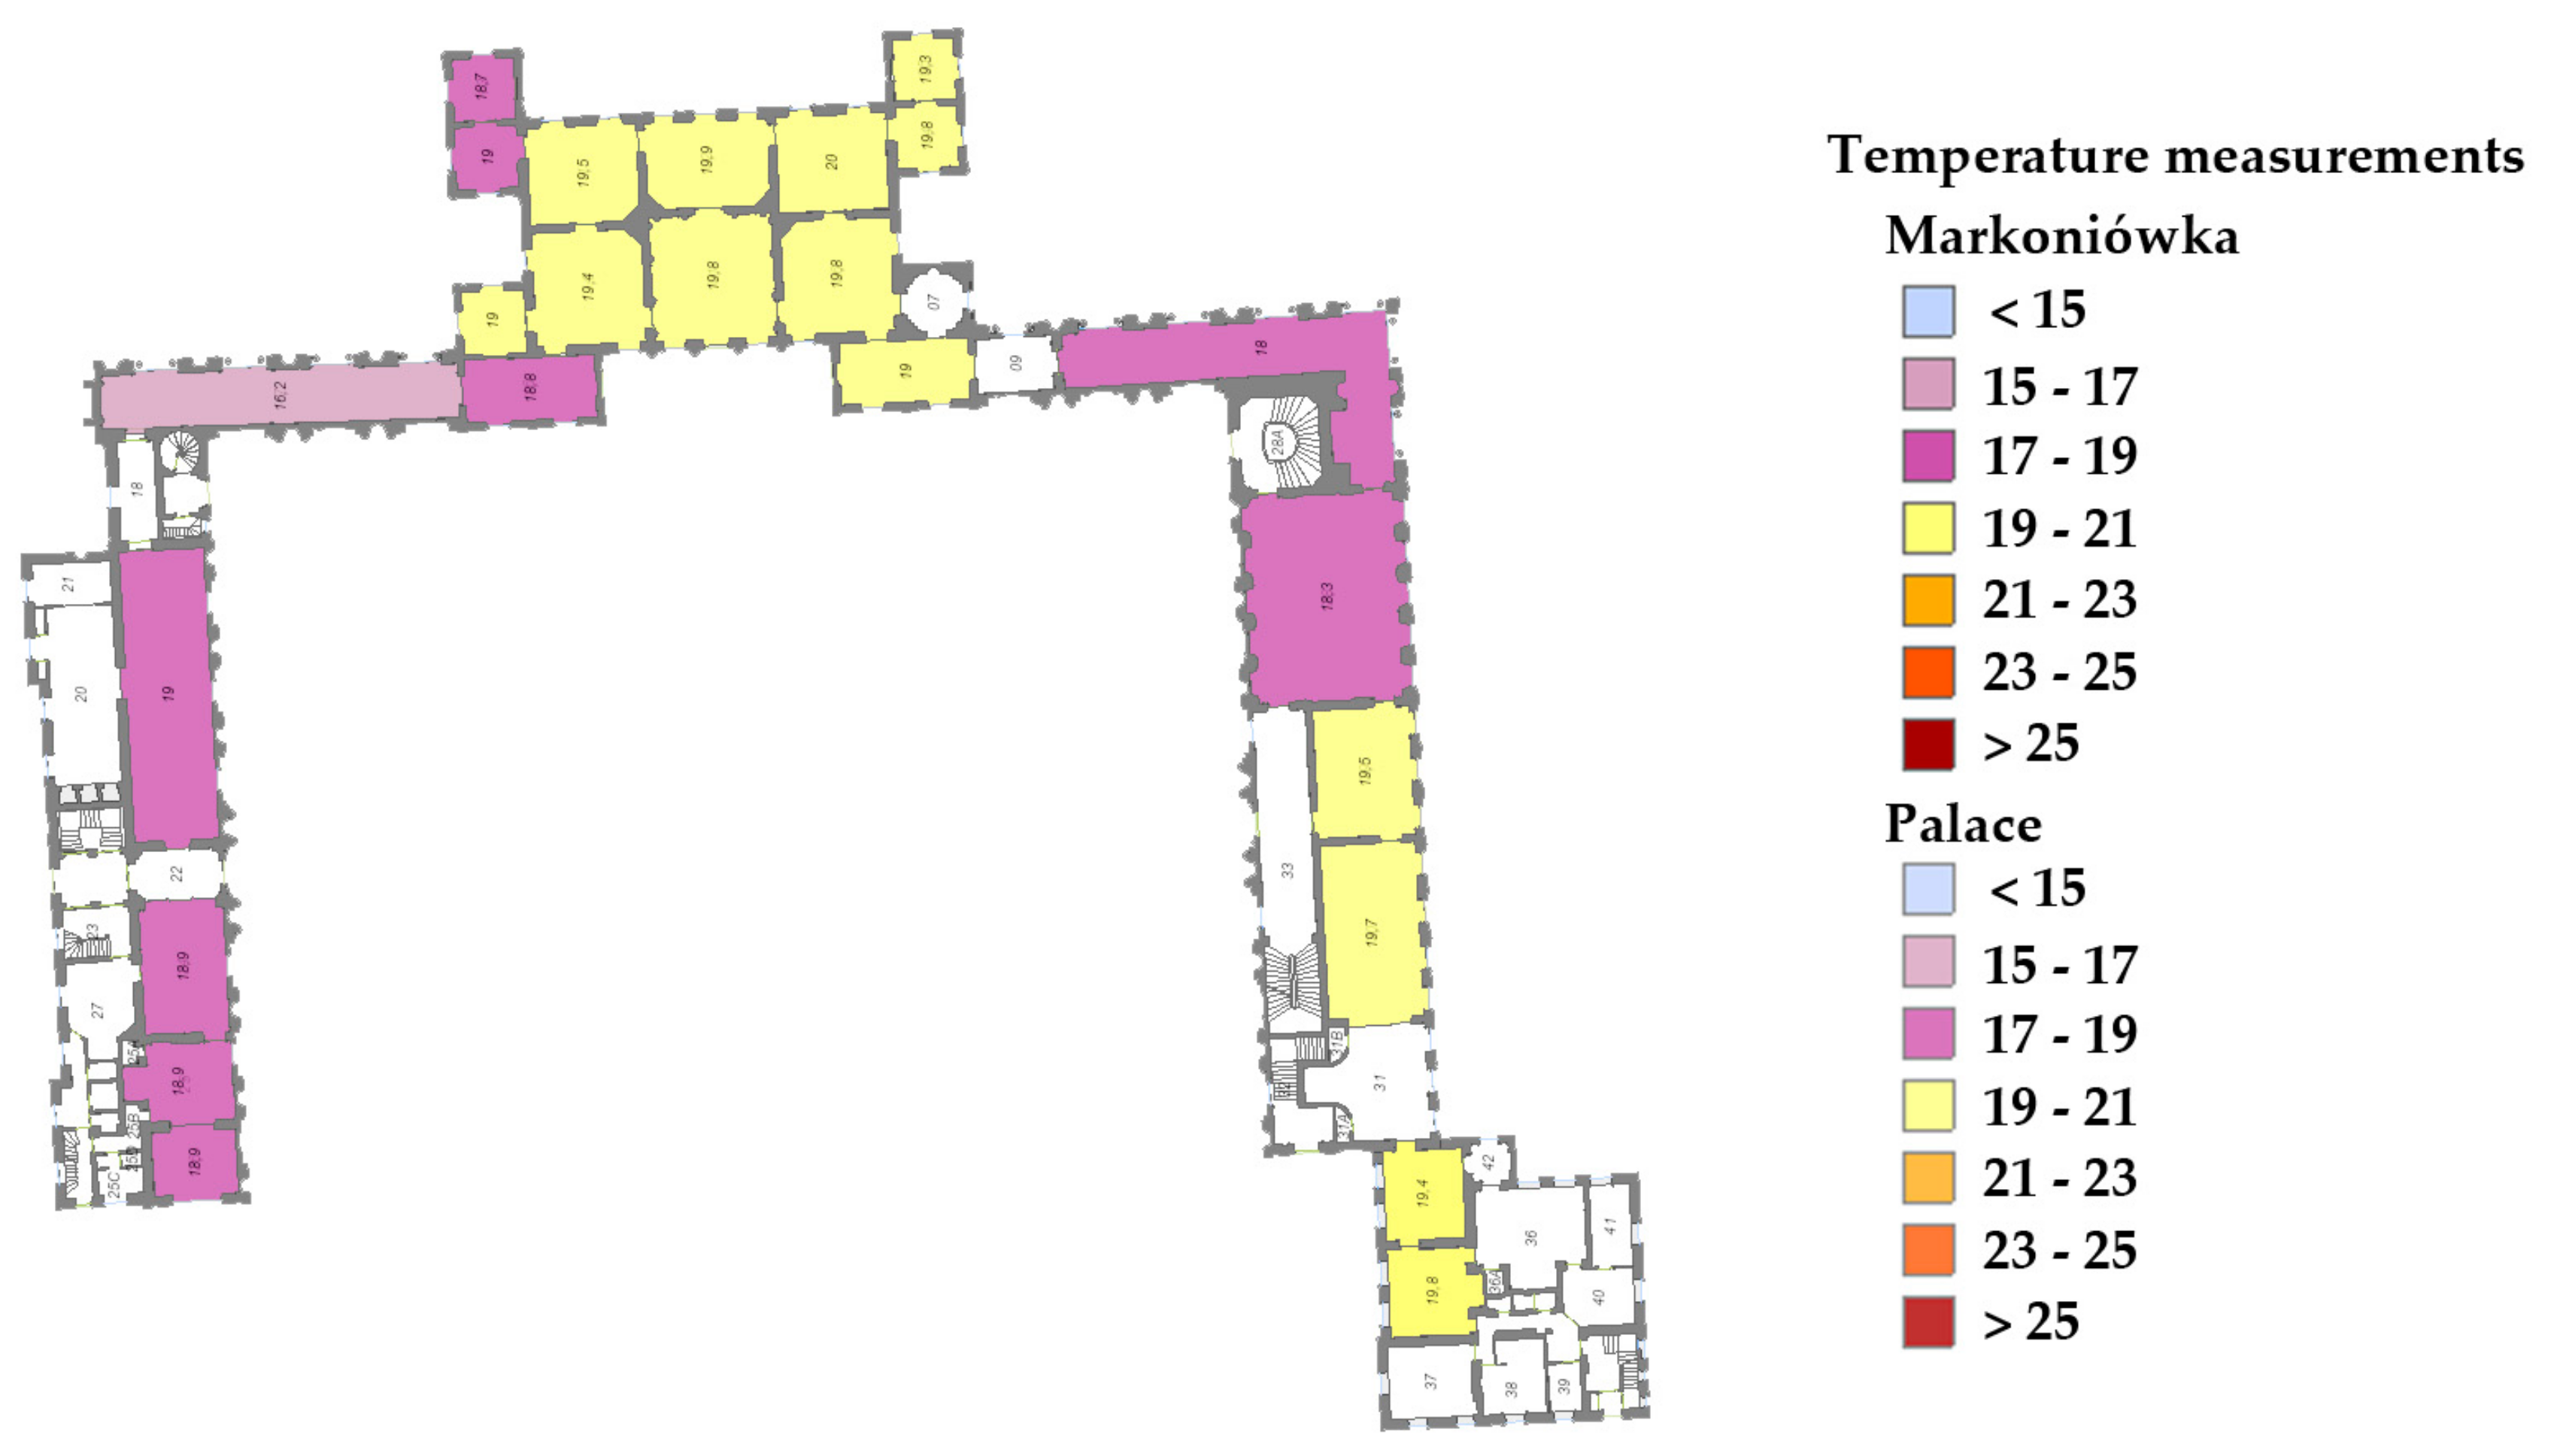
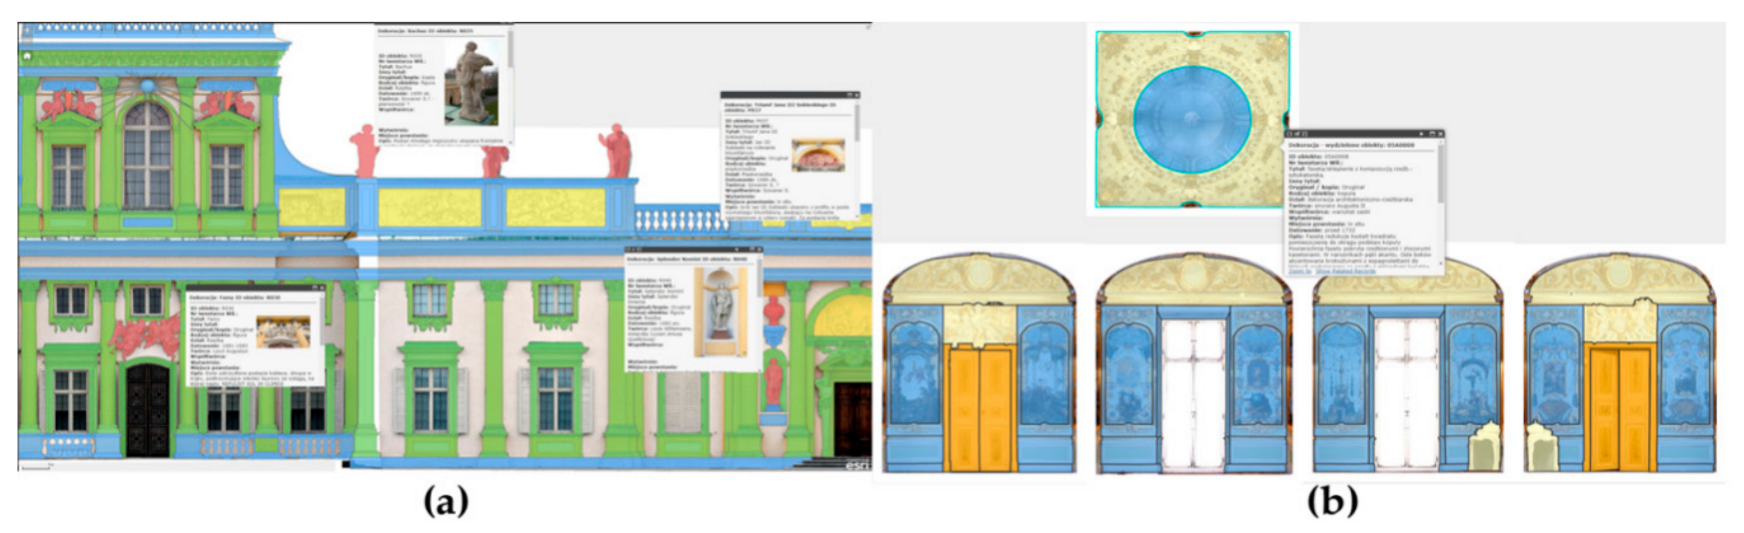
4.2. The Use of GIS in the Museum of King Jan III Palace at Wilanów

The use of geographic information system in the Museum of King Jan III’s Palace at Wilanów started in 2010 and is now one of several information systems existing in the museum. GIS provides extensive spatial and descriptive information about the whole museum space as well as its surroundings in a wide range of scales starting with the general information about the park and palace complex and ending with detailed descriptions of single decorations in the Palace rooms. Developing a system containing such rich data collection requires participation of experts specializing in different fields: GIS specialists, photogrammetrists, landscape architects, art historians, and conservators, in order to provide correct and complete information about the objects.
The GIS in the museum runs on an Oracle database. For administering the system, Oracle SQL Developer and ArcGIS software were used. The publication of services online was performed by using ArcGIS Server. To provide data security, automatic incremental and full backups were performed. Data, which are no longer valid, are not permanently deleted from the database, but stored in dedicated database schema (OUTDATED). SDE schema serves as a default workspace for each user.
The system structure is organized in eight schemas created on one instance of the database—each one contains data considering one topic (Figure 21).
The system stores data about the spatial arrangement of the park and palace complex (GIS schema) i.e., characteristics of buildings, gardens, utility infrastructure, and events as well as the information about the environment parameters and nature (BIO schema, Figure 22f) with the accuracy level matching the master map. The GIS schema also contains plans of buildings derived from architectural documentation allowing for fast map-making for different purposes like planning events and renovation schedule. All data are georeferenced in the national coordinate system PL-2000 zone 7 (EPSG: 2178) consistent with the master map and other large-scale maps created in Poland. Other schemas functioning in this coordinate system are ARCHEO (Figure 22d) and HISTORIC MAPS (Figure 22e). In the ARCHEO schema, the results of archaeological excavations are stored along with all relating documentation including profiles, photos, orthoimages, and archaeologists’ notes while HISTORIC MAPS schema contains scans of 81 archival maps coming from 17th, 18th, 19th, and 20th centuries, which were georeferenced in the national coordinate system PL-2000 via affine transform. As they are compatible with other data stored in the GIS, they are used as source data for wide range of historic analyses, which are necessary for the museum during investment planning. The GIS provides rich and detailed information about the decorations regarding the Palace and the adjacent building—Markoniówka. INTERIORS (Figure 22c) and ELEVATIONS (Figure 22b) schemas store the contours of decoration objects located in rooms and on the elevations, respectively, along with their descriptions prepared by art historians and conservators together with the conservatory documentation and photographs attached.
As mentioned before, constant monitoring of environment parameters is crucial for proper maintenance of cultural heritage objects. The monitoring in the museum is carried out by several systems using sensors located both inside the buildings and in the park. These sensors measure parameters like temperature, relative humidity, or dust in real time. One of these systems, SAVERIS, is integrated with the GIS linking tables containing the measurements’ results with the database. This allowed for the creation of map application called MARIWIL, which enables the visualization of abovementioned parameters on the map, which is updated automatically every 15 minutes (Figure 23). The application is available for all GIS users within the institution via web browser. This allows for easy access to the data and makes it available to take actions necessary to protect the museum objects immediately.
Photogrammetric products are an integral part of the GIS. The data relating to the whole museum area can be projected on high-resolution (GSD = 4 cm and GSD = 3 cm) RGB true-orthophotomaps generated from aerial photographs taken from a drone. There are also two multispectral true-orthophotomaps consisting of green, red, and two near infrared bands. Such imagery may be applied by specialists in Garden Department to analyze the condition of vegetation-by-vegetation indices as well as to map changes of the South Pound shoreline. On the other hand, orthoimages generated from TLS point clouds with RGB information were the basis for the separation of decorations in INTERIORS and ELEVATIONS schemas (Figure 24).
Collection and integration of multi-source and multi-temporal data regarding objects located in the museum area in one uniform database system allows for multi-criterial spatial and attribute queries. It is of great support for the institution management like utility infrastructure development as well as other investments and maintenance of historic buildings and gardens. Moreover, the GIS allows for spatial analyses regarding environmental tests performed in the area of the park and palace complex. Finally, it is an effective way of data dissemination—it provides basic information about the museum to visitors in order to help them plan their trip and makes the information and knowledge about the museum and its historical treasures easily accessible.

5. Conclusions

Many countries around the world are blessed with particularly rich cultural heritage, which require further protection, promotion, and maintenance of cultural diversity for the future generations. This also contributes to the development of social and cultural wellbeing. Nowadays, many researchers explore different methods for documentation, management, and sustainability of cultural heritage, which have become an interdisciplinary approach to the development of the culture. The aim of this article was to demonstrate how modern technologies can change the current state of cultural heritage and contribute to its protection and promotion.
In this study, various existing technologies for appropriate and accurate architectural and archaeological documentation for management and suitability of culture heritage based on the case study in the Museum of King Jan III’s Palace at Wilanów were investigated. One of the common techniques used is classical surveying. It provides the ground-truth data and a reference for other image-based and range-based measurements. This technique is also used to measure object’s shape and to determine its location on the Earth’s surface, which is important for monitoring of the building’s deflection over the period. Rapid development of modern photogrammetric methods enabled easier preparation of architectural documentation. As a result, object documentation based on terrestrial laser scanning (TLS) and photogrammetry has become a standard in investigation and restoration of historical objects and sites. TLS is an important technique applied for the 3D investigation that offers a high accuracy and the possibility for measuring billions of 3D points with a high level of measurements automation. Modern image-based close-range photogrammetry based on the combination of structure-from-motion (SfM) and multi-view stereo (MVS) allows for digital reconstruction of the object to produce metric documentation in a fully automated 3D reconstruction process involving simultaneous estimation of camera orientation, self-calibration, and dense point cloud generation.
Recently, much attention has been paid to contactless measurements (remote sensing) focused on detecting and identifying objects as well as exploring their features. One of the non-destructive techniques is ground penetration radar (GPR), which provides a complete architectural framework of a building to plan conservation, restoration, or structural monitoring of cultural heritage assets. Among remote sensing techniques, involving the use of both passive and active devices, spectral imaging plays a key role. Fiber optic reflectance spectroscopy (FORS) is now commonly used as a non-invasive analysis of cultural heritage objects. It is a point-based method allowing for the measurement of spectral reflectance in selected points of the object via portable devices based on fiber optics. FORS is particularly useful in case of investigation of pigments, binders, and fiber type of canvas used in paintings and frescoes. The other non-invasive techniques are based on X-ray, namely X-ray fluorescence (XRF), X-ray diffraction (XRD), and X-ray radiography. XRF and XRD are spot analysis methods allowing for identification of characteristic elements contained by object materials, especially pigments, and offer the possibility of elemental mapping.
Spectrofluorimetry (fluorescence spectroscopy) is a contactless method aiming to make objects (materials, pigments) fluoresce. Spectrofluormetry may be successfully applied in pigment identification as well as in detecting hidden drawings and signatures and micro defects such as scratches on e.g., varnish layer. Near infrared reflectography has proved its usefulness in pigment identification and distinguishing replicas and involvement in thermographic analyses. Infrared thermography (IRT) is used to examine the state of cultural heritage objects. IRT is applied either as “passive thermography” when only the occurring temperature vibrations of the object are analyzed or “active thermography” if the registered radiation is emitted by an external source.
The final reviewed technique is close-range multispectral and hyperspectral imagery, which is predominantly used in research related to flat, 2D objects (e.g., paintings, walls, or documents) and as a result, it is commonly associated with 2D documentation, e.g., orthoimages, pigment maps, or simply photographs.
It is important to ensure that the collected documentation is appropriately managed, stored, and maintained. Geographic information system (GIS) allows for the integration of data and information concerning space and objects with their localization. The scope of its possible applications starts with geography and life sciences, economics, industry, social sciences, and ends with extensive use in cultural heritage management and preservation. The possibility to integrate GIS and BIM makes the spectrum of applications even wider.
The presented overview of the methods and techniques commonly used in the Museum of King Jan III’s Palace at Wilanów might be implemented in another cultural heritage institutions. Using different techniques, both for 3D shape reconstruction and condition analysis/structural health analysis (remote sensing techniques), integrated in GIS allows for documentation, management, sustainability, and protection of cultural heritage.

Author Contributions

A.T., J.N., J.M., S.Ł., and P.K. organized the conceptualization of the idea and the methodology employed in this paper. Following that, J.M., A.T., S.Ł., and J.N. worked on the critical evaluation of the existing techniques. A.T., J.M., and J.N. worked on the data acquisition in the Museum of King Jan III’s Palace at Wilanów. The original writing and draft preparation were carried out by A.T., J.N., J.M., S.Ł., and P.K.; and M.M. carried out the review and editing.

Funding

This project has not received funding.

Acknowledgments

The authors would like to thank Waldemar Markiewicz, the ex-Head of Documentation and Digitalization Department of Museum of King Jan III’s Palace in Wilanów, for help, consultation and support in writing this article.

Conflicts of Interest

The authors declare no conflict of interest.

References

  1. Kloczowski, J.; Ratajski, S.; Janikowski, R.; Krzysztofek, K.; Myczkowski, Z.; Jalowiecki, B.; Tomaszewski, A.; Purchala, J.; Chwalibog, K.; Skalski, K. Kultura a Zrownowazony Rozwoj: Srodowisko, lad Przestrzenny, Dziedzictwo w swietle dokumentow UNESCO i innych organizacji miedzynarodowych; Polski Komitet do Spraw UNESCO: Warszawa, Poland, 2000; ISBN 9788390293943. [Google Scholar]
  2. United Nations. Report of the World Commission on Environment and Development: Our Common Future; United Nations: New York, NY, USA, 1987. [Google Scholar]
  3. United Nations. Convention: On the Proptection and Promotion of the Diversity of Cultural Expressions; United Nations: New York, NY, USA, 2005. [Google Scholar]
  4. Larsen, P.; Logan, W. World Heritage and Sustainable Development: New Directions in World Heritage Management; Routledge: Abingdon, UK, 2018; ISBN 9781138091405. [Google Scholar]
  5. Girard, L.F.; Nijkamp, P. Cultural Tourism and Sustainable Local Development; Taylor and Francis: Abingdon, UK, 2016; ISBN 9781351946902. [Google Scholar]
  6. Guyette, S. Sustainable Cultural Tourism: Small-Scale Solutions. BearPath Press: Bath, UK, 2013; p. 375. ISBN 0985878800. [Google Scholar]
  7. Katsoni, V.; Upadhya, A.; Stratigea, A. Tourism, Culture and Heritage in a Smart Economy; Springer International Publishing: Cham, Switzerland, 2017; ISBN 978-3-319-47731-2. [Google Scholar]
  8. United Nations Environment Programme. Available online: https://www.unenvironment.org/ (accessed on 8 November 2019).
  9. United Nations Development Programme. Available online: https://www.undp.org/ (accessed on 8 November 2019).
  10. Horizon 2020. Available online: https://ec.europa.eu/programmes/horizon2020/en (accessed on 8 November 2019).
  11. European Fund for Sustainable Development. Available online: https://ec.europa.eu/europeaid/tags/european-fund-sustainable-development-efsd_en (accessed on 8 November 2019).
  12. Ministerstwo Kultury i Dziedzictwa Narodowego. Statut Muzeum Pałacu w Wilanowie; Ministerstwo Kultury i Dziedzictwa Narodowego: Warszawa, Poland, 2011.
  13. Passage to Knowledge Museum of King Jan III’s Palace at Wilanów. Available online: https://www.wilanow-palac.pl/pasaz?m=n (accessed on 3 December 2019).
  14. Photogrammetric capture the ‘3 x 3’ rules. Available online: https://www.cipaheritagedocumentation.org/wp-content/uploads/2017/02/CIPA__3x3_rules__20131018.pdf. (accessed on 6 December 2019).
  15. THE LONDON CHARTER FOR THE COMPUTER-BASED VISUALISATION OF CULTURAL HERITAGE Preamble Objectives Principles. Available online: . http://www.londoncharter.org/fileadmin/templates/main/docs/london_charter_2_1_en.pdf (accessed on 6 December 2019).
  16. Narodowy Instytut Dziedzictwa. Dobre Praktyki w Zakresie Wykonywania Dokumentacji Zabytków Architektury Współczesnymi Metodami Naziemnej Rejestracji Cyfrowej; Narodowy Instytut Dziedzictwa: Warszawa, Poland, 2008.
  17. Campos, M.B.; Tommaselli, A.M.G.; Ivánová, I.; Billen, R. Data product specification proposal for architectural heritage documentation with photogrammetric techniques: A case study in Brazil. Remote Sens. 2015, 7, 13337–13363. [Google Scholar] [CrossRef] [Green Version]
  18. Costanzo, A.; Minasi, M.; Casula, G.; Musacchio, M.; Buongiorno, M.F. Combined use of terrestrial laser scanning and IR Thermography applied to a historical building. Sensors 2014, 15, 194–213. [Google Scholar] [CrossRef] [PubMed] [Green Version]
  19. Lanteri, L.; Agresti, G.; Pelosi, C. A New Practical Approach for 3D Documentation in Ultraviolet Fluorescence and Infrared Reflectography of Polychromatic Sculptures as Fundamental Step in Restoration. Heritage 2019, 2, 207–215. [Google Scholar] [CrossRef] [Green Version]
  20. Verhoeven, G.; LBI for Archaeological Prospection and Virtual Archaeology, Vienna, Austria. Personal Communication: Tutorial Structure-from-Motion Solutions for heritage 3D Documentation: Pros and Cons, Issues and Solutions, Riva del Garda, ISPRS Technical Commission V Symposium, 2014.
  21. Markiewicz, J.S.; Zawieska, D. Terrestrial scanning or digital images in inventory of monumental objects?-Case study. In Proceedings of the International Archives of the Photogrammetry, Remote Sensing and Spatial Information Sciences-ISPRS Archives, Riva del Garda, Italy, 23–25 June 2014; Volume 40. [Google Scholar]
  22. Daum, M.; Dudek, G. On 3-D surface reconstruction using shape from shadows. In Proceedings of the 1998 IEEE Computer Society Conference on Computer Vision and Pattern Recognition, Santa Barbara, CA, USA, 23–25 June 1998; pp. 461–468. [Google Scholar]
  23. Santana Quintero, M.; Lerma, J.L.; Heine, E.; Van Genechten, B. Theory and Practice on Terrestrial Laser Scanning: Training Material Based on Practical Applications, 4th ed; Universidad Politecnica De Valencia Editorial: Valencia, Spain, 2008; pp. 1–241. [Google Scholar]
  24. Schreiner, M.; Wiesinger, R.; Vetter, W. Identification and Preservation of Cultural Heritage. Available online: https://www.chemistryviews.org/details/ezine/9610631/Identification_and_Preservation_of_Cultural_Heritage.html (accessed on 6 December 2019).
  25. Arif, R.; Essa, K. Evolving Techniques of Documentation of a World Heritage Site in Lahore. ISPRS-Int. Arch. Photogramm. Remote Sens. Spat. Inf. Sci. 2017, XLII-2/W5, 33–40. [Google Scholar] [CrossRef] [Green Version]
  26. Gonizzi Barsanti, S.; Remondino, F.; Visintini, D. 3D surveying and modeling of archaeological sites - Some critical issues-. ISPRS Ann. Photogramm. Remote Sens. Spat. Inf. Sci. 2013, 2, 145–150. [Google Scholar] [CrossRef] [Green Version]
  27. Remondino, F.; El-hakim, S. Image-based 3D modelling: A review. Photogramm. Rec. 2006, 21, 269–291. [Google Scholar] [CrossRef]
  28. Vacca, G.; Quaquero, E.; Pili, D.; Brandolini, M. GIS-HBIM integration for the management of historical buildings. Int. Arch. Photogramm. Remote Sens. Spat. Inf. Sci. 2018, 42, 1129–1135. [Google Scholar] [CrossRef] [Green Version]
  29. Matrone, F.; Colucci, E.; De Ruvo, V.; Lingua, A.; Spanò, A. HBIM in a semantic 3D GIS database. ISPRS- Ann. Photogramm. Remote Sens. Spat. Inf. Sci. 2019, 42, 857–865. [Google Scholar] [CrossRef] [Green Version]
  30. Awange, J.L.; Kyalo Kiema, J.B. Environmental Geoinformatics; Springer: Berlin, Germany, 2013; ISBN 978-3-642-34084-0. [Google Scholar]
  31. Mościcka, A. The concept of movable heritage cartographic presentation on the interactive map. Geod. Cartogr. 2013, 61, 91–104. [Google Scholar] [CrossRef] [Green Version]
  32. Latoś, S. Szczegółowe poziome osnowy geodezyjne—Przeszłość, stan aktualny i przyszłość w zakresie ich zakładania i funkcjonowania. Geod. Wydaw. AGH 2003, Tom 9 Zeszyt 2/3, 775–809. [Google Scholar]
  33. Markiewicz, J.; Pilarska, M.; Łapiński, S.; Kaliszewska, A.; Bieńkowski, R.; Cena, A. Quality assessment of the use of a medium format camera in the investigation of wall paintings: An image-based approach. Meas. J. Int. Meas. Confed. 2019, 132, 224–237. [Google Scholar] [CrossRef]
  34. Kuczyńska, G.; Stawska, M.; Walicka, A. Modern geodetic techniques in the monitoring of historic buildings. E3S Web Conf. 2019, 97, 04043. [Google Scholar]
  35. Erro, S.; Erol, B.; Ayan, T. A General Review of the Deformation Monitoring Techniques and a Case Study: Analysing Deformations Using GPS/Levelling. Int. Arch. Photogramm. Remote Sens. Spat. Inf. Sci. 2004, XXXV Part B7, 622–627. [Google Scholar]
  36. Malarski, R.; Nagórski, K.; Woźniak, M. Application of Inclinometer Measurements for Relative Horizontal Displacement Investigations on Landslide Grounds. Rep. Geod. Goeinf. 2013, 94, 6–13. [Google Scholar] [CrossRef] [Green Version]
  37. Xiong, H.B.; Cao, J.X.; Zhang, F.L. Inclinometer-based method to monitor displacement of high-rise buildings. Struct. Monit. Maint. 2018, 5, 111–127. [Google Scholar]
  38. Zawieska, D.; Markiewicz, J. Podwyższyć umiejętności i kompetencje–“Akademia Geomatyki Praktycznej” a dziedzictwo kulturowe. In Cyfryzacja w Naukach o Przeszłości i Ochronie Zabytków–Digitalizacja i Nieinwazyjne Badanie Dziedzictwa Kulturowego In Situ; Wydawnictwo Naukowe Uniwersytetu KArddynała Stefana Wyszyńskiego: Warsaw, Poland, 2015; pp. 109–128. ISBN 9788380900493. [Google Scholar]
  39. Bastonero, P.; Donadio, E.; Chiabrando, F.; Spanò, A. Fusion of 3D models derived from TLS and image-based techniques for CH enhanced documentation. In Proceedings of the ISPRS Annals of the Photogrammetry, Remote Sensing and Spatial Information Sciences, Riva del Garda, Italy, 23–25 June 2014; Volume 2, pp. 73–80. [Google Scholar]
  40. Buckley, S.J.; Kurz, T.H.; Schneider, D. The benefits of terrestrial laser scanning and hyperspectral data fusion products. ISPRS-Int. Arch. Photogramm. Remote Sens. Spat. Inf. Sci. 2012, XXXIX-B7, 541–546. [Google Scholar] [CrossRef] [Green Version]
  41. Grussenmeyer, P.; Alby, E.; Landes, T.; Koehl, M.; Guillemin, S.; Hullo, J.F.; Assali, P.; Smigiel, E. Recording Approach of Heritage Sites Based on Merging Point Clouds from High Resolution Photogrammetry and Terrestrial Laser Scanning. ISPRS-Int. Arch. Photogramm. Remote Sens. Spat. Inf. Sci. 2012, XXXIX-B5, 553–558. [Google Scholar] [CrossRef] [Green Version]
  42. Lichti, D.; Gordon, S.J.; Stewart, M.P.; Franke, J.; Tsakiri, M. Comparison of digital photogrammetry and laser scanning. Available online: https://www.researchgate.net/publication/245716767_Comparison_of_Digital_Photogrammetry_and_Laser_Scanning (accessed on 6 December 2019).
  43. Lichti, D.; Stewart, M.; Tsakiri, M.; Snow, A.J. Benchmark Tests on a Three-Dimensional Laser Scanning System. Geomat. Res. Australas. 2000, 72, 1–24. [Google Scholar]
  44. Balzani, M.; Pellegrinelli, A.; Perfetti, N.; Uccelli, F.; Uccelli, F.A.; Perfetti, N.; Uccelli, F. A terrestrial 3D laser scanner: Accuracy tests. In Surveying and Documentation of Historic Buildings, Monuments, Sites—Traditional and Modern Methods, Proceedings of the 18th International Symposium CIPA 2001, Postdam, Germany, 18–21 September 2001; CIPA 2001 Organising Committee: Berlin, Germany, 2001. [Google Scholar]
  45. Kern, F. Automatisierte Modellierung von Bauwerksgeometrien aus 3D-Laserscanner-Daten. PhD Thesis, Technischen Universität, Braunschweig, Germany, 2002. [Google Scholar]
  46. Boehler, W.; Marbs, A. Investigating Laser Scanner Accuracy. Int. Arch. Photogramm. Remote Sens. Spat. Inf. Sci. 2003, 34, 696–701. [Google Scholar]
  47. Johansson, M. Explorations into the behavior of three different high-resolution ground-based laser scanners in the built environment. In Proceedings of the CIPA WG6 International Workshop on Scanning for Cultural Heritage Recording, Corfu, Greece, 1–2 September 2002. [Google Scholar]
  48. Staiger, R. The Geometrical Quality of Terrestrial Laser Scanner (TLS). In Proceedings of the FIG Working Week 2005 GSDI-8, Cairo, Egypt, 16–21 April 2005; pp. 1–11. [Google Scholar]
  49. Alkan, R.M.; Karsidag, G. Analysis of The Accuracy of Terrestrial Laser Scanning Measurements. In Proceedings of the FIG Working Week 2012-Knowing to Manage the Territory, Protect the Environment, Evaluate the Cultural Heritage, Rome, Italy, 6–10 May 2012; p. 16. [Google Scholar]
  50. Lichti, D.; Gordon, S.J. Error propagation in directly georeferenced terrestrial laser scanner point clouds for cultural heritage recording. In Proceedings of the FIG Working Week, Athens, Greece, 22–27 May 2004; pp. 1–16. [Google Scholar]
  51. Lichti, D.D. Error modelling, calibration and analysis of an AM-CW terrestrial laser scanner system. ISPRS J. Photogramm. Remote Sens. 2007, 61, 307–324. [Google Scholar] [CrossRef]
  52. Smith, M.W. Direct acquisition of elevation data: Terrestrial Laser Scanning Geomorphological of TLS applications. Geomorphol. Tech. 2015, 1, 1–14. [Google Scholar]
  53. Baltsavias, E.P. A comparison between photogrammetry and laser scanning. ISPRS J. Photogramm. Remote Sens. 1999, 54, 83–94. [Google Scholar] [CrossRef]
  54. Weichel, H. Laser Beam Propagation in the Atmosphere; SPIE Optical Engineering Press: Bellingham, DC, USA, 1990. [Google Scholar]
  55. Hughes, A. Laser Beam Scanning: Opto-Mechanical Devices, Systems, and Data Storage Optics. J. Mod. Opt. 1986, 33, 950–951. [Google Scholar] [CrossRef]
  56. Zeibak, R.; Filin, S. Managing Uncertainty in the Detection of Changes from Terrestrial Laser Scanners Data. In Proceedings of the International Archives of the Photogrammetry, Remote Sensing and Spatial Information Sciences Vol. XXXVII. Part B5, Beijing, China, 3–11 July 2008. [Google Scholar]
  57. Rietdorf, A. Automatisierte Auswertung und Kalibrierung von Scannenden Messsystemen mit Tachymetrischem Messprinzip. Ph.D. Thesis, Technische Universität Berlin, Berlin, Germany, 2004; p. 107. [Google Scholar]
  58. Schulz, T.; Ingensand, H. Influencing Variables, Precision and Accuracy of Terrestrial. In Proceedings of the INGEO 2004 and FIG Regional Central and Eastern European Conference on Engineering Surveying, Bratislava, Slovakia, 11–13 November 2004; pp. 1–8. [Google Scholar]
  59. Forssén, P.E. Maximally stable colour regions for recognition and matching. In Proceedings of the 2007 IEEE Conference on Computer Vision and Pattern Recognition, Minneapolis, MN, USA, 17–22 June 2007. [Google Scholar]
  60. Abmayr, T.; Härtl, F.; Hirzinger, G.; Burschka, D.; Fröhlich, C. Automatic Registration of Panoramic 2.5D Scans and Color Images. In Proceedings of the International Calibration and Orientation Workshop EuroCOW, Number 54, Castelldefels, Spain, 30 January–1 February 2008. [Google Scholar]
  61. Sawicki, J.; Kowalczyk, M. Research into the Collimation and Horizontal Axis Errors Influence on the Z+F Laser Scanner Accuracy of Verticality Measurement. ISPRS Ann. Photogramm. Remote Sens. Spat. Inf. Sci. 2016, III-6, 63–67. [Google Scholar] [CrossRef]
  62. Markiewicz, J.; Zawieska, D. Quality assessment of the TLS data in conservation of monuments. In Optics for Arts, Architecture, and Archaeology V.; SPIE: Bellingham, DC, USA, 2015; Volume 9527, p. 95270V. [Google Scholar]
  63. Markiewicz, J.S.; Zawieska, D. Generating orthoimages of monumental objects basing on integration of TLS data and digital images–related issues and sources of errors. In Proceedings of the International Multidisciplinary Scientific GeoConference Surveying Geology and Mining Ecology Management, SGEM, Albena, Bulgaria, 18–24 June 2015; Volume 1. [Google Scholar]
  64. Moussa, W. Integration of Digital Photogrammetry and Terrestrial Laser Scanning for Cultural Heritage Data Recording. Ph.D. Thesis, University of Stuttgart, Stuttgart, Germany, 2014. [Google Scholar]
  65. Bianco, S.; Ciocca, G.; Marelli, D. Evaluating the Performance of Structure from Motion Pipelines. J. Imaging 2018, 4, 98. [Google Scholar] [CrossRef] [Green Version]
  66. Chiabrando, F.; Donadio, E.; Rinaudo, F. SfM for orthophoto generation: Awinning approach for cultural heritage knowledge. Int. Arch. Photogramm. Remote Sens. Spat. Inf. Sci. 2015, 40, 91–98. [Google Scholar] [CrossRef] [Green Version]
  67. Luhmann, T.; Robson, S.; Kyle, S.; Boehm, J. Close-Range Photogrammetry and 3D Imaging; Walter De Gruyter: Boston, MA, USA, 2013; Volume 81, ISBN 9783110302691. [Google Scholar]
  68. Vergauwen, M.; Van Gool, L. Web-based 3D reconstruction service. Mach. Vis. Appl. 2006, 17, 411–426. [Google Scholar] [CrossRef]
  69. Farenzena, M.; Fusiello, A.; Gherardi, R. Structure-and-motion pipeline on a hierarchical cluster tree. In Proceedings of the 2009 IEEE 12th International Conference on Computer Vision Workshops, ICCV Workshops, Kyoto, Japan, 27 September–4 October 2009; pp. 1489–1496. [Google Scholar]
  70. Bay, H.; Tuytelaars, T.; Van Gool, L. SURF: Speeded up robust features. In European Conference on Computer Vision; Springer: Berlin/Heidelberg, Germany, 2006; Volume 3951 LNCS, pp. 404–417. [Google Scholar]
  71. Lowe, D.G. Distinctive image features from scale-invariant keypoints. Int. J. Comput. Vis. 2004, 60, 91–110. [Google Scholar] [CrossRef]
  72. Nocerino, E.; Poiesi, F.; Locher, A.; Tefera, Y.T.; Remondino, F.; Chippendale, P.; Van Gool, L. 3D Reconstruction with a Collaborative Approach Based on Smartphones and a Cloud-Based Server. ISPRS-Int. Arch. Photogramm. Remote Sens. Spat. Inf. Sci. 2017, XLII-2/W8, 187–194. [Google Scholar] [CrossRef] [Green Version]
  73. Remondino, F.; Menna, F. Image-based surface measurement for close-range heritage documentation. Int. Arch. Photogramm. Remote Sens. Spat. Inf. Sci. 2008, 37, 199–206. [Google Scholar]
  74. Alsadik, B.; Gerke, M.; Vosselman, G. Automated camera network design for 3D modeling of cultural heritage objects. J. Cult. Herit. 2013, 14, 515–526. [Google Scholar] [CrossRef]
  75. Sauerbier, M.; Eisenbeiss, H. Uavs for the Documentation of Archaeological Excavations. In Proceedings of the ISPRS Commission V Mid-Term Symposium ‘Close Range Image Measurement Techniques’, Newcastle upon Tyne, UK, 21–24 June 2010; Volume 38, pp. 526–531. [Google Scholar]
  76. Giuliano, M.G. Cultural heritage: An example of graphical documentation with automated photogrammetric systems. Int. Arch. Photogramm. Remote Sens. Spat. Inf. Sci. 2014, 40, 251–255. [Google Scholar] [CrossRef] [Green Version]
  77. Fraser, C.S. Network Design. In Photogrammetry and Machine Vision; Whittles Publishing: Scotland, UK, 1996. [Google Scholar]
  78. Clarke, T.A.; Wang, X.; Fryer, J.G. The Principal Point and CCD Cameras. Photogramm. Rec. 1998, 16, 293–312. [Google Scholar] [CrossRef]
  79. El-Hakim, S.; Beraldin, J.-A.; Blais, F. Critical Factors and Configurations for Practical 3D Image-Based Modeling. In Proceedings of the 6th Conference on 3D Measurement Techniques, Zurich, Switzerland, 22–25 September 2003; Volume 2, pp. 159–167. [Google Scholar]
  80. Altuntas, C. Integration of point clouds originated from laser scanner and photogrammetric images for visualization of complex details of historical buildings. Int. Arch. Photogramm. Remote Sens. Spat. Inf. Sci. 2015, 40, 431–436. [Google Scholar] [CrossRef] [Green Version]
  81. Salach, A.; Markiewicz, J.S.; Zawieska, D. Integration of point clouds from terrestrial laser scanning and image-based matching for generating high-resolution orthoimages. In Proceedings of the International Archives of the Photogrammetry, Remote Sensing and Spatial Information Sciences, Prague, Czech Republic, 12–19 July 2016; Volume 41. [Google Scholar]
  82. Dupuis, G.; Elias, M.; Simonot, L. Pigment identification by fiber-optics diffuse reflectance spectroscopy. Appl. Spectrosc. 2002, 56, 1329–1336. [Google Scholar] [CrossRef]
  83. Liang, H.; Lucian, A.; Lange, R.; Cheung, C.; Su, B. Remote spectral imaging with simultaneous extraction of 3D topography for historical wall paintings. ISPRS J. Photogramm. Remote Sens. 2014, 95, 13–22. [Google Scholar] [CrossRef] [Green Version]
  84. Oriola, M.; Možir, A.; Garside, P.; Campo, G.; Nualart-Torroja, A.; Civil, I.; Odlyha, M.; Cassar, M.; Strlič, M. Looking beneath Dalí’s paint: Non-destructive canvas analysis. Anal. Methods 2014, 6, 86–96. [Google Scholar] [CrossRef] [Green Version]
  85. Yivlialin, R.; Galli, A.; Raimondo, L.; Martini, M.; Sassella, A. Detecting the NIR Fingerprint of Colors: The Characteristic Response of Modern Blue Pigments. Heritage 2019, 2, 2255–2261. [Google Scholar] [CrossRef] [Green Version]
  86. Giuliano, M.; Manzo, C. Spectral Response of Architectural Surface as Support to Analyses of Materials and Degradation. Preserv. Conserv. Cult. Herit. 2014, 579–590. [Google Scholar]
  87. Delaney, J.K.; Zeibel, J.G.; Thoury, M.; Littleton, R.; Palmer, M.; Morales, K.M.; De La Rie, E.R.; Hoenigswald, A. Visible and infrared imaging spectroscopy of picasso’s harlequin musician: Mapping and identification of artist materials in situ. Appl. Spectrosc. 2010, 64, 584–594. [Google Scholar] [CrossRef]
  88. Bacci, M.; Casini, A.; Picollo, M.; Radicati, B.; Stefani, L. Integrated non-invasive technologies for the diagnosis and conservation of the cultural heritage. J. Neutron Res. 2006, 14, 11–16. [Google Scholar] [CrossRef]
  89. Cosentino, A. FORS-Spectra-Pigments. Available online: http://www.e-conservation.org/issue-2/36-FORS-spectral-database (accessed on 9 September 2019).
  90. Aceto, M.; Agostino, A.; Fenoglio, G.; Baraldi, P.; Zannini, P.; Hofmann, C.; Gamillscheg, E. First analytical evidences of precious colourants on Mediterranean illuminated manuscripts. Spectrochim. Acta Part A Mol. Biomol. Spectrosc. 2012, 95, 235–245. [Google Scholar] [CrossRef] [PubMed]
  91. Mounier, A.; Le Bourdon, G.; Aupetit, C.; Belin, C.; Servant, L.; Lazare, S.; Lefrais, Y.; Daniel, F. Hyperspectral imaging, spectrofluorimetry, FORS and XRF for the non-invasive study of medieval miniatures materials. Herit. Sci. 2014, 2, 24. [Google Scholar] [CrossRef] [Green Version]
  92. Stout, S.; Cosentino, A.; Scandurra, C. Non-invasive materials analysis using portable X-ray Fluorescence (XRF) in the examination of two mural paintings in the catacombs of San Giovanni, Syracuse. Lect. Notes Comput. Sci. 2014, 8740, 697–705. [Google Scholar]
  93. Schreiner, M.; Fruhmann, B.; Jembrih-Simburger, D.; Linke, R. X-Rays in Art and Archaeology–An Overview. Powder Diffr. 2004, 19, 3–11. [Google Scholar] [CrossRef] [Green Version]
  94. de Viguerie, L.; Rochut, S.; Alfeld, M.; Walter, P.; Astier, S.; Gontero, V.; Boulc’h, F. XRF and reflectance hyperspectral imaging on a 15th century illuminated manuscript: Combining imaging and quantitative analysis to understand the artist’s technique. Herit. Sci. 2018, 6, 1–13. [Google Scholar] [CrossRef]
  95. Hain, M.; Bartl, J.; Jacko, V. Multispectral analysis of cultural heritage artefacts. Meas. Sci. Rev. 2003, 3, 9–12. [Google Scholar]
  96. Peccenini, E.; Albertin, F.; Bettuzzi, M.; Brancaccio, R.; Casali, F.; Morigi, M.P.; Petrucci, F. Advanced imaging systems for diagnostic investigations applied to Cultural Heritage. J. Phys. Conf. Ser. 2014, 566, 012022. [Google Scholar] [CrossRef]
  97. Claro, A.; Melo, M.J.; Schäfer, S.; de Melo, J.S.S.; Pina, F.; van den Berg, K.J.; Burnstock, A. The use of microspectrofluorimetry for the characterization of lake pigments. Talanta 2008, 74, 922–929. [Google Scholar] [CrossRef] [Green Version]
  98. Ghervase, L.; Cortea, I.M.; Rădvan, R.; Ratoiu, L.; Chelmuș, A. Complementary investigations of two Lipovan-style icons. Microchem. J. 2018, 138, 509–518. [Google Scholar] [CrossRef]
  99. Daffara, C.; Fontana, R. Multispectral infrared reflectography to differentiate features in paintings. Microsc. Microanal. 2011, 17, 691–695. [Google Scholar] [CrossRef] [PubMed]
  100. Delaney, J.K.; Trumpy, G.; Didier, M.; Ricciardi, P.; Dooley, K.A. A high sensitivity, low noise and high spatial resolution multi-band infrared reflectography camera for the study of paintings and works on paper. Herit. Sci. 2017, 5, 1–14. [Google Scholar] [CrossRef] [Green Version]
  101. Legrand, S.; Vanmeert, F.; Van der Snickt, G.; Alfeld, M.; De Nolf, W.; Dik, J.; Janssens, K. Examination of historical paintings by state-of-the-art hyperspectral imaging methods: From scanning infra-red spectroscopy to computed X-ray laminography. Herit. Sci. 2014, 2, 1–11. [Google Scholar] [CrossRef] [Green Version]
  102. Falcone, L.; Bloisi, F.; Califano, V.; Pagano, M.; Vicari, L. An old notice board at ancient Herculaneum studied using Near Infrared Reflectography. J. Archaeol. Sci. 2008, 35, 1708–1716. [Google Scholar] [CrossRef]
  103. Di Tuccio, M.C.; Ludwig, N.; Gargano, M.; Bernardi, A. Thermographic inspection of cracks in the mixed materials statue: Ratto delle Sabine. Herit. Sci. 2015, 3, 10. [Google Scholar] [CrossRef] [Green Version]
  104. Mercuri, F.; Orazi, N.; Zammit, U.; Paoloni, S.; Marinelli, M.; Valentini, P.P.; Badea, E. Thermographic Analysis of Cultural Heritage: Recent Applications and Perspectives. e-Preserv. Sci. 2012, 9, 84–89. [Google Scholar]
  105. Candoré, J.C.; Bodnar, J.L.; Detalle, V.; Grossel, P. Characterization of defects situated in a fresco by stimulated infrared thermography. EPJ Appl. Phys. 2012, 57, 11002. [Google Scholar] [CrossRef] [Green Version]
  106. Grinzato, E.; Bressan, C.; Marinetti, S.; Bison, P.G.; Bonacina, C. Monitoring of the Scrovegni Chapel by IR thermography: Giotto at infrared. Infrared Phys. Technol. 2002, 43, 165–169. [Google Scholar] [CrossRef]
  107. Cosentino, A. Effects of different binders on technical photography and infrared reflectography of 54 historical pigments. Int. J. Conserv. Sci. 2015, 6, 287–298. [Google Scholar]
  108. Cosentino, A.; Stout, S.; Scandurra, C. Innovative imaging techniques for examination and documentation of mural paintings and historical graffiti in the catacombs of San Giovanni, Syracuse. Int. J. Conserv. Sci. 2015, 6, 23–34. [Google Scholar]
  109. Manfredi, M.; Bearman, G.; Williamson, G.; Kronkright, D.; Doehne, E.; Jacobs, M.; Marengo, E. A new quantitative method for the non-invasive documentation of morphological damage in paintings using RTI surface normals. Sensors 2014, 14, 12271–12284. [Google Scholar] [CrossRef] [PubMed] [Green Version]
  110. Ciivici, N.; Demko, O.; Clark, R.J.H. Identification of pigments used on late 17th century Albanian iconsby total reflection X-ray fluorescence and Raman microscopy. J. Cult. Herit. 2005, 6, 157–164. [Google Scholar] [CrossRef]
  111. Burgio, L.; Clark, R.J.H.; Hark, R.R. Raman microscopy and x-ray fluorescence analysis of pigments on medieval and Renaissance Italian manuscript cuttings. Proc. Natl. Acad. Sci. USA 2010, 107, 5726–5731. [Google Scholar] [CrossRef] [PubMed] [Green Version]
  112. Edwards, H.G.M. Raman spectroscopic analysis of art and archaeological artefacts of relevance to the preservation of cultural heritage: The illumination of ancient mysteries. Conserv. News 2009, 26, 55–64. [Google Scholar]
  113. Giustetto, R.; Gonella, D.; Diana, E. Decay of red pigments on a wall painting adorning the church of ‘San Francesco Dei Capuccini’ in Racconigi (Italy): Archaeometric survey and restoration intervention. Mediterr. Archaeol. Archaeom. 2018, 18, 65–80. [Google Scholar]
  114. Liang, H. Advances in multispectral and hyperspectral imaging for archaeology and art conservation. Appl. Phys. A Mater. Sci. Process. 2012, 106, 309–323. [Google Scholar] [CrossRef] [Green Version]
  115. Deborah, H. Pigment Mapping of Cultural Heritage Paintings Based on Hyperspectral Imaging Master Erasmus Mundus in Color in Informatics and Media Technology (CIMET). Master’s Thesis, Gjøvik University College, Gjøvik, Norway, 2013. [Google Scholar]
  116. Govender, M.; Chetty, K.; Bulcock, H. A review of hyperspectral remote sensing and its application in vegetation and water resource studies. Water SA 2007, 33, 145–151. [Google Scholar] [CrossRef] [Green Version]
  117. MacDonald, L.W.; Vitorino, T.; Picollo, M.; Pillay, R.; Obarzanowski, M.; Sobczyk, J.; Nascimento, S.; Linhares, J. Assessment of multispectral and hyperspectral imaging systems for digitisation of a Russian icon. Herit. Sci. 2017, 5, 1–16. [Google Scholar] [CrossRef] [Green Version]
  118. Kamruzzaman, M.; Sun, D.W. Introduction to Hyperspectral Imaging Technology. Comput. Vis. Technol. Food Qual. Eval. Second Ed. 2016, 111–139. [Google Scholar]
  119. Qin, J.; Chao, K.; Kim, M.S.; Lu, R.; Burks, T.F. Hyperspectral and multispectral imaging for evaluating food safety and quality. J. Food Eng. 2013, 118, 157–171. [Google Scholar] [CrossRef]
  120. Cosentino, A. Panoramic, Macro and Micro Multispectral Imaging: An Affordable System for Mapping Pigments on Artworks. J. Conserv. Mus. Stud. 2015, 13. [Google Scholar] [CrossRef] [Green Version]
  121. Pillay, R.; Hardeberg, J.Y.; George, S. Hyperspectral imaging of art: Acquisition and calibration workflows. J. Am. Inst. Conserv. 2019, 58, 3–15. [Google Scholar] [CrossRef] [Green Version]
  122. Del Pozo, S.; Herrero-Pascual, J.; Felipe-García, B.; Hernández-López, D.; Rodríguez-Gonzálvez, P.; González-Aguilera, D. Multispectral radiometric analysis of façades to detect pathologies from active and passive remote sensing. Remote Sens. 2016, 8, 80. [Google Scholar] [CrossRef] [Green Version]
  123. Del Pozo, S.; Rodríguez-Gonzálvez, P.; Sánchez-Aparicio, L.J.; Muñoz-Nieto, A.; Hernández-López, D.; Felipe-García, B.; González-Aguilera, D. Multispectral imaging in cultural heritage conservation. Int. Arch. Photogramm. Remote Sens. Spat. Inf. Sci. 2017, 42, 155–162. [Google Scholar] [CrossRef] [Green Version]
  124. Casini, A.; Cucci, C.; Picollo, M.; Stefani, L.; Vitorino, T. Creation of a Hyper-Spectral Imaging Reference Database. COSCH E-Bull. 2015, 2, 1–6. [Google Scholar]
  125. Polak, A.; Kelman, T.; Murray, P.; Marshall, S.; Stothard, D.J.M.; Eastaugh, N.; Eastaugh, F. Hyperspectral imaging combined with data classification techniques as an aid for artwork authentication. J. Cult. Herit. 2017, 26, 1–11. [Google Scholar] [CrossRef]
  126. Balas, C.; Epitropou, G.; Tsapras, A.; Hadjinicolaou, N. Hyperspectral imaging and spectral classification for pigment identification and mapping in paintings by El Greco and his workshop. Multimed. Tools Appl. 2018, 77, 9737–9751. [Google Scholar] [CrossRef]
  127. Macdonald, L.; Giacometti, A.; Campagnolo, A.; Robson, S.; Weyrich, T.; Terras, M.; Gibson, A. Multispectral Imaging of Degraded Parchment. Lect. Notes Comput. Sci. 2013, 7786, 143–157. [Google Scholar]
  128. Salerno, E.; Tonazzini, A.; Grifoni, E.; Lorenzetti, G.; Legnaioli, S.; Lezzerini, M.; Marra, L.; Pagnotta, S.; Palleschi, V. Analysis of Multispectral Images in Cultural Heritage and Archaeology. J. Appl. Laser Spectrosc. 2014, 1, 22–27. [Google Scholar]
  129. Hayem-Ghez, A.; Ravaud, E.; Boust, C.; Bastian, G.; Menu, M.; Brodie-Linder, N. Characterizing pigments with hyperspectral imaging variable false-color composites. Appl. Phys. A Mater. Sci. Process. 2015, 121, 939–947. [Google Scholar] [CrossRef]
  130. Alexopoulou, A.; Athens, A.K. The Evolution of Imaging Techniques in the Study of Manuscripts. In Proceedings of the ’Conference on Natural Sciences and Technology in Manuscript Analysis’ at the University of Hamburg, SFB 950 ’Manuskriptkulturen in Asien, Afrika und Europa’—Centre for the Study of Manuscript Cultures, Kempten, Germany, 4–6 December 2013; AZ Druck und Datentechnik GmbH. pp. 58–68. [Google Scholar]
  131. Cavaleri, T.; Giovagnoli, A.; Nervo, M. Pigments and Mixtures Identification by Visible Reflectance Spectroscopy. Procedia Chem. 2013, 8, 45–54. [Google Scholar] [CrossRef] [Green Version]
  132. Pamart, A.; Guillon, O.; Faraci, S.; Gattet, E.; Genevois, M.; Vallet, J.M.; De Luca, L. Multispectral photogrammetric data acquisition and processing for wall paintings studies. Int. Arch. Photogramm. Remote Sens. Spat. Inf. Sci. 2017, 42, 559–566. [Google Scholar] [CrossRef] [Green Version]
  133. Herrero-Cortell, M.A.; Creus, M.R.; Artoni, P.; Puig, I. Multi-band technical imaging in the research of the execution of paintings. The case study of the portrait of Carlos IV, by Francisco de Goya. Ge-Conservacion 2018, 1, 5–15. [Google Scholar]
  134. Cosentino, A. Infrared Technical Photography for art examination. e-Preserv. Sci. 2016, 13, 1–6. [Google Scholar]
  135. Grabowski, B.; Masarczyk, W.; Głomb, P.; Mendys, A. Automatic pigment identification from hyperspectral data. J. Cult. Herit. 2018, 31, 1–12. [Google Scholar] [CrossRef]
  136. Plaza, A.; Plaza, J.; Martín, G. Hyperspectral Data Processing Algorithms. In Hyperspectral Remote Sensing of Vegetation; CRC Press: Boca Raton, FL, USA, 2011; pp. 121–138. [Google Scholar]
  137. Plaza, J.; Hendrix, E.M.T.; García, I.; Martín, G.; Plaza, A. On endmember identification in hyperspectral images without pure pixels: A comparison of algorithms. J. Math. Imaging Vis. 2012, 42, 163–175. [Google Scholar] [CrossRef]
  138. Chane, C.S.; Mansouri, A.; Marzani, F.S.; Boochs, F. Integration of 3D and multispectral data for cultural heritage applications: Survey and perspectives. Image Vis. Comput. 2013, 31, 91–102. [Google Scholar] [CrossRef] [Green Version]
  139. Hedeaard, S.B.; Brøns, C.; Drug, I.; Saulins, P.; Bercu, C.; Jakovlev, A.; Kjær, L. Multispectral photogrammetry: 3D models highlighting traces of paint on ancient sculptures. CEUR Workshop Proc. 2019, 2364, 181–189. [Google Scholar]
  140. Catelli, E.; Randeberg, L.; Strandberg, H.; Alsberg, B.; Maris, A.; Vikki, L. Can hyperspectral imaging be used to map corrosion products on outdoor bronze sculptures? J. Spectr. Imaging 2018, 1, 1–9. [Google Scholar] [CrossRef]
  141. Brusco, N.; Capeleto, S.; Fedel, M.; Paviotti, A.; Poletto, L.; Cortelazzo, G.M.; Tondello, G. A system for 3D modeling frescoed historical buildings with multispectral texture information. Mach. Vis. Appl. 2006, 17, 373–393. [Google Scholar] [CrossRef]
  142. Mathys, A.; Jadinon, R.; Hallot, P. Exploiting 3D multispectral texture for a better feature identification for cultural heritage. ISPRS Ann. Photogramm. Remote Sens. Spat. Inf. Sci. 2019, 4, 91–97. [Google Scholar] [CrossRef] [Green Version]
  143. Bonifazi, G.; Capobianco, G.; Pelosi, C.; Serranti, S. Hyperspectral imaging as powerful technique for investigating the stability of painting samples. J. Imaging 2019, 5, 8. [Google Scholar] [CrossRef] [Green Version]
  144. Giacometti, A.; Campagnolo, A.; MacDonald, L.; Mahony, S.; Robson, S.; Weyrich, T.; Terras, M.; Gibson, A. The value of critical destruction: Evaluating multispectral image processing methods for the analysis of primary historical texts. Digit. Scholarsh. Humanit. 2015, 32, 101–122. [Google Scholar] [CrossRef] [Green Version]
  145. Marengo, E.; Manfredi, M.; Zerbinati, O.; Robotti, E.; Mazzucco, E.; Gosetti, F.; Bearman, G.; France, F.; Shor, P. Development of a technique based on multi-spectral imaging for monitoring the conservation of cultural heritage objects. Anal. Chim. Acta 2011, 706, 229–237. [Google Scholar] [CrossRef] [PubMed]
  146. Toque, J.A.; Zhang, P.; Wang, P.; Ide-Ektessabi, A. High-Resolution Multispectral Scanning for Mesoscopic Investigation of Discoloration of Traditional Japanese Pigments. Lect. Notes Comput. Sci. 2015, 9016, 195–207. [Google Scholar]
  147. Cosentino, A.; Heritage, C.; Open, S.; Antonio, A.S. Multispectral imaging and the art expert. Spectrosc. Eur. 2015, 27, 6–9. [Google Scholar]
  148. Bai, D.; Messinger, D.W.; Howell, D. Hyperspectral analysis of cultural heritage artifacts: Pigment material diversity in the Gough Map of Britain. Opt. Eng. 2017, 56, 081805. [Google Scholar] [CrossRef]
  149. Rosi, F.; Miliani, C.; Braun, R.; Harig, R.; Sali, D.; Brunetti, B.G.; Sgamellotti, A. Noninvasive analysis of paintings by mid-infrared hyperspectral imaging. Angew. Chem. Int. Ed. 2013, 52, 5258–5261. [Google Scholar] [CrossRef]
  150. Smith, G.D.; Hamm, J.F.; Kushel, D.A.; Rogge, C.E. What’s wrong with this picture? The technical analysis of a known forgery. ACS Symp. Ser. 2012, 1103, 1–21. [Google Scholar]
  151. Tonazzini, A.; Salerno, E.; Abdel-Salam, Z.A.; Harith, M.A.; Marras, L.; Botto, A.; Campanella, B.; Legnaioli, S.; Pagnotta, S.; Poggialini, F.; et al. Analytical and mathematical methods for revealing hidden details in ancient manuscripts and paintings: A review. J. Adv. Res. 2019, 17, 31–42. [Google Scholar] [CrossRef]
  152. Guzowska, A.; Koryciarz-Kitamikado, J.; Flisowska, Z. Konserwacja Unikatowego Japońskiego Stołu Nanban. Available online: https://www.wilanow-palac.pl/konserwacja_unikatowego_japonskiego_stolu_nanban.html (accessed on 19 September 2019).
  153. Modzelewska, E. Prace Konserwatorskie i Restauratorskie Przy Obrazie Jana Reisnera “Kazanie św. Jana Chrzciciela”. Available online: https://www.wilanow-palac.pl/konserwacja_reisner.html (accessed on 9 October 2019).
  154. Pawlak, A. Obrazy ‘Apoteoza Senatora Weneckiego’ i ‘Scena Alegoryczna’. Available online: https://www.wilanow-palac.pl/obrazy_apoteoza_senatora_weneckiego_i_scena_alegoryczna.html (accessed on 9 October 2019).
  155. Jasiński, M.; Nowosielski, J. Technika i technologia obrazów caravaggionistów w oparciu o polskie zbiory muzealne. Badania dwóch obrazów Jana Lievensa: Młody mężczyzna zapalający żagiew, 1625. Młody mężczyzna z fajk ą dmuchający na żar. Available online: https://www.wilanow-palac.pl/badania_dwoch_obrazow_jana_lievens_a_z_kolekcji_wilanowskiej_cenne_obrazy_w_nowym_swietle.html (accessed on 6 December 2019).
  156. Longley, P.; Goodchild, M.F.; Maguire, D.J.; Rhind, D.W. Geographical Information Systems and Science, 2nd ed.; 2005; Volume 83, ISBN 0470870001. [Google Scholar]
  157. Chang, K.-T. Geographic Information System; Wiley Online Library: Hoboken, NJ, USA; New York, NY, USA, 2017. [Google Scholar]
  158. Ferreira-Lopes, P. Achieving the state of research pertaining to gis applications for cultural heritage by a systematic literature review. Int. Arch. Photogramm. Remote Sens. Spat. Inf. Sci. 2018, 42, 249–252. [Google Scholar] [CrossRef] [Green Version]
  159. Meaden, G.J.; Aguilar-Manjarrez, J. Advances in Geographic Information Systems and Remote Sensing for Fisheries and Aquaculture; FAO: Rome, Italy, 2013; ISBN 9789251075975. [Google Scholar]
  160. Saleh, B.; Sadoun, B. Design and implementation of a GIS system for planning. Int. J. Digit. Libr. 2006, 6, 210–218. [Google Scholar] [CrossRef]
  161. Milosavljević, A.; Stoimenov, L.; Djordjević-Kajan, S. An architecture for open and scalable WebGIS. In Proceedings of the 8th AGILE Conference on GIScience, Estoril, Portugal, 26–28 May 2005. [Google Scholar]
  162. Serlorenzi, M.; De Tommasi, A. SITAR–Sistema Informativo Territoriale Archeologico di Roma. A repository of archaeological data for conservation of cultural heritage and town planning. In Proceedings of the 15th International Conference on “Cultural Heritage and New Technologies”, Vienna, Austria, November 2010; pp. 272–282. [Google Scholar]
  163. Vacca, G.; Fiorino, D.R.; Pili, D. A spatial information system (SIS) for the architectural and cultural heritage of sardinia (Italy). ISPRS Int. J. Geo-Inf. 2018, 7, 49. [Google Scholar]
  164. Pascaul, M.; Alves, E.; De Almeida, T.; De França, G.S.; Roig, H.; Holanda, M. An Architecture for Geographic Information Systems on the Web-webGIS. In Proceedings of the GEOProcessing 2012 Fourth International Conference on Advanced Geographic Information Systems, Applications, and Services, Valencia, Spain, 30 January–4 February 2012; pp. 209–214. [Google Scholar]
  165. Rodríguez Luaces, M.Á. A Generic Architecture for Geographic Information System. Ph.D. Thesis, Universidad de La Coruña, A Coruña, Spain, 2004; pp. 1–234. [Google Scholar]
  166. Olive, J.; Arilla, E.; Afonso, D.; Garcia, O.; Hernandez, A.; Ruiz, J.; Romero, X.; Sandoval, A.; Serrano, J.A.; Sorribas, J. Geographic Information System Architecture Applied to Oceanographic Data Acquisition Systems. Instrum. Viewp. 2010, 8, 90–91. [Google Scholar]
  167. Zlatanova, S.; Stoter, J. The role of DBMS in the new generation GIS architecture. In Frontiers of Geographic Information Technology; Springer: Berlin/Heidelberg, Germany, 2006; pp. 155–180. [Google Scholar]
  168. OGC Standards. Available online: https://www.opengeospatial.org/docs/is (accessed on 9 September 2019).
  169. European Parliament and the Council. Directive 2007/2/EC of the European Parliament and of the council of 14 March 2007 establishing an Infrastructure for Spatial Information in the European Community (INSPIRE). Off. J. Eur. Union 2007, 50, 1–14. [Google Scholar]
  170. Fernández Freire, C.; Del Bosque González, I.; Vicent García, J.; Pérez Asensio, E.; Fraguas Bravo, A.; Uriarte González, A.; Fábrega-Álvarez, P.; Parcero-Oubiña, C. A Cultural Heritage Application Schema: Achieving Interoperability of Cultural Heritage Data in INSPIRE. Int. J. Spat. Data Infrastruct. Res. 2013, 8, 74–97. [Google Scholar]
  171. Conceptual Reference Model (CRM). Available online: http://www.cidoc-crm.org/ (accessed on 9 October 2019).
  172. Kvamme, K.L. Terrain form analysis of archaeological location through geographic information systems. In Computer Applications and Quantitative Methods in Archaeology 1991, BAR International Series; Lock, G., Moffett, J., Eds.; Tempus Reparatum: Oxford, UK, 1992; pp. 127–136. [Google Scholar]
  173. Kvamme, K. GIS in North American archaeology: A summary of activity for the CAERE project. Archeol. E Calc. 1998, 127–146. [Google Scholar]
  174. Bampton, M. Archeology ANO GIS: The view from outside. Archeol. E Calc. 1997, 8, 9–26. [Google Scholar]
  175. Llobera, M. Exploring the topography of mind: GIS, social space and archaeology. Antiquity 1996, 70, 612–622. [Google Scholar] [CrossRef]
  176. Maschner, H.D.G. Geographic information systems in archaeology. In New Methods, Old Problems: Geographic Information Systems in Modern Archaeological Research; Southern Illinois University: Carbondale, IL, USA, 1996; pp. 1–21. ISBN 0881040797. [Google Scholar]
  177. Lombardi, A.; Mohammed, J.; Abdulkareem, S. Applying Geographical Information Systems for Documenting and Managing Iraqi Archaeological Heritage: The Case Study of the Akre Castle in Kurdistan. In Heritage and Technology; La Scuola di Pitagora editrice: Naples, Italy, 2015; pp. 1748–1757. ISBN 9788865424162. [Google Scholar]
  178. D’Urso, M.G.; Corsi, E.; Nemeti, S.; Germani, M. From excavations to web: A GIS for archaeology. Int. Arch. Photogramm. Remote Sens. Spat. Inf. Sci. 2017, 42, 219–226. [Google Scholar]
  179. Zarley, A.; Shelley, W.; Burgess, G. Heritage At-Risk: Vulnerability of Cultural Resources along Florida’s Coast to Sea Level Rise. Available online: https://minds.wisconsin.edu/bitstream/handle/1793/74999/Zarley%20Witte%20Burgess.pdf?sequence=1&isAllowed=y&fbclid=IwAR0rPAwb_f7Rmeac-FHMIMuLzqS3naUjSxvCiO6LzSU87jUZuWHM0tkKLO (accessed on 6 December 2019).
  180. Nsanziyera, A.F.; Rhinane, H.; Oujaa, A.; Mubea, K. GIS and remote-sensing application in archaeological site mapping in the awsard area (Morocco). Geosci. 2018, 8, 207. [Google Scholar] [CrossRef] [Green Version]
  181. Scianna, A.; Villa, B. GIS applications in archaeology. Archeol. E Calc. 2011, 22, 337–363. [Google Scholar]
  182. Sarris, A.; Dederix, S. GIS for archaeology & cultural resources management in Greece. Quo Vadis. In 3rd Symposium Archaeological Research and New Technologies ARCH_RNT; University of Peloponnese: Tripoli, Greece, 2014; pp. 7–20. [Google Scholar]
  183. Gavryushkina, M. Layer by (3D) Layer, 3D GIS Stratigraphic Analysis of Chlorakas-Palloures, Cyprus. Master’s Thesis, University of Leiden, Leiden, The Netherlands, 2018. [Google Scholar]
  184. Landeschi, G.; Dell’Unto, N.; Lundqvist, K.; Ferdani, D.; Campanaro, D.M.; Leander Touati, A.M. 3D-GIS as a platform for visual analysis: Investigating a Pompeian house. J. Archaeol. Sci. 2016, 65, 103–113. [Google Scholar] [CrossRef]
  185. Richards-Rissetto, H. An iterative 3D GIS analysis of the role of visibility in ancient Maya landscapes: A case study from Copan, Honduras. Digit. Scholarsh. Humanit. 2017, 32, ii195–ii212. [Google Scholar] [CrossRef] [Green Version]
  186. von Schwerin, J.; Richards-Rissetto, H.; Remondino, F.; Agugiaro, G.; Girardi, G. The mayaarch3d project: A 3D webgis for analyzing ancient architecture and landscapes. Lit. Linguist. Comput. 2013, 28, 736–753. [Google Scholar] [CrossRef] [Green Version]
  187. Kovács, K.; Hanke, K.; Moser, M. Gis-Based Surface Analysis of Archaeological Finds. ISPRS-Int. Arch. Photogramm. Remote Sens. Spat. Inf. Sci. 2012, 35, 99–103. [Google Scholar]
  188. Landeschi, G. Rethinking GIS, three-dimensionality and space perception in archaeology. World Archaeol. 2018, 1–16. [Google Scholar] [CrossRef] [Green Version]
  189. Katsianis, M.; Tsipidis, S.; Kotsakis, K.; Kousoulakou, A. A 3D digital workflow for archaeological intra-site research using GIS. J. Archaeol. Sci. 2008, 35, 655–667. [Google Scholar] [CrossRef]
  190. Billen, N.; Loos, L.; Auer, M.; Zipf, A.; Schwerindainstde, J.V.S. Development of a 4D-webgis for archeological research. In Proceedings of the AGILE 2013-Workshop on integrating 4D, GIS, and Cultural Heritage, Leuven, Belgium, 14 May 2013; pp. 1–3. [Google Scholar]
  191. De Roo, B.; Bourgeois, J.; De Maeyer, P. On the way to a 4D archaeological GIS: State of the art, future directions and need for standardization. In Proceedings of the 2013 Digital Heritage International Congress, Marseille, France, 28 October–1 November 2013; Volume 2, pp. 617–620. [Google Scholar]
  192. Van Ruymbeke, M.; De Badts, E.; Garcia-Moreno, R.; Billen, R.; Tigny, V. Development and use of a 4D GIS to support the conservation of the Calakmul site (Mexico, World Heritage Programme). In VSMM 2008. Digital Heritage, Proceedings of the 14th International Conference on Virtual Systems and Multimedia, Limassol, Cyprus, 20–26 October 2008; Archaeolingua: Budapest, Hungary, 2008; Volume 20–25, pp. 117–121. [Google Scholar]
  193. Green, C.T. Winding Dali’s Clock the Construction of a Fuzzy Temporal-Gis for Archaeology. Ph.D. Thesis, University of Leicester, Leicester, UK, 2011; pp. 2–6. [Google Scholar]
  194. Leong, C.; Takada, J.I.; Yamaguchi, S. Analysis of the changing landscape of a world heritage site: Case of Luang Prabang, Lao PDR. Sustainability 2016, 8, 747. [Google Scholar] [CrossRef] [Green Version]
  195. He, J.; Liu, J.; Xu, S.; Wu, C.; Zhang, J. A GIS-based cultural heritage study framework on continuous scales: A case study on 19th century military industrial heritage. Int. Arch. Photogramm. Remote Sens. Spat. Inf. Sci. 2015, 40, 215–222. [Google Scholar] [CrossRef] [Green Version]
  196. Bushmakina, Y.V.; Balyberdina, P.A.; Dmitrieva, M.K.; Gogoleva, M.V. The use of GIS for studying cultural heritage and historical urban landscape: The case of Perm and Usolie (Russia). Ge-Conservacion 2017, 1, 264–271. [Google Scholar]
  197. Spiridon, P.; Ursu, A.; Sandu, I. Heritage Management Using GIS. In Proceedings of the 16th International Multidisciplinary Scientific GeoConference SGEM 2016, Albena, Bulgaria, 30 June–6 July 2016; pp. 263–270. [Google Scholar]
  198. Arca, D.; Seker, Z.D.; Alkan, M.; Karakis, S.; Bayk, C.; Acar, H. Development of Web-Based GIS for the Cultural Heritage of Safranbolu, Turkey. Int. J. Environ. Geoinf. 2018, 5, 368–377. [Google Scholar] [CrossRef]
  199. Husseini, B.; Bali, Z. Documentation, using GIS techniques in conservation of a World Heritage Site, a case study of ‘the Old City of Jerusalem’. Int. Arch. Photogramm. Remote Sens. Spat. Inf. Sci. 2015, 40, 229–234. [Google Scholar] [CrossRef] [Green Version]
  200. Pisu, C.; Casu, P. Cloud Gis and 3D Modelling to Enhance Sardinian Late Gothic Architectural Heritage. ISPRS-Int. Arch. Photogramm. Remote Sens. Spat. Inf. Sci. 2013, XL-5/W2, 489–494. [Google Scholar] [CrossRef] [Green Version]
  201. Lopez-Gonzalez, L.; Otero de Cosca, R.; Gomez-Heras, M.; Garcia-Morales, S. A 4D GIS methodology to study variations in evaporation points on a heritage building. Environ. Earth Sci. 2016, 75, 1–9. [Google Scholar] [CrossRef] [Green Version]
  202. Eastman, C.; Teicholz, P.; Sacks, R.; Liston, K. BIM Handbook, Aguide to Building Information Modeling for Owners, Managers, Designers, Engineers, and Contractors; Wiley: Hoboken, NJ, USA, 2008; ISBN 9780470185285. [Google Scholar]
  203. Saygi, G.; Remondino, F. Management of Architectural Heritage Information in BIM and GIS: State-of-the-Art and Future Perspectives. Int. J. Herit. Digit. Era 2013, 2, 695–713. [Google Scholar] [CrossRef] [Green Version]
  204. Murphy, M.; McGovern, E.; Pavia, S. Historic Building Information Modelling-Adding intelligence to laser and image based surveys of European classical architecture. ISPRS J. Photogramm. Remote Sens. 2013, 76, 89–102. [Google Scholar] [CrossRef]
  205. Dore, C.; Murphy, M.; McCarthy, S.; Brechin, F.; Casidy, C.; Dirix, E. Structural simulations and conservation analysis-historic building information model (HBIM). Int. Arch. Photogramm. Remote Sens. Spat. Inf. Sci. 2015, 40, 351–357. [Google Scholar] [CrossRef] [Green Version]
  206. Cheng, H.M.; Yang, W.B.; Yen, Y.N. BIM applied in historical building documentation and refurbishing. Int. Arch. Photogramm. Remote Sens. Spat. Inf. Sci. 2015, 40, 85–90. [Google Scholar] [CrossRef] [Green Version]
  207. Brumana, R.; Dellatorre, S.; Oreni, D.; Previtali, M.; Cantini, L.; Barazzetti, L.; Franchi, A.; Banfi, F. HBIM challenge among the paradigm of complexity, tools and preservation: The basilica Di collemaggio 8 years after the earthquake (L’aquila). Int. Arch. Photogramm. Remote Sens. Spat. Inf. Sci. 2017, 42, 97–104. [Google Scholar] [CrossRef] [Green Version]
  208. Oreni, D.; Brumana, R.; Georgopoulos, A.; Cuca, B. Hbim for conservation and management of built heritage: Towards a library of vaults and wooden bean floors. ISPRS Ann. Photogramm. Remote Sens. Spat. Inf. Sci. 2013, 2, 215–221. [Google Scholar] [CrossRef] [Green Version]
  209. Chiabrando, F.; Sammartano, G.; Spanò, A. Historical buildings models and their handling via 3d survey: From points clouds to user-oriented hbim. Int. Arch. Photogramm. Remote Sens. Spat. Inf. Sci. 2016, 41, 633–640. [Google Scholar] [CrossRef] [Green Version]
  210. Simeone, D.; Cursi, S.; Toldo, I.; Carrara, G. BIM and knowledge management for building heritage. In Proceedings of the ACADIA 2014: Design Agency-34th Annual Conference of the Association for Computer Aided Design in Architecture, Los Angeles, CA, USA, 23–25 October 2014; pp. 681–690. [Google Scholar]
  211. Brumana, R.; Georgopoulos, A.; Oreni, D.; Raimondi, A.; Bregianni, A. HBIM for Documentation, Dissemination and Management of Built Heritage. The Case Study of St. Maria in Scaria d’Intelvi. Int. J. Herit. Digit. Era 2013, 2, 433–451. [Google Scholar] [CrossRef] [Green Version]
  212. Beltramo, S.; Diara, F.; Rinaudo, F. Evaluation of an integrative approach between HBIM and architecture history. ISPRS Ann. Photogramm. Remote Sens. Spat. Inf. Sci. 2019, 42, 225–229. [Google Scholar] [CrossRef] [Green Version]
  213. Khalil, A.; Stravoravdis, S. H-BIM and the domains of data investigations of heritage buildings current state of the art. ISPRS Ann. Photogramm. Remote Sens. Spat. Inf. Sci. 2019, 42, 661–667. [Google Scholar] [CrossRef] [Green Version]
  214. Bani Feriel, B.; Ilham, K.; Boudemagh Souad, S. Investigating the Synergy of Integrated Project Delivery and Building Information Modeling in the Conservation of the Architectural Heritage. Contemp. Urban Aff. 2019, 2, 67–77. [Google Scholar] [CrossRef] [Green Version]
  215. Pauwels, P.; Verstraeten, R.; De Meyer, R.; Van Campenhout, J. Architectural Information Modelling for Virtual Heritage Application. In Proceedings of the Digital Heritage–14th International Conference on Virtual Systems and Multimedia, Limassol, Cyprus, 20–25 October 2008; pp. 18–23. [Google Scholar]
  216. Pires, H.; Marques, P.; Oliveira, R.; Henriques, F. Towards a multispectral GIS integrating laser scanning data or how can geomatic improve C & R documentation practices: A first approach using two XVIth century wood paintings of “Convento de Cristo” in Tomar. Scanning 2007, 1–6. [Google Scholar]
  217. Kuzucuoğlu, A.H. Application of Geographic Information System (GIS) in the Museum Buildings: A Case Study of Istanbul Beylerbeyi Palace Museum. In Proceedings of the 5th International Congress ‘Science Technology for Safeguard of Cultural Heritage Mediterranean Basin’, Iatanbul, Turkey, 22–25 November 2011; Volume IV, pp. 1–7. [Google Scholar]
  218. Vallone, R.; Moscatelli, M.; Zumaglini, M.; Grunner, R.; Klementschitz, R.; Laurent, R. GIS as Tool for Cultural Heritage Management. In Sustainable Tourism as Driving Force for Cultural Heritage Sites Development; CNR IGAG: Monterotondo, Italy, 2013. [Google Scholar]
Figure 1. The division of (a) 3D shape reconstruction methods [20] and (b) remote sensing methods [24].
Sustainability 11 07046 g001
Figure 2. (a) The master map and (b) land survey and height map covering the museum area (Museum of King Jan III’s Palace at Wilanów; Dephos).
Sustainability 11 07046 g002
Figure 3. Sample documentation stored in the museum: (a) A floor plan (Museum of King Jan III’s Palace at Wilanów; Dephos), (b) a cross-section (Museum of King Jan III’s Palace at Wilanów); Dephos), and (c) an archaeological profile (Museum of King Jan III’s Palace at Wilanów; Andrzej Gołembnik Z.A.K.).
Sustainability 11 07046 g003
Figure 4. Ideal reflection (a), partial illumination (b), partial occlusion (c) [55].
Sustainability 11 07046 g004
Figure 5. The effect of beam refraction at the edges (a) [23], an example of the mixed edge problem occurring in the point cloud acquired for a historic building belonging to the Museum of King Jan III’s Palace at Wilanów (b); surface mapping errors on a hanging chain (c) [56].
Sustainability 11 07046 g005
Figure 6. (a) Reflection intensity of the color palette. (b) Reflection intensity of the black shades (50% pattern/50% scan).
Sustainability 11 07046 g006
Figure 7. (a) A photograph of a colored test field (DatacolorSpyder CHECKER). (b) Scan (intensity) of the test field in grayscale (0–255) [62].
Sustainability 11 07046 g007
Figure 8. Diagram of the relationship between the intensity value (x axis) and the determined mapping error of the reference plane (y axis) with the fitted trend line [62].
Sustainability 11 07046 g008
Figure 9. The example of gaps in the data (decoration reflective parts).
Sustainability 11 07046 g009
Figure 10. The example of wrong measured trump (point cloud) with deformation analysis (deviation from reference cylinder) [63].
Sustainability 11 07046 g010
Figure 11. (a,c) Point clouds of gilded details acquired by TLS. (b,d) Point clouds acquired from digital image matching (red—blind spots, green—geometric corrections [21].
Sustainability 11 07046 g011
Figure 12. Examples of elements of an object on the orthoimage from TLS and from the image matching point cloud [81].
Sustainability 11 07046 g012
Figure 13. (a) An orthoimage generated from integration of point clouds from TLS and image matching. (b) Enlarged/zoomed images show selected elements of the processed wall [81].
Sustainability 11 07046 g013
Figure 14. (a) Taking photos and aligning them in order to produce a 3D model of a cabinet; (b) dense point cloud of the cabinet; (c) untextured mesh of the cabinet (Museum of King Jan III’s Palace at Wilanów).
Sustainability 11 07046 g014
Figure 15. TLS point clouds acquired for the (a) Chinese Gazebo and (b) one of the Palace elevations (Museum of King Jan III’s Palace at Wilanów).
Sustainability 11 07046 g015
Figure 16. (a) Intensity orthoimage and (b) resulting architectural documentation of a part of the western elevation of the Palace (Museum of King Jan III’s Palace at Wilanów).
Sustainability 11 07046 g016
Figure 17. Museum’s profile on Sketchfab—the platform for sharing 3D models (https://sketchfab.com/muzeum_wilanow) (Museum of King Jan III’s Palace at Wilanów).
Sustainability 11 07046 g017
Figure 18. (a) The 3D model of the Palace and Markoniówka based on the integration of photogrammetry and TLS data, (b) the 3D model of the King Jan’s cabinet, (c) the 3D model of the bustof Frédéric Chopin (Museum of King Jan III’s Palace at Wilanów).
Sustainability 11 07046 g018
Figure 19. Munch, The Scream, hyperspectral image cube—each pixel contains spectral information characteristic for a certain material [115].
Sustainability 11 07046 g019
Figure 20. The Portrait of Izabela Lubomirska: (a) Natural colour photo (photo by Zbigniew Reszka, Museum of King Jan III’s Palace at Wilanów), (b) conservatory UV photo (photo by Agnieszka Indyk, Museum of King Jan III’s Palace at Wilanów), (c) conservatory photo taken in sodium light (photo by Agnieszka Indyk, Museum of King Jan III’s Palace at Wilanów).
Sustainability 11 07046 g020
Figure 21. The structure of the geographical information system (GIS) working in Museum of King Jan III’s Palace.
Sustainability 11 07046 g021
Figure 22. Examples of map services published online, based on GIS schemas: (a) PARK, (b) ELEVATIONS, (c) INTERIORS, (d) ARCHEO, (e) StoryMap “Wilanów then and now”, (f) Biodiversity (Museum of King Jan III’s Palace at Wilanów).
Sustainability 11 07046 g022
Figure 23. The map application MARIWIL—temperature monitoring in the Palace shown on the map (Museum of King Jan III’s Palace at Wilanów).
Sustainability 11 07046 g023
Figure 24. Example data contained by (a) ELEVATIONS and (b) INTERIORS schemas, presented on the museum’s website (Museum of King Jan III’s Palace at Wilanów).
Sustainability 11 07046 g024
Table 1. The division of terrestrial laser scanning (TLS) errors.
AuthorsStaiger [48]Lichti & Gordon [50]Litchi [51] & Smith [52]
Error division
(1)
errors related to the object
(2)
errors related to the measurement environment
(3)
methodological errors
(1)
internal errors (occurring during the examination of the instrument)
(2)
external errors (related to the tested object or environment in which the measurements and methodological methods are performed)
(1)
random errors—mainly related to measuring distance and encoder—affecting the accuracy of horizontal and vertical angles measurements
(2)
systematic errors—impossible to unambiguously describe with mathematical formulas. They include errors caused by the precision of clock reading, distance drift measurement (caused by temperature rise) and the performance of the measurement system itself

