1. Introduction
In recent years, bike sharing has increasingly spread across the world, with approximately 800 bike-sharing programs available in 2015 [
1]. According to 2017 data from the local government in Nanjing (China), the annual growth rate of bicycle-vehicle collisions (BVCs) reached 1.5%. At the same time, there is emerging research on improving cycling safety, mostly focused on helmet use [
2] and operational cycling speeds [
3]. Compared with private bikes, shared bike users have lower operational speeds and are more reluctant to wear helmets [
4]. While the former is likely to improve cycling safety, the latter reduces cycling safety. The safety influence of using shared bikes needs further research.
One of the explanations provided for vulnerable road user accidents is their poor visibility to other drivers [
5,
6,
7]. Shared bike features show a possible difference in night visibility. Shared bikes commonly use a uniform and bright surface, so that the public can find them easily [
8,
9]. In China, the most popular shared bikes are Mobike and Hellobike. The former uses bright orange and the latter is blue and white. In Canada, Bike Share Toronto is green and black. Further, Bixi in Britain is green and gray. However, studies on the difference in visibility between shared bikes and private bikes are scarce.
On the other hand, using visibility aids to increase visibility is equally important, especially when cycling in low-light conditions [
10,
11]. Visibility aids can increase the distance at which car drivers detect cyclists at night [
12,
13]. Currently, front reflectors, static lights, and flashing lights are widely used to improve cyclist visibility at night [
14,
15,
16]. Further, some countries and regions have started placing legal requirements on shared bikes to improve cycling visibility at night. For example, in Mainland China, night-time reflectors need to be added but there is no requirement for helmets and headlights. In the United States, Singapore, Australia [
17], and some other locations, headlights are provided with shared bikes as mandatory requirement. Other promising visibility aids include retroreflective markers. Due to drivers’ visual sensitivity to human motion patterns, when placing retroreflective markers on users’ major moving joints (such as ankles, knees, wrists, etc.), drivers can recognize the presence of users more frequently and at much longer distances [
18,
19]. Much research has evaluated visibility during night cycling using different visibility aids [
13,
20], but there is little research on the difference between shared bikes and private bikes when using different visibility aids.
Therefore, the main objective of this study was to evaluate the difference between shared bikes and private bikes when using visibility aids under low light conditions. Specifically, the aim of this paper was to:
Evaluate the difference in visibility between shared bikes and private bikes with five types of visibility aids.
Explore the difference in behavior when using visibility aids. Cyclists’ estimation of their own visibility is among the key influencing variables.
This study can contribute to achieving a better understanding of the visibility of shared bikes. Our results could help policy makers and cyclists to equip shared bikes with suitable visibility aids. Further, we can provide more reasonable advice on night cycling for cyclists.
2. Methodology
The experimental methods employed in this research are introduced in this section, including each step of this experiment and its related information.
2.1. Participants
In total, 50 participants completed the experiment, with a gender ratio of 1.27:1.00 (male: female).
Two subjects aged 25 and 40, respectively, with motor vehicle driving licenses issued by China’s public security authority, were selected as the drivers of our test vehicle. Both of the subjects drive regularly—every week in the past two years—and have had no accidents in the last three years.
Recruitment
Offline leaflets and online advertising were both used to recruit participants (as bike riders) for our experiment. A total of 81 persons responded. However, due to logistics and test requirements, 53 persons initially participated, with 50 successfully completing the test.
Demographics
Data on gender, age, bike accidents, etc., for each participant were collected using a questionnaire before the test, and the statistical results are shown in
Table 1. All participants came from Nanjing, China. Accidents were defined as incidents in which the participants were injured or caused an injury to anyone else while riding a bike during the past year.
2.2. Driving Scenario
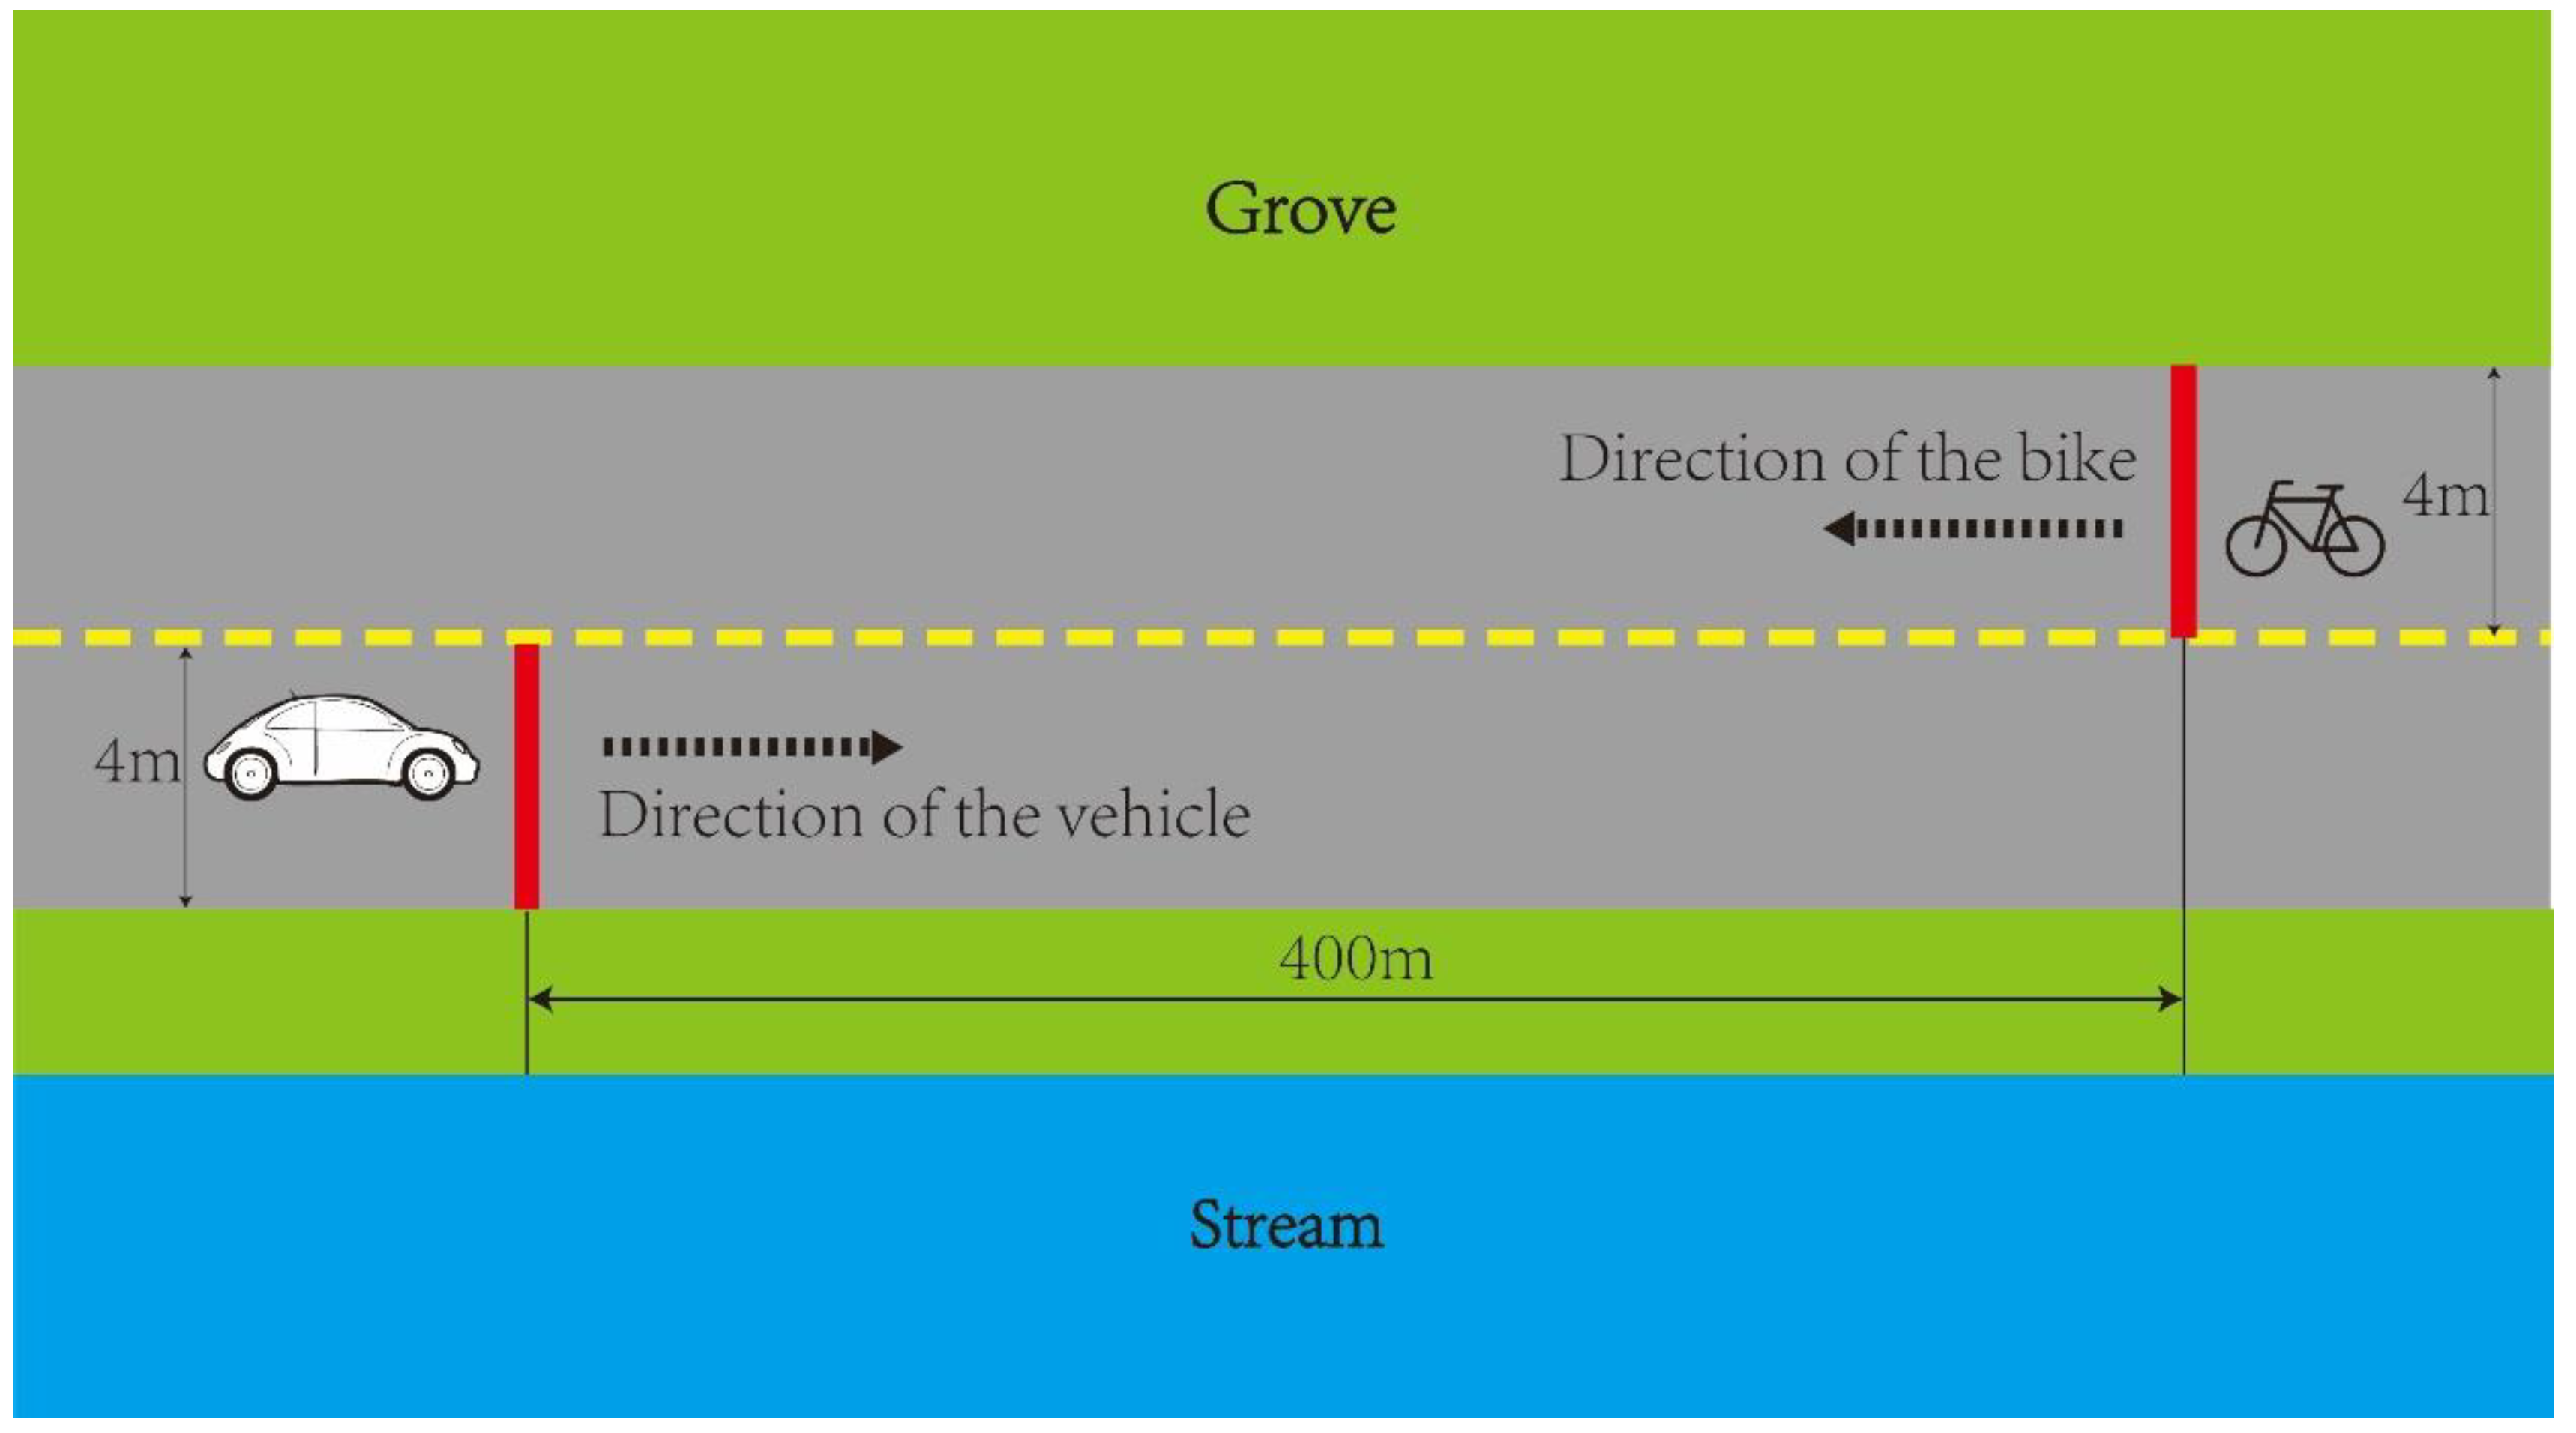
The layout of the test driving scenario is shown in
Figure 1, where the driving course was a 400 m-long (1312 ft) section of straight road. The starting point was the departure point of bike riders and the terminal was the departure point of the test vehicle. The starting distance of these points between bike riders and the test vehicle was 400 m (1312 ft). The road width is 8 m, which is divided into two 4 m-wide (13.12 ft) mixed lanes for both motor vehicles and non-motorized vehicles. The driving road section was closed during the driving tests, in order to avoid any interference caused by other pedestrians or other motor vehicles.
Illumination of the Experimental Scene
All experiments were conducted at least one hour after sunset. A handheld light-measuring device was used to test the illumination conditions of the road section. We ensured that the illumination parameter for each test was not greater than 20 Lux at a height of 1.5 meters.
Weather in the Experimental Scene
All experiments were conducted in dry weather.
2.3. Test Vehicles and Bikes
A 20-inch HITO brand black bike was used as the private bike, with a net weight of 11 kg. This bike was suitable for riders with a height of between 140 cm and 180 cm.
Sharing-bikes from OFO company were chosen as our test shared bikes. The classical OFO 2.0 bike type was used, with the most commonly used type being a 26-inch family bike size. The color was golden yellow (CMYK color value C3, M26, Y96, K0).
The vehicle used in our experiment was a Volkswagen (POLO 1.4 L, 2007 version), with height of 1,465 mm, width of 1,650 mm, length of 3,916 mm, and wheelbase of 2,460 mm. It was a five-door, five-seat car, and the color was sky blue (CMYK color value C40, M0, Y0, K0).
2.4. Experiment Design
The experiments were designed to test the influence of visibility under low-light conditions using different visibility aids. At the same time, the difference between private bikes and shared bikes was analyzed to determine effects on night visibility.
Types of Visibility aids
The influence of the following five types of visibility aids was tested:
Static light: an LED bike light was used with a maximum brightness of 250 LM and a direct radiation distance at night of 80 m.
Flashing light: The flashing light used in this study has the same lighting capability as the static light and a flashing frequency of 0.5 times a second.
Front reflectors: Yellow hard reflectors were mounted at the front of bikes and the front of the pedals.
Retro-reflective strips on the major moveable joints: Red retro-reflective strips produced by China ONLINELOVE Company were used. The strip width was 1 cm (0.394 inches). Prism reflective films were attached to the strips. According to the test data provided by the manufacturer, the maximum visible reflection distance was 300 m (984.25 inch).
No visibility factors.
Experiment Steps
The participants were asked to perform independent trials on the two kinds of bikes, which were equipped with one of five types of visibility aids. Each participant was required to complete 10 trials (five on shared bikes and five on private bikes), as listed in
Table 2. For each participant, the order of these ten trials was random.
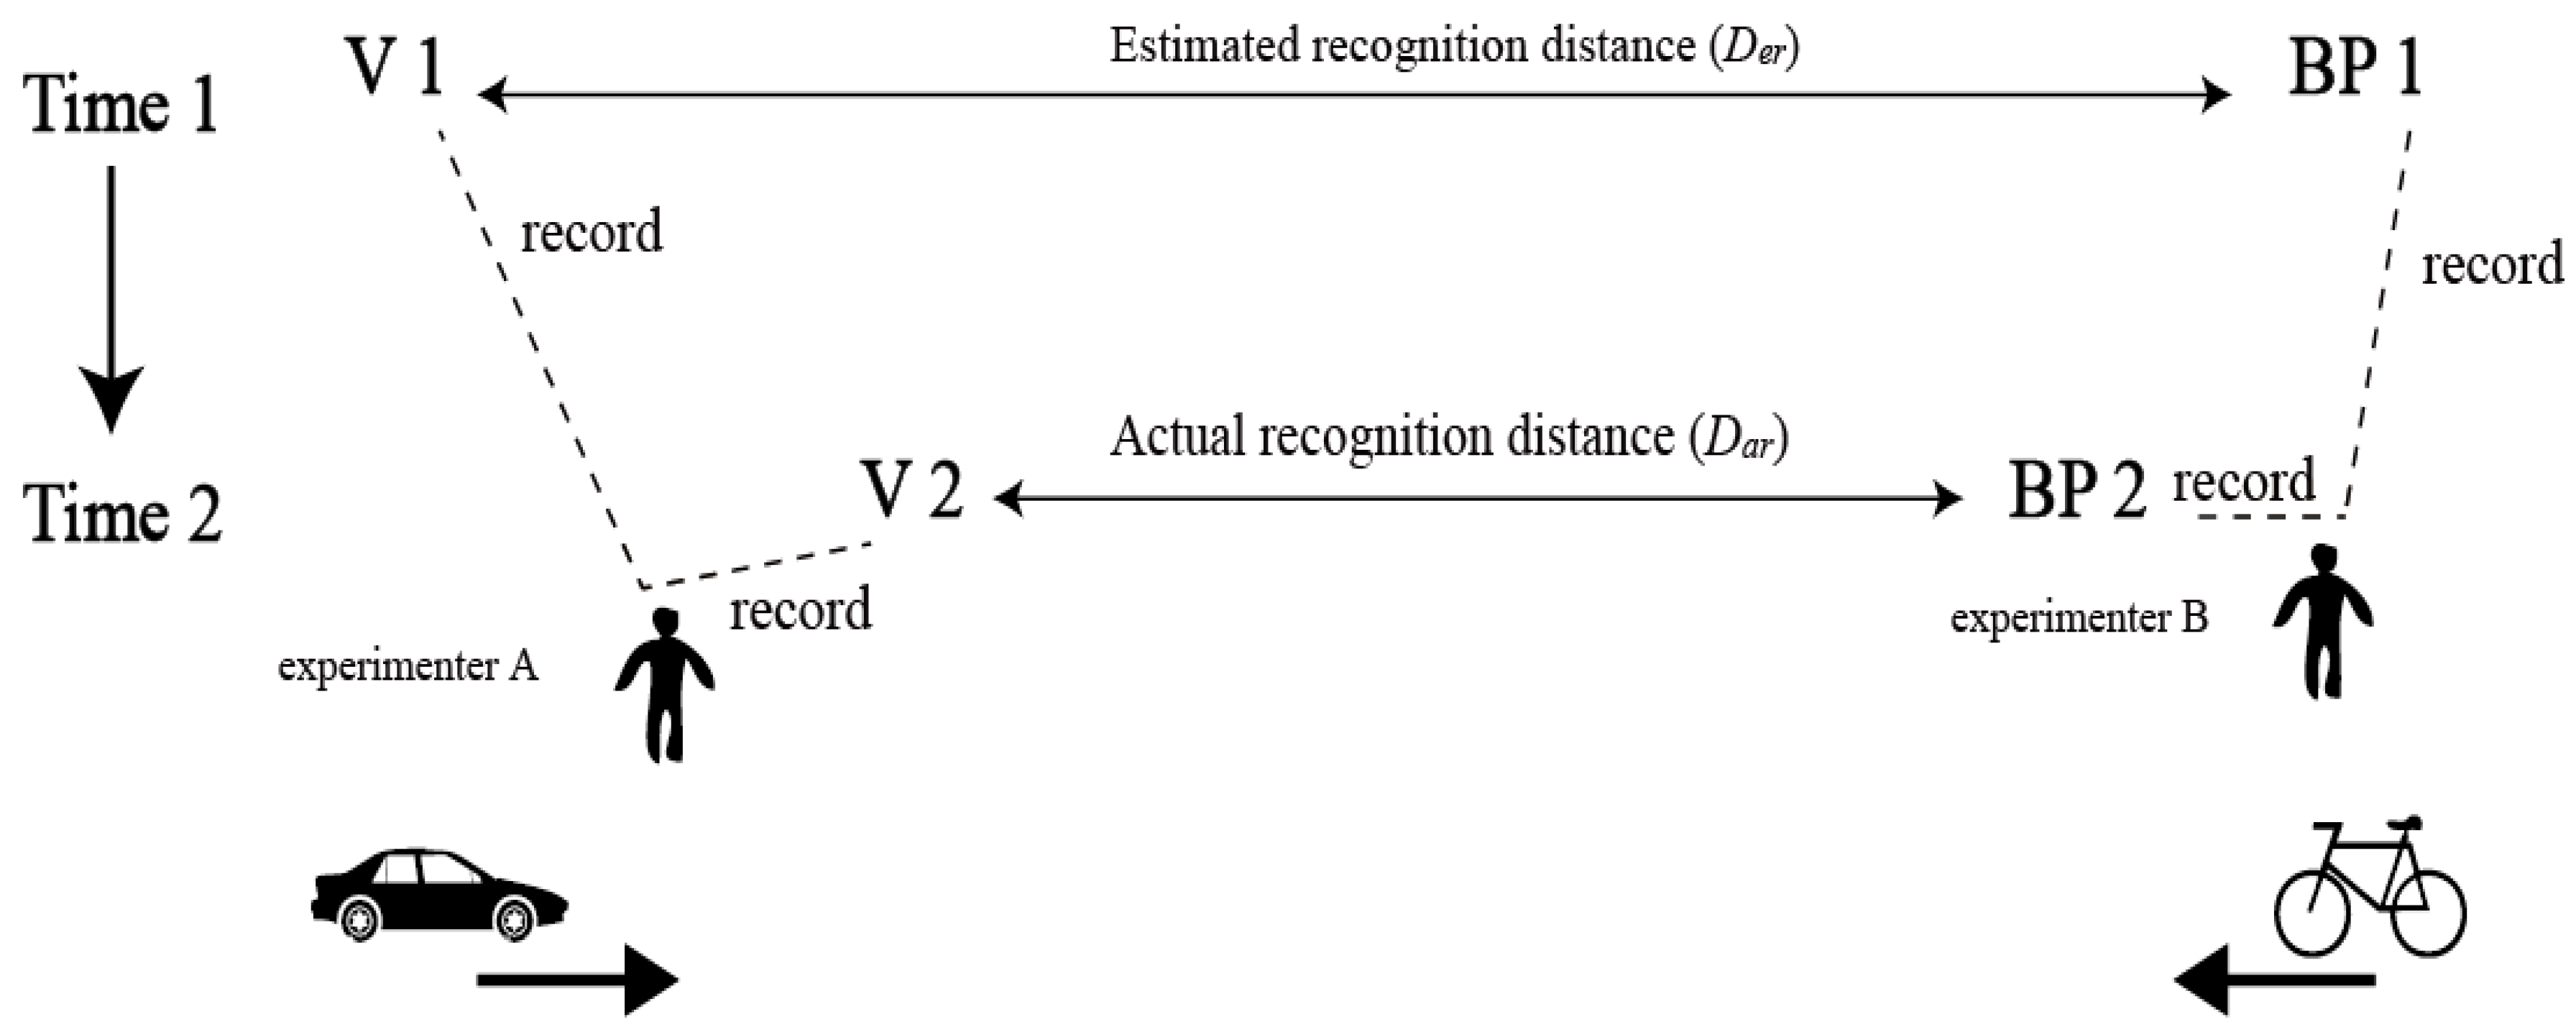
The participants were asked to ride to the end of the road section at a normal speed (around 15 km/h) in each trial. One experimenter assisted the participants to select and change different bikes and visibility aids and followed the participants to record two position coordinates of the participants:
The position coordinate of the bike rider at which the bike rider thought that the motor vehicle driver could see them was recorded as bike position 1 (BP1).
The position coordinate of the bike rider (participant) at which the motor vehicle driver said that he/she could see the bike rider was recorded as bike position 2 (BP2).
The other experimenter recorded two position coordinates of the test vehicle:
The position coordinate of the motor vehicle at which the bike rider thought that the motor vehicle driver could see them was recorded as vehicle position 1 (VP1).
The position coordinate of the motor vehicle at which the motor vehicle driver said that he/she could see the bike rider was recorded as vehicle position 2 (VP2).
Speed measuring devices and cameras (used to record the speed and position of bikes) were equipped on both the test vehicle and bikes for the test trials. The data recording process is shown in
Figure 2.
Test Trial
One staff member introduced the test procedures without describing the test purpose to reduce potential interference caused by participants. The participants were asked to repeat the instructions to sure that they fully understand the experiment. A written description of the detailed procedures was provided to every participant before the test. We also required each participant to complete a random training trial to become familiar with the test procedure.
In addition, the following two criteria were used to evaluate the validity of a recorded result:
Speed requirement: with an average speed of 15 km/h, the speed variation of a bike rider should not be greater than 5 km/h. The speed variation of the motor vehicle should not be greater than 10 km/h, given the required driving speed of 40 km/h.
Track requirement: the cyclist is required to ride the bike in the right lane and the distance to the central line of the road should not be less than 2 m (6.56 feet). The driver should also drive the motor vehicle in the appropriate lane and not cross the central line.
If tests failed to meet one or all criteria, the tests were required to be performed again. If four consecutive tests completed by a participant did not qualify, this participant was removed from the study.
3. Results
Data analysis was performed using three dependent variables:
The estimated recognition distance (Der), or the distance between cyclists and drivers when the cyclists reported that they thought they were visible to drivers.
The actual recognition distance (Dar), or the distance between cyclists and drivers when the drivers reported that they could see the cyclists.
The distance difference (DD), which means the difference between Der and Dar. A value of α = 0.05 was used in all analyses to determine the significance of main effects.
The multiple-factor repetitive measurement and the analysis of variance were conducted on the estimated recognition distances, actual recognition distances, and distance differences as functions of the kind of bikes (2 levels: level 0 = private bikes and level 1 = shared bikes), visibility aids (5 levels: level 1 = static light; level 2 = flashing light; level 3 = reflector; level 4 = retro-reflective strips on the major moveable joints; level 5 = no visibility aids).
Table 3 shows the least squares means of
Der,
Dar, and
DD for private bikes and shared bikes across all visibility aids.
3.1. Estimated Recognition Distance (Der)
It can be seen from
Table 4 that, across all kinds of visibility aids, the estimated recognition distance of shared bikes was significantly higher than that of private bikes, with
p = 0.0071 and F(1,49) = 8.39.
For comparison of private bikes and shared bikes, as shown in
Table 5, both static and flashing lights provide significantly higher
Der values than the use of reflectors, retro-reflective strips, and no aids. No aids were the least visible scenario based on the shortest distance of detection for all tested visibility aids. There was no significant difference in
Der between static light and flashing light, or between reflector and retro-reflective strips.
Table 5 shows the differences of Least Squares Means in pairwise comparison.
The
Der of shared bikes with a static light was also significantly higher than that of private bikes, with
p = 0.0111. Differently, there was no statistical difference between flashing light, reflector retro-reflective strips, or no aids (
Table 6).
3.2. Actual Recognition Distance (Dar)
In the tests of fixed effects, as indicated in
Table 7, there was no statistical difference between private bikes and shared bikes for actual recognition distance, with F(1,49) = 3.18 and
p = 0.0849 > 0.05.
As shown in
Table 8, use of a bike with a reflector resulted in a higher actual distance than use of a bike with a flashing light, retro-reflective strips, or no aids, with positive estimate differences (6.1708 for retro-reflective strips, 7.6375 for flashing light, and 7.35 for no aids) and values of
p < 0.0001. Interestingly, use of both a static light and a reflector had a larger positive estimate difference compared to use of a flashing light (6.0292 for static light with
p = 0.005; 7.6375 for reflector with
p < 0.0001), indicating that use of a flashing light reduced actual recognition distance compared to use of a static light and reflector.
For use of the same retro-reflective strips, the actual distance was statistically higher with shared bikes than that for private bikes, with a positive estimate of differences of least squares means of 4.2417 (±1.809 standard error),
p = 0.0207. This difference between shared and private bikes remained when there was no visibility aid, with a positive estimate of 4.25 (±1.809 standard error) and
p = 0.0205. When equipped with a flashing light, private bikes were visible at a greater distance than shared bikes, with an estimate of 4.1583 (±1.809 standard error) and
p = 0.233.
Table 5 shows the differences of Least Squares Means in pairwise comparison. (Shown in
Table 9)
3.3. The Distance Difference (DD) between Estimated Recognition Distance and Actual Recognition Distance
In the tests of fixed effects of
DD, as shown in
Table 10, there was no significant difference for different types of bikes (F(1,49) = 3.31 and
p = 0.0793 > 0.05). Given those results, we only compared the
DD under different visibility aids, as shown in
Table 11.
As shown in
Table 11, the use of static light gave a positive estimate of distance differences compared to the use of a reflector, retro-reflective strips, or no aids (16.2083 compared to a reflector, with
p < 0.001; 10.7033 compared to retro-reflective strips, with
p < 0.001; and 18.8196 compared to no aids, with
p < 0.001). These results indicated that cyclists overestimate their visibility to a greater degree when using a static light than when using a reflector, retro-reflective strips, or no aids. At the same time, the results for night cycling without any visibility aids indicated less overestimation of cyclist visibility, with a lower
DD value using no aid compared to that using a flashing light, retro-reflective strips, or static light.
Additionally, for both types of bikes and all kinds of visibility aids, the results showed a positive estimate value for
DD (49.1958, with a standard error of 2.6682,
p < 0.001) in the solution for fixed effects, which indicated a statistically higher estimated recognition distance relative to the actual recognition distance. In other words, night-cyclists might overestimate their visibility in low light conditions, as reported by Wood [
18,
19]. We also did a one-sample T-test for the hypothesis
H0 that the ensemble average of
DD is zero, and the result showed that t (49) = 39.8296 and
p <
0.001, which allowed the rejection of
H0.
3.4. A Post-Experiment Survey
Analysis of the experiment data in
Section 3.3 revealed that although night-cyclists have greater confidence when using a bike with a flashing light, our experiment indicated that static light and retro-reflective strips have better night visibility. Because few bikes in China are equipped with lights, especially flashing lights, it is necessary to assess the familiarity of drivers with flashing-light bikes.
We next did a survey to probe cyclists’ views about private bikes and shared bikes in a night-cycling scene with different visibility aids. We then used a thirty-second video to assess drivers’ familiarity with flashing-light bikes. The survey was completed by 187 respondents who ranged in age from 20 to 59. Of the respondents, 123 people were invited to answer questions as cyclists, and 65 people were invited to complete this survey as drivers.
In the survey of cyclists, 27.6% interviewees said that they felt a perceptible difference between using a shared bike or a personal bike. The rest (72.4%) reported no or only a slight difference between using a shared bike or a personal bike. Almost all interviewees considered shared bikes to be more visible for night cycling (93.5%). In response to a question on which type of visibility aid is the most visible for night cycling, 91.9% interviewees selected a flashing light, and the remaining respondents chose a static light.
The survey of drivers did not include written questions. Drivers watched a thirty-second video that was recorded from the driver’s perspective about a bicyclist cycling at night from the opposite direction (nearly 200 meters away) on a bike with a flashing light. As they watched this video, we asked what they thought the flashing light was. No drivers thought it was a bike during the first 10 s of the video and 41.5% drivers reported that it might be a bike in the middle 10 s. After watching the whole video, 81.5% of viewers thought it was a bike, but only 61.5% were sure. This result indicated a low ability of drivers to recognize a bike with a flashing light, which may explain the difference between our result and that of Wood [
18].
4. Discussion
We have evaluated the visibility difference between private bikes and shared bikes with five types of visibility aids. The results showed cyclists overestimate shared bikes’ visibility in lowlight conditions. As a visibility aid, a flashing light does not provide as much visibility to others as cyclists expect it to. The difficulty of quick recognition one of the main the possible causes of this, as seen in the post-experiment survey.
Firstly, one result in this research is consistent with Wood [
18,
19], which indicated that cyclists overestimate their own night-time visibility. One possible explanation for this is that cyclists tend to stand on their own shoes to estimate recognition distance. A previous study showed that cyclist-motorists had fewer collisions with cyclists and detected them at a greater distance [
5]. According to bike crashes research in New Zealand conducted by Tin et al. [
21], cyclists’ visibility may be improved if more people cycle and fewer people drive cars. In other words, cyclists or cyclist-motorists may have a longer recognition distance for other cyclists than motorists. So in our research, if our cyclist tends to estimate their recognition distance as a cyclist observing another cyclist, it would be a shorter estimate than a motorist would actually take to spot a cyclist.
One interesting result is that cyclists think shared bikes are more visible than private bikes while there is actually no significant difference. Different proportions of sensory visibility and cognitive visibility between cyclists and motorists are one possible reason for this. Sensory visibility shows the extent to which an object can be distinguished from its environment, due to its physical characteristics such as its shape, brightness, color, and angular size [
22,
23]. Obviously, shared bikes have a higher sensory visibility than private visibility due to its bright and uniform appearance. Cognitive visibility refers to the extent to which an object be noticed due to an observer’s experience, expectations, and objectives [
24,
25,
26,
27]. In lowlight conditions, it can assume that shared bikes and private bikes may not have a significant cognitive difference. This means motorists may obtain the same observation times, no matter whether they encounter a sharing bike or private bike moving in the opposite direction. And they will extract similar information from traffic scenes based on their own expectations. Cyclists may estimate their own bikes’ visibility mostly based on sensory visibility, while drivers mostly use cognitive visibility. However, for now this remains a hypothesis, which targeted research should explore further in the future.
Another cognitive difference is that flashing lights do not provide as good a visibility as cyclists estimate. A static light and flashing light showed a higher estimated recognition distance than reflector and retroreflective strips. But a static light and reflector had a significantly higher actual distance than flashing light, retroreflective strips, and no aids. A flashing light still provides higher sensory visibility, due to our visual sensitivity towards patterns of human motion [
28,
29]. However, it may be hard for drivers to recognize, which means it provides bad cognitive visibility, according to the post-experiment survey.
However, there is still a gender gap in using shared bikes. This could be a constraint for the validity of similar experiments if these gaps are not previously addressed. The gender distribution of cyclists and the gender distribution of drivers were not representative of the gender distribution of these two groups in the surveyed area. The experimental sample in our research included more males than females. It would be interesting to carry out the same experiment with a different sex ratio to study the effect of gender on cyclists’ and drivers’ estimation differences between shared bikes and private bikes.
We evaluated the visibility difference in shared bikes and private bikes using five types of visibility aids. The current study can advise policy makers in providing proper visibility aids and improving the safety of share bike programs. In addition, it suggested that there is a difference in sensory visibility and cognitive visibility between cyclists and motorists. Further research on cyclists and drivers’ sensory visibility and cognitive visibility is necessary for improving cyclists’ visibility in lowlight conditions.


