1. Introduction
National parks are often the leading destinations for nature-based tourism because they show the most representative ecosystems within a country: National parks offer plenty of opportunities for recreation, education, and connection with nature. Eagles and McCool [
1] have addressed the importance of park tourism as support for local economies and for the conservation of the environment they protect. Furthermore, park tourism has been regarded as an influential factor in raising awareness on the preservation of natural areas [
2]. This importance is reflected in the growing number of visitors observed in the 15 parks that form the national network of protected parks in Spain. Over the last ten years, visitors to the national park network have increased by 50% [
3,
4].
On the other hand, more visitors in national parks can produce negative impacts on the natural environment, such as ecosystem degradation [
1,
5,
6], wildlife distress [
7], and the interruption of natural cycles [
8]. Thus, park managers must have consistent and accurate information on visitors’ characteristics to properly manage and protect these areas.
Visitor data is essential for decision-making, policy formulation, and monitoring of protected areas management [
9]. Data that characterizes visitors is crucial for a variety of planning tasks, which include: The identification of trends in demand, generation of forecasts, allocation of infrastructure and services within a park, scheduling of maintenance tasks, staff allocations, and the provision of resources [
1]. In particular, temporal data on park visitation is among the most important to characterize visitor influx and identify the influencing factors of park tourism [
10]. Knowledge of the temporal distribution of visitors is used to measure the flow, seasonality, visitor intra-movement, and even the carrying capacity.
Traditional methods of measuring visitors include visitor surveys, direct observation, and on-site counters [
10]. However, the collection of such data often entails high costs in terms of time and money. Moreover, traditional visitor data has a limited level of detail [
11,
12]. New methods have emerged to collect spatial and temporal data of visitors such as GPS. In this sense, GPS loggers have been proven useful in gathering high detail data to characterize visitors and their movement [
13,
14,
15].
We are currently witnessing a revolution in data production, favored by information and communication technologies, which presents endless opportunities for research [
16]. The emergence of new data sources, such as user-generated content from social media, provides new options for assessing tourism and recreation in national parks [
12]. Particularly, data from photograph sharing websites seems to be suitable for tourism research, as photography and tourism are strongly linked [
17]. From photo-sharing services, Flickr allows free access to their data through an application programming interface (API), which makes it a valuable resource for researchers and park planners.
Free access social media data is an interesting alternative to traditional surveys and GPS devices for data collection because of its reduced acquisition costs, easy access, and high spatial and temporal resolution [
18]. Indeed, social media data is a cost-free byproduct of digital interactions from their users [
19]. Such data provide a digital “footprint” of their users’ activities that come in a variety of formats, such as photos, texts, audio, and video, which can be used to analyze the spatial and temporal behavior of people.
The potential of data from social media has led to a growing interest in using these data sources to study nature-based tourism in protected areas. Research has mainly focused on geotagged data from photo-sharing websites such as Flickr and Instagram (no longer available for download). Such data had been used to quantify recreation at natural and cultural sites at a global scale [
12], model visitation rates in national parks [
20], measure parks’ popularity [
21], map visitor flows [
22,
23], identify factors contributing to distribution patterns [
11,
24], and measure visitor use and spatial patterns [
25]. Furthermore, data from web-share services, such as Wikiloc and GPSies, had been used to measure the intensity of use for mountain biking in natural environments [
26] and to compare data sources for assessing visitation to parks [
27]. Nevertheless, further research on the applicability and validity of social media data as a source of information for visitor monitoring is needed [
25].
We contribute to the literature by providing an exploratory analysis of the time-based component of geotagged data with three different time measurements; monthly, weekly, and daily, and how well this new source of data matched official visitor data. Several papers in the literature have demonstrated the usefulness of crowdsourced data for behavioral study purposes. However, few previous papers have used social networks to analyze temporal dynamics in visits to protected areas. When they have done so, they were limited to monthly temporal rhythms, without disaggregating the weekly or daily distribution. Furthermore, this analysis was conducted in a country that has one of the most diverse landscapes in Europe, making it a privileged destination for nature-based tourism. Such diversity provides suitable candidates for testing the use of social networks to study the temporal rhythms of visitors with varied characteristics and locations, thus allowing a more in-depth analysis of the robustness of the source and the methods used. Therefore, this is an initial effort to test the feasibility of using alternative data sources for visitor monitoring in a region with highly diverse kinds of natural spaces.
This research explores the potential of using geotagged data as proxy indicators of the temporal distribution of national park visitors. By comparing official statistics of monthly visitor counts provided by Organismo Autónomo de Parques Nacionales (OAPN) with monthly Flickr users, we assessed the accuracy of geotagged data to infer the monthly distribution of visitors in the 15 parks that form the Spanish network of national parks. Then, we identified and described the temporal patterns of the visits at three levels; monthly, weekly, and daily, through data analysis and clustering techniques. To this end, the article is structured into five sections. After this introduction, the situation of the Spanish national parks and their main characteristics as a case study are introduced. The third section shows the sources and methods used, highlighting the use of data from photographs of the social network Flickr to study temporal rhythms of visits to natural spaces as the work’s main contribution. The fourth section introduces the results we obtained, and the fifth discusses them and presents the research’s final conclusions.
2. Study Area
Spain is a pioneering country in Europe in its commitment to the protection of nature [
28]. The First Law of National Parks was approved in 1916 and led to the establishment of the first national parks: Picos de Europa and Ordesa. At present, there are 15 national parks in Spain, which are representative of unique landscapes within Europe [
4]. Of these parks, two are combined land and sea (Archipiélago de Cabrera and Islas Atlánticas de Galicia), five are mountain areas (Picos de Europa, Ordesa, Aigüestortes, Sierra Nevada, and Sierra de Guadarrama), two are wetlands (Doñana and Tablas de Daimiel), two are Mediterranean forests (Cabañeros and Monfragüe), and one is a subtropical forest of lauraceous species (Garajonay) [
29] (
Figure 1). This classification of parks based on characteristics and large areas will also be used in analyzing visitors’ temporal distribution.
The 15 national parks cover a total area of 3486 km
2, which accounts for only 0.76% of the country’s entire territory. The newest park, Sierra de Guadarrama, was established in 2013, very near the city of Madrid. The size of national parks ranges from 30 to 858 km
2 (
Table 1). The Sierra Nevada is the largest park at 858.83 km
2, followed by Picos de Europa and Doñana. At the opposite end of the scale is Islas Atlánticas de Galicia; while its total extent is 84.8 km
2, only 11.95 km
2 are dry land. It is followed by the Tablas de Daimiel Park, at 30.3 km
2, and Garajonay at 39.84 km
2.
Management of national parks is shared between the OAPN and the local governments. All parks have an infrastructure for recreation and tourism services, such as visitor centers, information points, parking sites, camping facilities, and nature trails. However, the system for visits and control over them varies greatly. At some small parks with especially vulnerable ecosystems, such as Islas Atlánticas de Galicia, Timanfaya, and Doñana, there is regulated control over the number of visits. At these parks, a permit from the administration is required before the visit. However, access to most parks is free.
As such, the number of visitors to Spanish national parks varies significantly. From 2007 to 2017, the annual number of visits to national parks increased from 10 to 15 million. In 2017, The Teide National park, located in the Canary Islands, was the most-visited park, with 4.3 million visitors, accounting for nearly 30% of total visitors to the national network. In contrast, the Cabañeros national park was the least-visited park, with 100,000 visitors for the same year. Visitor pressure is also highly variable, but in general, parks on the Canary Islands have the greatest pressure, with visitor densities per km2 in 2017 at above 20,000 per km2 at Timanfaya, Teide, and Garajonay, and more than 10,000 visitors per km2 in Caldera de Taburiente.
3. Materials and Methods
The purpose of this study is to validate the use of geotagged photos as indicators of the temporal distributions of visitors to the Spanish national park network and to describe the temporal patterns that these distributions produce. This section introduces the data sources and methodology used, beginning with the collection of data, the processing of raw data and analysis, and presentation.
3.1. Data Collection and Validation
The main data source used in this research is the photo-sharing social media platform Flickr. Flickr is a website for storing and sharing photographs with 75 million users [
30]. Geotagged photos within each park were downloaded through the application programming interface (API) provided by Flickr. The API provides free access to photographs as long as it is not for commercial use. The process of collecting geotagged data starts with the collection of all unique photo IDs within a spatial and temporal extent. Using the boundaries of each park, we collected publicly shared geotagged photos that fell inside those boundaries. We downloaded photos taken between January 1, 2010 and December 31, 2016. In a second step, the photo IDs are used to collect additional metadata associated with each photo. Along with the location of the photos (latitude and longitude), other attributes were collected, such as user ID, the date they were taken, the date they were posted, owner location (nationality), and photo URL address. Both steps were implemented using a Python script. The results were stored in a relational database in a MongoDB application. Then, using XY coordinates, we mapped and analyzed the photographs on an open Geographic Information System (QGIS). A statistical analysis was performed using IBM SPSS software (Armonk, NY, USA).
The resulting dataset has 61,742 records of photos uploaded by 16,190 users, with a total median of 3.8 photos per user. The year 2014 reported the highest number of photos, with over 11,000, and the year 2010 had the lowest number of photos, with nearly 4400 photos. Approximately 0.01% of photos (13) were incorrectly dated; in other words, the date they were taken was not set on the camera, as the year reported on the photos varied from 2033 to 2400. These photos were removed from the analysis.
The distribution of photographs throughout the parks was highly unequal. In the largest and most-visited, such as Teide and Picos de Europa, there were over 10,000 photos and 3000 users (
Table 2). On the other hand, the number was reduced in spaces such as Cabañeros, Archipiélago de Cabrera, and Tablas de Daimiel. The results for these three parks should thus be taken very cautiously. The distribution of international users was also highly varied, where they were a majority, especially in parks on the Canary Islands, and very much a minority in parks such as Guadarrama and the Sierra Nevada.
From the user ID and the timestamp of each photo, we calculated the number of unique users per day for each park. We considered this number as a proxy for the number of daily visitors to the parks. Unique users per day were grouped by month to have monthly estimates. To validate our results, we tested whether there was a robust linear relationship between the number of Flickr users and official visitation records [
4]. Official records are comprised of the distribution of visitors by month of the year from 2010 to 2016. There are no official statistics available for weekly or daily visitors. Even in some parks (Sierra Nevada, Guadarrama), monthly distributions are estimated indicators.
We compared Flickr’s average monthly users with the official average monthly visitors between 2010 and 2016. These values were aggregated by month, and the average monthly users for 2010–2016 were calculated. To test the quality of data collected from Flickr we used a Pearson correlation coefficient, as similar studies have applied a similar approach [
11].
3.2. Temporal Analysis
Once Flickr data was downloaded and validated against official data, the temporal distribution of visitors to the 15 parks was analyzed by grouping the data by months to discover monthly distributions throughout the entire period analyzed, by days to discover the distribution over the weeks, and by hours to analyze daily distribution.
For monthly distributions, seasonality was calculated. Seasonality is defined as the tendency of tourist flows to be concentrated in relatively short periods of the year [
31]. To examine seasonality during the year in park visitation, we estimated the seasonality ratio (Equation (1)) using Lundtorp’s proposal [
32]. The seasonality ratio is found by dividing the highest value of visitors in a month by average monthly visitors:
where
is the Seasonality Ratio,
is the highest number of visitors in a month, and
is the average number of visitors during the months per year. The ratio increases with the degree of seasonal variation. Notice that the lower bound of the Seasonality Ratio equals one, which means the same number of visitors came every month. Its upper bound equals the number of periods compared, which is 12.
Additionally, the distribution of visitors by day of the week and at one-hour intervals was obtained to identify differences between visitor influx at each park in the network with different time horizons. First, we counted users by day of the week for each year and then added these values and calculated the mean value to produce a weekly visitor distribution. Using the same equation as for the Seasonality Ratio, we calculated an indicator to discover the concentration, or lack thereof, of visits on a certain day or days. When this concentration is high over one or several days, this logically occurs on weekends. Thus, a weekly seasonality ration (SRw) was calculated as:
where SRw is the weekly Seasonality Ratio,
is the highest value of visitors in a day, and
is the average number of visitors during days per week. The ratio increases with the degree of weekly variation.
Finally, for daily distribution, we aggregated photos by one-hour intervals and then counted unique users within each interval. Both weekly and daily temporal distributions were useful to visualize and describe seasonal patterns of visitation that were not available from official park data.
To analyze parks based on a seasonality pattern, we used K-means cluster analysis to characterize parks into similar groups. The monthly and weekly seasonality ratios were used as variables for the cluster analysis, along with the proportion of photos taken by international users. One-way ANOVA post hoc test was applied to compare means of the variables for 2, 3, and 4 clusters to select the optimal number of clusters. The comparison showed that 4 was the appropriate number of clusters for the dataset.
4. Results
4.1. Data Validation
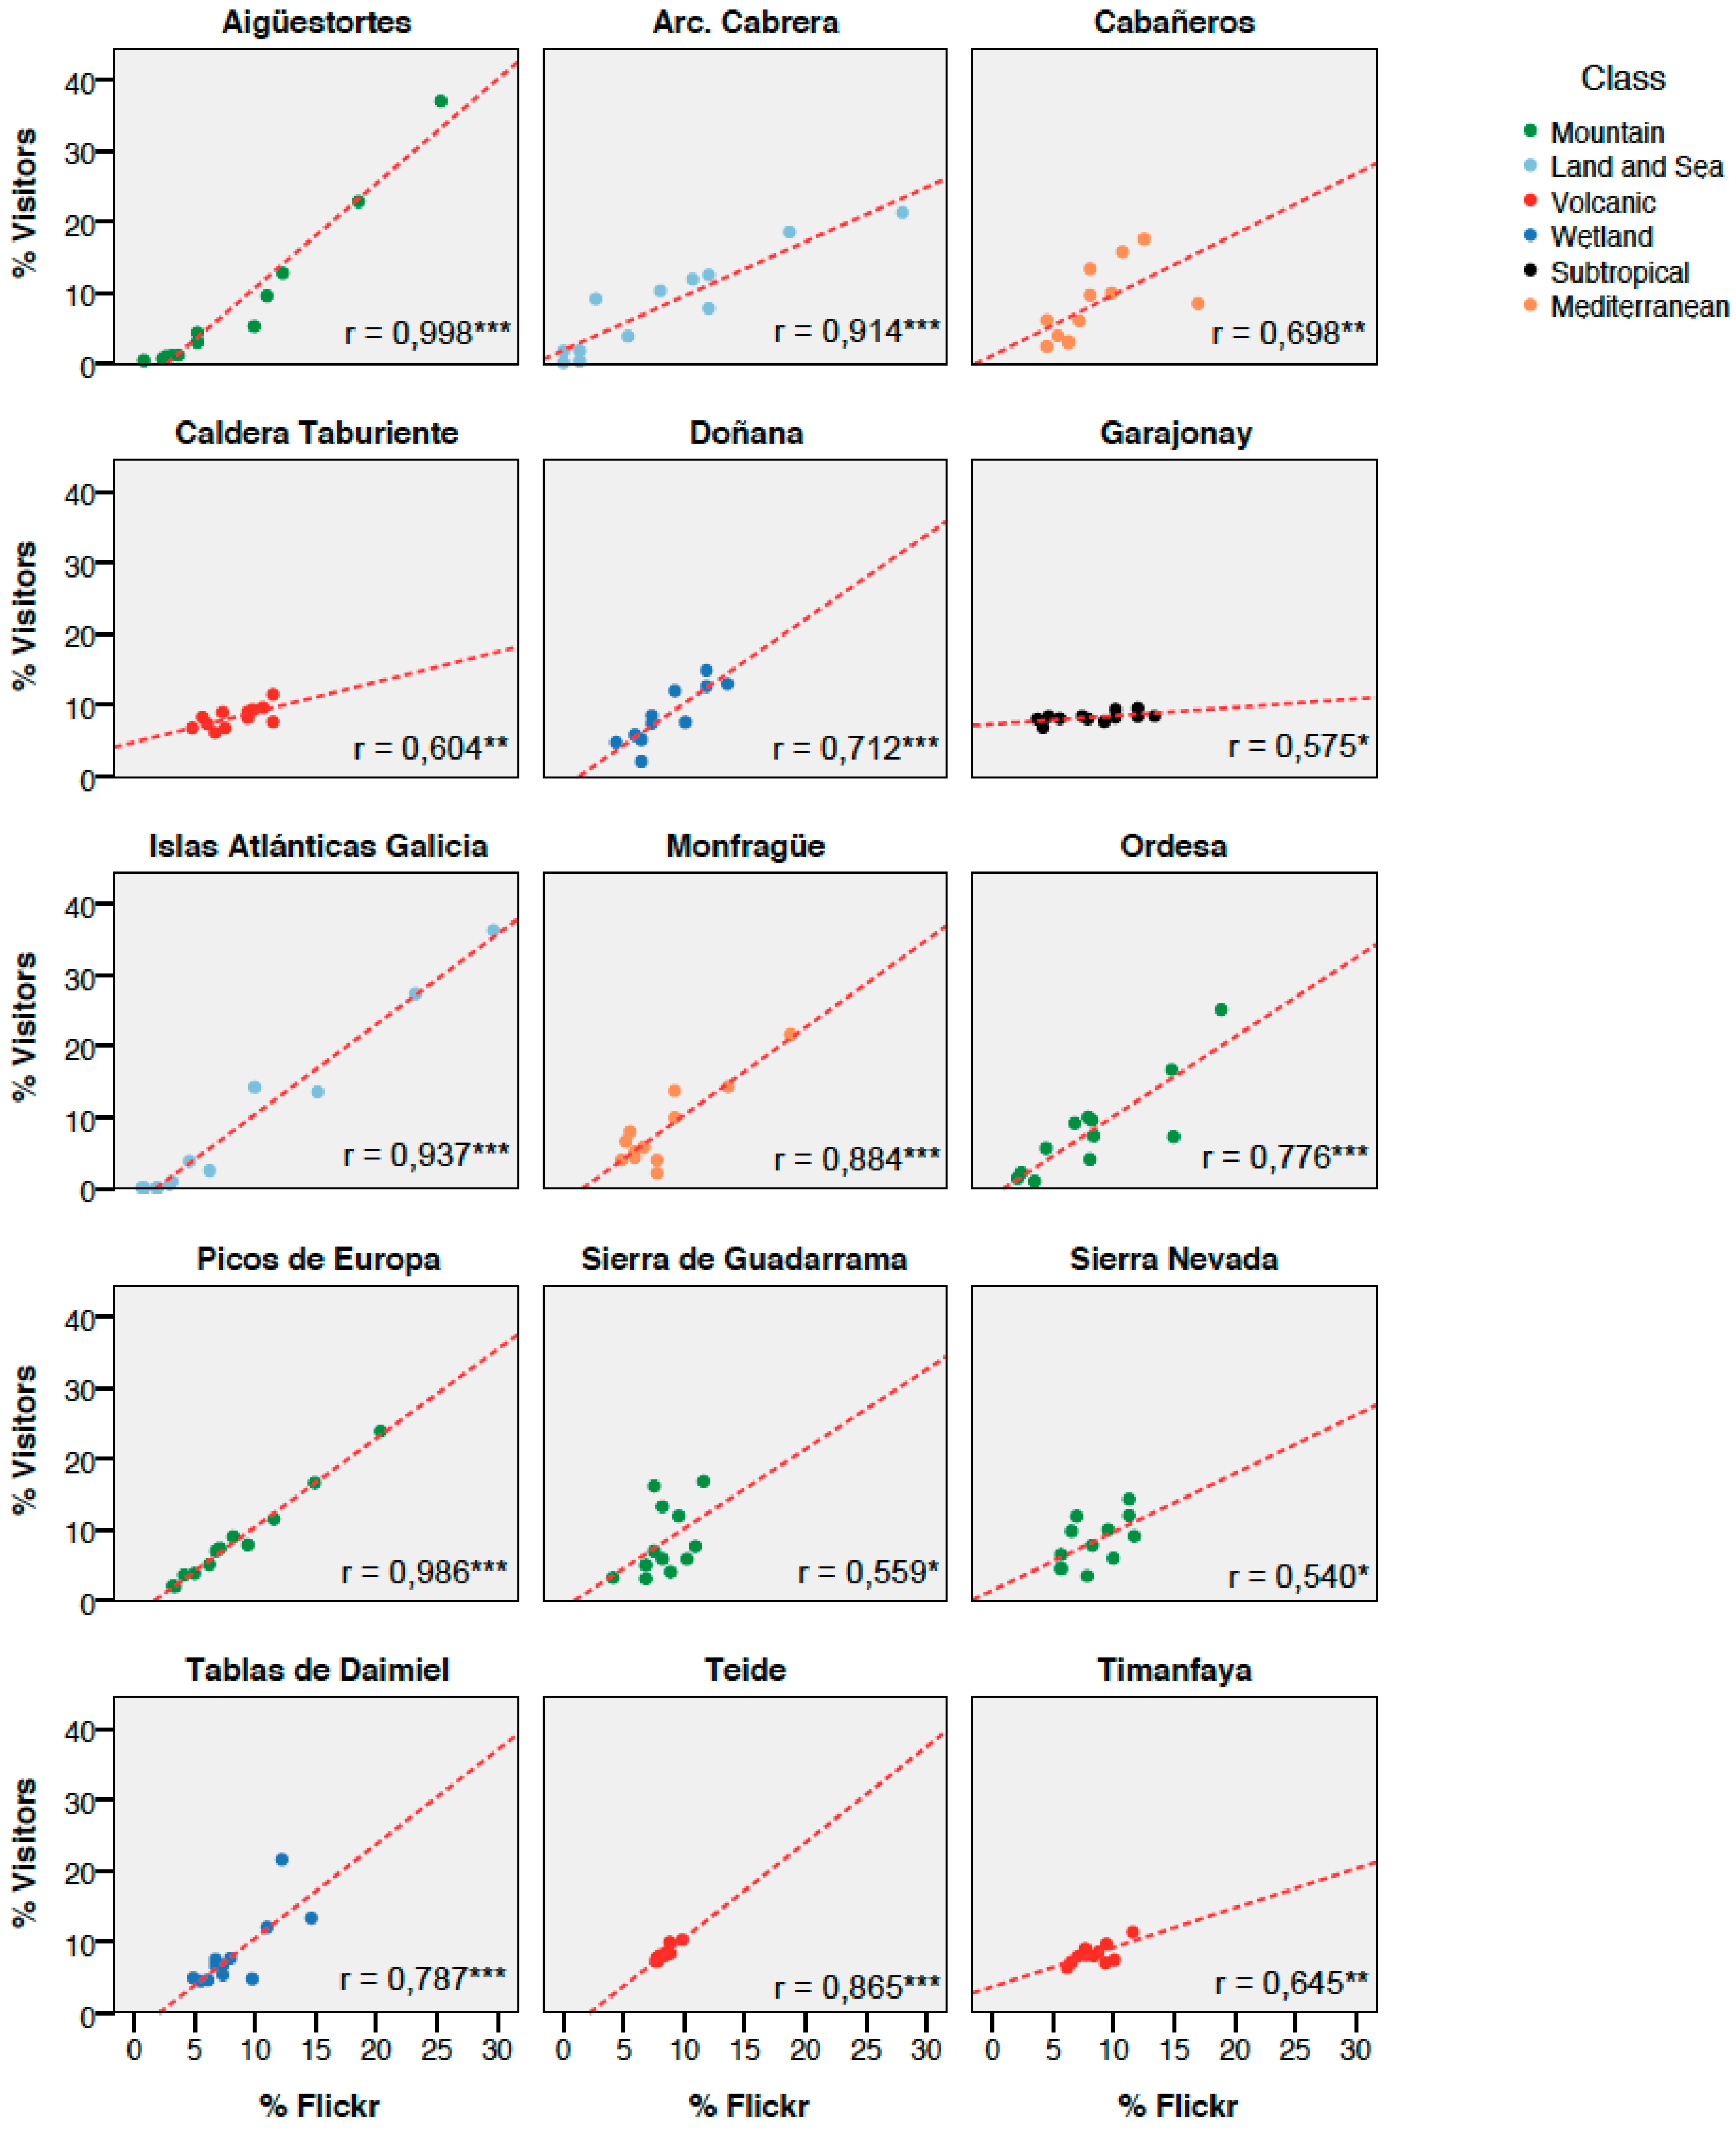
Scatter plots show that the majority of parks have a strong linear relation between Flickr users and visitors (
Figure 2). Pearson’s correlation confirms that all parks have a positive correlation. Four parks have a very high correlation (
r > 0.91,
p > 0.001). Five parks have a high correlation (
r > 0.71), and six parks have a moderate correlation, between 0.7 and 0.54. Out of the last parks, three show moderate correlation, but it was not significant (
p > 0.05), which could be related to lack of data on monthly visitor numbers for all the years.
Two of these parks are Sierra de Guadarrama and Sierra Nevada. Both parks are very close to two large cities (Madrid and Granada, respectively) (see
Table 1), with a high presence of recurring visitors [
33]. It is to be expected that recurring visitors take fewer photographs as their visits increase.
4.2. Temporal Patterns
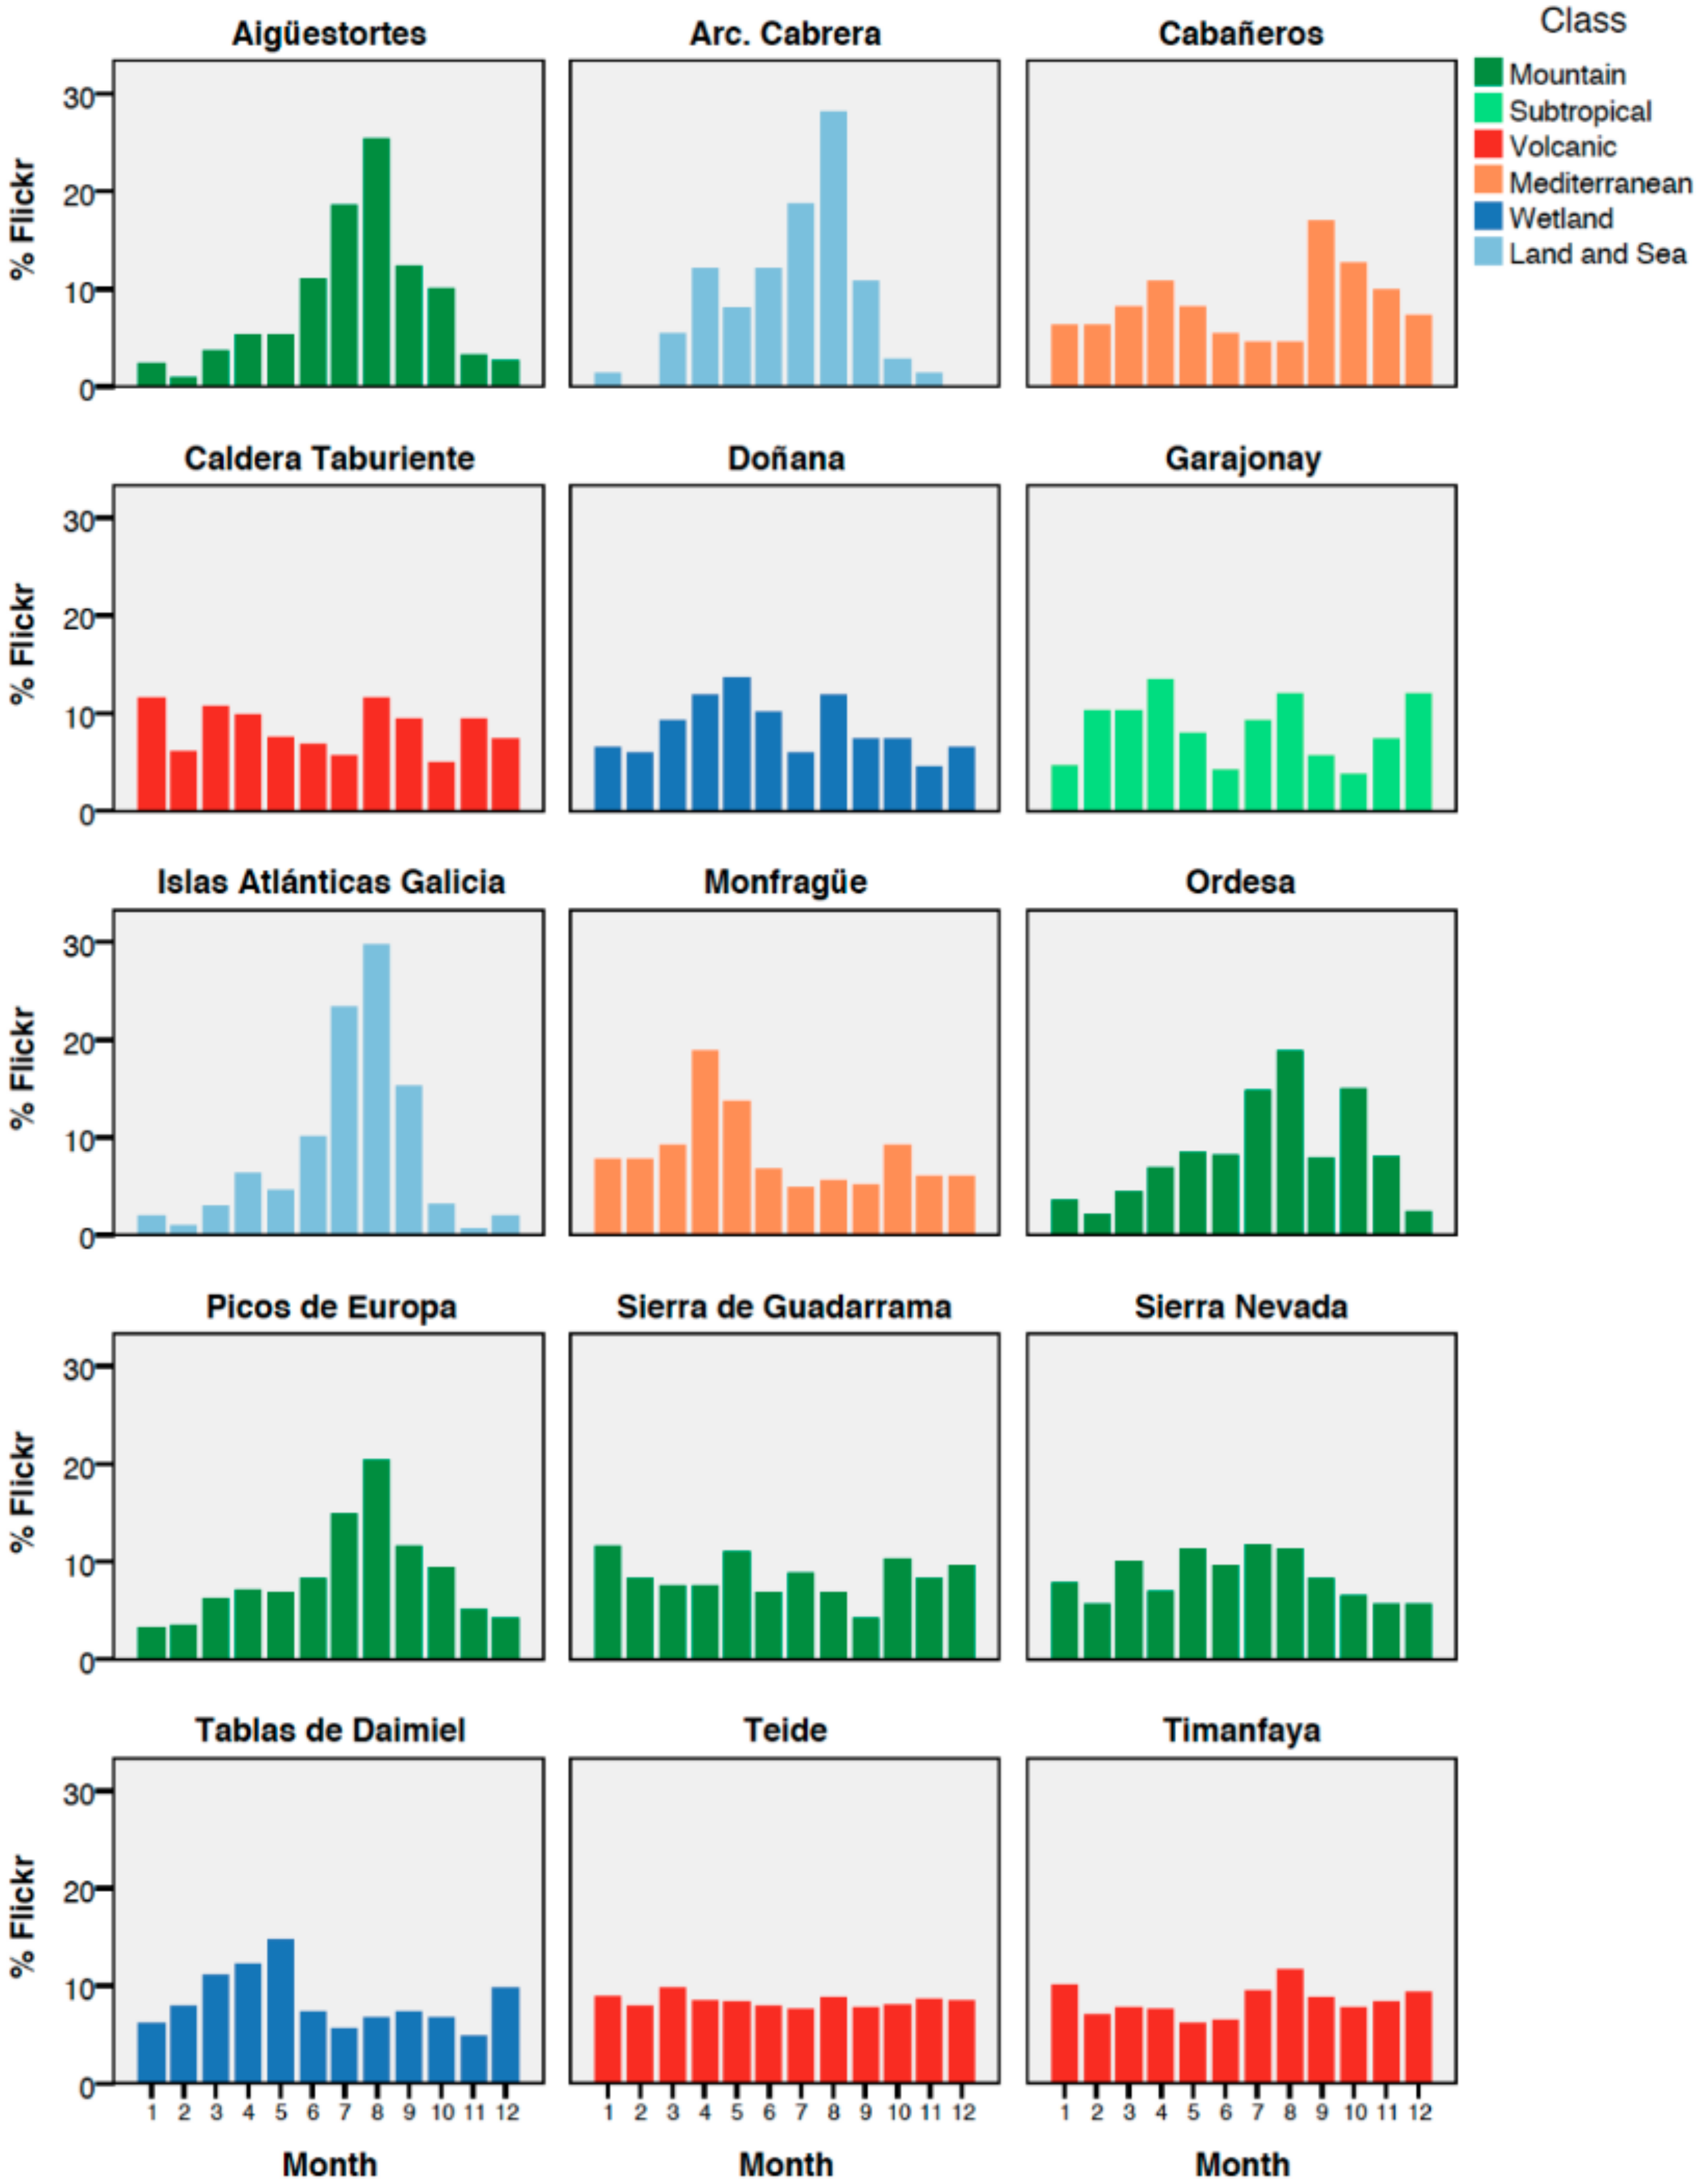
Table 3 and
Figure 3 show the monthly distribution for the 15 Spanish National Parks derived from Flickr users’ estimates. Monthly visitation varies significantly across the parks. However, visitation tends to be highest during the summer months (July and August) for most of them. Visitation peaks often coincide with holidays and vacations for the Spanish population, such as Easter holidays and summer school vacations.
Visual inspection of the monthly distributions of the parks (
Figure 3) highlights clear differences between parks. For example, most parks (9) show some degree of seasonality, therefore peaks of visitation in one month are easily detected. The summer seasonal peak pattern is much more pronounced in four parks: Islas Atlánticas, Archipielágo de Cabrera, Aigüestortes, and Picos de Europa, whereas other parks (6) show a more regular pattern of visitation throughout the year. The parks located in the Canary Islands are an example. An analysis of the seasonality ratio confirms these differences, with maximum value for these four parks (seasonality ratio by month (SRm) higher than 3 in Islas Atlánticas, Archipielágo de Cabrera, and Aigüestortes). On the opposite end, there is a minimum value of 1.2 for the Teide National Park, and the rest of the Canary Island parks have values lower than 1.5 (
Table 3).
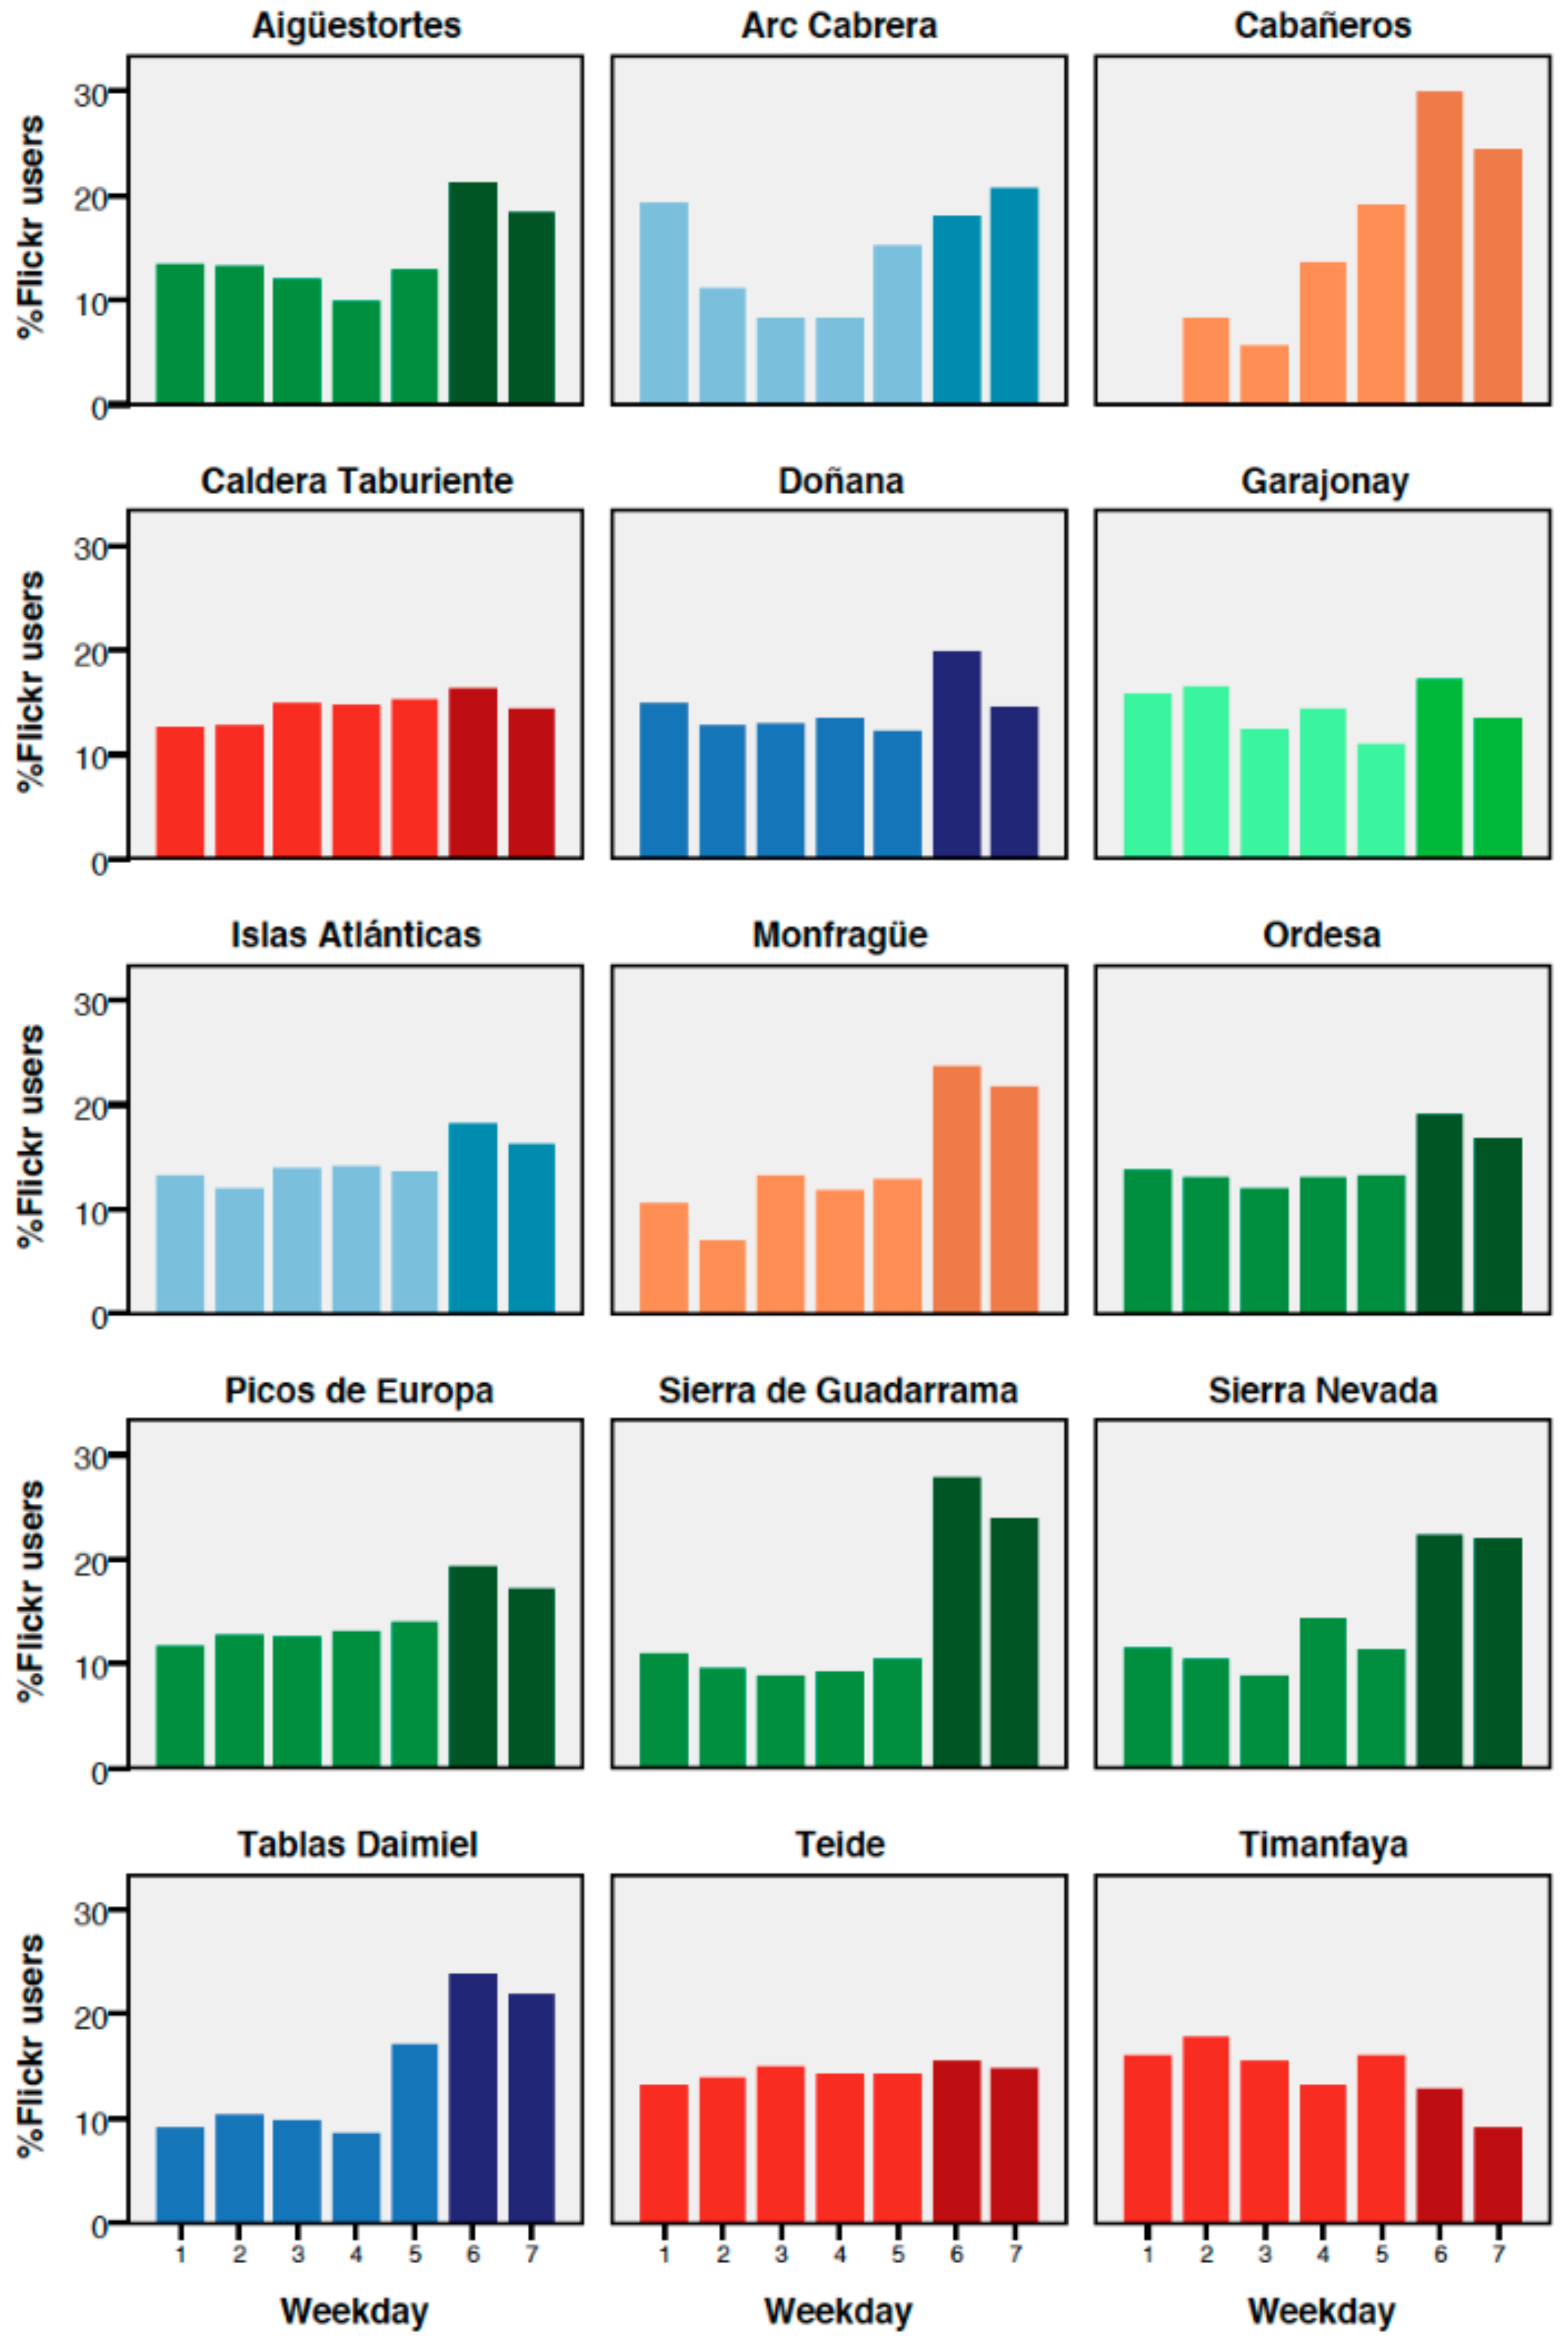
Figure 4 shows the visitor distribution by day of the week for the 15 Spanish National Parks derived from Flickr users from 2010 to 2016.
Table 3 shows the results from the seasonality ratio by week (SRw). The results reveal that visitors are concentrated mostly during weekends for the majority of parks. Among the 15 parks, four parks are visited mostly on weekends, gathering 50% or more of total visitors on weekends. Seven parks gathered between 35% and 40% of the visitors on weekends. These parks, whose SRw values are the highest (above 1.5) are parks whose main visitor demand comes from residents of neighboring cities. On the contrary, the parks in the Canary Islands have a fairly constant influx of visitors every day of the week, which could be related to the touristic vocation of the islands and the importance of long-duration foreign tourism (see
Table 2).
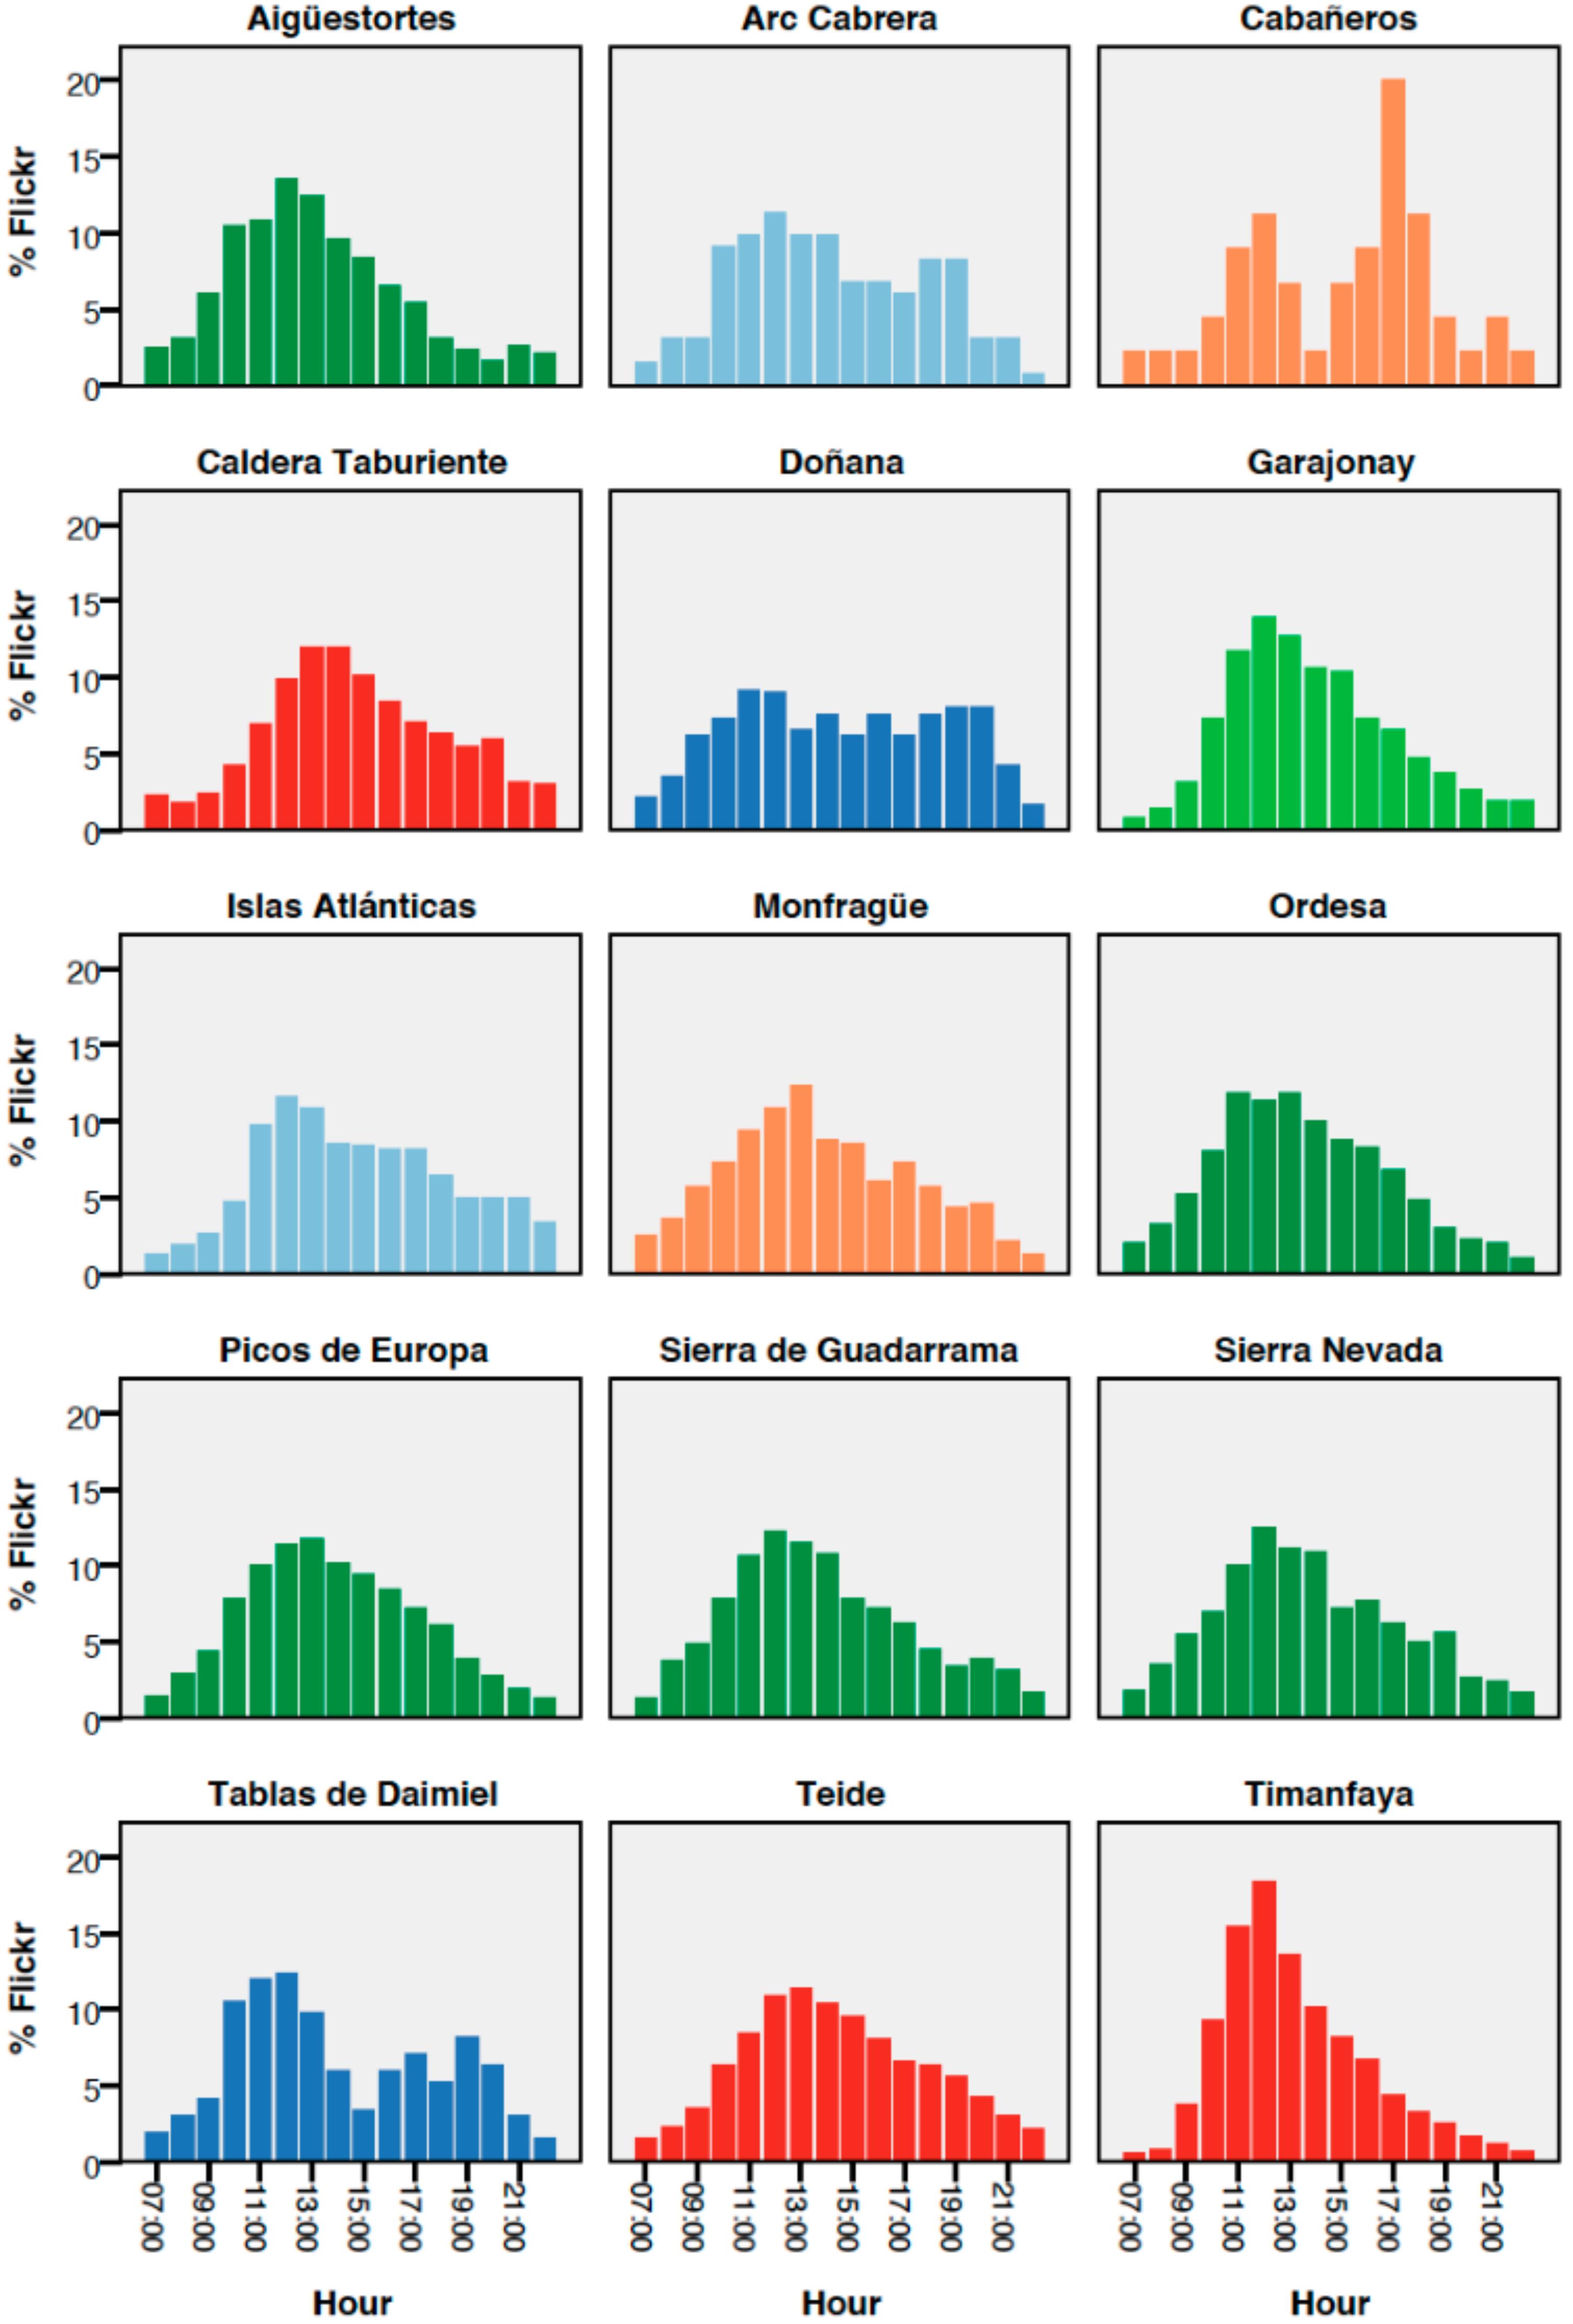
Figure 5 shows visitor distribution throughout the day (in slots of one-hour intervals, from 7:00 a.m. to 10:00 p.m.) at the 15 National parks. The affluence throughout the day in all the parks bears some common guidelines; for example, the hours with the highest visitor influx in most of the parks are around noon, between 11:00 a.m. to 1:00 p.m., with 12:00 p.m. being the highest attendance time for 10 of the 15 parks.
The first photographs in all Parks are normally taken between 10:00 a.m. and 11:00 a.m., when most visits begin. Seven parks concentrated more than 45% of the visits in a three-hour time slot alone. The Timanfaya national park shows the highest proportion of visitors (18%), while the Doñana national park shows the lowest percentage, with 9% at the peak hour. Thus, there is a higher number of photographs from the morning than the afternoon, although these data could also be due to the “return effect”, when users take fewer photographs when retracing their route through the park to return. During night hours, visitor presence decreases to less than 3% in all the parks.
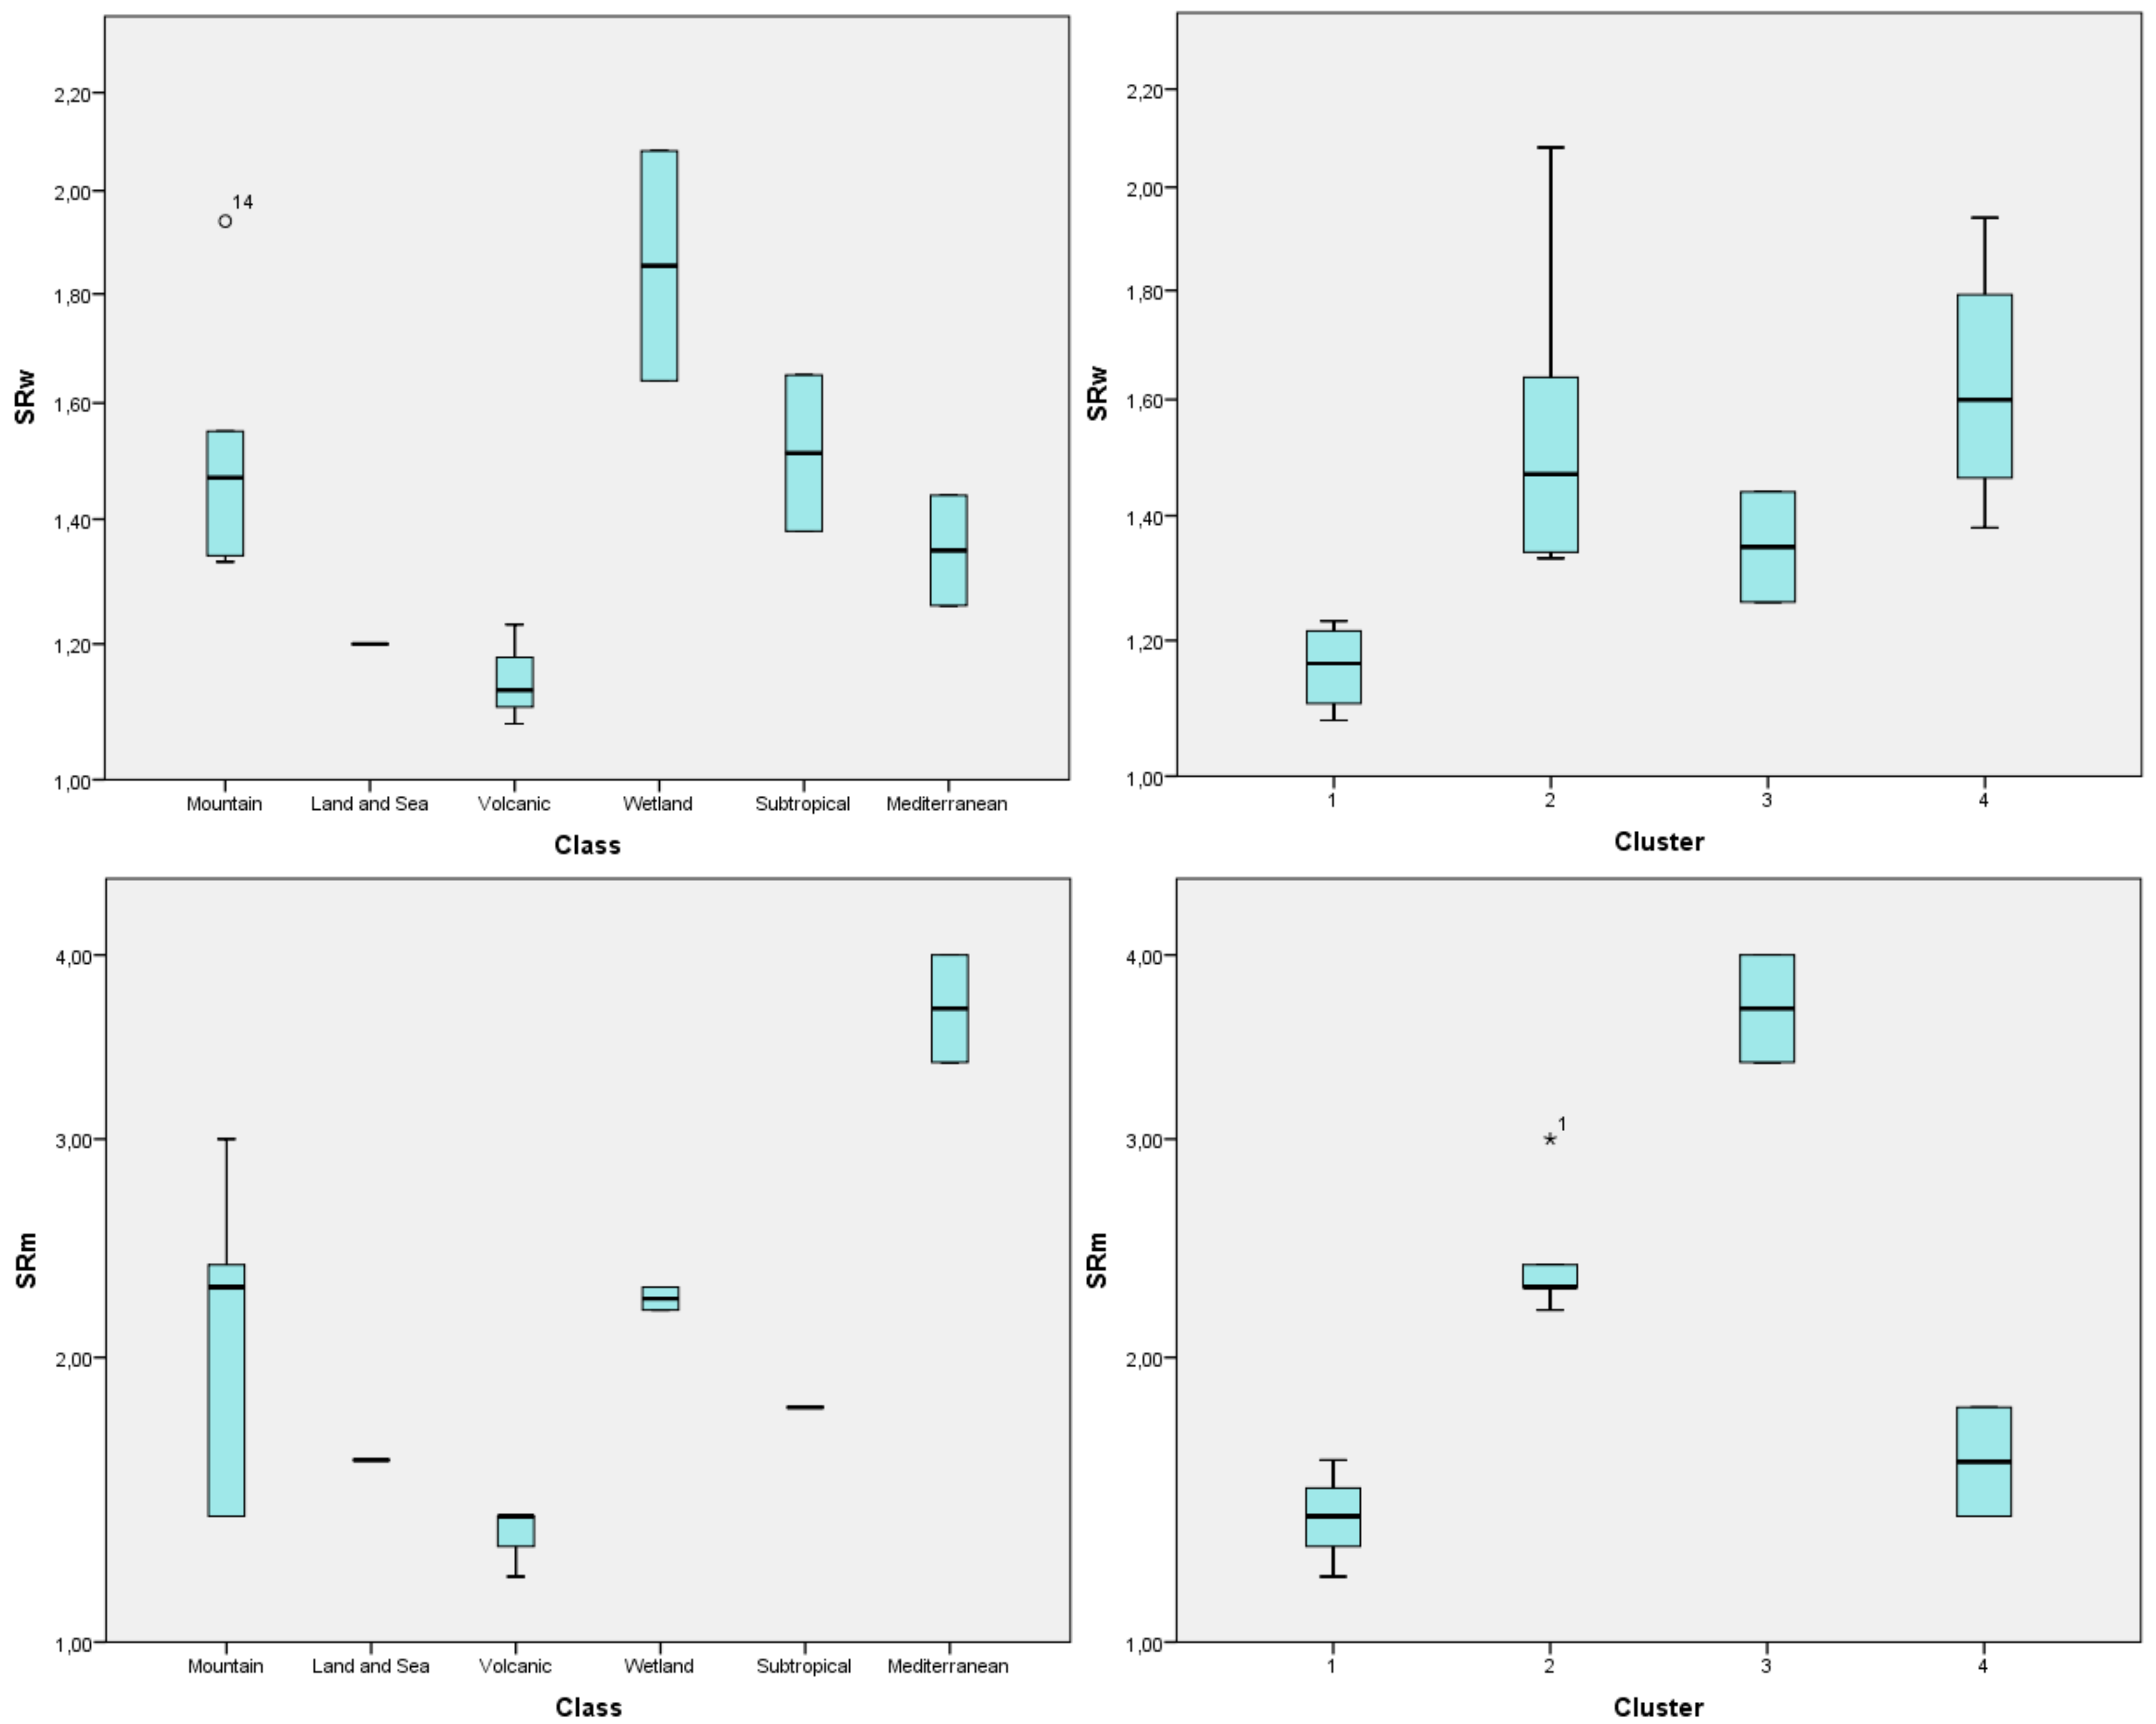
4.3. Typology of Parks Based on the Temporality of Their Visits
A set of four cluster types were identified from the cluster analysis (
Table 4 and
Figure 6), based on values from seasonality ratio by month (SRm) and by week (SRw) indicators, including one variable to differentiate between park types based on the type of visitors they receive (the percentage of photographs taken by international users). One-way ANOVA post-hoc comparison between clusters shows that the differences of clusters are statistically significant for all the variables (
Table 5).
Cluster 1 has the lowest values for the seasonality ratio. This cluster consists of parks with a more homogeneous distribution of visitors throughout the year and weeks. Though there is a peak month for visitors, the variation of visitors moves between 5% and 10%, approximately. These parks are characterized by a regular visitor flow during the year, largely international visitors. Such is the case for the parks located in the Canary Islands, which receive a significant influx of international tourism throughout the year.
Cluster 2 shows a high seasonality ratio by month and by week. In this cluster, an average of 20% total visitors occurs in only one month, mostly in August. During the winter season, visitors in Cluster 2 fall to values below 10%, due to the harsh climate. The parks that form the cluster are the mountain and the Mediterranean parks on the Peninsula.
Cluster 3 has slightly lower visitor concentration values throughout the week, but the highest seasonality all year round and international visitor values slightly increase. Two parks form this cluster, and seasonality is concentrated during the summer season. For example, the Islas Atlánticas and Archipiélago de Cabrera parks have their peak season in August.
Cluster 4 shows the highest seasonality ratio by week and a low seasonality by month. The wetland and near-city parks form this cluster, and their seasonality is distributed in different months. For example, Doñana and Tablas de Daimiel have their peak season in the spring months, while the Sierra Nevada has its peak season in July. Most of the visitors are national and highly related to weekend visitors from nearby urban areas (for example, Sierra Nevada and Sierra de Guadarrama have regular visitation throughout the year, which could be due to their proximity to cities like Granada and Madrid, respectively).
This typology is closely related to the classification based on landscape characteristics established by Somoza Medina (2009). As shown in
Figure 7, the volcanic parks on the Canary Islands have the most homogeneous visitor distributions.
5. Discussion and Conclusions
This study found strong and significant correlations between geotagged data from Flickr and official visitor data at a monthly level, thus validating the potential to use social media data to infer and describe time patterns for visitors and as a proxy indicator of visitation rates. Moreover, weekly and daily distributions provided interesting insights that could help managers to more precisely identify saturation periods at a higher resolution. Weekly and daily data are helpful for scheduling and transportation tasks and to determine carrying capacity and overcrowding issues. These results are well aligned with previous studies [
12,
20,
21,
34] that used similar approaches to test social media validity. All the studies showed a strong relation between geotagged data and visitor statistics.
However, there was variation in the strength of the correlations among parks that could be attributed to: (1) Lack of visitor data for some parks, such as the Cabañeros and the Sierra Nevada parks, which produced moderate, but statistically insignificant, correlation at 0.05
p-value; (2) Different methods used for counting visitors, as is the case for the Guadarrama National Park, which has changed its counting method two times since its establishment in 2013 [
33]; (3) A lower number of photographs from recurring visitors, which reduces correlations in parks near large metropolitan areas with a high number of domestic and weekend visitors.
Many authors have postulated that natural conditions are determinants for visitation patterns in protected areas [
35,
36]. In our study area, the geographical location seems to be an important factor for high seasonality. Mountain parks, such as Aigüestortes and Picos de Europa, generated high seasonality ratios. This also occurred with parks near the coast (Archipiélago de Cabrera and Islas Atlánticas de Galicia), which are attractive for beach tourism. In parks with medium seasonality values, the park’s natural environment could be the factor for seasonal peaks outside the summer season. For example, in the Doñana national park, the highest visitation rate is in May. This coincides with the breeding season for many bird species, which means visitors have more chances for bird watching.
In contrast, low seasonality in some of Spain’s national parks could be produced by external factors. Proximity to large population centers could increase the number of visitors in each month; for example, the Sierra Nevada and Sierra de Guadarrama parks, which are very close to large cities like Granada and Madrid, respectively. Furthermore, parks located in tourist destinations with high demand could be influenced by the regular tourist flows where tourists choose to visit national parks as an additional activity during their vacation, which is the case in the parks located on the Canary Islands.
Cluster analysis was useful for grouping parks with similar seasonal patterns, thus helping to study underlying factors for visitor seasonality in the Spanish National Parks network. Based on seasonality levels, high, medium, and low, K-mean clustering resulted in four clusters. All clusters grouped parks with different ecosystems, sizes, and numbers of visitors.
The high temporal concentration of visitors on a daily basis in some parks could indicate overcrowding. Mapping these distributions, using the geotagged components, could show and verify where crowding occurs. Thus, the carrying capacity of the national parks could be exceeded. In only three hours, the Timanfaya, Garajonay, Aigüestortes, Ordesa, and Sierra de Guadarrama parks concentrate up to 50% of observed activity on Flickr. While it is previously mentioned that this distribution may be conditioned by the “return effect,” everything seems to indicate a greater visitor presence during the morning. Further research about where visitors are at peak hours could help park managers to design actions for redistributing visitor flows during the day.
Official visitor data provided by park agencies is essential for park management and nature-based tourism research. However, visitation data lack detail in terms of temporal resolution for most protected areas. Obtaining such data through surveys could be very expensive and time-demanding [
20,
37]. Hence, social media can be a potential alternative data source for assessing visitor monitoring and obtaining powerful insights into temporal visitation patterns in protected areas. In our study area, none of the parks had weekly or daily distribution of the visitors, so geotagged data from Flickr users helped to illustrate the temporal behavior of visitors during the day and their influx across the week.
Temporal distributions extracted from geotagged photographs can be useful for park managers who need up-to-date information on visitors. For example, visitor distribution at different scales can be used for management tasks such as team scheduling, hiring additional staff, monitoring points of interest, or planning visiting schedules. Moreover, geotagged data can be mapped, which can be useful to alert park managers about where and when crowding issues occur, thus providing useful information for making decisions to deal with them.
This study explored the potential of geotagged data to measure temporal distributions of visitors in a national network of protected areas. The main advantage of social media data collection for visitor monitoring is the capability to collect a vast amount of data with high temporal and spatial resolution at relatively low costs. The attributes associated with geotagged data reveal several characteristics of visitors to national parks. The photos’ timestamp was valuable for temporal and seasonality analysis in this and other studies [
11,
20]. The findings are useful and show that new data sources could be used as complementary data to obtain up-to-date and more detailed data for national park management. For example, in parks where the budget for visitor monitoring is scarce, geotagged data provide significant findings of when visitors come to the park and how long they stay. For parks where visitor monitoring is carried out, geotagged data provide additional data that, when combined with surveys, could give a more accurate view of the temporal distribution of visitors.
Works such as ours that validate data using the digital footprint of visitors to protected areas, whether the figures come from social networks or other sources (mobile phones), enable data collection with a high temporal and spatial resolution that is not always available, particularly in the case of the spatial distribution of visitors within the parks, and this avoids dependence on traditional sources for research
Nevertheless, geotagged data have some limitations that need to be addressed. First, data from social media are biased by the website’s popularity, the users and demographics. Highly productive users also cause bias in geotagged data that could cause overestimation in the analysis. We address this bias by counting users instead of photographs. Additionally, in less popular parks there are less geotagged data, so the significance of the analysis in such parks can be reduced. Furthermore, more studies are needed to explore the full potential of geotagged data, for example, deducing visitor intra-movements, measuring usage intensity, the popularity of parks, and others. Further additional research is necessary to address geotagged data limitations and bias.


