Article

A Case Study of Industrial Symbiosis in the Humber Region Using the EPOS Methodology

by
Hélène Cervo
1,2,3,*,†,
Stéphane Ogé
4,5,6,*,†,
Amtul Samie Maqbool
2,
Francisco Mendez Alva
2,
Lindsay Lessard
7,
Alexandre Bredimas
6,
Jean-Henry Ferrasse
1 and
Greet Van Eetvelde
2,3,*
1
Aix Marseille Univ, CNRS, Centrale Marseille, M2P2, 13451 Marseille, France
2
Electrical Energy Laboratory (EELAB), Department of Electromechanical, Systems and Metal Engineering, Ghent University, Tech Lane Ghent Science Park—Campus A, Technologiepark-Zwijnaarde 131, B-9052 Gent, Belgium
3
INEOS Technologies France, 13117 Lavéra, France
4
EVS-CRGA UMR 5600, University of Lyon 3, 69362 Lyon CEDEX 7, France
5
ITECH, 69134 Ecully CEDEX, France
6
Strane Innovation, 91190 Gif sur Yvette, France
7
Quantis, EPFL Science Park (PSE-D), CH-1015 Lausanne, Switzerland
*
Authors to whom correspondence should be addressed.
These authors contributed equally to this work and are cited in alphabetical order.
Sustainability 2019, 11(24), 6940; https://doi.org/10.3390/su11246940
Submission received: 19 September 2019 / Revised: 20 November 2019 / Accepted: 3 December 2019 / Published: 5 December 2019
(This article belongs to the Special Issue The Circular Economy as a Promoter of Sustainability)

Abstract

:
For the last 20 years, the field of industrial symbiosis (IS) has raised interest among academics and industries. IS consists of dissimilar entities sharing and valorising underutilised resources such as materials, energy, information, services, or technologies in the view of increasing the industrial system’s circularity. Despite the benefits brought by IS, though, barriers hindering the full dissemination of IS remain. This paper presents a methodology developed in the framework of the H2020 European project EPOS that aims at removing some of the obstacles to the implementation of IS. The method follows a multidisciplinary approach that intents to trigger the interest of industry decision-makers and initiate efforts to optimise the use of energy and material resources through symbiosis. It is applied to an industrial cluster located in the Humber region of UK. The case study shows how the approach helped to identify several IS opportunities, how one particular high-potential symbiosis was further assessed, and how it led to the creation of a business case. It was estimated that the identified symbiosis could bring substantial economic (+2000 k€ pa), environmental (−4000 t of CO2 eq. pa) and social (+7 years of healthy life) gains to the region.

1. Introduction

1.1. European and British Context

In December 2015, at the Paris climate conference (COP21), 195 countries adopted a global climate deal that defines a clear set of actions to limit global temperature rise below 1.5 °C [1]. This target represents an opportunity to transform society and prepare for a more sustainable future. However, it also implies a fundamental shift towards a low-carbon and resource-efficient economy and poses a new set of challenges. Economic growth is not easily compatible with the fight against climate change [2]. Thus, change of mind-set, new business models, and technologies have to be developed to ensure a smooth transition towards a more stable and healthier human society. In this context, the circular economy model offers the possibility to combine both the opportunity of reducing the pressure on the environment while enhancing competitiveness, growth, innovation, and job creation [3]. This economic model aims to move away from the traditional linear economic model, based on the ‘take-make-consume-throw away’ pattern [4]. It implies extending the life cycle of products by sharing, leasing, reusing, repairing, refurbishing, and recycling existing materials [5].
Today, the circular economy concept is being widely promoted by politics. The European Union (EU) adopted the Circular Economy Package on 2 December 2015 [6], establishing a set of 54 measures and four legislative proposals on waste, and contributing to ‘closing the loop’ through greater recycling and reuse of co-products. In the UK, the first impulse to shift towards a more circular economy was given by the Ellen MacArthur Foundation reports [3,7,8]. They indicate that a circular economy could decrease the EU emissions by 450 million tonnes by 2030 compared to 2015 levels, lower net resource spending in the EU by €600 billion annually, and create 580,000 jobs. More specifically, a more circular economy for the UK could be worth £9–29 billion a year, and create 10,000–175,000 jobs by 2030 depending on the initiatives adopted [9]. The Ellen MacArthur Foundation’s studies were followed by a report from the House of Commons Environmental Audit Committee [10], calling the government to take actions to facilitate the transition to a circular economy. In November 2014, the UK Government responded, encouraging, and endorsing the principle of a circular economy [11] as cited by [12].
Since then, the new Department for Business, Energy and Industrial Strategy (BEIS), created in 2016, provides an opportunity to address resource challenges and integrate circular economy principles into the new UK industrial strategy. In October 2017, BEIS released its Industrial Decarbonisation and Energy Efficiency Roadmap Action Plans for seven key energy-intensive sectors (cement, ceramics, chemicals, food and drink, glass, oil refining, and pulp and paper) [13]. The reports investigate the possibilities and opportunities for enabling these key industrial sectors to decarbonise and become more energy efficient. It builds on the potential identified during the first phase of the industrial roadmaps project [14], and defines sets of actions that support the industry to reduce its emissions over the longer-term while staying competitive. For several key industrial sectors [15,16], the circular economy and the increase in clustering (e.g., industrial symbiosis) are clearly identified as key drivers to maximise resource efficiency and cut-off industrial emissions. Finally, in 2017, the British Standard Institution, with funding support from BEIS, launched the first circular economy standard (BS 8001:2017) [17].
The Humber region, located on the east coast of Northern England, UK, is one of the key areas targeted by the UK Government to achieve national carbon emissions reduction targets by implementing circular strategies [18]. Indeed, it hosts one of the largest and busiest port complexes in the UK [19] and the region is one of England’s most diverse industrial system [20], with one of the highest concentration of food processing, chemical, fuel and power production facilities [21]. It is also a strategic area for the UK’s energy supply, hosting a (petro)chemicals sector worth £6bn per year [22]. As a result, it is responsible for 27% of UK’s total CO2 emissions emanating from industries subject to Integrated Pollution, Prevention, and Control regulations [23] derived from [24]. It is thus a priority to reduce the region’s environmental footprint while preserving industries’ competitiveness and the prosperity of the local society. Moreover, a report from the European Horizon 2020 project EPOS (Enhanced energy and resource Efficiency and Performance in process industry Operations via onsite and cross-sectorial Symbiosis) has shown that the Humber area was a hot spot for the development of industrial symbiosis, because it concentrates a large number of sites from various industrial sectors (see Figure 1). In this case, the industrial density was calculated taking into account the following industrial sectors: cement, petrochemicals, steel and minerals. For more information the reader should refer to [25]. The circular economy, and more specifically industrial symbiosis, are relevant strategies for the sustainable development of the Humber region. The favourable context of the Humber area offers the opportunity to investigate how these circular strategies can be promoted and implemented in the region.

1.2. Theoretical Background

Industrial Symbiosis
The scientific domains of industrial ecology (IE) and industrial symbiosis (IS) are two areas of action that are mobilised towards the purpose of providing innovative answers, methods, and tools to help heavy industries, among others, transitioning to a circular economy and improving their use of resources. To some extent, IE is even considered as the foundation of the circular economy [26,27]. Indeed, similarly to IE, the circular economy considers the industrial system as part of a larger ecosystem where the material and energy flows need to be optimised to limit the extraction of natural resources and reduce the impact on the environment, thus moving towards a more circular system. It should also be noted that, today, the enthusiasm towards the circular economy makes the policy relevance of IE very high [28].
IS is a subfield of IE that focuses on the study of industrial networks in which resources are shared and valorised. By extension, it also describes the synergies and exchanges created in such industrial clusters [29]. The first and most cited definition of IS [30] was given by Chertow [31], who states that it ‘engages traditionally separate industries in a collective approach to competitive advantage involving physical exchange of materials, energy, water, and/or by-products’, and defines geographic proximity as one of the ‘keys to industrial symbiosis’. Several IS practitioners contradicted this last point [30,32,33,34,35,36], invoking the fact that IS can exist between actors quite distant from each other. Therefore, an updated definition was proposed claiming that geographic proximity is ‘neither necessary nor sufficient’ to IS and extending the perimeter of IS to non-physical flows such as information, knowledge, technologies, and services [30].
As observed by Desrochers [37] and Van Eetvelde [34], IS is not a foreign concept for industries. For decades, companies and industries have worked together, joining forces to operate more effectively and reduce production costs. Chemical parks provide genuine examples of such industrial eco-systems, where companies located next to each other and operating different processes are sharing their facilities, utility networks, (co-)products as well as their services such as maintenance and logistics [38]. There are numerous examples of IS networks demonstrating that the concept allows improvements by which resources are utilised, offering thus economic, environmental, and social benefits [39]. The most famous example of such networks is the Kalundborg eco-industrial park [29,34,40,41].
Barriers to Industrial Symbiosis
Despite the proven benefits brought by IS, today, only 0.1% of the 26 million EU enterprises are known to be active in this field [42]. This phenomenon can partly be explained by the fact that, during the past two decades, companies had access to relatively cheap and abundant resources [43]. However, given the rising societal and institutional pressure on industries to reduce their environmental impact, as well as the possible exhaustion of some resources, there is an urgent need for solutions that could help to remove the remaining hindrances to IS dissemination. The barriers to IS are numerous and have been listed by many in IS literature [33,34,42,44,45,46,47]. Golev et al. grouped the barriers to IS in seven categories [44]:
  • Lack of commitment to sustainable development. It reflects the absence of commitment of managers to develop and participate in symbiosis projects. Several reasons can explain this situation such as the lack of sustainability monitoring systems and targets within the organisation [46], the focus that is only put on maximising the company’s profit rather than the system’s one, the negative connotation about waste, the resistance to organisational changes [48], and the relative lack of knowledge about the value of IS [49].
  • Lack of information sharing [44]. Given the confidentiality restrains of industry, sharing data usually implies non-disclosure agreements and intellectual property rights granting protection to a company’s background assets. These constraints hinder the exploration of new connections [47] and limit the discovery of new potential exchanges between companies [50].
  • Lack of cooperation and trust is also reported as one major obstacles to the development of IS [44,46]. This barrier relates to the possible fear for any company to depend on another partner [46], especially on the longer term, and it can hamper the discovery of new symbiosis and the development of the whole network. Furthermore, cooperation usually means more constrains for companies because of the lack of flexibility, the emergence of new contractual clauses, the complexification of the current internal processes, the development of new systemic risks that are difficult to manage internally, and the difficulties of sharing the benefits of the IS [51]. An IS facilitator can significantly help improving the trust and cooperation between the partners [44,52].
  • Technical infeasibility. The technical feasibility of the symbiosis is a prerequisite to proceed with any symbiosis [44]. The implementation of some symbiosis sometimes requires times and efforts to develop new technologies such as specific treatment and separation processes. The lack of technical knowledge within the industry often becomes the bottleneck to the development of a new project. In addition, the technical feasibility of an IS highly depends on the quantity, the quality and the availability of the exchanged resource [53] and such requirements are sometimes difficult to meet.
  • Uncertainty in environmental legislation [44]. This is particularly true when assessing the feasibility of a symbiosis. Companies are often reluctant to pursue IS projects because of the inconsistency, the inflexibility but also the volatility of the environmental regulation and its enforcement [42]. A good example of this, is the difficulty to obtain the approvals for waste reuse projects [44];
  • The lack of awareness from communities can also stop to the development of IS projects. Sometimes communities are not conscious of the environmental and social benefits brought by IS and can be reluctant to see an increase in nearby industrial activities [44]. On the other hand, a community with a good knowledge about IS and its potential gains can be a driver for the implementation of an IS project [44].
  • Economic infeasibility: the appropriate market conditions should be met in order to create IS opportunities [42]. In some cases, even if the symbiosis proves to be technically feasible and relevant in terms of environment and social performance, it cannot proceed because additional transaction costs are too high [54,55] and economic gains are too insignificant for the project to meet the cost-benefit requirements (low return on investment, high payback time).

1.3. Focus of this Paper

Methodologies and tools were developed in the course of the H2020 EPOS project [56,57,58] in order to provide solutions to some of the barriers mentioned above. The methods focus on the preliminary assessment of the local conditions and stakeholders’ needs, the engagement of the relevant stakeholders, the identification of IS opportunities and their assessment to determine their feasibility and thus to facilitate their implementation [59]. The EPOS methodology presented in this paper is applied to the EPOS Hull cluster (see Figure 1) where it enabled the identification of one IS opportunity with a high potential.
This paper documents this IS case. First, Section 2 describes the case study selection process, as well as the EPOS methodology. Then, Section 3 details the IS case and shows how the EPOS multidisciplinary approach, that looks at both soft and engineering aspects of IS, can be applied. In this case, the methodology highly contributes to uncover the potential behind a specific IS opportunity for all the stakeholders and triggers the implementation of a symbiosis in the EPOS Hull cluster. Finally, Section 4 discusses how the proposed methodology helps removing some of the barriers to IS, how it differs from some existing methods, and how it completes them. Finally, some of the limitations of the proposed methodology are reviewed and research perspectives are provided.

2. Methodology

2.1. The EPOS Context and Case Study Selection Process

The EPOS project is an EU H2020 project [60]. It brings together five global process industries, each one representing a key industrial sector: steel, cement, chemicals, minerals, and engineering. They are supported by five SMEs and two universities [60]. EPOS’ main objective is to enable cross-sectoral IS by providing solutions to overcome some IS implementation barriers and especially: the lack of commitment to sustainable development, the lack of information sharing, the lack of cooperation and trust, the lack of awareness from communities and the economic infeasibility.
The project is organised around five clusters, each one grouping several partners of the project (see Figure 1), and where all the methodologies developed in the course of the project can be tested. An EPOS industrial cluster is defined as two or more industrial sites that cooperate with each other in order to efficiently share streams and activities (energy, resources, waste, materials, water, services, technology solutions, etc.), with the aim of enhancing economic gains, environmental quality and social responsibility for the business as well as the local community.
This paper details the research carried out within the Hull cluster (located in the Humber region, UK). It has been selected due to its high IS potential and to the readiness of EPOS industrial partners to investigate IS opportunities. Owing to long history of IS in the Humber region, actors are particularly open-minded and attentive to such projects. In 2000, it was in that same area that the first UK IS programme was launched: the Humber Industrial Symbiosis Programme (HISP) [39,61]. It was initiated by a major oil and gas company operating in the region [62]. This initiative inspired the implementation of similar programmes in other regions of the UK (National Industrial Symbiosis Programme (NISP) [63]) and the completion of smaller initiatives in the Humber region [64].
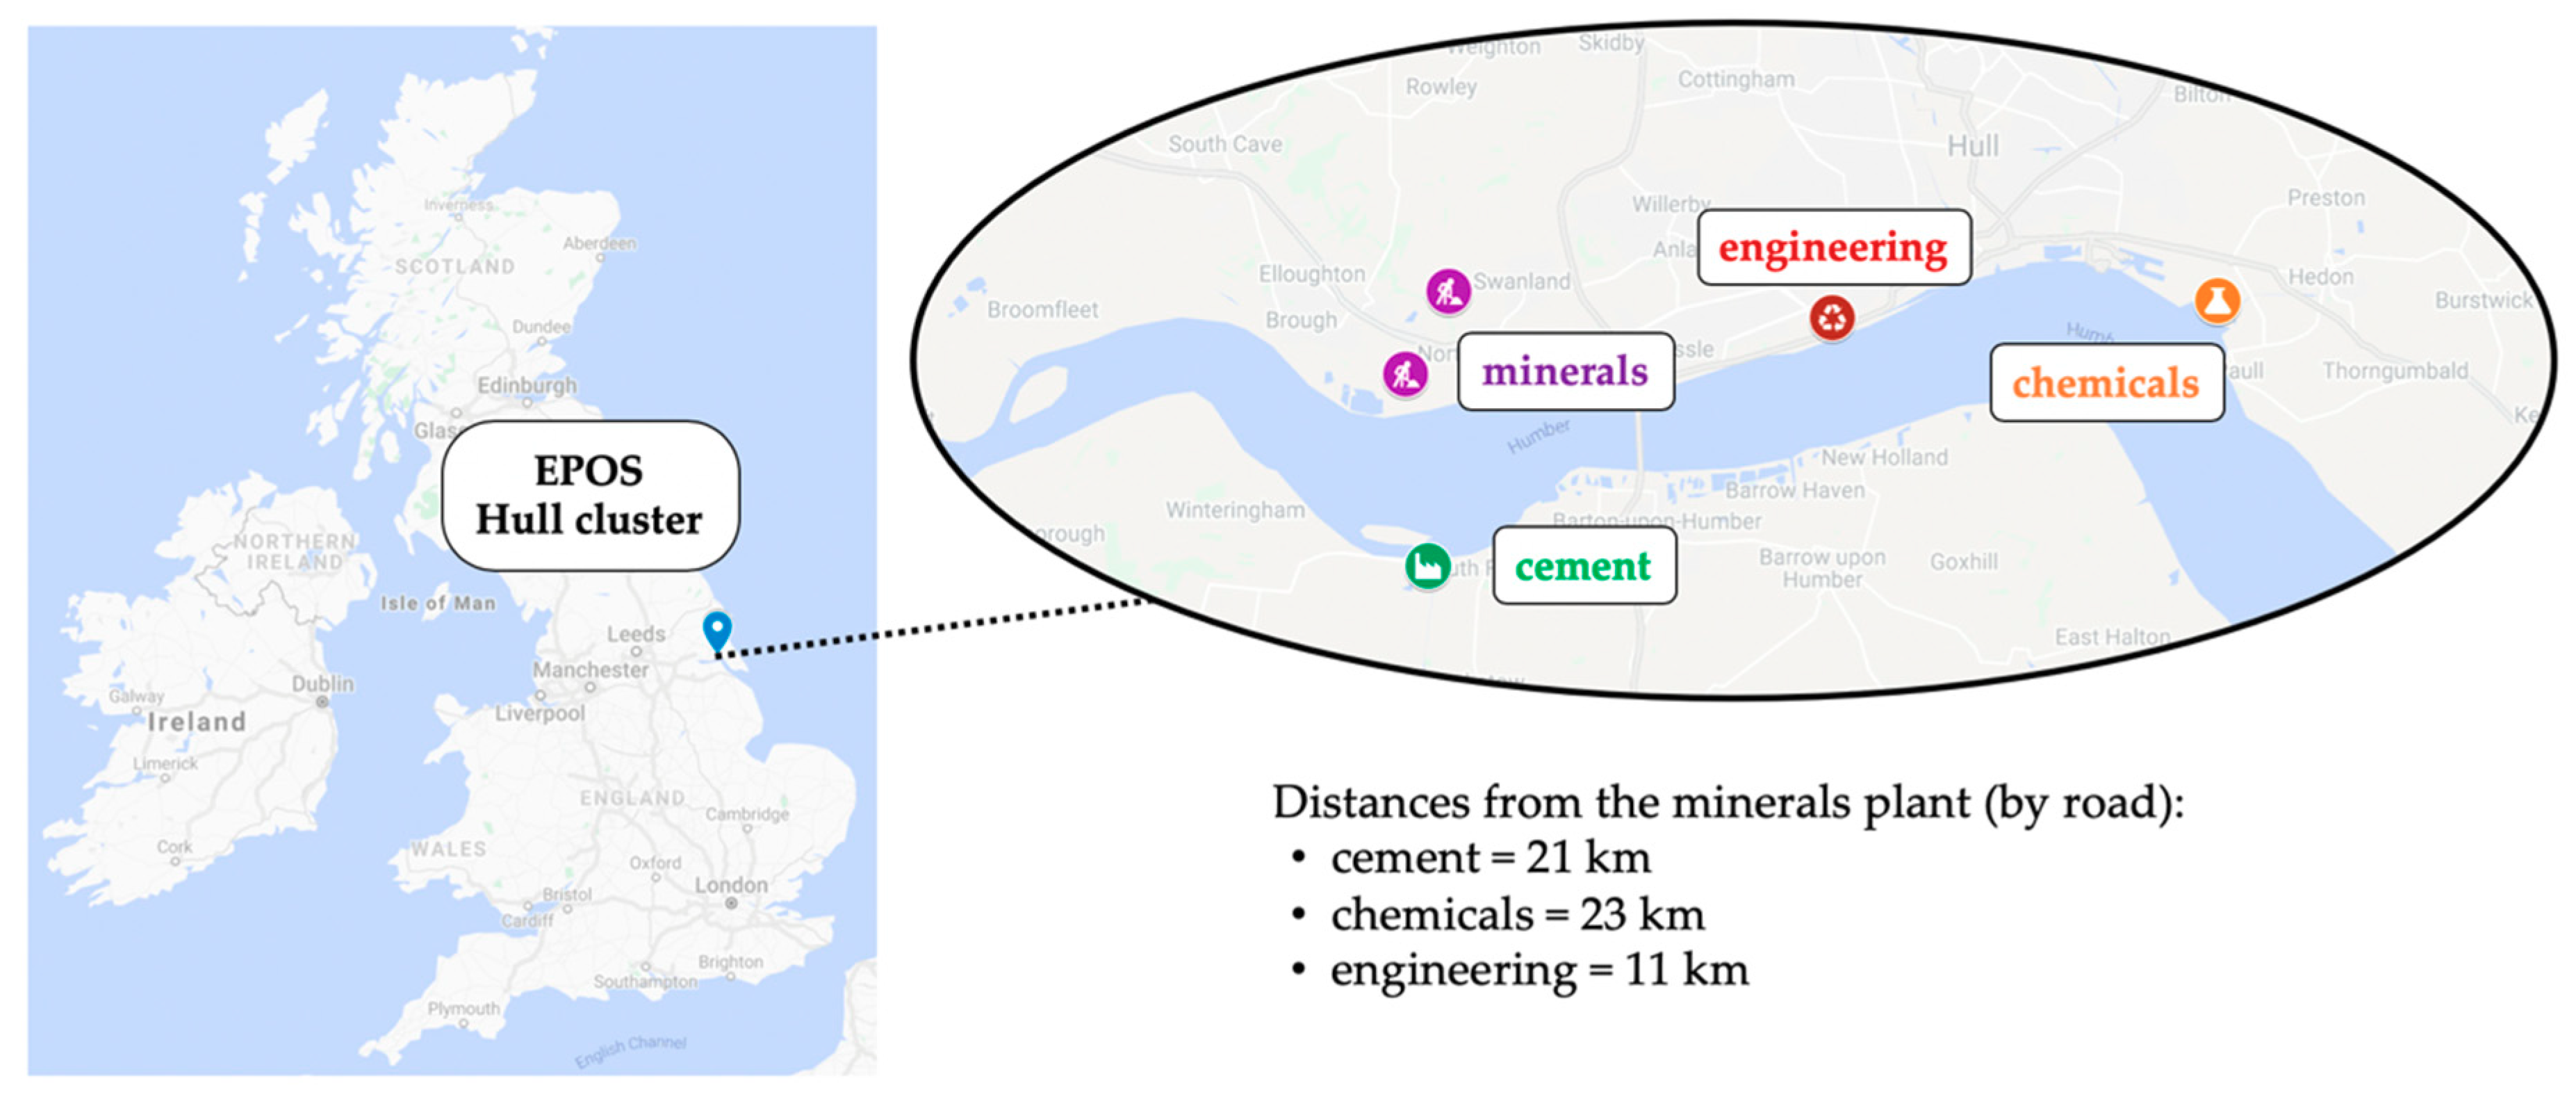
Five main actors are identified in the EPOS Hull cluster: four companies from different industrial sectors (cement, chemicals, minerals, and engineering) and Hull’s local community. Figure 2 highlights the cluster’s current configuration and the distances between the industries. The reasonable distances between the partners as well as the variety of industrial sectors explain the high IS potential of the cluster and the reason it has been selected.

2.2. The EPOS Methodology

The creation of a symbiosis is a multi-step process that goes from the identification of an opportunity to its implementation and operation [65]. Yeo et al. [59] describe this IS creation process as six steps that are interconnected and retroactive: (1) preliminary assessment, (2) engage business, (3) find synergy opportunities, (4) determine feasibility, (5) implement transactions, and (6) documentation. Steps 3, 4 and 5 appear inherently during any IS creation process, while steps 1, 2 and 6 are more optional and depend on the way the IS develops (self-organised, planned or facilitated).
The EPOS methodology aims at facilitating the first four stages, namely the preliminary assessment, the engagement of stakeholders, the identification of IS opportunities, and the feasibility definition. It even foresees the insertion of an intermediary steps (between steps 3 and 4) that provides a preliminary IS assessment, business model and business cases to trigger the interest of each stakeholder decision-maker and validate the interest of launching a more in-depth feasibility study. The methodology builds on theoretical concepts and existing tools—from different fields. The methodology was systematically tested by the industrial partners of the project, across the five EPOS clusters. The methodology was refined based on the feedback from the companies to make it generic and operable by a variety of actors. These actors include companies or IS facilitators (e.g., cluster managers, consulting companies, academics, local public authorities, associations, etc).
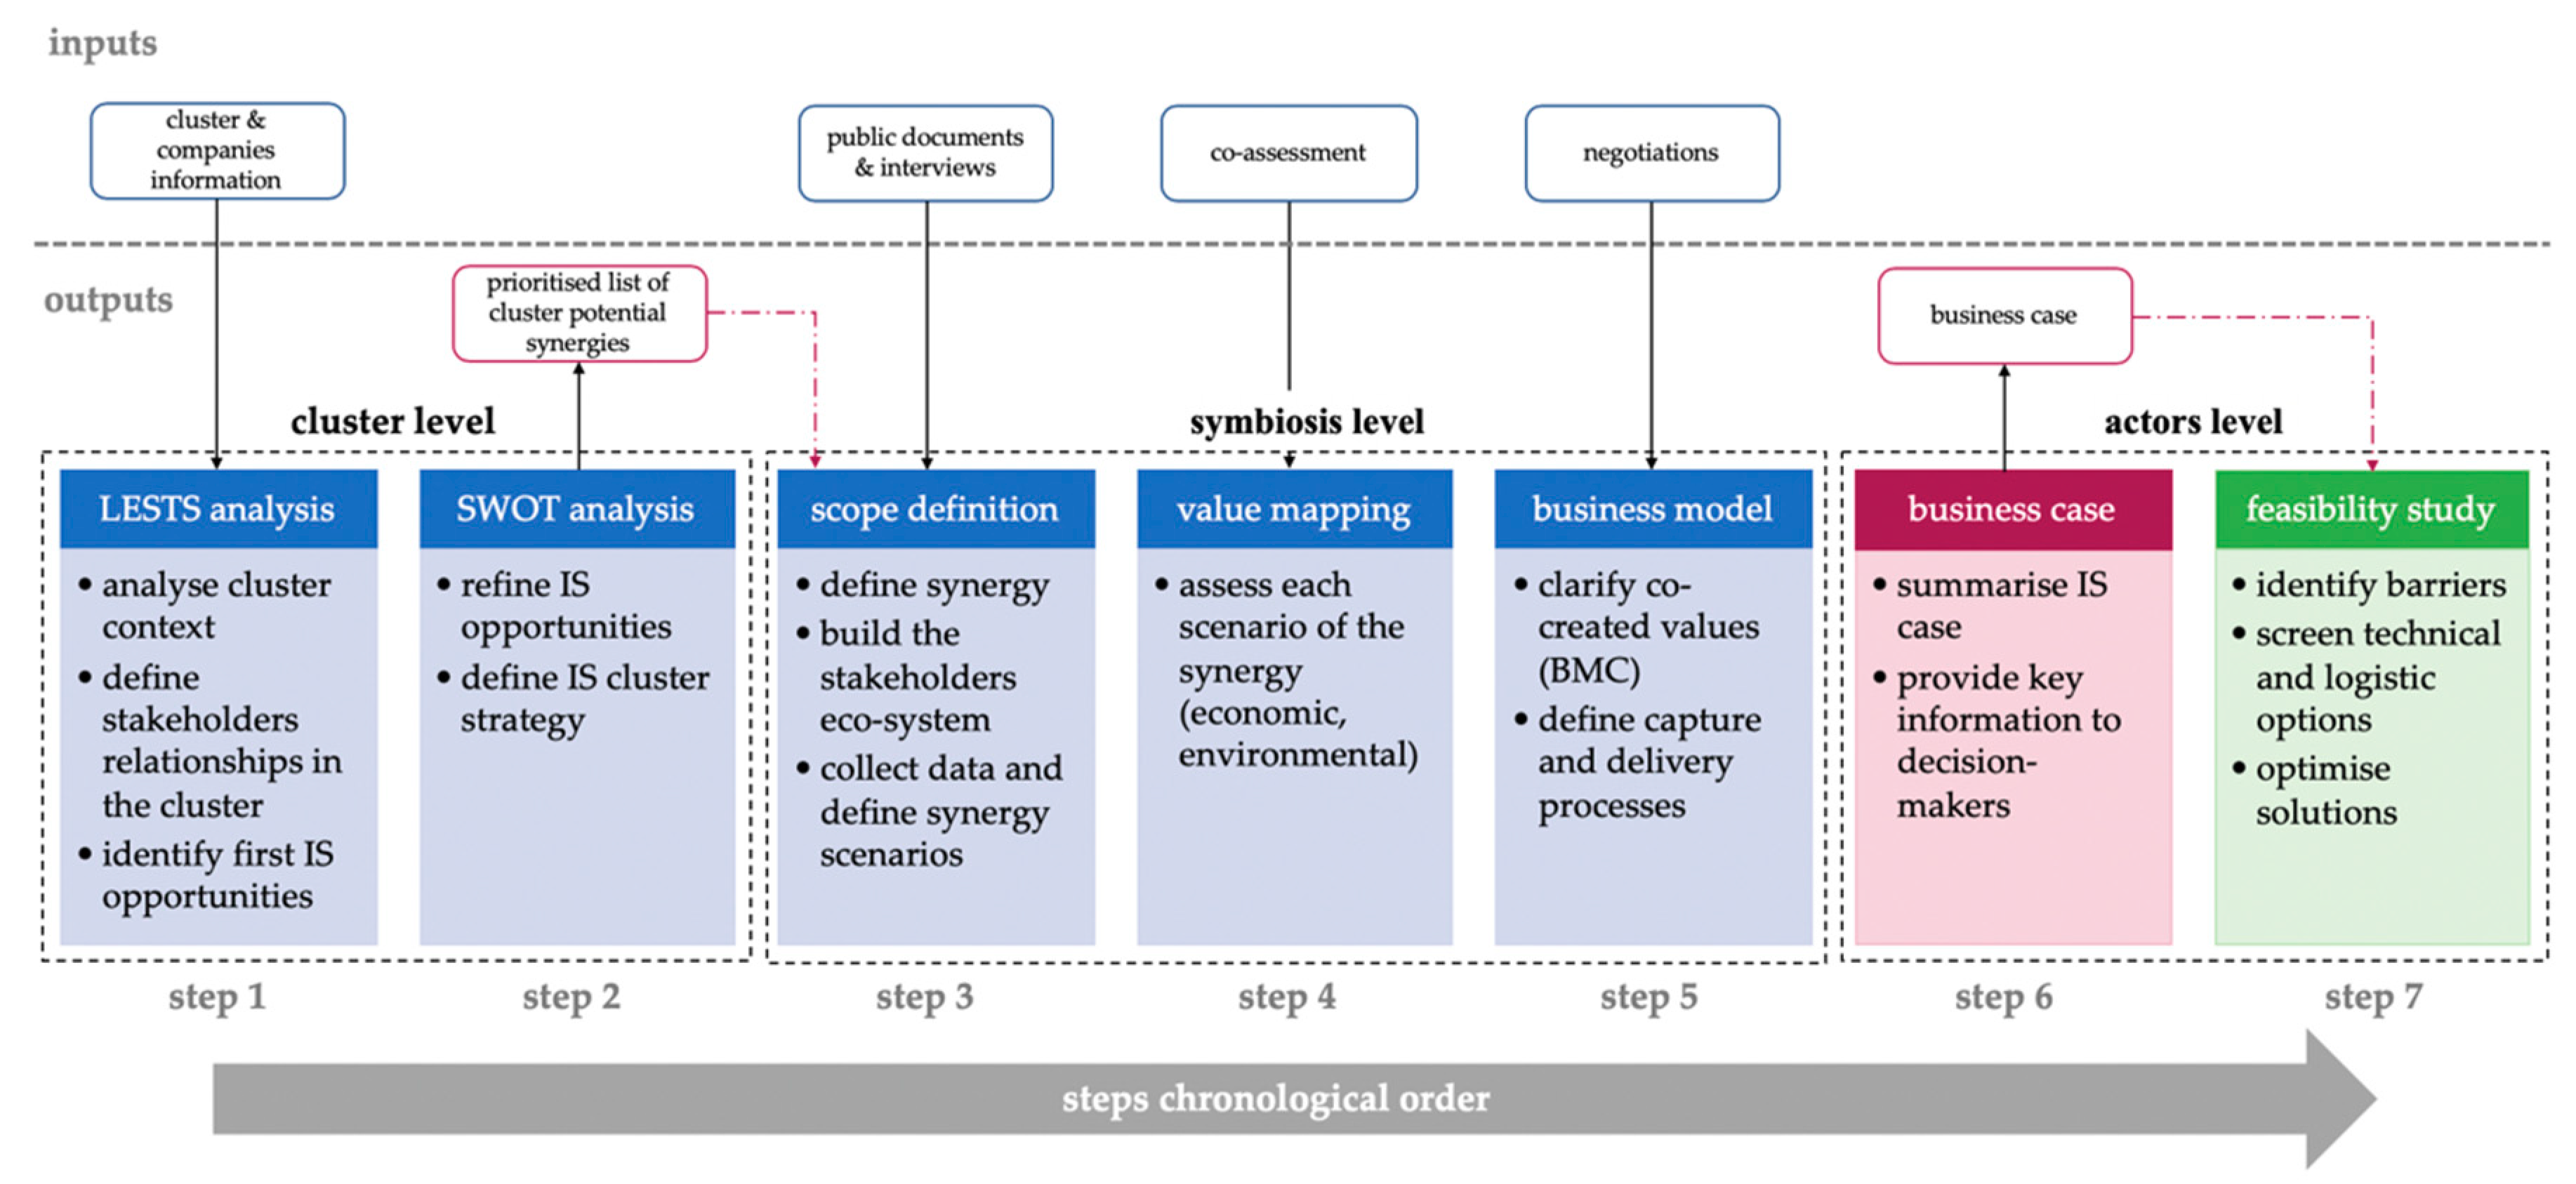
The EPOS methodology adopts a funnel approach in terms of scope and is organised in seven interconnected steps (Figure 3). The first six steps are adapted from [56] while the seventh goes further. At the cluster level, the steps enable the identification of IS opportunities between the existing cluster’s actors and the examination of the background information that might be of importance for the rest of the analysis. At the symbiosis level, the scope is reduced to the analysis of a single symbiosis that emerges from the list of previously identified IS opportunities. A IS business model is created after the symbiosis is assessed while taking into account the whole set of stakeholders. The exchange is assessed while taking into account the whole set of stakeholders. At the actors’ level, the methodology provides decision makers with a specific business case that aims at triggering the interest of the decision-makers. The last step (feasibility study) guides the firms that have decided to proceed with the symbiosis, explores the technical feasibility of the exchange, and can even help to improving the organisational aspects of the symbiosis.
The whole methodology is considered as an IS accelerator enabling a fast identification of relevant IS opportunities and their analysis, and that could contribute to the broader dissemination of the IS concept. The methodology and the required inputs and expected outputs of each individual steps are detailed below. The first six steps are more likely to be carried out by IS facilitators. While, step 7 should be taken over by one of the central stakeholders of IS that finds an interest in the IS opportunity.
Step 1—LESTS Analysis
In the EPOS methodology, LESTS (Legal, Economic, Spatial, Technical, and Social) analysis helps to assess the under-utilised resources of an industrial cluster to identify potential IS opportunities. Additionally, it helps understanding the context and the dynamics between the stakeholders. To do so, the initial LESTS approach, adapted from that proposed by Van Eetvelde et al. [33] by Maqbool et al. [66], is applied.
The method enables scanning industrial clusters, identifying relevant actors, and analysing their relationships regarding the five LESTS aspects. Based on these aspects, surveys are prepared and sent to the managers of each main company involved in the cluster. Their answers are gathered, aggregated, and a preliminary list of IS opportunities is drawn. These opportunities aim to enhance the existing level of collaboration between companies that have a wish, need, or duty to collaborate [66]. The final list is then provided to industries that are asked to rank the identified symbioses on a scale of 1 to 5 in order of increasing interest based on two aspects: (1) technical suitability and (2) organisational suitability (see Table A1 in Appendix A). Their answers are aggregated. Based on EPOS experience, if a symbiosis scores above 3, it has a potential for implementation and it is selected for further investigation.
Step 2—SWOT Analysis
During this step, the most relevant pieces of contextual information from step 1 are used and are presented using the well-known Strengths, Weaknesses, Opportunities, Threats (SWOT) framework developed by Hill and Westbrook [67]. The main objective of the SWOT analysis is to provide a qualitative grasp of the implementation potential of the IS opportunities. It also provides some guidelines to draft sustainability goals of the clutser that might direct towards the implementation of further IS [68]. In addition, SWOT analyses of each opportunity can be carried out in order to refine the preliminary list of IS opportunities and prioritise them for furhter assessment.
Step 3—Scope Definition
After step 2, the user of the EPOS methodology should only focus on one of the most promising opportunities. The goals of the step are to: (1) identify the system of stakeholders implied or impacted by the symbiosis and (2) define the scope of the analysis, and especially the business as usual (BaU) and symbiosis scenarios [56]. Scope definition is crucial as it provides a clear understanding of the potential issues associated with the IS implementation and creates a framework for analysis of benefits and impacts. It also identifies the stakeholders that should be further considered during the elaboration of the business model.
First, based on the primary data gathered about the cluster in step 1, the actors involved in the symbiosis are identified and characterised according to their degree of engagement: central (directly involved, e.g., sender/receiver), peripheral (indirectly involved, e.g., carrier, service provider), and external (not involved, but can be positively or negatively impacted by the IS). All these actors, with their own role, make up the set of stakeholders. Some relevant actors might also be identified later while further analysing the IS, especially the ones located outside the cluster boundaries (e.g., treatment plant with a specific process).
Second, further information is collected—using primary and secondary data—to help define the BaU and the different IS scenarios. A technical literature review is performed to understand the industrial processes and more precisely, the risks and parameters that would be impacted by the IS creation and its operation. Typical information sources are BREFs (Best available techniques REFerence documents) [69] and academic literature. Subsequently, feedback is collected from the central stakeholders to ensure the validity of all the collected information and, if necessary, to supplement the collected information with additional technical and organisational data. Then a BaU and multiple IS scenarios are defined. Several IS scenarios are required to account for the remaining implementation uncertainties (e.g., type of transport, treatment, etc.). To ensure the robustness of the scenarios, additional economic, regulatory and technical data are used (e.g., market prices of the materials substituted, treatment technology and service costs, landfill costs, local taxes, engineering quotes, etc.). Some expert knowledge is often required to certify the validity of information at every step. It is thus recommended to have a specialised third party leading this step.
Step 4—Value Mapping
The BaU and symbiosis scenarios are assessed using a multi-dimension framework. By definition, IS creates a sophisticated conglomerate of environmental, economic, social and regional values [70,71,72]. The applied methodology allows a systematic identification and the qualitative and quantitative analysis—whenever possible—of these different values, and more importantly the ones generally not considered in a traditional decision-making process [73]. For some values, this approach adapts the value mapping tool developed by Bocken et al. [74] to IS conditions. It also includes collaborative and endogenous evaluation methods [75] to enable the involvement of all the stakeholders during the IS impact assessment. The outcome of step 4 is an extensive mapping of positive and negative values that the IS might create (or destroy) for the system of stakeholders.
Economic values are estimated using a cost-benefit analysis with data gathered in Step 3. These values are divided into two categories.
  • Value(s) created:
    New revenues are typically created by selling underutilised resources. The value of these revenues depends on how the resources are valorised (as heat, combustible or material), the type of substituted resource and their quality. They can be assessed by comparing resources with their equivalents on the market;
    Costs avoided are related to public bodies (e.g., taxes) or private entities (e.g., end-of-pipe treatment) and must be anticipated during scope definition.
  • Value(s) destroyed:
    New costs depend on the type of the new symbiosis. They can be inherent to its creation (e.g., transport, transaction costs, etc.) or optional (e.g., new equipment or on-site operations). They are pre-identified in scope definition and refined using technology databases [76];
    Value(s) missed are either generated upstream in the value chain of the substituted resource (e.g., supply of raw materials) and downstream in the value chain of the exchanged resource (e.g., waste treatment).
Environmental values are evaluated using a tailored preliminary life cycle thinking (LCT) methodology adapted to the IS context, using SimaPro software [77], the method Impact 2002+, and the ecoinvent database [78] for the life cycle inventory. The assessment is cradle-to-gate, meaning that only the life cycle steps from the resource extraction to the factory gate are taken into account. Distribution, use, and end-of-life stages are excluded from the study as the final products are the same in both the BaU and the IS scenario. Therefore, they do not affect the environmental performance of the symbiosis. The results can be provided according to 15 midpoint indicators, 4 endpoints or aggregated in a single monetary unit indicator (€) using the StepWise 2006 monetisation methodology [79]. The more aggregated the results are, the more intelligible they are for a large public, but in the meantime the underlying assumptions are hidden. The user of the methodology can choose the adequate level of detail for the environmental values, according to its needs.
Social values refer to values emerging from the generated social capital, i.e., an accumulation of resources collectively built through a relational network and involving various actors [80,81]. These values are generated by the new relationships created between and within organisations thanks to the new IS. They depend on the strength and frequency of those new inter- and intra-companies’ relationships. Typical social values include improved people/employee well-being, initiation of innovation strategies, and improved relationships with local communities. The proposed methodology provides 20 indicators (see Supplementary Material), selected from an extensive literature review and categorised under five groups; namely, governance, actors, relationships, motivation, and effort. They are designed to raise awareness on less tangible values that a symbiosis can create and should guide the stakeholders during their own assessment.
Regional values refer to the concept of regional capital (this concept refers to the French concept of ‘territorial capital’), i.e., a system of regional goods and items that characterize a certain region (economic, cultural, social and natural) and enable its development [82,83]. This multidimensional capital determines the regional competitiveness of a region in comparison with others, at a global scale [84,85]. Values are created through regional externalities (e.g., ability to attract innovative actors, healthy environment, infrastructures, etc.) that generally cannot be made private [86]. A set of 32 indicators (see Supplementary Material) is proposed to guide the assessment of such values. Indicators are categorised under seven groups; namely, territorial attractiveness, economy development/preservation, societal impacts, environmental impacts, relation with regional strategies, and innovation and autonomy. Most of these values refer to common or public goods. As public authorities are deemed responsible for their development or preservation, it is assumed that they are the main beneficiaries of the values created and should be included in the value assessment process. Using this set of indicators, the stakeholders, including public authorities, can assess the regional values created by the IS.
The outcome of Step 4 is an extensive mapping of positive and negative values that the IS might create (or destroy) for a wide range of stakeholders, including values which may not be considered in a traditional decision-making process.
Step 5—Business Model
Step 5 is dedicated to setting up the symbiosis business model, using the IS sustainable business model canvas proposed by Ogé et al. [56]. This framework takes Osterwalder and Pigneur’s business model canvas as a conceptual basis [87], integrates sustainable considerations from [74,88] and adapts it to fit IS. It not only integrates economic value proposition but also the related environmental, social and regional aspects. The IS sustainable business model canvas provides means to bring innovative paradigms into existing businesses and support the evolution of traditional business models towards sustainable ones [89]. Concretely, the canvas aims at summarising all the information collected and analysed during the previous steps and defining how and by who the values created should be captured.
Step 6—Business Case
Based on the business model that is developed in the previous analyses, a business case is proposed for each stakeholder. It informs and advises decision-makers by providing all arguments to justify, or reject, the implementation of the IS. The business case is composed of the following information:
  • The IS project context (economic, regulatory, environmental, local, etc.);
  • Pieces of information for the stakeholders and the answer to the question ‘why the organisation needs the IS?’;
  • The comparison between the BaU and the other competing projects (advantages/disadvantages);
  • How the value proposition of the IS propositions satisfies the organisational needs;
  • The evaluation of the impacts on the organisation;
  • The assessment of the financial risks.
Step 7—Feasibility Study
If a real interest in IS implementation is identified, a feasibility study can be initiated by a central stakeholder to identify what are the technical barriers to the symbiosis implementation. Step 7 provides methods and tools to initiate such a study and provides a guide to define the technical and logistic options for the IS.
The feasibility study starts by re-assessing what could be the potential issues and opportunities associated with the IS implementation. This evaluation is done according to the five LESTS aspects. This way, central stakeholders can take a step back and reengage in the study. Then, technical and logistic options are further investigated, for example by carrying industrial trials.
Finally, the concept of sector blueprint, developed in the EPOS project, can be used to investigate further the IS (e.g., look for additional heat integration opportunities). Blueprints are at the heart of the EPOS engineering approach. They are created for three chemical processes (a refinery, a polymerisation reaction and the synthesis of basic organic chemicals), for three other industrial sectors (steel, calcium carbonate production and cement), and one for district heating networks. They are available through the EPOS user club) [90]. The goal of blueprints [57,58] is to facilitate knowledge exchange to foster IS. Industrial sector blueprints comprise typical processes and include information on the material inputs and outputs of the processes as well as their thermal and electrical energy profiles. The blueprints are not intended to be exhaustive or to be an accurate description of the operations of the process units. They are meant to provide an insight into which resources are available and needed in a given process industry.
At the end of this step, the central stakeholders should be provided with a complete overview about the possible configurations that the IS under consideration could adopt.

3. Case Study

This section describes how the EPOS methodology presented in Section 2 is applied to the EPOS Hull cluster. Steps 1 to 6 were performed by members of the EPOS consortium, acting as IS facilitators. The feasibility study (Step 7) is performed by the chemical industry involved in the EPOS Hull cluster and taking part in the IS. For each of the steps, a short description of the studies, the used data, and the main results is given.

3.1. Step 1—LESTS Analysis

The information that was gathered for the LESTS analysis is already provided in Section 1.1 and Section 2.1 of this article. Briefly, this information describes the overall policy and legal context at the EU and local level, as well as the history of IS in the Humber region. The section on EPOS context and case study selection has also detailed who were the key actors that took part in the interview and research processes and describes their spatial distribution (see Figure 2). Based on the analysis of the LESTS survey answered by these actors and the literature review carried out by the IS facilitator, 13 IS opportunities were identified in the Hull cluster. Table 1 summarises these opportunities with their associated score of interest that reflects their technical and organisational suitability. Based on the feedback of the stakeholders three symbiosis scored higher than 2.5:
  • The substitution of a primary fuel in cement kiln by a waste resource (PLF) from the chemical industry;
  • The substitution of the calcium carbonate extracted from the cement producer’s quarry by a chalk already extracted by the mineral producer;
  • The safe storage of cement kiln dust (CKD) in the mineral producer’s old quarries.
According to a preliminary qualitative analysis, these three symbioses appear as the only ones with a real potential for implementation. Other opportunities either required technologies that were not available on site (hence high investment) or have a low return on investment. Therefore, the analysis proceeded with the three previously mentioned IS opportunities.

3.2. Step 2—SWOT Analysis

Individual SWOT analyses were carried for each of the three previously selected IS opportunities to choose the most promising one. It showed that a prohibitive regulatory aspect (threat) prevents the implementation of the IS involving the safe storage of cement kiln dust (CKD) in the old quarries of the mineral producer. Indeed, the CKD contains alkaline compounds that inhibit the mineral producer from storing it in its career, as it is located in a flood-risk area. Therefore, costly infrastructures would be required to safely store the waste. The opportunity to reuse calcium carbonate rich reject stream also presents some weaknesses due to the composition of the chalk. Specific equipment would be required to sort the calcium carbonate reach stream, which would induce an additional investment that is too high compared to the low volume of the stream.
On the other hand, the opportunity involving the Primary Liquid Fuel (PLF) has the highest score (highlighted in blue in Table 1) and proves to have the best implementation potential. This opportunity concerns the possibility for the chemical plant to send one of its liquid waste fuels to the cement producer and use it as alternative fuel. The stream from the chemical process is currently sent to a third party in exchange for steam. However, the PLF negatively affects the efficiency of the third party’s boilers, thus the chemical company has to pay an extra price on the steam it receives. On the other hand, the cement producer has a permit to burn 100% alternative fuel (AF) in its kilns, and currently, due to limited supply, only 80% of the fuels burned are classified as AF. Since the PLF stream respects the primary specifications to be burned inside a cement kiln (e.g., low heating value above 16 MJ/kg, and no contaminants under the form of heavy metals such as lead or mercury), it could replace a portion of the remaining 20% that is now provided by primary fuel.
In parallel, the SWOT analysis of the Hull cluster was carried out by the EPOS IS facilitator using the information gathered in Step 1. Results are provided in Table 2. The SWOT analysis reveals additional contextual criteria that demonstrate the high potential of the PLF opportunity, as it could reduce some of the cluster weaknesses and threats (highlighted in blue in Table 2). Indeed, by reusing the stream as a secondary fuel, the whole cluster will decrease its dependence on non-renewable energy sources and will increase the regional energy autonomy. Furthermore, both the chemical plant and the cement producer could reinforce their competitiveness through cost reduction, new revenue creation, and the anticipation of future stricter regulations related to CO2, particulate matter (PM) emissions, and energy efficiency. Additionally, as the quantity of the stream to be exchanged is low, the symbiosis does not seem to require significant changes in the main processes of the central stakeholders. Geographic proximity is also not a barrier as the stream can easily be transported over large distances. Finally, this opportunity builds on and reinforces some of the cluster strengths, especially the willingness of the current actors to collaborate and the stability of their respective markets. The last point is of high interest because it would enable a long-lasting IS. Due to its particular attractiveness, it is therefore the PLF synergy that is further investigated.

3.3. Step 3—Scope Definition

3.3.1. Mapping of the Set of Stakeholders

Focusing on the PLF opportunity, the stakeholders are categorised as follows:
  • Central: Chemical plant and cement producer;
  • Peripheral: Waste handler for the cement producer, treatment facility owner, and transport provider;
  • External: Primary fuel supplier of the cement producer, third party currently using the waste stream to produce steam, and broadly the society.
The central stakeholders are identified after Step 1. Regarding peripheral actors, the waste handler currently provides services to the cement producer and would logically be considered for the IS implementation. A logistics company is needed to transport the stream between the actors. The treatment facility owner was not initially foreseen within the organisation, but it has been identified thanks to the iterative process of information collection (see paragraph below). Finally, three external actors are affected by the symbiosis creation and should be considered in the analysis. The primary fuel supplier of the cement producer would have reduced sales, the third party currently using the PLF would need to find an alternative fuel and the society, including public authorities, will be impacted by the potential environmental, social and regional externalities.

3.3.2. Data Collection

The data are collected from literature and interviews with the central stakeholders. The literature review has been carried out to better understand the two industrial sectors involved in the exchange and more specifically the use of AFs in cement kiln, the production parameters of both industrial processes, and the risks associated with such a symbiosis. Interviews were carried out to validate this understanding and identify potential bottlenecks, constraints, and opportunities. Several key points emerged from this data gathering activity:
  • From an organisational point of view, it clearly appears to be easier to send the PLF to the waste fuel provider of the cement producer rather than to the cement producer directly. This avoids investments in specific on-site storage and reduces costs associated with logistics and management (e.g., quality control). Furthermore, the waste fuel provider owns the required equipment and is highly qualified for such a task;
  • The PLF stream needs to be separated at least into two fractions (acid and organic) to avoid any issue when blending the PLF with the current AFs mix and when burning it in the cement kiln. If the PLF can be separated, its acid fraction could be recycled back into the chemical plant. It is important to remind that this treatment step was not foreseen in step 1 or step 2;
  • To ensure the PLF treatment and separation, one of the central actors should invest in the required technology, or a third party should be established;
  • Interviews revealed the possibility of a 40% increase in the PLF flow rate due to the de-bottlenecking of the chemical plant (e.g., specific areas of the process limiting the flow of product have been identified and optimised so that the overall capacity in the plant can be increased);
  • The stream can be transported by truck or boat;
  • The steam provider will have to replace the PLF stream by a conventional fuel. In this case, natural gas is assumed to substitute PLF.

3.3.3. BaU and Symbiosis Scenarios

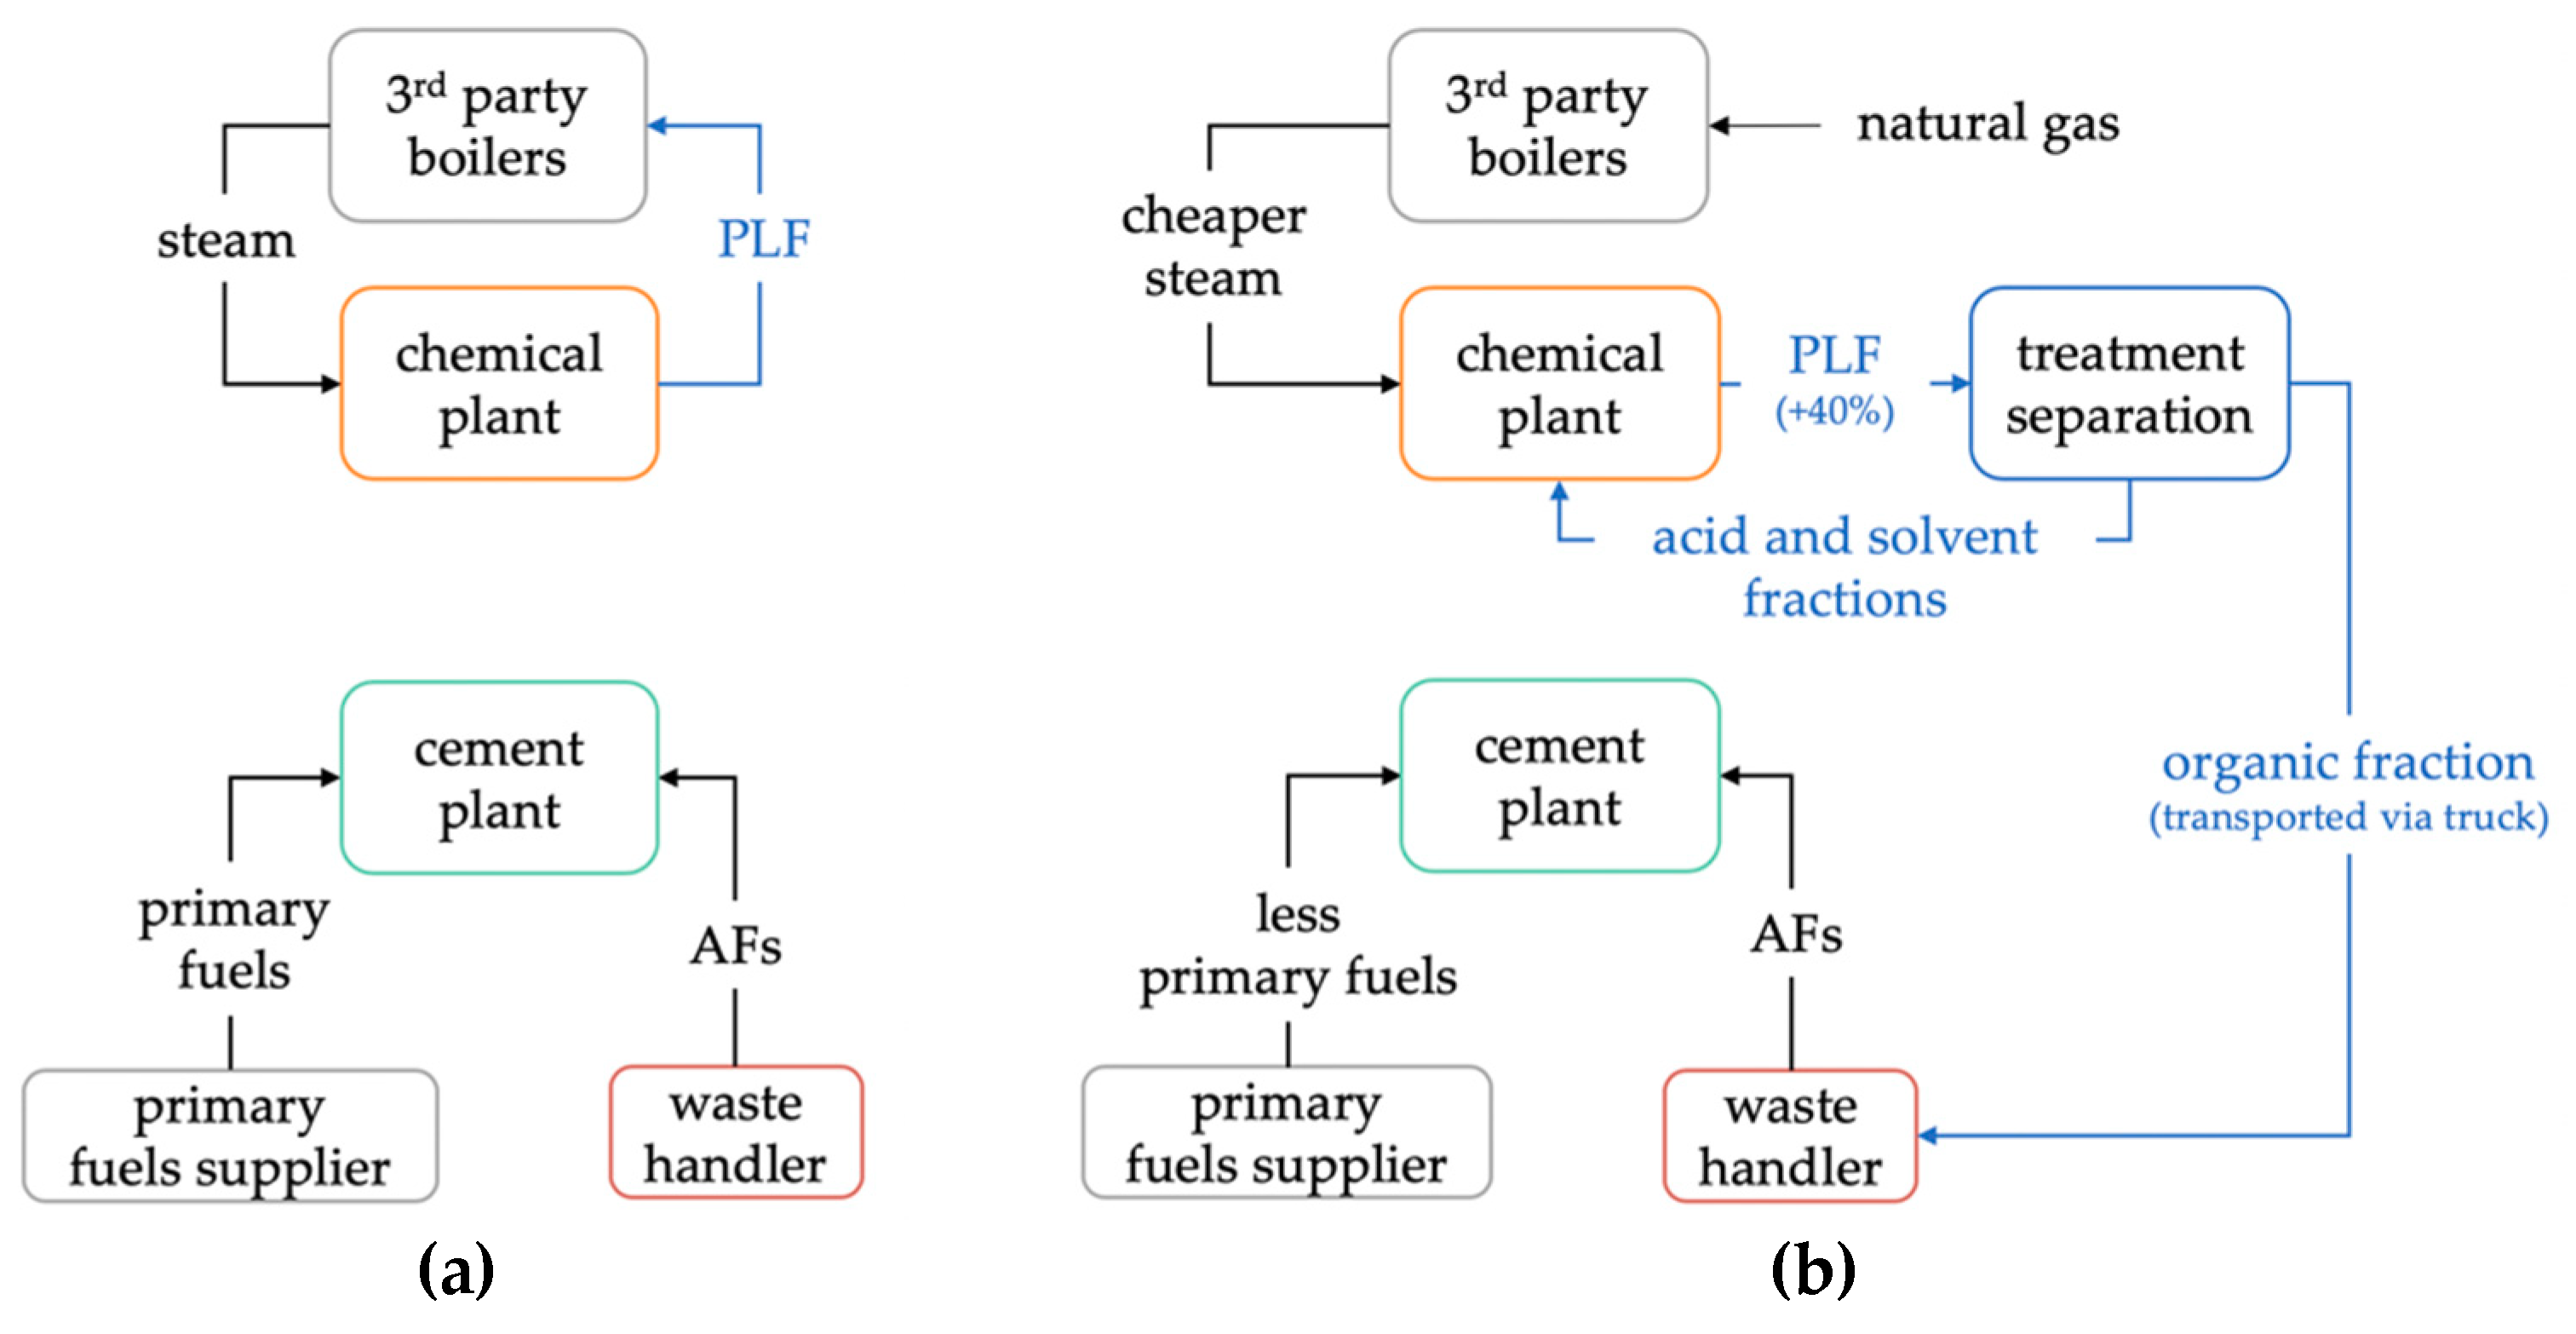
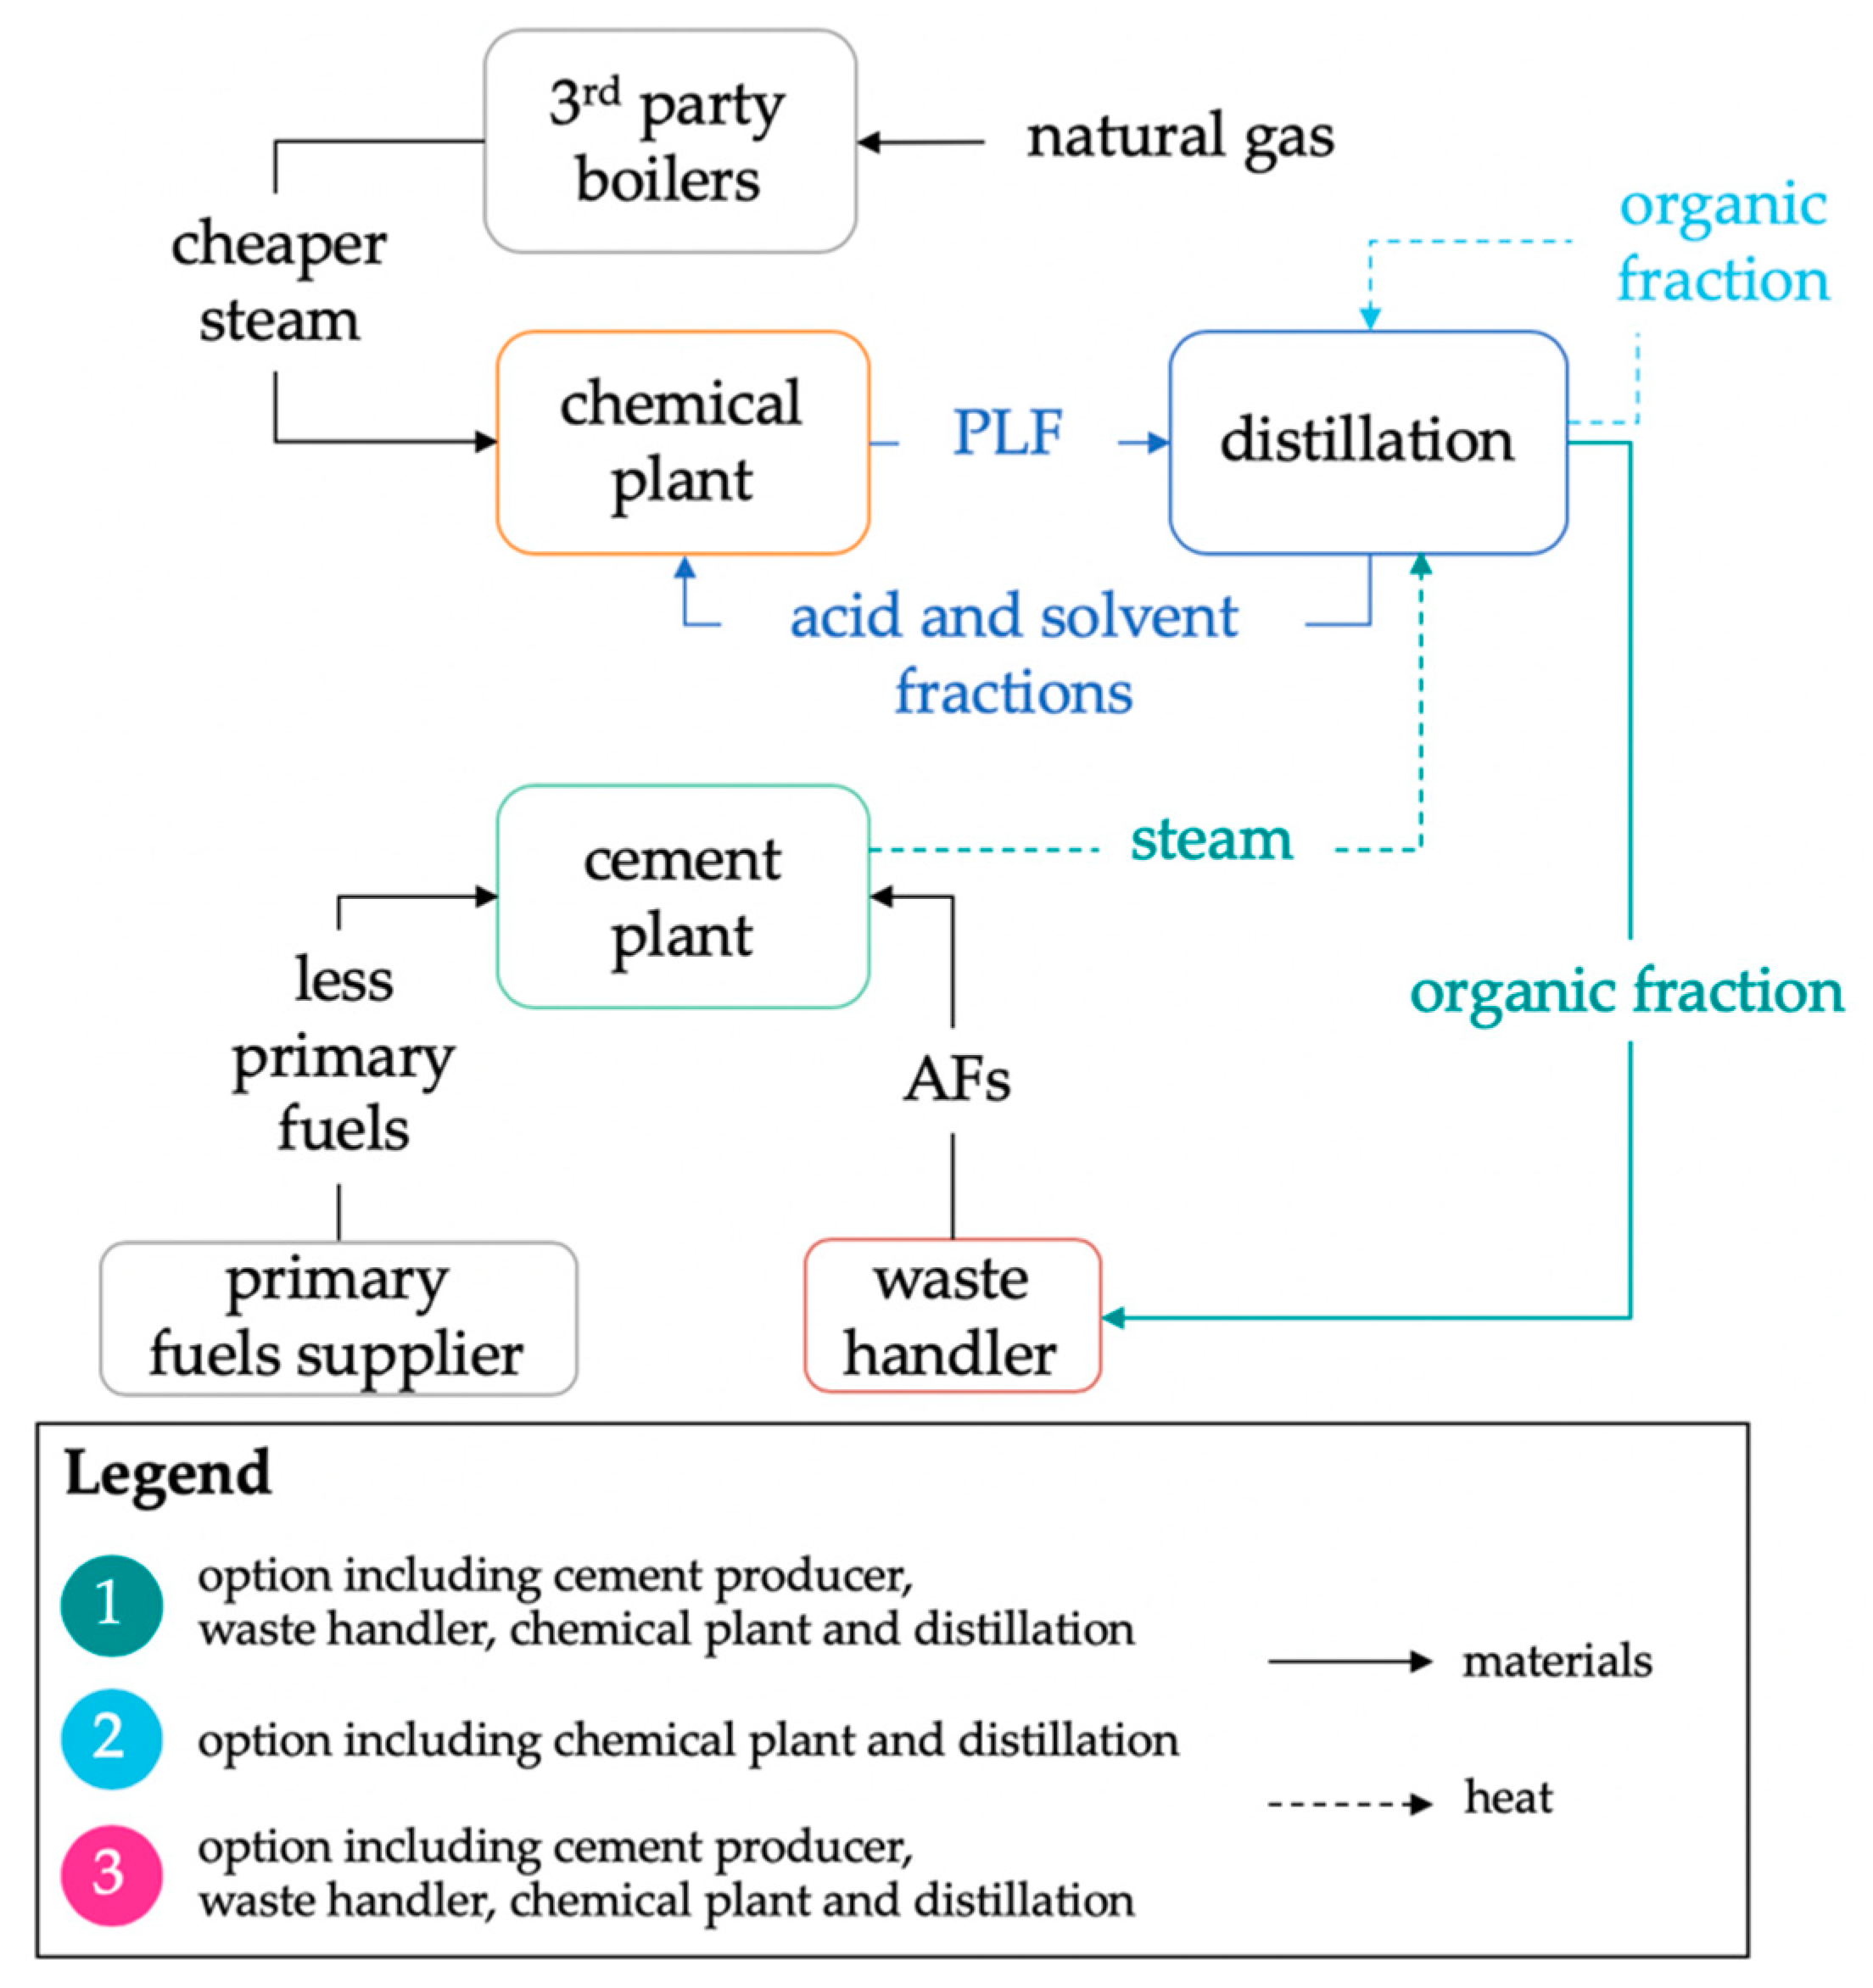
Based on the collected information, a BaU and several symbiosis scenarios are defined according to three parameters: transportation options, configurations of the treatment process, and development perspectives of the business. The BaU and the selected symbiosis scenario that is further assessed in step 4 are summarised in Figure 4. In this scenario, the PLF stream is sent to an external treatment and separation facility where it is finally split into three fractions. The acid and solvent fractions are reused by the chemical process, whereas the organic part is added to the AF feed for the cement kiln. The PLF flow rate is increased by 40%. All the streams are transported by truck.

3.4. Step 4—Value Mapping

Due to confidentiality reasons, most of the quantitative values resulting from this assessment step are aggregated.
Economic values
Table 3 summarises the economic values (positive and negative) considered in this case study and some additional information about their significance. Primary data from the industrial partners are mainly used for the economic assessment and supplemented with secondary data from literature and quotes of technology providers (e.g., transport, treatment, raw material). This secondary dataset was validated by the industrial partners. Created (benefits) and destroyed (costs) values were calculated individually, before being aggregated.
The analysis reveals that transport and management costs are negligible (a third of the total cost, which is insignificant). Treatment costs are the main expenses, but they are far less than the positive values created thanks to the internal reuse of the acid and solvent fractions (about 10%). Positive values such as avoided costs from steam procurement and the substitution of traditional fuels are noticeable, but they are also marginal in comparison with the value created from internal reuse (about 1.5%). By extending the stakeholders’ perimeter to the steam provider and to the conventional fuel and raw material suppliers, some negative economic values are identified. They are mainly due to the losses of profits of these peripheral actors. However, in this specific case they are not considered relevant as the symbiosis creation would benefit the steam provider by improving the boiler’s performance and because it will have little to no impact on the suppliers’ businesses.
Environmental Values
As detailed in the methodology section, environmental impacts are assessed through a preliminary LCT, using SimaPro software [77] and the Impact 2002+ method. The life cycle inventory uses some primary data (e.g., PLF volume and quality, low heating values of the PLF and cement producer current fuel, etc.) and is completed with secondary data from the ecoinvent database [78]. The assessment perimeter is cradle-to-gate and the reference and symbiosis scenarios are the one defined in Figure 4. The functional unit considered is the provision of a certain amount of heat to the cement producer (in MJ) equivalent to what the PLF is able to provide. The following assumptions are also made:
  • The PLF stream is replaced by natural gas in the steam boilers;
  • The PLF organic fraction that is sent to the cement producer’s kiln substitutes heavy fuels;
  • Treatment operations are required to separate the fractions;
  • Transport is needed between the chemical plant and the treatment facility (whole stream, acid and solvent fractions) and between the treatment facility and the cement producer’s AFs provider (organic fraction);
  • The acid and solvent fractions substitute primary raw materials at the chemical plant.
Results can be expressed in midpoints, such as human toxicity, respiratory inorganics, land occupation, or endpoints (e.g., human health, ecosystem quality, resources, climate change). The impact assessment reveals a net environmental benefit for every considered indicator, regardless of the level of aggregation. Considering endpoints (see Figure 5), the symbiosis implementation would reduce greenhouse gas emissions by 4 kt CO2 eq. every year, mainly thanks to the internal reuse of raw materials. It should also lower the non-renewable energy consumption related to the mineral resource extraction by 135,000 GJ per year and decrease the human health and biodiversity impacts by 7 DALYs (Disability-Adjusted Life Years, i.e., 7 years of equivalent ‘healthy’ life are saved) and 1,050,000 PDF.m2.yr (Potentially Disappeared Fraction of species per square meter and per year, i.e., the equivalent of the species living in 1,050,000 m2 are saved), respectively. These figures result from the aggregation of a significant number of data according to normative assumptions. They do not aim at giving an exact value, nor a specific impact in a certain area (e.g., the biodiversity impacts reduction are not specific to the Hull region), but they synthesise what could be the environmental benefits trends brought by the symbiosis.
Social Values
The analysis reveals that the IS creates social capital in the region due to the set-up of new relationships between traditionally independent stakeholders (e.g., chemical company-cement producer; chemical company-treatment utility). It might initiate new collaborations in a near future (e.g., valorisation of other organic wastes). It also improves the existing relationship between the chemical company and its steam provider, as the PLF had previously caused technical problems in the steam boiler. While no specific dialogue between these actors was initially implemented to solve this issue, this IS reveals how thinking ‘out of the box’ and cooperative initiatives could address existing threats or weaknesses in current production systems. Lastly, the identification and the refinement of the opportunity required a real change of mindset at the chemical plant. If this innovation momentum is maintained, new opportunities will probably emerge thanks to bottom-up and participatory initiatives. Such social values are identified by the EPOS IS facilitator. They cannot be quantified at that point, but they must be considered in the business model elaboration.
Regional Values
Based on the regional capital definition, the symbiosis creation also produces some regional values. First, it increases the circularity rate of the industrial system, contributing to the reduction of dependencies with other regions. It also promotes the local region under the banner of circular economy, resulting in additional attractiveness. The symbiosis would create the equivalent of 0.5 full time equivalent job, mainly through transportation, and it increases the level of local competencies and expertise in resource valorisation. Finally, the positive environmental impacts of the symbiosis also create a benefit for the local society.

3.5. Step 5—Business Model

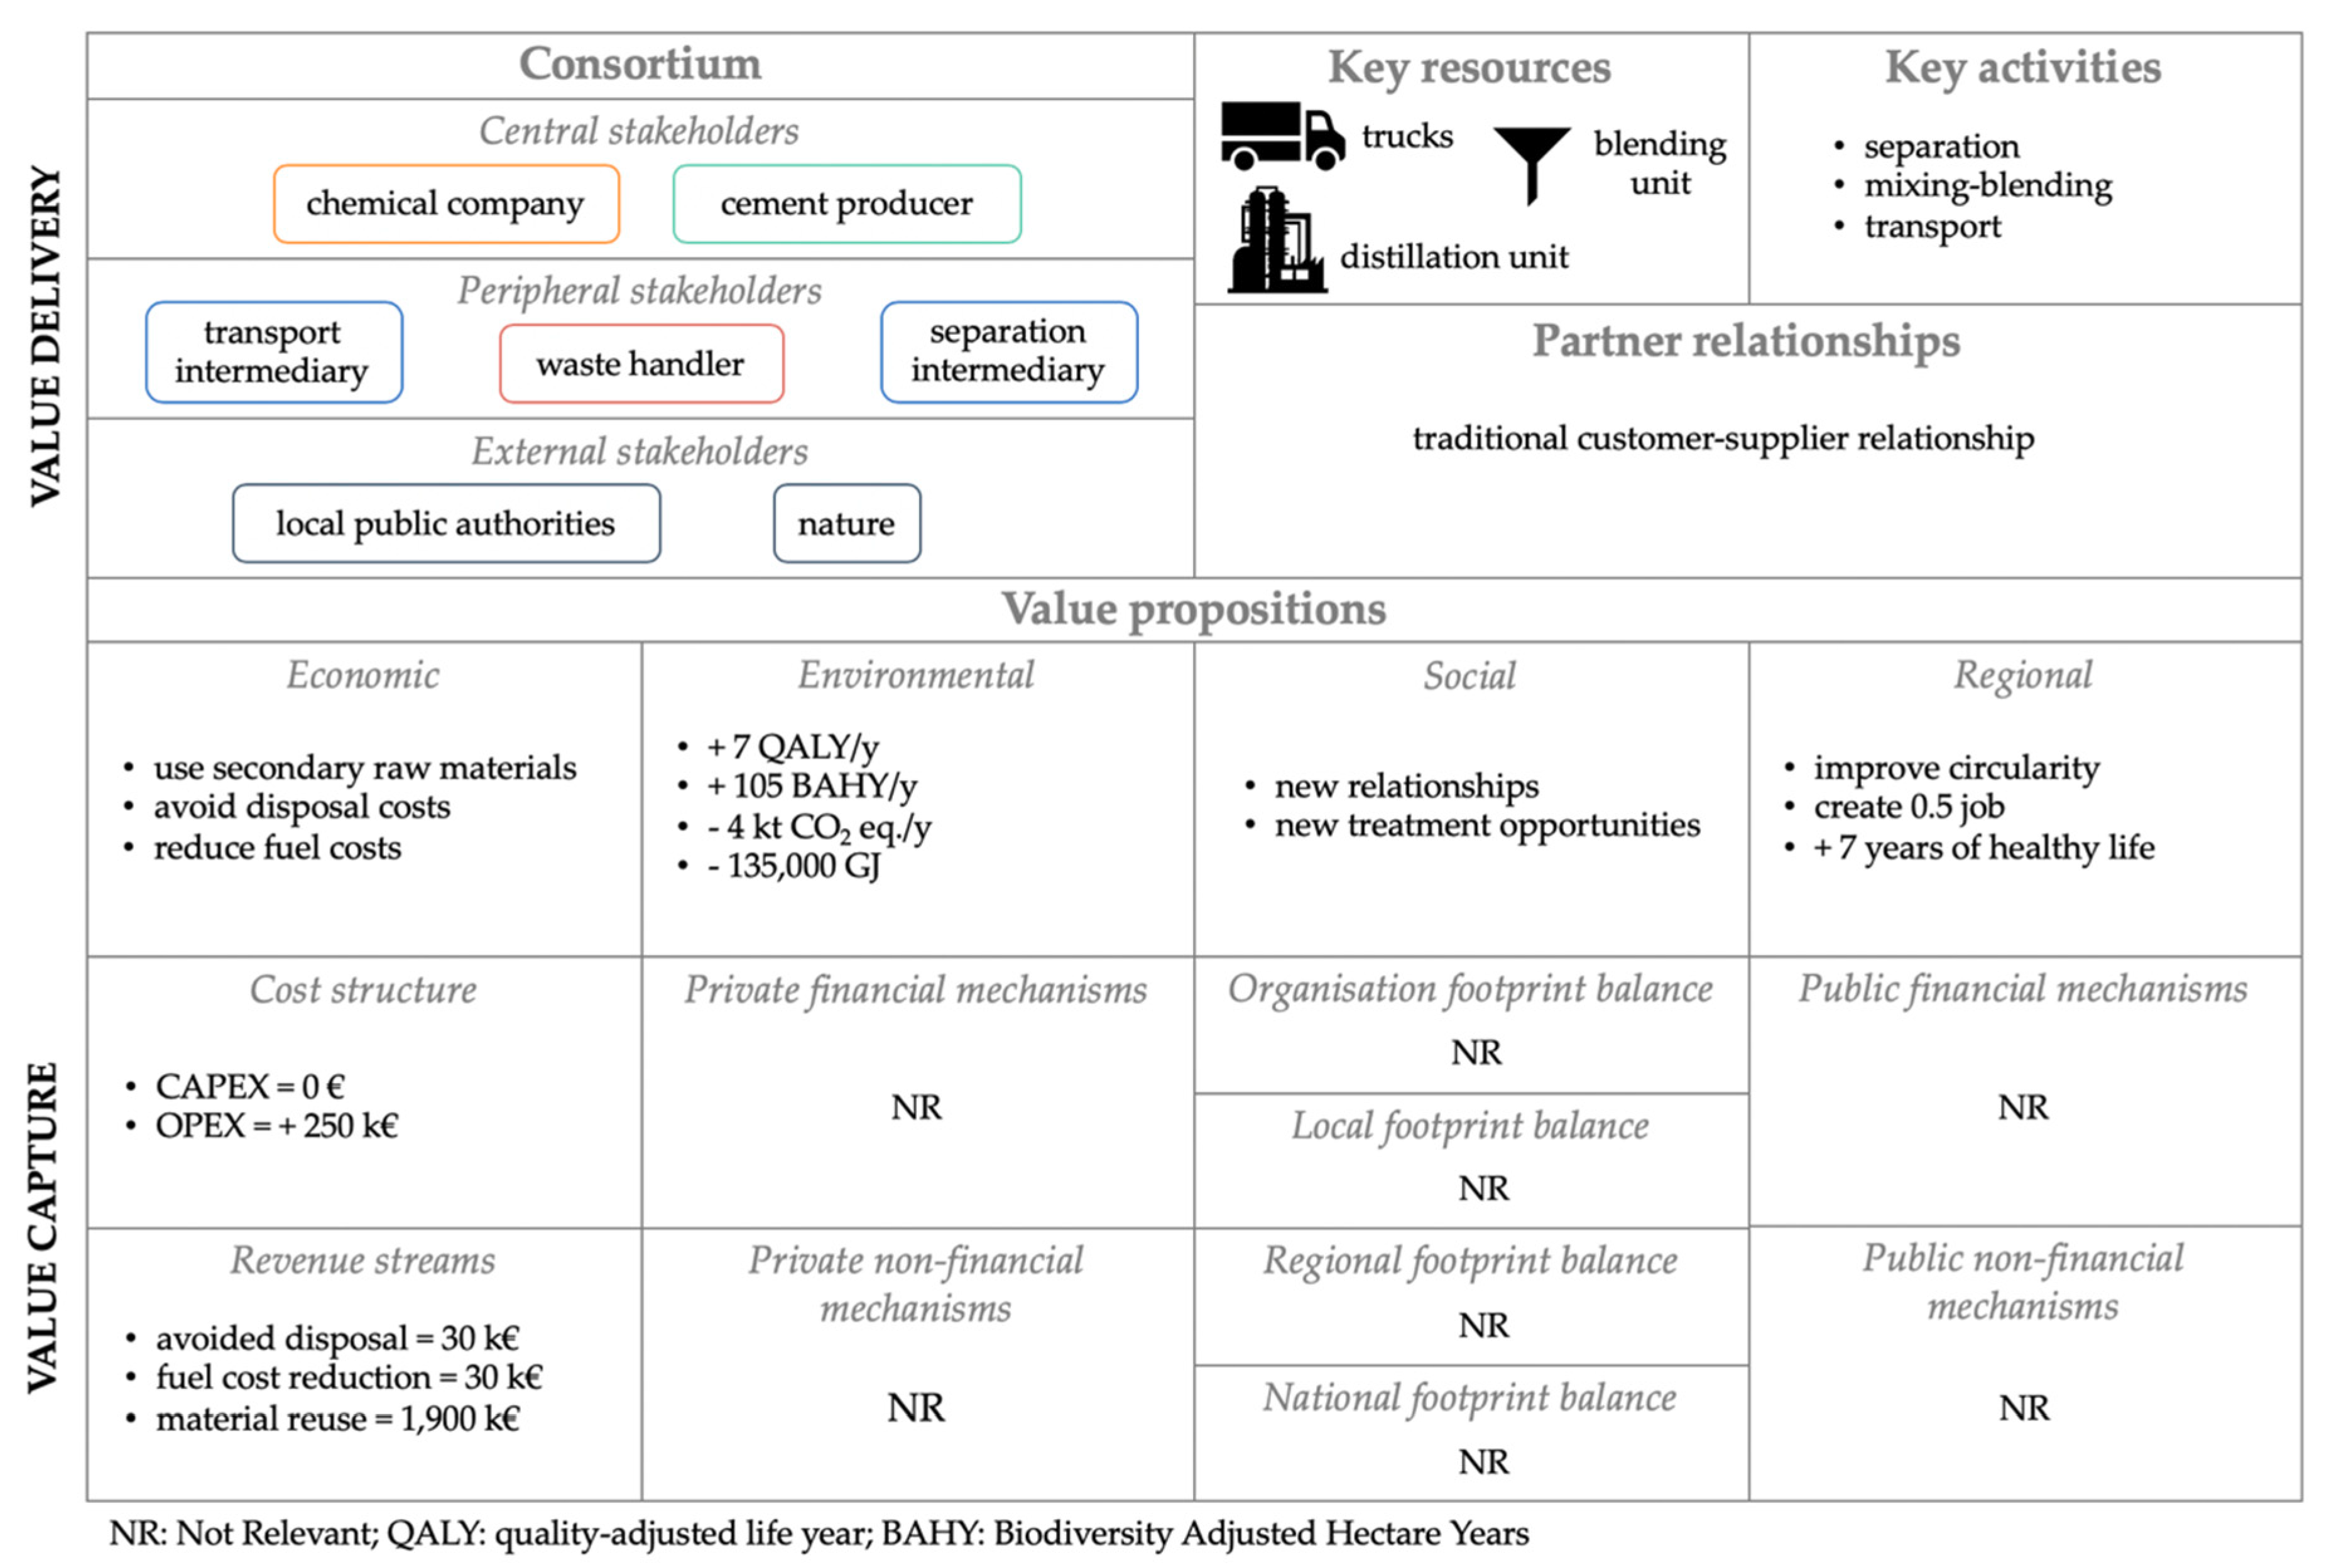
The goal of this step is to conceptualise the emerging business relationships that are created through the IS, between the different stakeholders. The IS sustainable business model canvas is a tool supporting that objective (see Figure 5). The values identified and assessed in step 4 correspond to the value propositions of the symbiosis (central part of the canvas). The top of the canvas summarises how values are created and delivered by detailing the system of stakeholders, the key resources and activities required for the symbiosis operation, and the partner relationships. Finally, the lower part describes how the value propositions are captured by the system of stakeholders. Economic values are detailed using the classical analysis of profit (revenue/cost). Environmental, social and regional values are captured using innovative methods (e.g., assessment of the variation in the amount of subsidies received according to expected externalities, new contract for investigating new symbioses, etc.).
Figure 5 shows the net created values of the chosen symbiosis scenario. The comparison between costs and benefits—at system level—clarifies the economic relevance of this opportunity and should be sufficient to trigger the continuation of the case analysis through a feasibility study. Environmental, social and regional values are also positive. It proves the suitability of the symbiosis and shows how it could improve the sustainability of the industrial system. As the economic value is high enough, no economic, social or regional value transfer mechanism is necessary to ensure the project launch (cf. Not Relevant cells in Figure 5).
The economic analysis highlights that even if the initial trigger of the project was a pure IS creation, 97% of the economic value is produced through the on-site optimisation of the chemical plant (material reuse). The latter can even be considered as the economic lever unlocking the whole IS viability. Additionally, this confirms the relevance of the assumption stating that the organic fraction of the PLF is being sent for free to the cement producer. As the acid and solvent fractions represent the largest part of the economic benefits, actors would act to ensure a win-win situation. Furthermore, the symbiosis allows a gain of 7 years of healthy life, and a significant reduction of CO2 emissions (−4000 t of CO2 eq/y). As for the economic values, these results are mainly related to the internal reuse of the acid and solvent fractions of the PLF. These results show the importance of considering the values associated to the material reuse in the analysis.

3.6. Step 6—Business Case

The business cases created for the Hull IS cannot be shared due to confidentiality issues, as the IS is under consideration by the partners. However, it should be highlighted that these business cases triggered the interest of decision-makers from the chemical company, who decided to engage in an in-depth feasibility study.

3.7. Step 7—Feasibility Study

The business case prepared is taken up further by the chemical company, which sees an opportunity to improve the overall efficiency of its process, decrease its operating costs, and reduce its environmental impact.
Challenges and Opportunities
The feasibility study starts by stepping back and re-assessing what could be the potential issues and opportunities with respect to the symbiosis implementation. The results of this assessment are classified according to the five LESTS aspects and some general recommendations are given for each of the challenges encountered (see Table 4). All these elements are taken into account during the rest of the analysis.
Technical and Logistic Options
To implement the symbiosis, the chemical company has studied several technological options to separate the aqueous (acid) and the organic (solvent and others) phases of the PLF stream. First a liquid-liquid extraction was envisioned. However, the results obtained were not satisfying enough to pursue with this technological option.
In a second step, the possibility of distilling the PLF stream was further investigated with the support of a third party. The results of this industrial trial validated that the PLF stream could be distilled into three fractions: the light ends (organic fraction), the solvent fraction, and the bottoms fraction of concentrated wet acid. Furthermore, since the distillation separates the PLF in three cuts, the organic fraction (light ends) is now free of flammable components (solvent) that would have created an issue for the cement kiln burner, thus removing the technical barrier previously identified (see Table 4).
After the laboratory trial, the business case was re-evaluated. Three additional sources of costs were identified: (1) the cost associated with the plant cleaning due to the fact that the PLF needs to be withdrawn in batch mode (i.e., the chemical plant has to be shut down to retrieve the PFL stream), (2) the cost for improving the cooling and instrumentation systems due to the high flammability and volatility of the solvent, and (3) the cost associated with the additional storage capacity needed to enable long campaigns of operations (i.e., let the chemical plant run as long as possible before stopping it to retrieve the PLF).
For logistic options, it is thus envisioned to have long campaigns of operation to minimise the costs associated with transport and plant cleaning, even though it requires an increase of the PLF storage capacity. The stream will be transported via truck to the third party facility to be distilled. The acid and solvent fractions will be sent back to the chemical plant while the organic part could be energetically valorised by the third party or sent to the cement producer to be burned.
Taking a Step Further
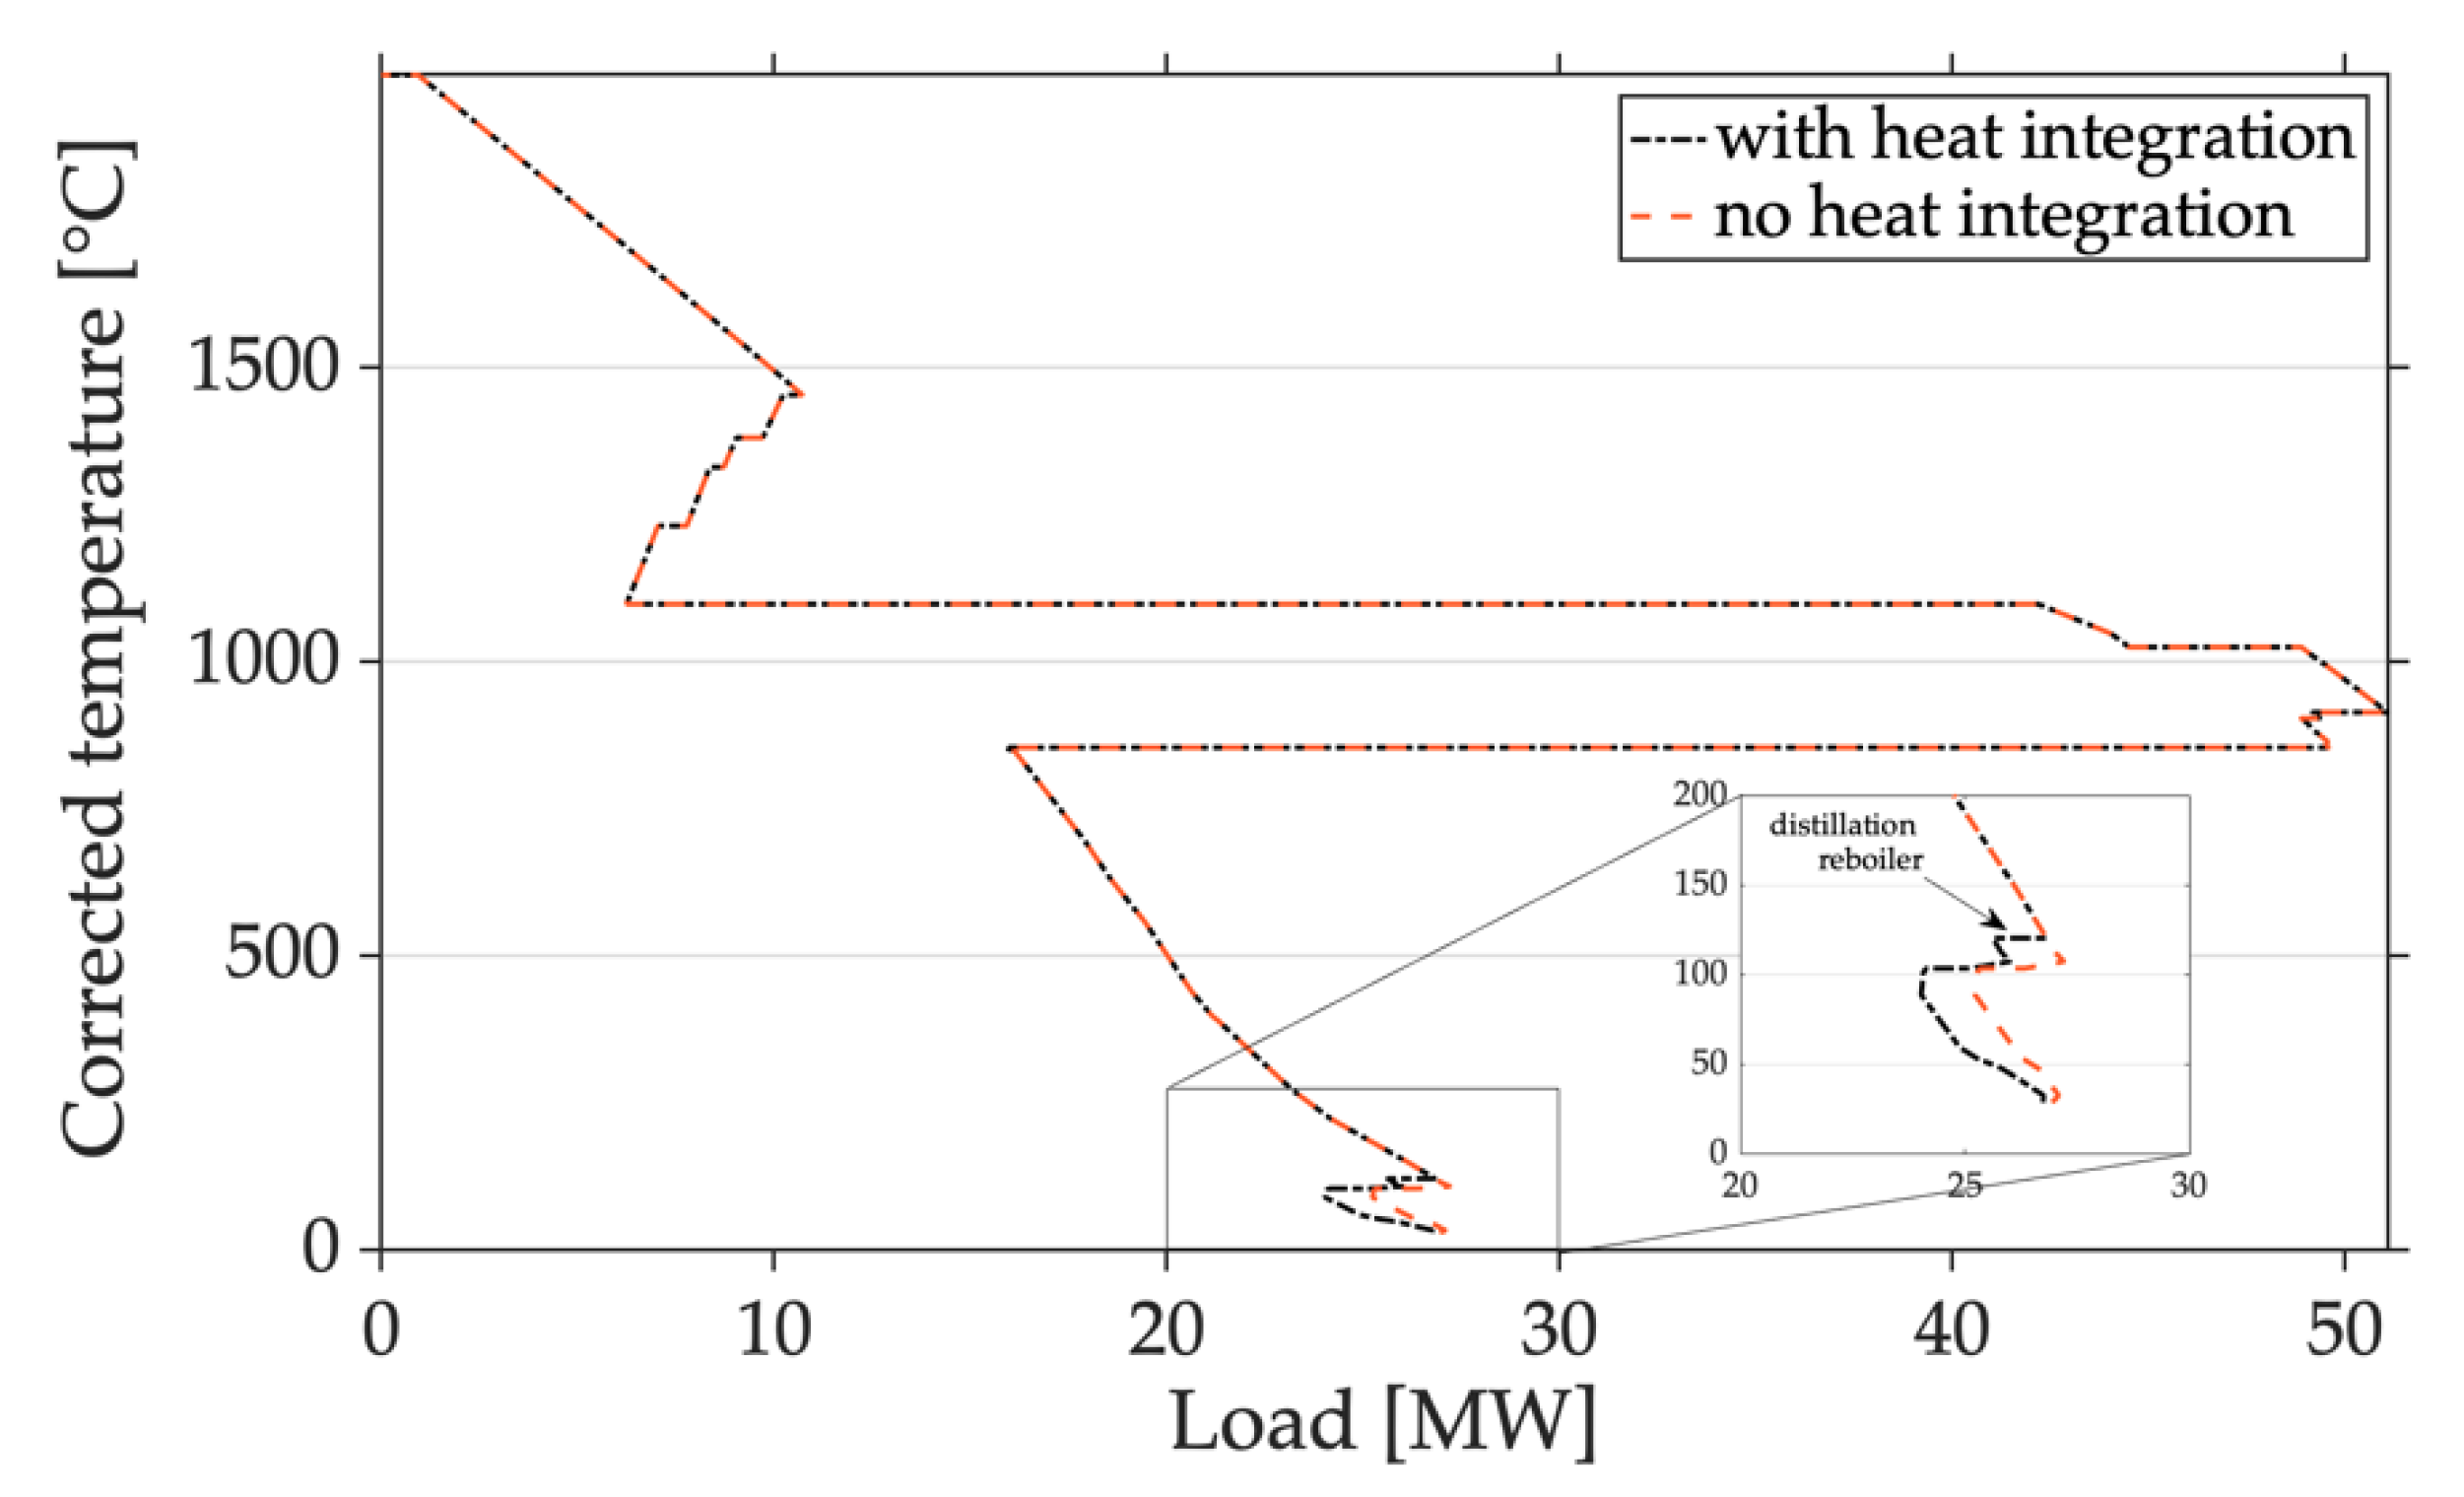
To check if the IS could be extended, the possibility of heat integration between the cement plant and the distillation unit of a third party is investigated. To do so, the cement blueprint thermal profile is used [91]. It results from the pinch analysis [92] of the cement blueprint and it is displayed in Figure 6 (red curve). This curve indicates the heating and cooling supply and demand (in MW) of the cement production process and their required temperature. The shape of the curve, shifting to the right (around 1000 °C), shows that the cement process is not energetically balanced and produces an excess of heat, the so called ‘waste heat’.
In the present case, the heat profile is generated for a cement process matching the production capacity of the cement plant in the Humber region, e.g., 700,000 tons per year. The distillation unit consists of a reboiler and a condenser. The heat profile of the reboiler is integrated in the analysis assuming that the heat exchange will take place below 120 °C and will require a maximum load of 1.2 MW (+/−50%) (see Figure 6).
The new curve, integrating the reboiler of the distillation, (black curve in Figure 6) indicates that the cement plant can supply enough heat to the distillation facility. This could be done through the utilisation of steam at relatively low pressure (around 3−4 barg) produced by using the waste heat from the cement plant. The heat integration between the cement plant and the distillation process could be an opportunity to extend the initially detected IS case by creating new links between the partners. It could also represent additional economic and environmental savings by avoiding the use of natural gas to produce the steam required by the distillation unit. However, this study does not take into account the distance separating the distillation unit from the cement plant, which might hinder the heat integration between the two processes. Therefore, a deeper thermo-economic analysis is required to fully assess this new possibility between the three stakeholders involved in the symbiosis.
Hull IS case—Final Configuration Possibilities
Following the more in-depth analysis carried by the chemical company, there are now two possible configurations for the Hull IS case, as displayed in Figure 7. For each option, long campaigns of operation are envisioned (i.e., let the chemical plant run as long as possible before stopping it to retrieve the PLF). The PLF stream is sent by truck to the distillation facility at the end of each campaign to minimise transport and plant cleaning costs. It is separated into three parts, and the chemical process reuses two of the three, the solvent and the acid fractions. The scenarios are the following:
  • The first option involves four partners: cement producer, waste handler, chemical plant and the third party in charge of the distillation. The organic part of the PLF is blended with the current AFs mix, while steam is produced by using the waste heat from the cement plant and used by the distillation unit. In this scenario, it is likely that the treatment facility will be located next to the cement plant to limit the energy losses of transporting steam from the cement facility to the distillation unit and reduce the transportation costs of the PLF stream;
  • The second option only involves the chemical plant and the third party in charge of the distillation. The organic fraction is used as fuel by the third party to produce the steam needed by the distillation unit. This scenario is more likely to happen if the treatment facility is located far away from the cement site;
  • The third option involves four partners: the cement producer, waste handler, chemical plant and the third party in charge of the distillation. The distillation unit is using natural gas to separate the PLF stream into three fractions. The organic fraction is sent to the cement producer where it is blended with the current AFs mix. This scenario is similar to the one assessed in the first steps of the case study.
The first part of the symbiosis (PLF distillation and recycling of raw materials) is now in the course of being implemented. Negotiations and more detailed analyses are currently ongoing between the stakeholders to decide how the organic fraction should be valorised.
Finally, this whole study encourages the chemical company to look at the option of investing in a new distillation unit. Indeed, as the symbiosis clearly brings added economic and environmental values by increasing the overall performance of the chemical process, it could be of high interest for the chemical plant to take care of the PLF stream treatment itself. By integrating the stream separation in the main process, the costs of transport, storage and plant cleaning could be drastically reduced.

4. Discussion

4.1. Addressing Some of the Barriers to IS

As stated in the introduction (Section 1), the barriers to IS are numerous. The IS case study presented in this paper shows how the EPOS multidisciplinary approach that takes into account the business, organisational, engineering, and regulatory aspects of IS, addresses some of the limitations to IS dissemination. Table 5 details which barriers to IS are addressed and how.
The EPOS approach helps to raise the awareness of managers and decision-makers about IS, waste or more broadly, underused resources. By following the EPOS methodology, they may change their mindset, think ‘out of the box’, and discover a variety of opportunities that can contribute to the sustainable development of their company and the whole society. By assisting the managers from the identification of IS opportunities until the development of business cases, the methodology help triggering initial efforts towards the implementation of sustainable strategies inside the industrial system. Additionally, Step 7 then helps to validate the technical feasibility of the opportunity.
The methodology is designed to enhance trust between the stakeholders. Blueprints provide relevant technical information without sharing any confidential data. They help to define a common understanding between different industrial sectors, thus enhancing the communication and the exchange of knowledge and information between industries. They can be used by non-experts and users from different industrial sectors, thus following one of the recommendations made by Maqbool et al. [95] to develop tools that could be used to solve cross-sectoral problems. In particular, an IS facilitator can use them to limit the conflict of interest and ensure that the approach stays collaborative during the development of the symbiosis.
Finally, in the EPOS approach, the set of stakeholders is invited to collaborate, exchange and co-assess the impacts of the IS. In that way, the evaluation of the IS can lead to the identification of new sources of value. For example, in this case study, the methodology helped to discover unintended values lying behind the IS concept. Indeed, most of the values generated in the case are created through the internal optimisation of the chemical process and the improvement of the system efficiency.

4.2. Comparison with Other Methods and Tools from the Literature

Identification and Assessment of Opportunities
The number of tools facilitating the development of IS has considerably increased during the last 10 years. They rely on Information and Communication Technology (ICT), physical meetings, or a combination of both such as the methods developed by ENEA [96] or NISP one [20]. ICT platforms can either be ‘passive’ (e.g., marketplaces) or use elaborate matchmaking algorithm as in the e-Symbiosis project [97,98]. They can provide solutions for both individual actors and at region level such as Looplocal [99]. Some relevant references propose comparative analyses of these existing methods and tools [59,65,95,100] or suggest classifications according to their type, function, and data used [101,102]. Without comparing the EPOS methodology to each individual tool, this literature review enables the identification of its main advantages and weaknesses from an operational point of view.
The EPOS methodology is designed as a step-by-step and generic guide – independent from any ICT tool or optimisation software – that the user can follow regardless of the symbiosis type, the context, or even the level of information that he gets access to. Its strengths are its flexibility, its adaptability, and its replicability. Indeed, the methodology is modular as each of the steps can be used independently from one another. For instance, an actor who identified an opportunity using any available software on the market can start following the methodology from Step 3. This way, the EPOS approach can be adapted to different typologies of IS. Furthermore, the EPOS methodology differentiate itself from other tools as it not only facilitates the identification of IS opportunities, but it helps assessing them according to a wide range of key indicators, setting up their business model and preliminary business case, and understanding their technical feasibility.
The main weakness of the methodology is that it depends on the user’s expertise, especially during the steps of IS identification, data collection, and assessment of intangible values. In addition, the EPOS’ approach requires a significant involvement of the stakeholders during the co-evaluation of values. Additional limitations are discussed below.
Business Model
Only a few articles focus on IS business models. They detail how a company can create, deliver and capture value through IS, to facilitate the adoption of IS by companies. Fraccassia et al. and later Magnusson et al. [103,104] adopted a firm perspective and proposed archetypes of business models according to who is using the resource (internal, external) and treating it (internal, external), and the possibility to create new products. Fraccassia et al. went a step further [105] and proposed a categorisation at the level of the system by considering two parameters: the levels of coordination and the centralisation of control. This systemic approach is suitable for describing IS ecosystems [106], but it remains mainly focused on economic values and does not provide any guidance to help the stakeholders integrating IS aspects in their current business model.
In the EPOS methodology, the business model is seen as a tool [87,107] and not as a practical reality for businesses such as in [108,109]. It uses an inside-out approach [110,111,112], i.e., starting with the analysis of the current organisation and then exploring how its business model can be improved in terms of sustainability. Furthermore, the EPOS methodology tries to provide a systemic analytic framework to correctly apprehend the complex relationships within and between the social stakeholders’ sphere and the natural ecosystems. In the context of IS, such framework can improve the understanding of stakeholders’ motivations, behaviors, conflicts of interest, the interactions within the network of actors and with its broader context, and the values created [62]. In the proposed business model canvas, this systemic approach appears both in terms of value propositions and stakeholders considered. First, our IS sustainable business model includes a wide range of values, besides the economic ones. Tailored frameworks are proposed to assess the value propositions according to each value nature and especially for environmental, social and regional ones. While used for a different purpose, the latter has some similarities with the framework of six geographic dimensions (location, landscape, territoriality, scaling, spatial differentiation, spatial embeddedness) proposed by [62]. Second, the scope of the business model is not restrained to the company level and is enlarged to the project level, involving the entire network of stakeholders. This innovative aspect fundamentally changes the nature of the concept of business model as it considers that the value propositions are collectively created by the set of stakeholders, and not by a single entity. This allows capturing all the benefits generated by the IS ecosystem, while they may have been unavailable when only considering the stakeholders on their own [113]. Therefore, it was on purpose that the concept of ‘customer’ was removed from our business model canvas.
Thus, the EPOS’ business model relates to the concept of sustainable business model (i.e., providing competitive advantage through a value proposition that contributes to the sustainable development of the companies and the society [114]), as it gives a comprehensive view on the ability of the symbiosis to contribute to the sustainable development of the industrial system.

4.3. Limitations and Research Perspectives

Several limitations to the EPOS approach were identified. First, the methodology has been developed in the framework of a publicly funded project (EU H2020). This context highly facilitates the data collection process and dissipates the cost associated with it. All the analyses have been carried in favourable conditions by a third-party, where cooperation and trust between the partners were already established. Furthermore, it also enabled the integration of frequent feedbacks from the stakeholders involved. Additional studies should thus be carried outside the EPOS consortium to improve and test the robustness of the method. A key aspect of this point is the identification of the main actors in the cluster. By definition, the EPOS clusters already have main actors willing to cooperate, so step 1 of the methodology mainly focused on those actors. When the actors are not a priori selected, other strategies may have to be adopted.
The EPOS methodology is mainly designed for an external IS facilitator. Its role is highly important as it is in charge of gathering (confidential) data, creating a dialogue between the stakeholders and mobilising them, and organising the value assessment. This can be seen as the main limitation of the methodology as one might consider that self-organised dynamics are more favourable to trigger the implementation of IS, compared to planned or facilitated initiatives [43,115]. On the other hand, one could argue that the success of IS highly depends on the cultural, politic, regulatory context, as well as on the coordination mechanisms of the market. For instance, in Europe, the intervention of public bodies is more important than in other regions such as the United States, and the current status of IS dissemination shows that the facilitated approach (mainly subsidised) might be more effective than spontaneous IS development. Additionally, a facilitated approach can prove useful for valorising environmental, societal, and regional values that require non-market mechanisms to be internalised in the IS business model.
Integration of non-economic values in decision-making is also a significant issue. An under-development methodology proposes the monetarisation of environmental benefits. As seen in the case, the positive environmental values are high and represent gains for the society, in terms of human health, ecosystem services, future energy consumption, and global warming mitigation activities, that would otherwise fall under taxpayer responsibilities. Based on these observations the StepWise2006 monetarisation method [79] has been used. It enables translating the LCT analysis midpoints in economic terms and above all, aggregating environmental impacts into one unique indicator (€) to facilitate decision-making. Its application to the case shows that 45% of the total economic value—i.e., the sum of economic and monetarised environmental values—is generated through environmental values. Such information is relevant and should be better integrated in the analysis of IS initiatives and more broadly in industrial practices. It could lead in some cases to include public authorities (at different scale) to participate into the IS business model through subsidies and tax reduction. It would particularly be of interest when no viable business model can be found when only considering industrial actors. This methodology still needs refinement and the results must be carefully communicated. Monetarisation is still controversial, it has its limitations [116], and is not always well perceived by industries or public authorities.
The LCT analysis allows to compare the environmental impact of the symbiosis with BaU. However, as it does not localise precisely the place where the benefits or impacts are generated, it does not fully provide the required information to involve public authorities in the set-up of the IS business model. These actors—at different scales—are not able to identify to what extent the symbiosis improves the situation of the territory they are responsible for, and thus they cannot define adequate subsidies, or even other support mechanisms. By definition, when using LCT methods, the system under study is divided into a foreground and a background system according to the influence that the decision-maker may exercise on them through its action [117]. The foreground system corresponds to the processes whose production volume will be affected directly by the change, while the background system are the processes on which no, or at best, indirect influence (e.g., only through the market) may be exercised [118]. It is widely accepted in literature that the location of impacts on the background system (e.g., global fuel market) cannot be identified, mainly because information used is secondary and generic. However, further developments seem feasible to better characterise some impacts on the foreground system (e.g., related to local transport or product transformation activities). Some pathways should be developed to complete this global LCT study with a specific territorial LCT analysis [119], especially by developing a collaborative approach to identify the main issues according to the local stakeholders [120].
Finally, the blueprint methodology is of high interest to limit data collection and address confidentiality issues. However, the blueprints are only developed for four specific industrial sectors: cement, chemicals, steel and minerals. By extending that work to other types of industries, it could help to uncover more IS opportunities. This seems to be a necessary condition for the perpetuation of this approach; however, it requires important development efforts that other industries or industry associations are not necessarily willing to engage in.

5. Conclusions

This paper details the whole process of an IS setup at the EPOS Hull cluster, leading to the development of a concrete business case that is soon to be implemented by industrial stakeholders. It follows a methodology developed within the EPOS project, based on a multidisciplinary and a systemic approach that focuses on the preliminary assessment, the engagement of stakeholders, the identification of IS opportunities, and the feasibility definition steps, as defined by Yeo et al. [59], and enables to overcome some of the typical issues and barriers to IS. The methodology facilitates the:
  • Identification of IS opportunities as thirteen IS options were identified in the EPOS Hull cluster;
  • Prioritisation of these opportunities according to stakeholders’ goals, needs, and constraints;
  • Context analysis with respect to the legal, economic, social, technical, and spatial aspects that ultimately results in the identification of strengths, weaknesses, opportunities and threats of the cluster under consideration;
  • Analysis of a wider range of values (economic, environmental, social, and territorial) than the ones generally taken into account during the assessment of IS opportunities. In the case study, the positive and negative impacts of the symbiosis are clearly detailed, revealing the main source of value creation (in terms of economic and environment gains) which is due to an internal recycling.
  • Creation of the symbiosis’ business model that clearly highlights what the value propositions are, how they are delivered to the different stakeholders and how the latter can capture these values within their own business. It gives some insights on how the values could be shared and proposes some levers to internalise environmental, social and territorial values if the business model is not economically viable;
  • Draft of preliminary business cases devoted to trigger the interest of the industries’ decision-makers. In the case study, the symbiosis business case helped raising the interest of the chemical company, which then decided to start a feasibility study;
  • Detailed and technical analysis of synergies without asking for confidential data from the other stakeholders (blueprints).
The scientific contribution of this paper is first theoretical, as it proposes a multidisciplinary and a systemic approach that aims at removing some of the obstacles to the implementation of IS. It builds on existing methodologies, reinforced with tailored tools, in order to provide adapted solutions to well-known barriers to IS.
Additionally, this article has an operational dimension. By detailing precisely all the steps followed on a specific case study, it intends to foster the implementation of IS. This methodology is meant to be used by IS practitioners and give them a clear pathway to follow in order to create symbioses in their territory. As the methodology requires to collect information from several entities, and to spend time on this specific activity, IS facilitators (e.g., consultancies, chamber of commerce, universities) are more likely to use it. Depending on the cluster context, the motivations of companies, or the resource they can dedicate to such a task, industries are alternative potential users.
Finally, the contribution of this paper is also empirical as it describes the development of a symbiosis, from the emergence of the idea to the feasibility study. Difficulties, barriers, and interests are detailed. It shows that symbiosis with a limited size can be particularly interesting, even for large process industries. It also reveals the indirect benefits related to the concepts in IS and IE: while the initial objective was to create symbiosis between companies, the innovation process initiated in the EPOS project, and more importantly in industries, enabled to identify other sources of value creation (internal reuse of some fractions). IS is not only a way to generate economic, environmental, social and regional benefits through exchanges, it is also a mean to foster eco-innovation in organisations and to set-up sustainable business models. However, further efforts remain necessary to promote such type of business model and several lessons on how to do so can be derived based on the analysis provided in this paper:
  • Develop innovative (non-)market-based mechanisms that could facilitate the efficient integration of non-economic values in the business models of companies. Examples of such initiatives can be the implementation of local or circular labels, the enactment of public procurement targeting materials with such labels, or the unlocking of subsidies based on the expected (positive) externalities brought to the community;
  • Improve the traceability of products along the entire value chain to give the opportunity to upstream actors, such as heavy industries, to differentiate from competitors in terms of sustainability performance;
  • Finance or mandate certified ‘material audits’ (similar to energy audits) that could provide industries with strategies to improve the use of their resources or to implement eco-design.
  • Train and educate practitioners through proactive workshops on the benefits brought by sustainable business models. These seminars should be based on real and successful experiences as the one introduced in this paper.

Supplementary Materials

Social value indicators and Regional value indicators are available online at https://www.mdpi.com/2071-1050/11/24/6940/s1.

Author Contributions

Conceptualization, visualization H.C., S.O., A.S.M. and F.M.A.; writing—original draft preparation, H.C.; methodology, investigation, H.C., S.O. and A.S.M.; formal analysis, S.O. and L.L.; writing—review and editing, H.C., S.O., A.S.M., F.M.A., L.L., A.B., J.-H.F. and G.V.E.; supervision, A.B., J.-H.F. and G.V.E.

Funding

This research has received funding from the European Union’s Horizon 2020 research and innovation programme under grant agreement no. 679386, EPOS project (Enhanced energy and resource Efficiency and Performance in process industry Operations via onsite and cross-sectorial Symbiosis). This work was supported by the Swiss State Secretariat for Education, Research and Innovation (SERI) under contract number 15.0217. The sole responsibility of this publication lies with the authors. The European Union is not responsible for any use that may be made of the information contained herein. The opinions expressed and arguments employed herein do not necessarily reflect the official views of the Swiss Government.

Acknowledgments

The present work has been carried under a CIFRE convention between the Mechanical Modelling and Clean Process laboratory (M2P2) and INEOS.

Conflicts of Interest

The authors declare no conflict of interest.

Abbreviations

AFAlternative Fuel
BaUBusiness as Usual
BEISDepartment for Business, Energy and Industrial Strategy
EPOSEnhanced energy and resource Efficiency and Performance in process industry Operations via onsite and cross-sectorial Symbiosis
EUEuropean Union
GCCGrand Composite Curve
HISPHumber Industrial Symbiosis Programme
ICTInformation and Communication Technology
IEIndustrial Ecology
ISIndustrial Symbiosis
LCTLife Cycle Thinking
LESTSLegal, Economic, Spatial, Technical and Social PLF primary liquid fuel
PMParticulate Matter
SWOTStrengths, Weaknesses, Opportunities, Threats

Appendix A

Table A1 presents the scale used to rank the level of interest of each industrial partner in each IS case identified.
Table A1. Level of interest in each IS case based on technical and organisational feasibility.
Level of interest12345
Technical suitabilityTechnically, it does not make sense for the specific production systemComplex changes in the existing infrastructure are required (implying unreasonably high costs)Technically, it makes sense for this specific production systemInfrastructure and/or other conditions are fulfilled to some extent or can be improved without major challengesNo major infrastructural challenges exist, and other conditions are fulfilled
Organisational suitabilityNot in line with the organisation’s goals and strategiesOrganisational resources (time, budget, etc.) are not available, and/or should not be directed at this measurePartially in line with the organisation’s goals and strategies and is considered relatively importantIn line with the organisation’s goals and strategies. The necessary organisational resources (time, budget, etc.) are not available, but this could be changedThe measure is considered important by the organisation and the necessary organisational resources (time, budget, etc.) can be allocated to this measure

References

  1. European Commission. The Road from Paris: Assessing the Implications of the Paris Agreement and Accompanying the Proposal for a Council Decision on the Signing, on behalf of the European Union, of the Paris Agreement Adopted under the United Nations Framework Convention on Climate Change; European Commission: Brussels, Belgium, 2016. [Google Scholar]
  2. Bourg, D.; Fragnière, A. La Pensée Ecologique: Une Anthologie; L’écologie en Questions; Presses Universitaires de France: Paris, France, 2014; ISBN 978-2-13-058444-5. [Google Scholar]
  3. Ellen MacArthur Foundation. Towards the Circular Economy, Vol. 1: Economic and Business Rationale for a Circular Economy; Ellen MacArthur Foundation: Cowes, UK, 2012. [Google Scholar]
  4. Sana, F. L’économie Circulaire: Changement Complet de Paradigme Economique? Pour la Solidarité: Bruxelles, Belgium, 2014; p. 24. [Google Scholar]
  5. Bourguignon, D. Closing the Loop: New Circular Economy Package; European Parliament: Brussels, Belgium, 2016; p. 9. [Google Scholar]
  6. European Commission. Implementation of the Circular Economy Action Plan; European Commission: Brussels, Belgium, 2019. [Google Scholar]
  7. Ellen MacArthur Foundation. Towards the Circular Economy, Vol. 2: Opportunities for the Consumer Goods Sector; Ellen MacArthur Foundation: Cowes, UK, 2013. [Google Scholar]
  8. Ellen MacArthur Foundation. Towards the Circular Economy, Vol. 3: Accelerating the Scale-Up across Global Supply Chains; Ellen MacArthur Foundation: Cowes, UK, 2014. [Google Scholar]
  9. Wentworth, J.; Burgon, J. Designing a Circular Economy; Parliamentary Office of Science and Technology: London, UK, 2016. [Google Scholar]
  10. House of Commons Environmental Audit Committee. Growing a Circular Economy: Ending the Throwaway Society; Authority of the House of Commons: London, UK, 2014. [Google Scholar]
  11. HM Government. Growing a Circular Economy: Ending the Throwaway Society: Government Response to the Committee’s Third Report of Session 2014–2015-Eighth Special Report of Session 2014–2015; HM Government: London, UK, 2014.
  12. Murray, A.; Skene, K.; Haynes, K. The Circular Economy: An Interdisciplinary Exploration of the Concept and Application in a Global Context. J. Bus. Ethics 2017, 140, 369–380. [Google Scholar] [CrossRef] [Green Version]
  13. Department for Business, Energy & Industrial Strategy. Industrial Decarbonisation and Energy Efficiency Action Plans: Summary Document; Department for Business, Energy & Industrial Strategy: London, UK, 2017; p. 6.
  14. Department of Energy and Climate Change; Department for Business, Innovation and Skills. Industrial Decarbonisation & Energy Efficiency Roadmaps to 2050: Chemicals; Department for Business, Innovation and Skills: London, UK, 2015.
  15. Department for Business, Energy & Industrial Strategy. Chemicals Sector: Industrial Decarbonisation and Energy Efficiency Roadmap Action Plan; Department for Business, Energy & Industrial Strategy: London, UK, 2017.
  16. Department for Business, Energy & Industrial Strategy. Cement Sector: Industrial Decarbonisation and Energy Efficiency Roadmap Action Plan; Department for Business, Energy & Industrial Strategy: London, UK, 2017.
  17. British Standard Institution. BS 8001:2017—Framework for Implementing the Principles of the Circular Economy in Organizations. Guide; BSI: London, UK, 2017; ISBN 978 0 580 92644 0. [Google Scholar]
  18. HM Government. The UK Low Carbon Transition Plan: National Strategy for Climate and Energy; HM Government: London, UK, 2009; ISBN 978-0-10-850839-4.
  19. Velenturf, A.P.M. Initiating resource partnerships for industrial symbiosis. Reg. Stud. Reg. Sci. 2017, 4, 117–124. [Google Scholar] [CrossRef] [Green Version]
  20. Jensen, P.D. The role of geospatial industrial diversity in the facilitation of regional industrial symbiosis. Resour. Conserv. Recycl. 2016, 107, 92–103. [Google Scholar] [CrossRef] [Green Version]
  21. Penn, A.S.; Jensen, P.D.; Woodward, A.; Basson, L.; Schiller, F.; Druckman, A. Sketching a network portrait of the humber region. Complexity 2014, 19, 54–72. [Google Scholar] [CrossRef]
  22. Humber Local Enterprise Partnership. Humber Strategic Economic Plan 2014–2020; Humber Local Enterprise Partnership: Humber, UK, 2014. [Google Scholar]
  23. Penn, A.S.; Knight, C.J.K.; Lloyd, D.J.B.; Avitabile, D.; Kok, K.; Schiller, F.; Woodward, A.; Druckman, A.; Basson, L. Participatory Development and Analysis of a Fuzzy Cognitive Map of the Establishment of a Bio-Based Economy in the Humber Region. PLoS ONE 2013, 8, e78319. [Google Scholar] [CrossRef] [PubMed] [Green Version]
  24. Yorkshire and the Humber Regional Committee. Carbon Emissions in the Yorkshire and Humber Region; House of Commons: London, UK, 2010.
  25. Strane Innovation SAS. D6.1—EPOS Tool Market Study; Strane Innovation SAS: Paris, France, 2016. [Google Scholar]
  26. Bruel, A.; Kronenberg, J.; Troussier, N.; Guillaume, B. Linking Industrial Ecology and Ecological Economics: A Theoretical and Empirical Foundation for the Circular Economy. J. Ind. Ecol. 2019, 23, 12–21. [Google Scholar] [CrossRef] [Green Version]
  27. Ghisellini, P.; Cialani, C.; Ulgiati, S. A review on circular economy: The expected transition to a balanced interplay of environmental and economic systems. J. Clean. Prod. 2016, 114, 11–32. [Google Scholar] [CrossRef]
  28. Deutz, P.; Ioppolo, G. From Theory to Practice: Enhancing the Potential Policy Impact of Industrial Ecology. Sustainability 2015, 7, 2259–2273. [Google Scholar] [CrossRef] [Green Version]
  29. Chertow, M.R.; Ehrenfeld, J.R. Organizing Self-Organizing Systems. J. Ind. Ecol. 2012, 16, 13–27. [Google Scholar] [CrossRef]
  30. Lombardi, D.R.; Laybourn, P. Redefining Industrial Symbiosis. J. Ind. Ecol. 2012, 16, 28–37. [Google Scholar] [CrossRef]
  31. Chertow, M.R. INDUSTRIAL SYMBIOSIS: Literature and Taxonomy. Annu. Rev. Energy Environ. 2000, 25, 313–337. [Google Scholar] [CrossRef] [Green Version]
  32. Mirata, M.; Emtairah, T. Industrial symbiosis networks and the contribution to environmental innovation: The case of the Landskrona industrial symbiosis programme. J. Clean. Prod. 2005, 13, 993–1002. [Google Scholar] [CrossRef]
  33. Van Eetvelde, G.; Dierick, B.; Allaert, G.; Vanden Abeele, P.; Verhoestraete, D.; Matthyssen, D.; De Zutter, B.; Deridder, K.; De Roeck, V.; Devos, D.; et al. Groeiboek Duurzame Bedrijventerreinen, Technisch, Economisch, Juridisch and Ruimtelijk Bekeken; Vanden Broele: Gent, Belgium, 2005. [Google Scholar]
  34. Van Eetvelde, G. Industrial Symbiosis. In Resource Efficiency of Processing Plants; John Wiley & Sons, Ltd.: Hoboken, NJ, USA, 2018; pp. 441–469. ISBN 978-3-527-80415-3. [Google Scholar]
  35. Van Eetvelde, G.; Deridder, K.; Segers, S.; Maes, T.; Crivits, M. Sustainability scanning of eco-industrial parks. In Proceedings of the 11th European Roundtable on Sustainable Consumption and Production, Basel, Switzerland, 20–22 June 2007. [Google Scholar]
  36. Desrochers, P.; Szurmak, J. Long Distance Trade, Locational Dynamics and By-Product Development: Insights from the History of the American Cottonseed Industry. Sustainability 2017, 9, 579. [Google Scholar] [CrossRef] [Green Version]
  37. Desrochers, P. Market Processes and the Closing of ‘Industrial Loops’. J. Ind. Ecol. 2000, 4, 29–43. [Google Scholar] [CrossRef]
  38. Lowe, E.A.; Evans, L.K. Industrial ecology and industrial ecosystems. J. Clean. Prod. 1995, 3, 47–53. [Google Scholar] [CrossRef]
  39. Mirata, M. Experiences from early stages of a national industrial symbiosis programme in the UK: Determinants and coordination challenges. J. Clean. Prod. 2004, 12, 967–983. [Google Scholar] [CrossRef]
  40. Chertow, M.R. “Uncovering” Industrial Symbiosis. J. Ind. Ecol. 2007, 11, 11–30. [Google Scholar] [CrossRef]
  41. Symbiosis Institute. Available online: http://www.symbiosis.dk/ (accessed on 23 July 2019).
  42. Lombardi, R. Non-technical barriers to (and drivers for) the circular economy through industrial symbiosis: A practical input. Econ. Policy Energy Environ. 2017. [Google Scholar] [CrossRef]
  43. Desrochers, P. Industrial symbiosis: The case for market coordination. J. Clean. Prod. 2004, 12, 1099–1110. [Google Scholar] [CrossRef]
  44. Golev, A.; Corder Glen, D.; Giurco Damien, P. Barriers to Industrial Symbiosis: Insights from the Use of a Maturity Grid. J. Ind. Ecol. 2014, 19, 141–153. [Google Scholar] [CrossRef]
  45. Tudor, T.; Adam, E.; Bates, M. Drivers and limitations for the successful development and functioning of EIPs (eco-industrial parks): A literature review. Ecol. Econ. 2007, 61, 199–207. [Google Scholar] [CrossRef]
  46. Fichtner, W.; Tietze-Stöckinger, I.; Frank, M.; Rentz, O. Barriers of interorganisational environmental management: Two case studies on industrial symbiosis. Prog. Ind. Ecol. Int. J. 2005, 2, 73–88. [Google Scholar] [CrossRef]
  47. Mortensen, L.; Kørnøv, L. Critical factors for industrial symbiosis emergence process. J. Clean. Prod. 2019, 212, 56–69. [Google Scholar] [CrossRef]
  48. Domenech, T.; Bleischwitz, R.; Doranova, A.; Panayotopoulos, D.; Roman, L. Mapping Industrial Symbiosis Development in Europe typologies of networks, characteristics, performance and contribution to the Circular Economy. Resour. Conserv. Recycl. 2019, 141, 76–98. [Google Scholar] [CrossRef]
  49. Van Berkel, R.; Willems, E.; Lafleur, M. Development of an industrial ecology toolbox for the introduction of industrial ecology in enterprises—I. J. Clean. Prod. 1997, 5, 11–25. [Google Scholar] [CrossRef]
  50. Kastner, C.A.; Lau, R.; Kraft, M. Quantitative tools for cultivating symbiosis in industrial parks; a literature review. Appl. Energy 2015, 155, 599–612. [Google Scholar] [CrossRef]
  51. Ashton, W.S.; Chopra, S.S.; Kashyap, A.R. Life and Death of Industrial Ecosystems. Sustainability 2017, 9, 605. [Google Scholar] [CrossRef] [Green Version]
  52. Siskos, I.; Wassenhove, L.N.V. Synergy Management Services Companies: A New Business Model for Industrial Park Operators. J. Ind. Ecol. 2017, 21, 802–814. [Google Scholar] [CrossRef]
  53. Vladimirova, D.; Miller, K.; Evans, S. Lessons Learnt and Best Practices for Enhancing Industrial Symbiosis in the Process Industry; Scaler: Brussels, Belgium, 2018. [Google Scholar]
  54. Homrich, A.S.; Galvão, G.; Abadia, L.G.; Carvalho, M.M. The circular economy umbrella: Trends and gaps on integrating pathways. J. Clean. Prod. 2018, 175, 525–543. [Google Scholar] [CrossRef]
  55. Deutz, P.; Gibbs, D. Industrial Ecology and Regional Development: Eco-Industrial Development as Cluster Policy. Reg. Stud. 2008, 42, 1313–1328. [Google Scholar] [CrossRef] [Green Version]
  56. Ogé, S.; Mendez Alva, F.; Bredimas, A. Industrial Symbiosis Guide for Identifying Opportunities & Conceptualising Business Relations; ESCP Europe Business School: Berlin, Germany, 2019; p. 30. [Google Scholar]
  57. Cervo, H.; Bungener, S.; Méchaussie, E.; Kantor, I.; Zwaenepoel, B.; Maréchal, F.; Van Eetvelde, G. Virtual Sector Profiles for Innovation Sharing in Process Industry—Sector 01: Chemicals. In Proceedings of the Sustainable Design and Manufacturing, Bologna, Italy, 26–28 April 2017; Campana, G., Howlett, R.J., Setchi, R., Cimatti, B., Eds.; Springer: Cham, Switzerland, 2017; Volume 68, pp. 569–578. [Google Scholar]
  58. Cervo, H.; Ferrasse, J.-H.; Descales, B.; Van Eetvelde, G. Blueprint: A methodology facilitating data exchanges to enhance the detection of industrial symbiosis opportunities—Application to a refinery. Chem. Eng. Sci. 2020, 211, 115254. [Google Scholar] [CrossRef]
  59. Yeo, Z.; Masi, D.; Low, J.S.C.; Ng, Y.T.; Tan, P.S.; Barnes, S. Tools for promoting industrial symbiosis: A systematic review. J. Ind. Ecol. 2019, 23, 1087–1108. [Google Scholar] [CrossRef] [Green Version]
  60. EPOS. Enhanced Energy and Resource Efficiency and Performance in Process Industry Operations via Onsite and Cross-Sectorial Symbiosis|SPIRE. Available online: https://www.spire2030.eu/epos (accessed on 3 December 2018).
  61. Green, K.; Randles, S. Industrial Ecology and Spaces of Innovation; Social and Political Science 2010 and before; Edward Elgar Publishing Limited: Cheltenham, UK, 2006; ISBN 978-1-84542-097-0. [Google Scholar]
  62. Morales, E.M.; Diemer, A.; Cervantes, G.; Carrillo-González, G. “By-product synergy” changes in the industrial symbiosis dynamics at the Altamira-Tampico industrial corridor: 20 Years of industrial ecology in Mexico. Resour. Conserv. Recycl. 2019, 140, 235–245. [Google Scholar] [CrossRef]
  63. Laybourn, P.; Morrissey, M. National Industrial Symbiosis Programme: The Pathway to a Low Carbon Sustainable Economy; International Synergies Ltd.: Birmingham, UK, 2009; ISBN 978-0-9564235-0-4. [Google Scholar]
  64. Velenturf, A.P.M. Promoting industrial symbiosis: Empirical observations of low-carbon innovations in the Humber region, UK. J. Clean. Prod. 2016, 128, 116–130. [Google Scholar] [CrossRef]
  65. Grant, G.B.; Seager, T.P.; Massard, G.; Nies, L. Information and Communication Technology for Industrial Symbiosis. J. Ind. Ecol. 2010, 14, 740–753. [Google Scholar] [CrossRef]
  66. Maqbool, A.S.; Piccolo, G.E.; Zwaenepoel, B.; Eetvelde, G.V. A Heuristic Approach to Cultivate Symbiosis in Industrial Clusters Led by Process Industry. In Proceedings of the Sustainable Design and Manufacturing, Bologna, Italy, 26–28 April 2017; Springer: Cham, Switzerland, 2017; pp. 579–588. [Google Scholar]
  67. Hill, T.; Westbrook, R. SWOT analysis: It’s time for a product recall. Long Range Plann. 1997, 30, 46–52. [Google Scholar] [CrossRef]
  68. Baas, L.W.; Boons, F.A. An industrial ecology project in practice: Exploring the boundaries of decision-making levels in regional industrial systems. J. Clean. Prod. 2004, 12, 1073–1085. [Google Scholar] [CrossRef]
  69. European Commission. Reference Documents under the IPPC Directive and the IED. Available online: http://eippcb.jrc.ec.europa.eu/reference/ (accessed on 5 December 2018).
  70. Chertow, M.R.; Lombardi, D.R. Quantifying Economic and Environmental Benefits of Co-Located Firms. Environ. Sci. Technol. 2005, 39, 6535–6541. [Google Scholar] [CrossRef] [Green Version]
  71. Chopra, S.S.; Khanna, V. Understanding resilience in industrial symbiosis networks: Insights from network analysis. J. Environ. Manag. 2014, 141, 86–94. [Google Scholar] [CrossRef]
  72. Maillefert, M.; Robert, I. Coopération et construction des territoires: Quels leviers communs autour de l’écologie industrielle et de l’économie de la fonctionnalité? In Proceedings of the Territoires Méditerranéens: Agriculture, Alimentation et Villes, Montpellier, France, 7–9 July 2015; p. 17. [Google Scholar]
  73. Bocken, N.M.P.; Rana, P.; Short, S.W. Value mapping for sustainable business thinking. J. Ind. Prod. Eng. 2015, 32, 67–81. [Google Scholar] [CrossRef] [Green Version]
  74. Bocken, N.; Short, S.; Rana, P.; Evans, S. A Value Mapping Tool for Sustainable Business Modelling; Emerald Group Publishing Limited: Bingley, UK, 2013. [Google Scholar]
  75. Decouzon, C.; Maillefert, M. Evaluer des projets d’écologie industrielle sur des parcs d’activité: Des synergies au territoire. Géogr. Écon. Soc. 2012, 14, 411–434. [Google Scholar] [CrossRef]
  76. Korona Inzeniring Dd. D3.3—Technology and Management Database for Cross-Sectorial IS; Korona Inzeniring Dd: Ljubljana, Slovenia, 2017. [Google Scholar]
  77. Simapro SimaPro|The World’s Leading LCA Software. Available online: https://simapro.com/ (accessed on 12 November 2019).
  78. Ecoinvent Ecoinvent. Available online: https://www.ecoinvent.org/ (accessed on 12 November 2019).
  79. Pizzol, M.; Weidema, B.; Brandão, M.; Osset, P. Monetary valuation in Life Cycle Assessment: A review. J. Clean. Prod. 2015, 86, 170–179. [Google Scholar] [CrossRef]
  80. Nahapiet, J.; Ghoshal, S. Social Capital, Intellectual Capital, and the Organizational Advantage. Acad. Manag. Rev. 1998, 23, 242–266. [Google Scholar] [CrossRef]
  81. Dussuc, B.; Geindre, S. Capital Social, Théorie des Réseaux Sociaux et Recherche en PME: Une Revue de la Littérature; 11ème congrès CIFEPME (Congrès International francophone en entrepreunariat et PME), Brest, France, Octobre 2012; CIFEPME: Brest, France, 2012. [Google Scholar]
  82. OECD. OECD Territorial Outlook; OECD Publications: Paris, France, 2001; ISBN 92-64-18602-6. [Google Scholar]
  83. Lacquement, G.; Chevalier, P. Capital territorial et développement des territoires locaux, enjeux théoriques et méthodologiques de la transposition d’un concept de l’économie territoriale à l’analyse géographique. Ann. Geogr. 2016, 5, 490–518. [Google Scholar] [CrossRef]
  84. Camagni, R. Compétitivité territoriale: La recherche d’avantages absolus. Reflets Perspect. Econ. 2006, Tome XLV, 95–115. [Google Scholar] [CrossRef]
  85. Camagni, R. Modelling Features of Regional Development and the Concept of Territorial Capital; Colloquium on Sustainability, Disparities and Polycentricity: Praha, Czech Republic, 2009. [Google Scholar]
  86. Maillefert, M.; Robert, I. Nouveaux modèles économiques et création de valeur territoriale autour de l’économie circulaire, de l’économie de la fonctionnalité et de l’écologie industrielle. Rev. DEcon. Reg. Urbaine 2017, 5, 905–934. [Google Scholar] [CrossRef]
  87. Osterwalder, A.; Pigneur, Y. Business Model—Nouvelle Génération: Un Guide pour Visionnaires, Révolutionnaires et Challengers; Pearson: London, UK, 2017; ISBN 978-2-7440-6688-7. [Google Scholar]
  88. Joyce, A.; Paquin, R.L. The triple layered business model canvas: A tool to design more sustainable business models. J. Clean. Prod. 2016, 135, 1474–1486. [Google Scholar] [CrossRef]
  89. Schaltegger, S.; Hansen, E.G.; Lüdeke-Freund, F. Business Models for Sustainability: Origins, Present Research, and Future Avenues. Organ. Environ. 2016, 29, 3–10. [Google Scholar] [CrossRef]
  90. EPOS. EPOS User Club. Available online: https://epos.userecho.com/ (accessed on 19 February 2019).
  91. Kantor, I.; Wallerand, A.S.; Kermani, M.; Bütün, H.; Santecchia, A.; Norbert, R.; Cervo, H.; Arias, S.; Wolf, F.; Van Eetvelde, G.; et al. Thermal profile construction for energy-intensive industrial sectors. In Proceedings of the Proceedings of ECOS 2018—The 31st International Conference on Efficiency, Cost, Optimization, Simulation and Environmental Impact of Energy Systems, Guimarães, Portugal, 17–22 June 2018. [Google Scholar]
  92. Linnhoff, B.; Hindmarsh, E. The pinch design method for heat exchanger networks. Chem. Eng. Sci. 1983, 38, 745–763. [Google Scholar] [CrossRef]
  93. Kantor, I. An Introduction to Virtual Sector Profiles; EPFL: Lausanne, Switzerland, 2019. [Google Scholar]
  94. Wolf, F. Mineral Blueprint; Omya: Offflingen, Switzerland, 2019. [Google Scholar]
  95. Maqbool, A.S.; Mendez Alva, F.; Van Eetvelde, G. An Assessment of European Information Technology Tools to Support Industrial Symbiosis. Sustainability 2019, 11, 131. [Google Scholar] [CrossRef] [Green Version]
  96. Luciano, A.; Barberio, G.; Mancuso, E.; Sbaffoni, S.; La Monica, M.; Scagliarino, C.; Cutaia, L. Potential Improvement of the Methodology for Industrial Symbiosis Implementation at Regional Scale. Waste Biomass Valorization 2016, 7, 1007–1015. [Google Scholar] [CrossRef]
  97. Trokanas, N.; Cecelja, F.; Raafat, T. Semantic input/output matching for waste processing in industrial symbiosis. Comput. Chem. Eng. 2014, 66, 259–268. [Google Scholar] [CrossRef] [Green Version]
  98. Cecelja, F.; Raafat, T.; Trokanas, N.; Innes, S.; Smith, M.; Yang, A.; Zorgios, Y.; Korkofygas, A.; Kokossis, A. e-Symbiosis: Technology-enabled support for Industrial Symbiosis targeting Small and Medium Enterprises and innovation. J. Clean. Prod. 2015, 98, 336–352. [Google Scholar] [CrossRef] [Green Version]
  99. Aid, G.; Eklund, M.; Anderberg, S.; Baas, L. Expanding roles for the Swedish waste management sector in inter-organizational resource management. Resour. Conserv. Recycl. 2017, 124, 85–97. [Google Scholar] [CrossRef]
  100. Bredimas, A.; Ogé, S.; Quintana, J.-B.; Camuzeaux, E. Material and Energy flow management tools overview for Circular economy—Software for Industrial Symbiosis. Extended abstract; Strane Innovation SAS: Paris, France, June 2019; p. 14. [Google Scholar]
  101. Van Capelleveen, G.; Amrit, C.; Yazan, D.M. A Literature Survey of Information Systems Facilitating the Identification of Industrial Symbiosis. In From Science to Society; Otjacques, B., Hitzelberger, P., Naumann, S., Wohlgemuth, V., Eds.; Springer International Publishing: Cham, Switzerland, 2018; pp. 155–169. [Google Scholar]
  102. Benedetti, M.; Holgado Granados, M.; Evans, S. Prototype Library of Case Studies Linked to a Waste Database; Maestri: Brussels, Belgium, 2017. [Google Scholar]
  103. Fraccascia, L.; Magno, M.; Albino, V. Business models for industrial symbiosis: A guide for firms. In Proceedings of the Procedia Environmental Science, Engineering and Management, Rimini Fiera, Italy, 8–11 November 2016; Volume 2, pp. 83–93. [Google Scholar]
  104. Magnusson, T.; Andersson, H.; Ottosson, M. Industrial ecology and the boundaries of the manufacturing firm. J. Ind. Ecol. 2019, 23, 1211–1225. [Google Scholar] [CrossRef]
  105. Fraccascia, L.; Giannoccaro, I.; Albino, V. Business models for industrial symbiosis: A taxonomy focused on the form of governance. Resour. Conserv. Recycl. 2019, 146, 114–126. [Google Scholar] [CrossRef]
  106. Tsvetkova, A.; Gustafsson, M. Business models for industrial ecosystems: A modular approach. J. Clean. Prod. 2012, 29–30, 246–254. [Google Scholar] [CrossRef]
  107. Shafer, S.M.; Smith, H.J.; Linder, J.C. The power of business models. Bus. Horiz. 2005, 48, 199–207. [Google Scholar] [CrossRef]
  108. Galper, J. Three Business Models for the Stock Exchange Industry. J. Invest. 2001, 10, 70–78. [Google Scholar] [CrossRef]
  109. Gebauer, J.; Ginsburg, M. The US Wine Industry and the Internet: An Analysis of Success Factors for Online Business Models. Electron. Mark. 2003, 13, 59–66. [Google Scholar]
  110. Baden-Fuller, C. Strategic Innovation, Corporate Entrepreneurship and Matching Outside-in to Inside-out Approaches to Strategy Research1. Br. J. Manag. 1995, 6, S3–S16. [Google Scholar] [CrossRef]
  111. Chesbrough, H.; Garman, A.R. Harvard Business Review; Harvard Business Publishing: Cambridge, MA, USA, 2009. [Google Scholar]
  112. Simanis, E.; Hart, S. Innovation from the Inside Out. MIT Sloan Management Review. 1 July 2009. Available online: https://sloanreview.mit.edu/article/innovation-from-the-inside-out (accessed on 5 December 2019).
  113. Simon, H.A. The Architecture of Complexity. Proc. Am. Philos. Soc. 1962, 106, 467–482. [Google Scholar]
  114. Lüdeke-Freund, F. Towards a Conceptual Framework of “Business Models for Sustainability”; Social Science Research Network: Rochester, NY, USA, 2010. [Google Scholar]
  115. Boons, F.; Spekkink, W.; Mouzakitis, Y. The dynamics of industrial symbiosis: A proposal for a conceptual framework based upon a comprehensive literature review. J. Clean. Prod. 2011, 19, 905–911. [Google Scholar] [CrossRef]
  116. Bachmann, T.M. Optimal Pollution: The Welfare Economic Approach to Correct Market Failures. In Encyclopedia of Environmental Health; Nriagu, J.O., Ed.; Elsevier: Burlington, MA, USA, 2011; pp. 264–274. ISBN 978-0-444-52272-6. [Google Scholar]
  117. Frischknecht, R. Life cycle inventory analysis for decision-making: Scope-Dependent Inventory System Models and Context-Specific Joint Product Allocation. Int. J. Life Cycle Assess. 1998, 3, 67. [Google Scholar] [CrossRef]
  118. Weidema, B.P. New Developments in the Methodology for LCA. In Proceedings of the 3rd International Conference on Ecobalance, Tsukuba, Japan, 25–27 November 1998; Springer: Tsukuba, Japan, 1998. [Google Scholar]
  119. Loiseau, E.; Junqua, G.; Roux, P.; Maurel, P.; Bellon-Maurel, V. Évaluation Environnementale de Territoires: Apports, Limites et Adaptation du Cadre Méthodologique de l’Analyse du Cycle de Vie; COLEIT: Troyes, France, 2012; p. 9. [Google Scholar]
  120. Dumoulin, F. Évaluation Environnementale d’un Projet de Symbiose Industrielle Territoriale: Application à un Projet de Gestion Territorialisée de Résidus Organiques Valorisés en Agriculture dans L’ouest de la Réunion. Ph.D. Thesis, Université de la Réunion, Réunion, France, 2016. [Google Scholar]
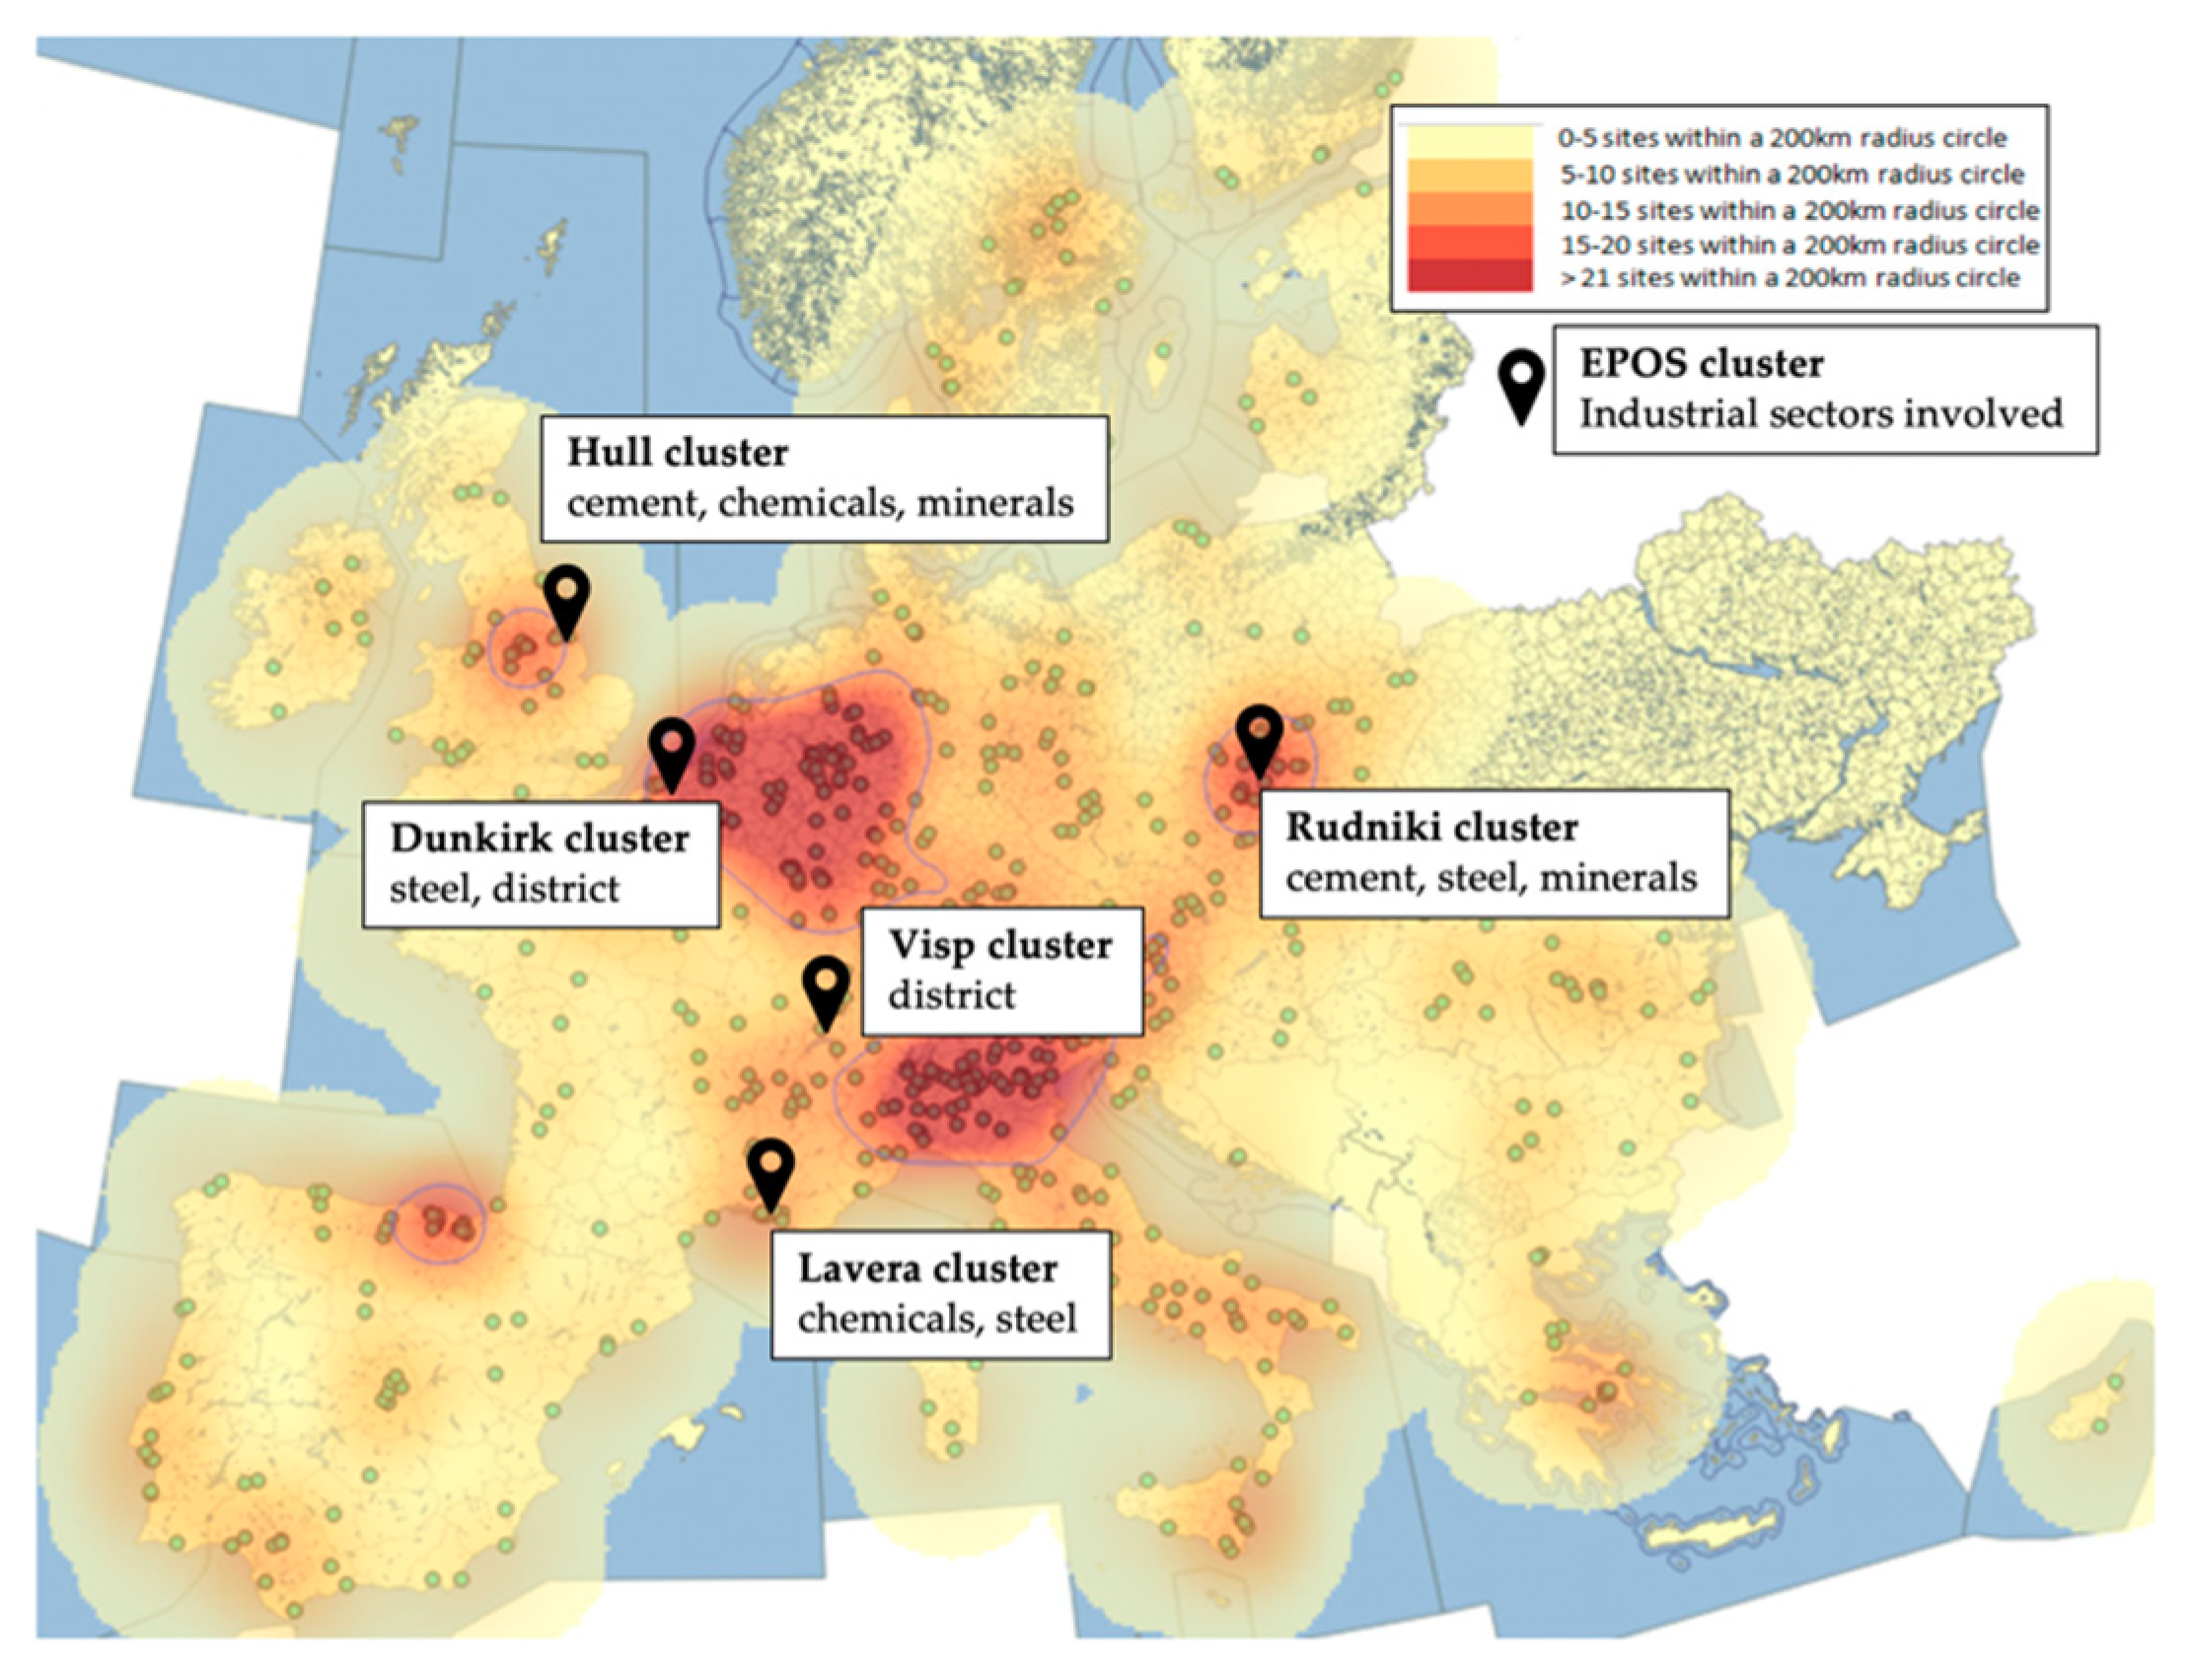
Figure 1. Map of the European IS hot spots and EPOS clusters (adapted from [25]).
Sustainability 11 06940 g001
Figure 2. The EPOS Hull cluster (UK).
Sustainability 11 06940 g002
Figure 3. IS guide scheme (adapted from [56]).
Sustainability 11 06940 g003
Figure 4. Hull case study—BaU (a) and IS business case scenario (b).
Sustainability 11 06940 g004
Figure 5. IS business model canvas filled in for the Hull case.
Sustainability 11 06940 g005
Figure 6. Cement blueprint heat profile (black dotted line [91]) and heat integration with the distillation reboiler (red dotted line).
Sustainability 11 06940 g006
Figure 7. Final configuration options for the Hull IS case.
Sustainability 11 06940 g007
Table 1. List of identified IS opportunities in the Hull cluster with their associated score of interest.
IS OpportunitySender(s)Receiver(s)Interest Score a
Use PLF b stream as an AF c in cement kilnChemicalsCement3.5
Reuse calcium carbonate rich reject stream MineralsCement3
Cement Kiln DustCementMinerals3
Capture CO2 and use it in a greenhouse Cement, MineralsLocal community2.3
Reuse spent catalystChemicalsAll industries2.3
Install micro-turbines on the river HumberAll industriesLocal community2.3
Organise combined health and safety trainingsEngineeringAll industries2.3
Recover heat from exhaust gasMineralsCement2
Recover heat from condensatesChemicalsAll industries2
Valorise low temperature heat with district heating networkCementLocal community2
Use excess cooling capacityChemicalsAll industries1.7
Recover heat from exhaust gasCementAll industries1.6
Reuse cardboard, plastic, rubber wastesCementAll industries1.3
a Aggregated scores using the answers from all industrial partners, b Primary Liquid Fuel, c Alternative Fuel
Table 2. Hull cluster SWOT analysis.
Helpful
(to Achieve the Object)
Harmful
(to Achieve the Object)
Internal origin
  • Established industries with long history of embeddedness in the local industry and community
  • Active paticipation in the local initiatives for policy recommendation
  • Willingness to collaborate
  • All partners belong to stable markets
  • High dependence on none-renewable energy
  • Established industry with large investments in frastructure, which makes it harder to implement radical innovations
  • Geographical proximity is not optimum for some type of exchanges
  • Currently the volumes of sharable streams for industry symbioses are not high enough to incite interest by the partners
External origin
  • Local finacial incentives to install wind turbine (2015), for which all partners can invest collectively
  • All opportunities identified in Table 1
  • Stricter regulations on carbon emissions
  • Stricter regulations on permissible PM emissions
  • Stricter regulations for increased energy efficiency
  • Competition in- and outside EU
  • Uncertain implications of Brexit
Table 3. Economic values for the PLF business case.
DescriptionTaken into AccountRemarks
Positive valuesCost reduction for the chemical plant related to the steam procurement.YesNoticeable but marginal in comparison with the value created by the internal reuse of the acid and solvent fractions of the PLF.
Cost reduction for the cement producer related to the use of a cheaper combustible (organic fraction of the PLF) compared to conventional fuels.YesNoticeable but marginal in comparison with the value created by the internal reuse of the acid and solvent fractions of the PLF.
Additional revenues for the chemical plant related to the sale of the PLF organic fraction.YesThey are assumed to be equal to zero, i.e., the organic fraction of the PLF stream is sent for free to the cement producer.
Cost reduction for the chemical plant related to the internal reuse of the acid and solvent fractions.YesHighest created values.
Negative valuesTreatment cost for separating and purifying the PLF stream.YesVery low compared to the positive values created thanks to the internal reuse of the PLF acid and solvent fractions.
Management cost for handing and blending the PLF organic fraction with the cement producer AFs mix.YesNegligible.
Transportation cost for first conveying the stream to the treatment facility and then to the waste fuel provider of the cement producer.YesNegligible.
Revenue losses by the steam provider.NoThe PLF was initially generating issues with the steam boiler. The steam producer is thus satisfied by the symbiosis creation. Therefore, this negative value is not taken into account.
Revenue losses by the conventional fuel provider of the cement producer.NoVery low business impact. Therefore, it is neglected.
Revenue losses of the raw materials suppliers of the chemical plant.NoVery low business impact. Therefore, it is neglected.
Table 4. Opportunities and challenges observed for the PLF business case.
Opportunity/ChallengeRecommendations
Legal/policiesThe PLF stream waste and hazardous status will require a modification in the fuel burning certification of the cement producer. This will represent an administrative burden.Dedicate time to follow the administrative procedure and/or consult leading experts.
Economical/instrumentsA decision from the board is required to validate the level of investment (payback time is exceeding 2 years).Look for financial incentives.
Spatial/planningDangerous goods transported by road or waterway require special permits.Take the dangerous status of the stream into account when choosing the third party that would be responsible for transporting the stream.
Technical/engineeringExpert opinion suggests that it is not possible to blend the PLF stream as it is with the fuel mix that is currently used by the cement producer.Purify and separate the different fractions composing the PLF stream.
Problems with the cement burner are anticipated due to the high flammability of the PLF stream.Consider different technology options for the burner such as adsorption on activated carbon.
Thanks to the symbiosis, the environmental performance of both parties should be improved.
Social/responsibilitiesThe opportunity is detected in the framework of an H2020 EU project, which facilitates knowledge and information exchanges.Put mechanisms in place to ensure the follow-up of the symbiosis implementation once the EPOS project is over.
Table 5. Barriers to IS addressed by the EPOS methodology.
BarriersSolutionRemarks
Lack of commitment to sustainable developmentFramework that allows the evaluation of the economic, environmental, social and regional values created or destroyed by the IS under consideration.
Business case embedding essential information about the IS
The value of underutilised resources is generally poorly known by industries [53], thus the methodology contributes to raise awareness of decision-makers on the relevance to consider them as a new source of value.
Highlights the whole set of values created by the IS (economic, environmental, social and regional). This business case can be drafted by an IS facilitator thus reducing the need for companies to dedicate specific resources for the opportunity identification and assessment [54,55].
Lack of information sharingBlueprints providing information about the flows of materials, energy, and services of a given industrial sector.
Methodology that can be used by a trustworthy IS facilitator.
It facilitates data exchange without disclosing confidential information [57,58,93,94].
It facilitates the sharing of confidential data (non-disclosure agreements).
Lack of cooperation and trustCo-assessment of values.
Business model showing the distribution of benefits between stakeholders.
Opens discussion channels, creates trust and shows the benefits of cooperation.
Benefits, risks, changes are highlighted in a clear and transparent way for all the stakeholders.
Lack of awareness from communitiesEnvironmental, social and regional values are assessed in collaboration with the stakeholders, including the peripheral ones.Public authorities, associations, communities are invited to assess the symbiosis which helps raising their awareness about the benefits it can create.
Economic infeasibilityLook at alternative possibilities besides the traditional market mechanisms.
Extend the scope from IS to broader sustainability practices.
Other economic and non-market value transfer mechanisms are taken into account, which might trigger the IS economic feasibility.
Can lead to the identification of sources with a greater value.