Article

Different Factors Affecting Vacant Housing According to Regional Characteristics in South Korea

1
Department of Civil and Environmental Engineering, Seoul National University, Seoul 08826, Korea
2
Smart City Research Center, Advanced Institute of Convergence Technology, Suwon 16229, Korea
*
Authors to whom correspondence should be addressed.
Sustainability 2019, 11(24), 6913; https://doi.org/10.3390/su11246913
Submission received: 30 September 2019 / Revised: 27 November 2019 / Accepted: 30 November 2019 / Published: 4 December 2019
(This article belongs to the Special Issue Shrinking Cities—Testing Ground for Sustainability)

Abstract

:
In recent years, many cities in developed countries have struggled with housing vacancy. Empty homes are accompanied by social problems such as vandalism, arson, unsanitary environments, and collapse risk. Vacant houses also have negative effects on the value of nearby properties and their local communities. Accordingly, there have been various policy responses to tackle this problem. In spite of these efforts, however, the number of vacant houses continues to increase alongside a population decrease and imprudent developments. In South Korea, the number of vacant houses has increased since the 1990s, and central and local governments started developing plans and policies to resolve the problem from 2010. However, most of these policies have many similarities regardless of their differing regional conditions and contexts. Housing vacancy varies according to regions, its magnitude, surrounding environments or housing types, and thus calls for multilateral approaches. This article, therefore, aims to identify distributional characteristics of vacant houses in South Korea, and categorize them into three groups with regional contexts using cluster analysis. The study further found that there are differences in affecting factors of vacant houses by type through the use of a multiple regression model. Based on the analysis, the ways of managing housing vacancy for sustainable development are discussed.

1. Introduction

1.1. The Evolution of the Vacant House Phenomenon

Housing vacancy is a symptom of shrinking cities, areas which have experienced population loss, economic decline, and physical decay [1,2]. Although a level of housing vacancy works as a lubricant for a stable housing market [3], vacant houses at too high a level could accelerate urban deterioration in shrinking cities or result in faster urban decline in even large cities, thereby bringing about various kinds of social problems [4,5]. According to the broken windows theory, empty houses which are not properly managed or controlled could cause diverse social crimes such as vandalism, anti-social behavior, or arson [6]. They also could undermine the quality of the residential environment by deteriorating urban aesthetics and sanitary conditions [7,8,9,10]. Such negative impacts caused by housing vacancy could spread to surrounding areas leading to further housing abandonment and regional decline [11,12,13]. In recent years, with social and demographic changes such as low fertility rate and rapid aging, this phenomenon is being exacerbated and increasingly recognized as a significant urban issue in many countries [14].
In South Korea, the number of vacant houses in 2015 was 1.07 million, which accounts for 6.5% of total housing stocks (Figure 1) [15]. Considering that the figure was about 0.4 million in 1995, when empty houses first began to be counted, this increase in the number of empty homes in 20 years is quite large. In addition, it is estimated that the number will exceed 3 million which will account for 10% of all residences by 2050 [16]. The ratio of vacant houses in rural areas compared to the total number of houses is higher than that in urban areas (Figure 2). Comparing to the total vacant houses, however, the ratio of vacant houses is higher in urban areas than in rural areas and the percentage gap has gradually widened since 2000 (Figure 3). It can thus be said that the problem of vacant houses in rural areas is more serious than that in urban areas in terms of quality. Nonetheless, the continuous increase in the share of vacant homes in urban areas may imply that housing vacancy is no longer a matter solely for shrinking cities and rural areas, and pose potential risks for dynamic urban environments.
In other words, as the number of vacant houses increase in South Korea, the patterns and mechanisms by which vacant houses occur have been evolving. Consequently, characteristics, affecting factors and effects of vacant houses vary depending on their types and regional contexts. Nevertheless, the central and local governments have invested public funds in implementing policies and regulations to remove vacant houses, without understanding of, or consideration for, varying local circumstances. In particular, efforts have been made to revitalize declining cities located in the provinces by converting empty homes into open public spaces or affordable housing [17,18,19]. For example, Gunsan, one of South Korea’s shrinking cities, has subsidized $3000 for the removal of vacant houses and up to $10,000 for the remodeling of these houses for public use. Seoul, a metropolitan city in South Korea, has supported 50% of the remodeling costs per house since 2015, if a house that has been vacant for more than 6 months is remodeled as a rental house for low-income households at 80% of the market price. However, these attempts deal with only superficial symptoms, rather than the fundamental elements affecting vacant houses and have not led to tangible results thus far.
This paper aims to extend the understanding of the characteristics of vacant houses in South Korea and classify the correlative factors on housing vacancy by regional context in order to eradicate the vicious cycle. First of all, the researchers analyzed urban features and distributional patterns of vacant houses at the regional level and categorized them into three types: declining city type, growing city type, and stagnant city type. Following this, the differences in factors affecting housing vacancy are examined by type. Furthermore, the problems of current policies and regulations on vacant houses are discussed and the research suggests policy implications for sustainable urban development.

1.2. Literature Review

Many researchers have tried to identify the factors contributing to housing vacancy, and the evaluations of some factors have been mixed. Based on prior studies, these factors can be categorized into three: socio-economic factors, physical factors, and housing market factors. First, socio-economic factors include the population decline, low birth rate, ethnicity, low-income household, education level and employment rate [20,21,22]. Through multiple regression analysis, researchers found that population decrease, low birth rate, rate of low-income household and non-white people have positive correlation with vacant houses, while the education level and the employment rate have a negative correlation.
Physical factors refer to environmental features that affect the occurrence of empty houses. Aged housing is one of the most typical physical factors [23,24]. Despite aged houses being prone to physical obsolescence, owners are reluctant to properly manage them due to high costs of repair and maintenance. Consequently, old houses are likely to be shunned by customers in the real estate market, thus remaining vacant. Jeon and Kim (2016) and Park and Oh (2018) argued that the irregular shape or small size of lots and narrow roads may also generate housing vacancy in terms of physical factors at a micro level.
The ratio of housing supply to households, housing or land price and housing type can be categorized under housing market factors [14,24,25]. According to the principle of supply and demand, excessive housing supply causes vacant housing. On the other hand, regions with higher housing and land prices have a lower rate of empty houses as more demand than supply causes a rise in housing prices [25].
In addition, Morkell (2014) and Han (2016) found, through empirical research, that empty houses tend to occur in a spatial cluster, and the condition of neighboring houses is an important factor in housing vacancy [26,27]. These factors usually do not work separately but in combination. Some further studies predicted vacancy patterns in the future, or the probability of housing abandonment, based on an analysis of the causal factors [28,29,30].
Previous studies have tried to identify the factors affecting the occurrence of empty houses in a variety of ways, but the studies covered mostly small areas or a single city. Studies of empty houses in South Korea began relatively late, focusing on rural areas with narrow research scope. While analyzing vacant houses at the micro-level is important, it is also necessary to comprehensively understand the characteristics of vacant houses in South Korea and to link them with regional context for effective policy making. Through this study, therefore, all cities in the country were clustered using the ratio of vacant houses and urban characteristics, and they were categorized by their features. Furthermore, the researchers found out differences in factors affecting housing vacancy according to the type.

2. Materials and Methods

2.1. Definition of Vacant Houses

A vacant house is generally defined as one that has not been occupied or used for a certain period of time [14], however there is still no single unified definition within academia [27]. The definition of a vacant house differs in each country and can even vary by region and law in the same country. In Japan, for example, according to the Law for Special Measures to Promote Dealing with Vacant Houses, which came into effect in 2015, a vacant house is defined in two ways: a vacant house and a specific vacant house. A vacant house refers to a building and its site that is not inhabited or used, except for being possessed or managed by a national or local public body. A specific vacant house, on the other hand, can be designated if it poses serious harm to residents’ safety or health, or causes serious damage to the landscape [31]. The United Kingdom defines an empty house as a property which is unoccupied and substantially unfurnished [32].
In South Korea, a vacant house has been managed under various laws such as the Building Act, Agricultural and Fishing Villages Improvement Act, Act on the Improvement of Urban Areas and Residential Environments, and the Special Act on Promotion of and Support for Urban Regeneration [33]. As of September 2019, in addition, 111 local ordinances for management and support of vacant houses are in place across the country [34]. The Building Act and Agricultural and Fishing Villages Improvement Act, and most local ordinances, define an empty home as a house where no one has lived or used the space for more than one year from the date of confirmation of occupation or use. However, several local governments limit the period of vacancy to six months or have no criteria for the period at all.
As the Act on Special Cases Concerning Unoccupied Houses or Small-scale Housing Improvement went into effect on February 2018, regulations on the management of vacant houses, which had been sporadic and unsystematic, were improved. According to the Special Act, the term ‘vacant house’ means a house that has not been occupied or used for at least one year as of the date the head of local government has verified that the house was occupied or used. In other words, even an old, long-term vacant house cannot be defined as an ‘official’ vacant house without the confirmation of the heads of local government. In addition, public rental housing, unsold apartments less than 5 years old, and houses for temporary uses such as a second house are excluded.
On the other hand, the National Statistical Office of Korea, the only institution providing official vacant house data, considered vacant houses to be uninhabited housing during the investigation. Houses to be demolished by redevelopment or reconstruction, and deserted houses with less than a 50% destruction rate, are excluded. The empty periods are divided into 4 groups: ‘less than 3 months’; ‘3–6 months’; ‘6–12 months’; and ‘more than 12 months.’ The reasons for vacancy are classified as ‘sold rented moved’, ‘unsold∙not moving in’, ‘currently under repair’, ‘temporary use’, ‘commercial’, and ‘other’; ‘other’ type means empty houses which are not classified in the first five categories.
For the purpose of this study, vacant houses are simply limited to those empty for more than one year, except for detailed conditions. This is because most of related regulations and laws in South Korea define vacant house based on a vacancy period. Particularly, the highest law on vacant houses sets the vacancy period to more than one year even though the period is limited to after confirmation from the heads of local government. Another reason is that short-term vacancy of less than a year can often occur for general real estate transactions or repairs. In addition, most of the empty homes that have caused serious social problems have been unoccupied for a long period of more than a year.

2.2. Research Areas and Methods

This study covered 230 regions in South Korea. The analysis unit is ‘Si-Gun-Gu,’ the second lowest-level administrative division. According the Local Autonomy Act, a Gu is an autonomous district within the jurisdiction of a Special Metropolitan City or a Metropolitan City. Gus have the most urban features among the three administrative divisions and there are 69 Gus in total as of 2010. A Si refers to a municipal administrative unit under provincial jurisdiction. The number of Sis is 75 and they generally contain a population of between 150,000 and 1,000,000. Lastly, a Gun is an administrative unit which has less population and more rural characteristics than the other two administrative divisions. Of the 86 Guns, the majority are under provincial jurisdiction, but five fall within the jurisdiction of a Metropolitan City.
The research methods of the study were as follows: First, by using K-means clustering, a type of cluster analysis, the regions were classified into three groups. Cluster analysis is an extensively used method for grouping objects mixed with disparate elements into several clusters according to their similarity [35]. The reason for adopting this method is to objectively cluster cities according to regional characteristics, including the ratio of vacant houses. The regional features affecting housing vacancy were extracted through previous studies. The K value was determined to be 3, the case where the samples are most evenly distributed in each group, through several tests.
In addition, researchers conducted multiple regression analysis to identify and compare the factors contributing to housing vacancy by the types. The dependent variable is the ratio of vacant houses to total housing, and the independent variables include socioeconomic, physical, and real estate market factors. Socioeconomic factors included the ratio of the elderly population and national basic livelihood security recipients, employment rate, and the rate of change for population and enterprises. For physical factors, only the ratio of aged housing is used as an indicator at the regional level because most physical factors are related to the micro-level environment. Finally, variables representing real estate market feature are the rate of owner-occupied dwellings, diffusion ratio of house, and the ratio of apartments, detached house, and new housing (Table 1).

2.3. Materials

The statistics on vacant houses across the country have been compiled through the Population and Housing Census conducted every five years from 1995. Thus, the latest version is the 2015 data. However, only the 1995–2010 Population and Housing Census data was used in the time series analysis as it is difficult to systemically compare with the data in the previous period due to the different survey methods used. Until 2010, investigators for the Population and Housing Census visited all houses and checked if they had been inhabited. From 2015, however, the survey has been changed to aggregate data based on administrative documents, thus houses without resident registration are counted as empty houses even if a person still resides in the house. Consequentially, there is a significant gap in statistics before and after 2015. Thus, this study used the census data surveyed before 2015 for time series analysis to minimize the errors from this gap.

3. Vacant Houses in South Korea

3.1. Spatial Distribution of Vacant Houses

As of 2015, the number of vacant houses across the country exceeds one million, and a larger number of these are located in urban areas than in rural areas. Comparing the ratio of vacant houses to total housing, however, the figure in rural areas is twice as high than that in urban areas, at 11.5 percent and 5.1 percent, respectively. This indicates that rural areas, where many shrinking cities are situated, suffer from qualitative problems of housing vacancy; urban areas, on the other hand, have potential risks of vacant houses in greater quantity (Table 2).
From 2000 to 2010, as shown in Figure 5, the number of empty houses increased mainly in Gyeonggi Province, surrounding the capital Seoul, and Gyeongsang Province, located in the southeastern part of Korea (Figure 4 and Figure 5). Eight out of the top ten regions with the highest number of empty homes are in Gyeongsang Province. On the other hand, the vacant housing rate increased intensively in regions in Gangwon Province, where many mountainous and fishing villages are located (Figure 6). Half of the top regions with high empty housing rates are in Gangwon Province. Between 2005 and 2010, there was a noticeable increase in the housing vacancy rate in Jeolla Province, in the southwestern part of the country, where many agricultural areas are distributed.

3.2. Vacant Houses by Housing Type

When analyzing the characteristics of vacant houses by housing type, changes in the ratio of detached houses and apartments are most noticeable. When all empty houses are included in the statistics, regardless of the vacancy period, the main type of vacant housing is apartments, and the proportion of apartments has been increasing for all periods except in 2000 (Figure 7).
For houses unoccupied for more than one year, however, the main type of vacant housing is the detached house, followed by apartments. These results are similar to the previous analysis in that there is an increase in the proportion of apartments and a decrease in the proportion of detached houses. However, while the share of apartments has decreased significantly, that of detached houses has increased. This change comes from the fact that vacant houses for less than one year contain a large number of unsold apartments. In other words, the period of housing vacancy for detached houses is longer than that of apartments. As of 2010, specifically, the ratio of vacant houses for less than one year compared to total vacant houses is less than half for detached houses but more than three quarters for apartments.

4. Results

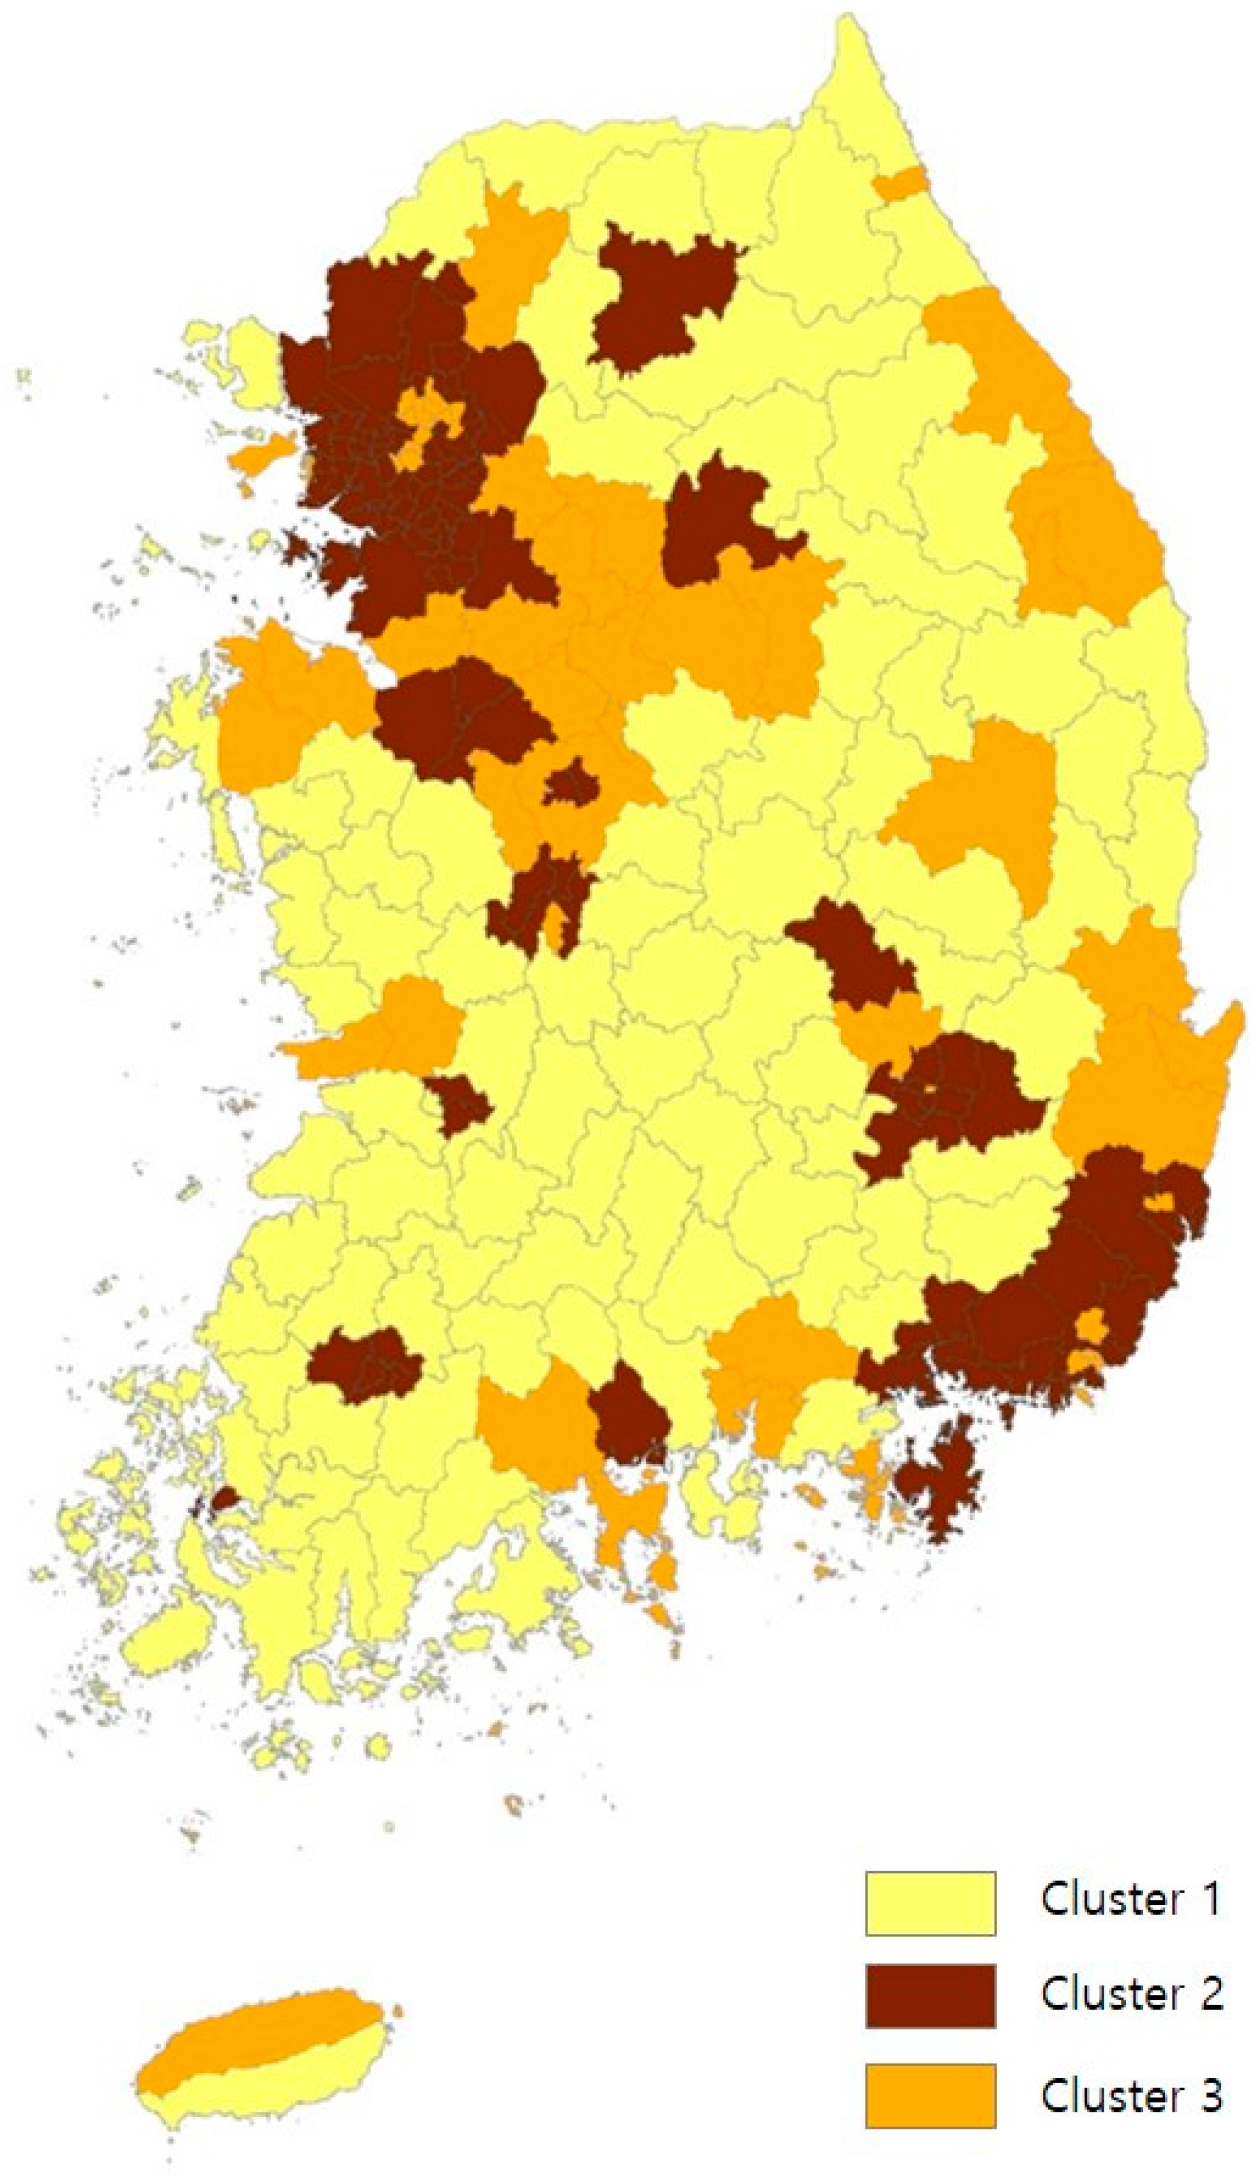
4.1. Cluster Analysis

In order to classify the 230 regions by housing vacancy and urban features, a cluster analysis was performed using 12 variables, and the maximum number of iterations was set at 10. As a result, the regions were divided into three groups: Cluster 1 has the highest ratio of vacant houses and Cluster 2 and 3 have a low ratio. The details are illustrated in Figure 8 and Table 3.
Cluster 1 is a group which has the highest ratio of vacant houses. There are 89 regions in the group, and 75 of them are Guns with strong rural characteristics; the remaining 14 regions are small local cities with a population of up to 130,000. As shown in Table 3, the ratios of elderly population, detached houses, and aged housing of Cluster 1 are significantly higher than those of the two other clusters. On the other hand, the population size and number of businesses are decreasing. According to the Special Act on Promotion of and Support for Urban Regeneration, the major indicators for determining urban decline in South Korea are decrease in population size and businesses, and the ratio of aged buildings older than 20 years [36]. Cities which meet two or more of the three sector indicators are classified as declining cities. In Cluster 1, the average rate of aged housing is about 30% and the highest is 48%. The population has decreased in 78 regions, which account for 88%, over five years (2005–2010) and the number of businesses in 46 regions has declined over three years (2007–2010). Thus, Cluster 1 can be specified as a ‘declining city type’.
Cluster 2 shows very contrasting properties with Cluster 1. Firstly, only 3 of the 75 regions in Cluster 2 are guns. Since these areas are urban-rural integration cities in a metropolitan city such as Busan, Daegu, and Ulsan, they do not have the characteristics of typical farming and fishing areas. For example, the average population of the guns of Cluster 1 is about 40,000, while the average of the 3 guns of Cluster 2 is 150,000. Of the 72 regions, 35 are located in major cities and the remaining 22, which belong to Si, are in the Seoul Metropolitan Area. Furthermore, Cluster 2 is the only group among the three with an increasing population and number of businesses, and the lowest vacant housing rate. The population has increased over five years in about three quarters of Cluster 2, with the highest growth rate at around 70%. While the ratio of apartments is the highest, that of detached house is the lowest. In addition, the number of businesses in Cluster 2 has increased by six percent, and the ratio of aged housing and elderly population is even lower than Cluster 1. These are characteristics easily found in growing cities. Therefore, Cluster 2 can be classified as a ‘growing city type’.
The ratio of vacant houses, employment, owner-occupied dwellings, and housing distribution of Cluster 3 are similar to those of Cluster 2, but the values of the remaining factors are between Cluster 1 and Cluster 2. The important properties of Cluster 3 are population change rate and rate of change for enterprises. Although the ratio of vacant houses is low, much like in Cluster 2, the population has been decreasing for five years (2005–2010) and the growth rate of businesses is low. This means that even if the ratio of vacant houses is similar, local characteristics may be different. The number of regions in urban areas is 58 and the average population is about 200,000. However, the population is decreasing in two-thirds of Cluster 3 and the number of businesses is decreasing in about 45% of the regions. Considering these changes, many of Cluster 3 seem to have lost their growth engines or are slowly declining. Therefore, Cluster 3 is categorized as a ‘stagnant city type’.

4.2. Multiple Regression Analysis

A multiple regression analysis was conducted to compare the differences of factors affecting vacant houses by types. As shown in Table 4, factors correlated to the dependent variable vary by each type. Of the 11 independent variables extracted from previous studies, the ratio of detached houses is excluded for the final model due to its high collinearity.
Cluster 1 model has the explanatory power of 58%. The ratio of elderly population and housing distribution have statistically significant positive correlations with the ratio of vacant houses. On the other hand, the rate of owner-occupied dwelling and new housing has negative correlations. This indicates that the higher the number of aged population and housing diffusion and the smaller the number of owner-occupied dwellings and new housing, the higher the probability of empty houses occurring in declining cities. Among the three groups, the coefficient of the rate of housing distribution is highest in Cluster 1 and the elderly ratio has a significant correlation in only this cluster. The reason for this may be that in Cluster 1, wherein the elderly population is high, many houses are more likely to be abandoned following the death of an elderly occupant. Thus, in declining cities, it is important to properly manage housing stocks, especially in the areas where the elderly are concentrated, to prevent vacant houses.
Cluster 2 model has the lowest R2-value, 0.41. The ratio of aged housing has greater positive correlation with empty houses than the ratio of housing distribution and shows significant affects in Cluster 2 only. This is because many regions included in Cluster 2, growing city type, are large cities, and people who live in such cities have more opportunities to choose residential environments of better quality than those who live in smaller cities or rural areas. As a result, aged houses are often ignored by potential tenants. On the other hand, the rate of owner-occupied dwellings has negative correlations and its coefficient is highest in Cluster 2. This correlation is similar to that in Cluster 1, but is greater than that in Cluster 2. For vacant houses in Cluster 2, therefore, policies are needed to curb the occurrence of aged houses, or to improve the physical environments in the areas where aged houses are concentrated.
Cluster 3 model has the highest explanatory power of 61% among the three groups. In Cluster 3, all variables that have a significant correlation with the dependent variable have a positive coefficient: the ratio of new housing and housing distribution. Comparing with Cluster 1, the sign of coefficient of new housing rates is reversed. This means that new housing negatively affects housing vacancy in shrinking cities, while yielding positive affects in stagnant cities. It can be interpreted that if new housing is supplied, individuals in Cluster 3 are more likely to move into these homes than those in Cluster 1, leaving existing homes. Thus, the supply of new housing should be carefully determined, and the housing stocks should be managed first in Cluster 3.
At the national level, the six variables have statistically significant correlations with the housing vacancy. While the ratio of elderly population, employment, housing distribution and aged housing have positive correlations, the rate of population increase, and owner-occupied dwellings have negative correlations. Of these variables, the population increase and employment rate have correlations with housing vacancy only on a national scale. On the other hand, the ratio of housing distribution positively affects the occurrence of vacancy in all three groups. The results show that the factors which have correlations with housing vacancy vary according to regional context while it is common that excessive housing supply could increase the number of vacant houses for all regions. Therefore, in order to effectively solve the problem of vacant houses, a type-specific measure should be established.

5. Discussion and Conclusions

Along with the changes in social structure, the trigger factors, distributional pattern, and characteristics of vacant houses in South Korea have become more diverse and complex. This study aimed to examine the changes and differences of vacant houses by type and suggest effective solutions to prevent the occurrence of vacant houses. Accordingly, a cluster analysis was conducted to categorize vacant houses by their characteristics. Using a multiple regression model, in addition, factors which have correlations with housing vacancy by type were identified.
As a result, the 230 regions were classified into three clusters: declining city type, growing city type, and stagnant city type. Based on the category, a multiple regression analysis was conducted to identify differences and commonalities of factors affecting vacant houses by type. The results show that it is common that the rate of housing distribution has significant correlations with housing vacancy. On the other hand, the ratio of elderly population has statistically significant positive correlations; the ratio of owner-occupied dwellings has negative correlations with housing vacancy for Cluster 1 only. In Cluster 2, the ratio of owner-occupied dwellings has the greatest negative correlations with vacant houses among the groups and the ratio of aged housing could increase vacant housing. In Cluster 3, the ratio of new housing supply has positive correlations in contrast to Cluster 1. Population increase and employment rate affect housing vacancy only at the national scale. This result implicates that the factors affecting housing vacancy vary depending on the type, even if the rate of vacant houses is similar.
Governments’ policies or measures to address vacant housing are, however, monotonous. Central and local governments have enacted laws and regulations to cope with problems related to vacant houses. Nonetheless, most local ordinances and projects suggest similar solutions regardless of region or context. For example, many local governments have implemented projects converting vacant houses into public spaces such as community gardens or parking lots. In addition, they support the cost of dismantling or remodeling private empty houses. This measure is quite simple and visually effective. However, the effect is ex post facto and temporary because it cures only the symptoms of the problem. Over time, challenges similar to those that occurred before the demolition are likely to occur again. Thus, policymakers need to establish policies in advance and delicately subdivide their measures or policies according to the characteristics of vacant houses and affecting factors in order to eradicate the problems. In declining cities, for example, it is required to first manage the houses in the areas where the elderly population is high. For vacant houses in Cluster 2, policies to improve the quality of residential environments with the high rate of aged houses are needed. Lastly, the supply of new housing in stagnant cities should be carefully determined taking into account existing housing stock.
Through this study, the researchers attempted to identify the factors which have correlations with housing vacancy and how these vary according to regional context. Based on this analysis, the researchers have made suggestions for potential policy improvements. Owing to the resolution of data available, however, there are certain study limitations. The unit of analysis is rather large, and the analysis was conducted at a macro level only. If a smaller unit of regional data or individual housing data is available, further research could multi-dimensionally diagnose and more precisely identify what brings about differences in affecting factors of housing vacancy examined in this study.

Author Contributions

Conceptualization, H.Y.; methodology, H.Y.; investigation, Y.K.

Funding

This research was supported by 2015 Convergence Research Task Support Project (No. 940-20150005) funded by the Seoul National University R&DB Foundation. This research was supported by the Creative-Pioneering Researchers Program through Seoul National University (SNU). It received additional support from the Basic Science Research Program through the National Research Foundation of Korea funded by the Ministry of Education (2018R1D1A1B07048832).

Acknowledgments

This research was supported by Institute of Construction and Environmental Engineering at Seoul National University. The authors wish to express their gratitude for the support.

Conflicts of Interest

The authors declare no conflict of interest.

References

  1. Martinez-Fernandez, C.; Audirac, I.; Fol, S.; Cunningham-Sabot, E. Shrinking cities: Urban challenges of globalization. Int. J. Urban Reg. Res. 2012, 36, 213–225. [Google Scholar] [CrossRef] [PubMed]
  2. Schilling, J.; Logan, J. Greening the rust belt: A green infrastructure model for right sizing America’s shrinking cities. J. Am. Plan. Assoc. 2008, 74, 451–466. [Google Scholar] [CrossRef]
  3. Park, S.; Byeon, E.; Lee, E.; Yeo, H.; Seong, E. Neighbourhood Regeneration with Empty Homes; Architecture and Urban Research Institute: Sejong, Korea, 2017; ISBN 979-11-5659-159-7. [Google Scholar]
  4. Mikelbank, B.A. Spatial Analysis of the Impact of Vacant, Abandoned and Foreclosed Properties; Federal Reserve Bank of Cleveland: Cleveland, OH, USA, 2008. [Google Scholar]
  5. Han, H. The impact of abandoned properties on nearby property values. Hous. Policy Debate 2014, 24, 311–334. [Google Scholar] [CrossRef]
  6. Kelling, G.L.; Wilson, J.Q. Broken windows. Atl. Mon. 1982, 249, 29–38. [Google Scholar]
  7. Accordino, J.; Johnson, G.T. Addressing the vacant and abandoned property problem. J. Urban Aff. 2000, 22, 301–315. [Google Scholar] [CrossRef]
  8. Son, E.; Maeng, H.; Lee, H. The spatio-temporal patterns of the vacant homes clusters and their impact on the neighborhood land price–The case of Busan Metropolitan city. J. Real Estate Anal. 2015, 1, 71–90. [Google Scholar] [CrossRef]
  9. Cohen, J.R. Abandoned housing: Exploring lessons from Baltimore. Hous. Policy Debate 2001, 12, 415–448. [Google Scholar] [CrossRef]
  10. Silverman, R.M.; Yin, L.; Patterson, K.L. Dawn of the dead city: An exploratory analysis of vacant addresses in Buffalo, NY 2008–2010. J. Urban Aff. 2013, 35, 131–152. [Google Scholar] [CrossRef]
  11. Kim, J.; Nam, J. A Study on Vacant House Distribution and Management of Urban Declining Area. J. KRSA 2016, 32, 105–122. [Google Scholar]
  12. Rhodes, J.; Russo, J. Shrinking ‘Smart’?: Urban Redevelopment and Shrinkage in Youngstown, Ohio. Urban Geogr. 2013, 34, 305–326. [Google Scholar] [CrossRef]
  13. Schilling, J.M. The Revitalization of Vacant Properties: Where Broken Windows Meet Smart Growth; ICMA (International City/County Management Association): Washington, DC, USA, 2002. [Google Scholar]
  14. Nam, J.; Han, J.; Lee, C. Factors Contributing to Residential Vacancy and Some Approaches to Management in Gyeonggi Prevince, Korea. Sustainability 2016, 8, 367. [Google Scholar] [CrossRef] [Green Version]
  15. Population and Housing Census, Statistics Korea. Available online: http://www.census.go.kr/ (accessed on 4 August 2019).
  16. Joh, Y.; Shin, D.; Lee, J.; Lee, D. South Korea 2050 Future Sailing; LX Korea Land and Geospatial Informatix Corporation: Jeonju, Korea, 2016. [Google Scholar]
  17. Park, S.; Kim, S.; Yoon, J. Policy Implications for Regeneration and Reuse of Empty Homes; Architecture and Urban Research Institute: Sejong, Korea, 2016; ISBN 979-11-5659-093-4. [Google Scholar]
  18. Nam, J. Making Activity Core for Local Community Utilizing Urban Vacant Space. In Small Research and Small Seoul, 1st ed.; The Seoul Institute: Seoul, Korea, 2012; pp. 15–17. [Google Scholar]
  19. Lee, C.; Ji, N. A Study on the Utilization of Empty House for Rural Activation in Korea. J. Korean Soc. Rural Plan. 2013, 19, 169–182. [Google Scholar] [CrossRef] [Green Version]
  20. Bassett, E.M.; Schweitzer, J.; Panken, S. Understanding Housing Abandonment and Owner Decision-Making in Flint, Michigan: An Exploratory Analysis; Genesee Institute: Flint, MI, USA, 2006. [Google Scholar]
  21. Mallach, A. Bringing Buildings Back: From Abandoned Properties to Community Assets; National Housing Institute: Montclair, NJ, USA, 2010. [Google Scholar]
  22. Immergluck, D. Examining changes in long-term neighborhood housing vacancy during the 2011 to 2014 U.S. national recovery. J. Urban Aff. 2015, 38, 607–622. [Google Scholar] [CrossRef]
  23. Jeon, Y.; Kim, S. The causes and characteristics of housing abandonment in an inner-city neighborhood—Focused on the Sungui-dong area, Nam-gu, Incheon. J. Urban Des. Inst. Korea Urban Des. 2016, 17, 83–100. [Google Scholar]
  24. Park, J.; Oh, S. Spatial Pattern and Causative Factor Analysis of Vacant Housing in Daegu, South Korea Using Individual-level Building DB. J. Korean Reg. Sci. Assoc. 2018, 34, 35–47. [Google Scholar]
  25. Hillier, A.E.; Culhane, D.P.; Smith, T.E.; Tomlin, C.D. Predicting housing abandonment with the Philadelphia neighborhood information system. J. Urban Aff. 2003, 25, 91–106. [Google Scholar] [CrossRef] [Green Version]
  26. Morckel, V. Spatial characteristics of housing abandonment. Appl. Geogr. 2014, 48, 8–16. [Google Scholar] [CrossRef]
  27. Han, S. Spatial Characteristics and the Fixation Process of the Vacant∙Abandoned Properties in Iksan City; Seoul National University: Seoul, Korea, 2016. [Google Scholar]
  28. Lee, J. Spatial Pattern Analysis of Empty Houses in Rural Areas and Spatial Planning Strategies; Anyang University: Anyang, Korea, 2016. [Google Scholar]
  29. Lee, J.; Newman, G.; Park, Y. A Comparison of Vacancy Dynamics between Growing and Shrinking Cities Using the Land Transformation Model. Sustainability 2018, 10, 24. [Google Scholar] [CrossRef] [PubMed] [Green Version]
  30. Morckel, V. Empty Neighborhoods: Using Constructs to Predict the Probability of Housing Abandonment. Hous. Policy Debate 2013, 23, 469–496. [Google Scholar] [CrossRef]
  31. Ministry of Internal Affairs and Communications of Japan 2014. Summary of the Law for Special Measures to Promote Dealing with Vacant Houses, etc. Available online: http://www.mlit.go.jp/common/001080534.pdf (accessed on 4 November 2019).
  32. Department for Communities and Local Government. Available online: https://assets.publishing.service.gov.uk/government/uploads/system/uploads/attachment_data/file/357791/140923-CTIL_on_EHP.pdf (accessed on 4 November 2019).
  33. Korea Ministry of Government Legislation. Available online: http://www.moleg.go.kr (accessed on 5 September 2019).
  34. Autonomous Law Information System. Available online: http://www.elis.go.kr/ (accessed on 5 September 2019).
  35. Song, M.; Jang, H. Characterization of Cities in Seoul Metropolitan Area by Cluster Analysis. J. Korean Soc. Geospat. Inf. Sci. 2010, 18, 83–88. [Google Scholar]
  36. Urban Regeneration Information System. Available online: http://www.city.go.kr/index.do (accessed on 4 November 2019).
Figure 1. Total housing stock and vacant housing in South Korea (1995–2015, 2050).
Sustainability 11 06913 g001
Figure 2. Ratio of vacant houses in urban and rural areas compared to total houses (1995–2015).
Sustainability 11 06913 g002
Figure 3. Ratio of vacant houses in urban and rural areas compared to total vacant houses (1995–2015).
Sustainability 11 06913 g003
Figure 4. Administrative districts of South Korea (2015).
Sustainability 11 06913 g004
Figure 5. Change in the number of vacant houses (2000–2010). Data source: The Population and Housing Census (2000–2010).
Sustainability 11 06913 g005
Figure 6. Change in the ratio of vacant houses (2000–2010). Data source: The Population and Housing Census (2000–2010).
Sustainability 11 06913 g006
Figure 7. Changes of vacant houses by housing type-all of vacant houses (1995–2010, left), vacant houses for more than one year (2005–2010, right). Data source: The Population and Housing Census (2000–2010).
Sustainability 11 06913 g007
Figure 8. Distribution of clusters.
Sustainability 11 06913 g008
Table 1. Data description.
VariablesFormula
Dependent VariableRatio of vacant housesNumber of vacant houses/total number of houses × 100
Independent VariableSocioeconomic factorsRatio of elderly populationNumber of people aged 65 and older/total population × 100
Population change rate
(2005–2010)
(Number of population in 2010-number of population in 2005)/number of population in 2005 × 100
Ratio of national basic livelihood security recipientsNumber of recipients of national basic living security/number of resident-registered population × 100
Employment rateNumber of employed population/number of people aged 15 to 65 × 100
Rate of change for businesses
(2007–2010)
(Number of businesses * in 2010-number of businesses in 2007)/number of businesses in 2007 × 100
Real estate market factorsRate of owner-occupied dwellingsNumber of households living in one’s own house/total household × 100
Distribution ratio of houseNumber of total houses/number of resident-registered households × 100
Ratio of apartmentsNumber of apartments/number of total houses × 100
Ratio of detached houseNumber of detached houses/number of total houses × 100
Ratio of new housingNumber of houses built in 2010/total number of house × 100
Physical factorsRatio of aged housingNumber of houses more than 30 years/total number of houses × 100
Data source: the Population and Housing Census (2005, 2010). * The Census on Establishments (2007–2010).
Table 2. Vacant Houses by Region (2015).
Total HousingVacant HousingRatio of Vacant Housing *
Nationwide1637100%107100%6.5%
SMA **74345.4%2725.4%3.7%
Non-SMA89454.6%8074.6%8.9%
Urban areas127778.0%6561.2%5.1%
Rural areas36022.0%4238.8%11.5%
(unit: 10,000 households); * Number of vacant houses/number of total houses × 100; ** SMA: Seoul Metropolitan Area (Seoul, Incheon, Gyeonggi).
Table 3. The result of cluster analysis.
Cluster 1Cluster 2Cluster 3
Ratio of vacant houses5.761.101.98
Ratio of elderly population27.838.8013.32
Population change rate (2005–2010)−5.657.48−0.89
Ratio of national basic livelihood security recipients9.844.066.13
Employment rate61.1054.8854.27
Rate of change for enterprises * (2007–2010)−0.086.071.08
Rate of owner-occupied dwellings78.3451.8654.13
Distribution ratio of housing105.5983.7383.71
Ratio of apartments17.2671.3548.60
Ratio of detached houses76.4315.7535.70
Ratio of new housing5.408.406.13
Ratio of aged housing28.024.9914.33
The number of regionsSi143724
Gun7538
Gu-3534
Total897566
Data source: The Population and Housing Census (2005, 2010); * The Census on Establishments (2007–2010).
Table 4. The result of the multiple regression analysis.
VariablesCluster 1Cluster 2Cluster 3All Cities
Declining City TypeGrowing City TypeStagnant City Type
Coef.tCoef.tCoef.tCoef.t
1Ratio of elderly population0.16 **2.32−0.03−0.410.040.420.11 ***3.36
Population change rate−0.02−0.510.010.61−0.01−0.42−0.03 **−2.36
Ratio of national basic livelihood security recipients−0.06−0.860.081.320.141.410.040.87
Employment rate0.051.41−0.03−0.760.041.090.04 *1.82
Rate of change for enterprises−0.02−0.360.031.270.030.820.020.98
2Rate of owner-occupied dwellings−0.13 ***−3.63−0.40 **−2.62−0.03−1.41−0.06 ***−4.63
Distribution ratio of housing0.24 ***7.780.05 ***4.140.06 ***3.320.10 ***9.88
Ratio of apartments0.020.670.00−0.150.000.020.00−0.46
Ratio of new housing−0.10 *−1.27−0.01−0.660.08 ***2.990.021.03
3Ratio of aged housing0.051.590.08 ***3.090.061.610.05 ***2.90
Constant−17.07 ***−3.67−0.05−0.02−6.22 **−2.59−7.47 ***−5.25
Adjusted R20.580.410.610.83
F13.15 ***6.05 ***11.02 ***111.81 ***
N897566230
1: Socioeconomic factor, 2: Real estate market factor, 3: Physical factor. * p < 0.1, ** p < 0.05, *** p < 0.01.

