Article

Background Similarities as a Way to Predict Students’ Behaviour

UNIR iTED, Universidad Internacional de La Rioja (UNIR), Logroño, 26006 La Rioja, Spain
Sustainability 2019, 11(24), 6883; https://doi.org/10.3390/su11246883
Submission received: 23 October 2019 / Revised: 29 November 2019 / Accepted: 2 December 2019 / Published: 4 December 2019

Abstract

:
The number of students opting for online educational platforms has been on the rise in recent years. Despite the upsurge, student retention is still a challenging task, with some students recording low-performance margins on online courses. This paper aims to predict students’ performance and behaviour based on their online activities on an e-learning platform. The paper will focus on the data logging history and utilise the learning management system (LMS) data set that is available on the Sakai platform. The data obtained from the LMS will be classified based on students’ learning styles in the e-learning environment. This classification will help students, teachers, and other stakeholders to engage early with students who are more likely to excel in selected topics. Therefore, clustering students based on their cognitive styles and overall performance will enable better adaption of the learning materials to their learning styles. The model-building steps include data preprocessing, parameter optimisation, and attribute selection procedures.

1. Introduction

Sakai is an open-source learning management system (LMS) that is considered in the open-source community as a course management system. It is a successful learning tool and is used in most higher learning institutions [1]. For this reason, the Universidad Internacional de La Rioja (UNIR) in Spain and Latam hosted its Open Educational Resource (OER)-based distance learning system on the Sakai LMS. The system allows for a range of learning tool aspects. For instance, it allows for face-to-face communications through video conferencing; it also incorporates advanced courses that use multimedia lessons.
Online learning platforms have gained tremendous traction in recent years, and the existence of these web-based LMSs has given rise to vast amounts of data that are useful for improving educational processes. As a result, educational data mining (EDM), which deals with methods that extract useful information from raw data, is particularly suited for information that concerns the distance learning environment. Data mining is not a new concept, and as such, it has been in existence for over two decades now. Many LMSs store and retrieve user information in a structured way; however, they lack a proper analytical module to, for instance, cluster and categorise students or to provide personalised recommendations [2].
Data analysis techniques are a current field of study that is receiving attention from the educational research community. Data analysis applied to education can be viewed from two different perspectives: EDM and learning analytics. The former focuses on the techniques and algorithms and how to improve them; the latter focuses on how the educational scenario can benefit from these techniques [3]. The underlying idea of learning analytics is to analyse data that arise from educational scenarios and to derive information that can enrich the teaching/learning process. Learning analytics techniques can be applied in many different educational settings, such as face-to-face, blended, or distance. As an example, Vieira, Parsons, and Byrd (2018) reviewed 52 papers from the literature, of which three belong to classroom environments, 19 to online environments (MOOCs -Massive Open Online Courses- and others), and 30 to blended learning situations. Therefore, it seems clear that the literature reveals an actual interest in the application of learning analytics to distance learning environments.
The information from the extracted data is useful because it helps to track users’ actions; these actions could help identify specific character traits about users. From the information captured, one can create models that predict user behaviour or, in other cases, describe uniqueness. Education stakeholders, such as teachers, students, e-learning system administrators, and university management, can leverage this knowledge.
The stakeholder can utilise this information to achieve different goals, some of which are described below. Some deal with the assessment of students’ learning performance, and others provide course adaptation and learning recommendations based on students’ learning behaviour [4,5,6]. Other approaches deal with the evaluation of learning material and educational web-based courses. These include applications that involve feedback to all stakeholders of e-learning courses based on students’ learning behaviour [7,8] and applications for the detection of a typical student’s learning behaviour [9,10]. This information was obtained using data mining techniques such as naïve Bayes classifiers and artificial neural clustering, among others. However, LMSs were not designed for data analysis, and as such, they do not systematically store data. Therefore, a thorough analysis will take much time. Moreover, in as much as an LMS produces reports, these reports usually do not contain information that will help the instructor draw meaningful conclusions on either the students’ abilities or the course potential. In general, LMS reports are useful only for administrative purposes.
This paper shows how one can leverage the available data on student behaviour to be able to predict the success of students, in addition to profiling students into clusters, which will help improve existing learning resources and collaborative learning. The study is based on data from students attending an online distance learning university course as submitted by Mangaroska and Giannakos [11] and extends available data with students’ cognitive styles. Moreover, the paper proposes a Sakai module that allows for automatic data extraction which will be used for EDM analysis and, lastly, deploys models that are entrenched in the study.
The paper is arranged as follows: Section 1 introduces related work on using e-learning data and applying the data mining model. Section 2 provides a literature review about Educational Data Mining. Furthermore, Section 3 presents the case study of the Universidad Internacional de La Rioja (UNIR), and how data have been retrieved and processed, including the ways to predict students’ success. Section 4, Section 5 and Section 6 show the discussion, limitations, conclusions and future work of this study.

2. Background

In the scientific literature, several surveys and studies can be found on EDM. Some authors gave an extensive overview of the topic. This paper will focus on the research that relates to the current study. In the following, I provide several techniques and theories that support the research presented in this paper. For instance, [3] investigated how data mining techniques can be successfully used for adaptive learning. Furthermore, many higher learning institutions use Sakai as their preferred e-learning platform. Siemens and Baker [3] describe how different data mining techniques can be utilised in the Sakai platform to improve the course and students’ learning experience. In their report, they further subclassified applications by means of data mining techniques—that is, analysis and visualisation of data, providing feedback to support instructors, recommendations for students, predicting students’ performance, student modelling, detecting undesirable student behaviours, grouping students’ social networks, developing concept maps, constructing courseware, and planning and scheduling.
In addition, and according to Lukarov, Chatti, and Schroeder [12], one of the most researched topics in the area of EDM is how to predict students’ performance. The notion behind this topic is that utilising data on students’ current and past activities makes it is possible to predict future outcomes on a given course. Dawson et al. [13] suggest that using algorithms and other specific techniques, such as neuro-fuzzy systems, can reveal the rules that determine the students’ knowledge through the game learning environment. They also propose a prototype version of a decision support system that can predict students’ performance based on their demographic characteristics and their results on small written assignments [13]. Furthermore, Shneiderman [14] used artificial neural networks and computational models to predict students’ performance.
Clustering of students is another important research area in educational environments. Cambruzzi, Rigo, and Barbosa [15] argue that data clustering is a fundamental resource that could be used to promote group-based collaborative learning and to provide incremental student diagnosis. Alternatively, Agudo-Peregrina, Iglesias-Pradas, Conde-González, and Hernández-García [16] propose a student grouping approach using neural networks based on affective factors in learning English. Clustering based on Kohonen’s self-organising map (SOM) and the K-means algorithm has been used in several types of research. The two algorithms were used to sort similar course materials with the aim of helping users to find and organise distributed course resources in the process of online learning. K-means clustering in particular was used by Papamitsiou and Economides [17] to group students with similar skill profiles on artificial data; the algorithm was also used to predict the students’ learning activities. Romero, López, Luna, and Ventura [18] used hierarchical clustering to group students based on their learning styles. The authors were guided by Felder and Silverman’s model to build individual models of learners and to adjust teaching paths and learning resources to suit the needs of the individual student. Prieto et al. [19] proposed a clustering algorithm based on large generalised sequences to find students with similar learning characteristics based on the patterns of their traversal paths through the content of each page they visited [19].
The paper will utilise the K-means algorithm on the data concerning students’ cognitive styles, basing its findings on the survey conducted among 392 students that took part between 2015 and 2019 in nine editions of the academic programmes of Master of Science on eLearning and Social Networks and the postgraduate course “Open Education”. The model that will be generated from the data collected will apply in an e-learning setting. In a university context, a group of almost 400 users in four years means a large sample with which to work. This continuity across years and editions makes the study significant enough to draw some interesting conclusions. Furthermore, regarding the sample, we have collected the total population from the majority of the students in every classroom of every edition, with 43.55 students as average per classroom and a 4% drop-out rate. These students come from 72 countries, are 38.4 years old (average), show a 27–73% female–male gender balance, and mainly hold a previous bachelor degree in Science and/or Technology (45%), in Education (48%), and in other fields (7%). The survey was a compulsory activity, part of the programme syllabi, and it was collected through an survey service external to the LMS Sakai of the School of Engineering and Technology, where the master is hosted. The survey service was developed in-house by the Research Institute for Innovation and Technology in Education (UNIR iTED) and connected to Sakai to the IMS LTI specification [20].
In the following, the paper will describe the data utilised by the EMD and recommend the appropriate procedure for data extraction and preparations. Additionally, I will embark on the building and evaluation of data mining models. Lastly, the Sakai module for the deployment of models will be described.

3. The Case Study at Universidad Internacional de La Rioja (UNIR)

3.1. Automatic Data Extraction

To better understand the approach used in extracting the data, the Sakai system’s data were used, because the Sakai LMS is specific when the database is brought to the fore. The main reason is that Sakai is an open-source solution, meaning that many developers are continually developing the system and adding more functionalities to it. The module of data management was used to enable natural expansion. That is, whenever the developer wants to add some functionality to the existing Sakai version, he or she must develop adequate PHP pages and tables for the database model that will be used to manage data for the new set of functionalities. This method of adding functions and new modules to the Sakai model complicates how data can be extracted in the future. Bainbridge et al. [21] and Jayaprakash et al. [22] give directions on how to extract data for EDM analysis that is based on a series of queries defined in the MySQL database. These two groups of researchers propose two methods for extracting data in the Sakai database structure. The first approach is to monitor the activity log that the Sakai system uses to track the activity of each student. However, there is a challenge that comes with this approach: Sakai is not able to continuously track usage because it is a web-based system that functions on an HTTP request or reply model. Under this model, it is even difficult to determine the time spent on an activity, since activities are listed only when a user performs a click action on a web link.
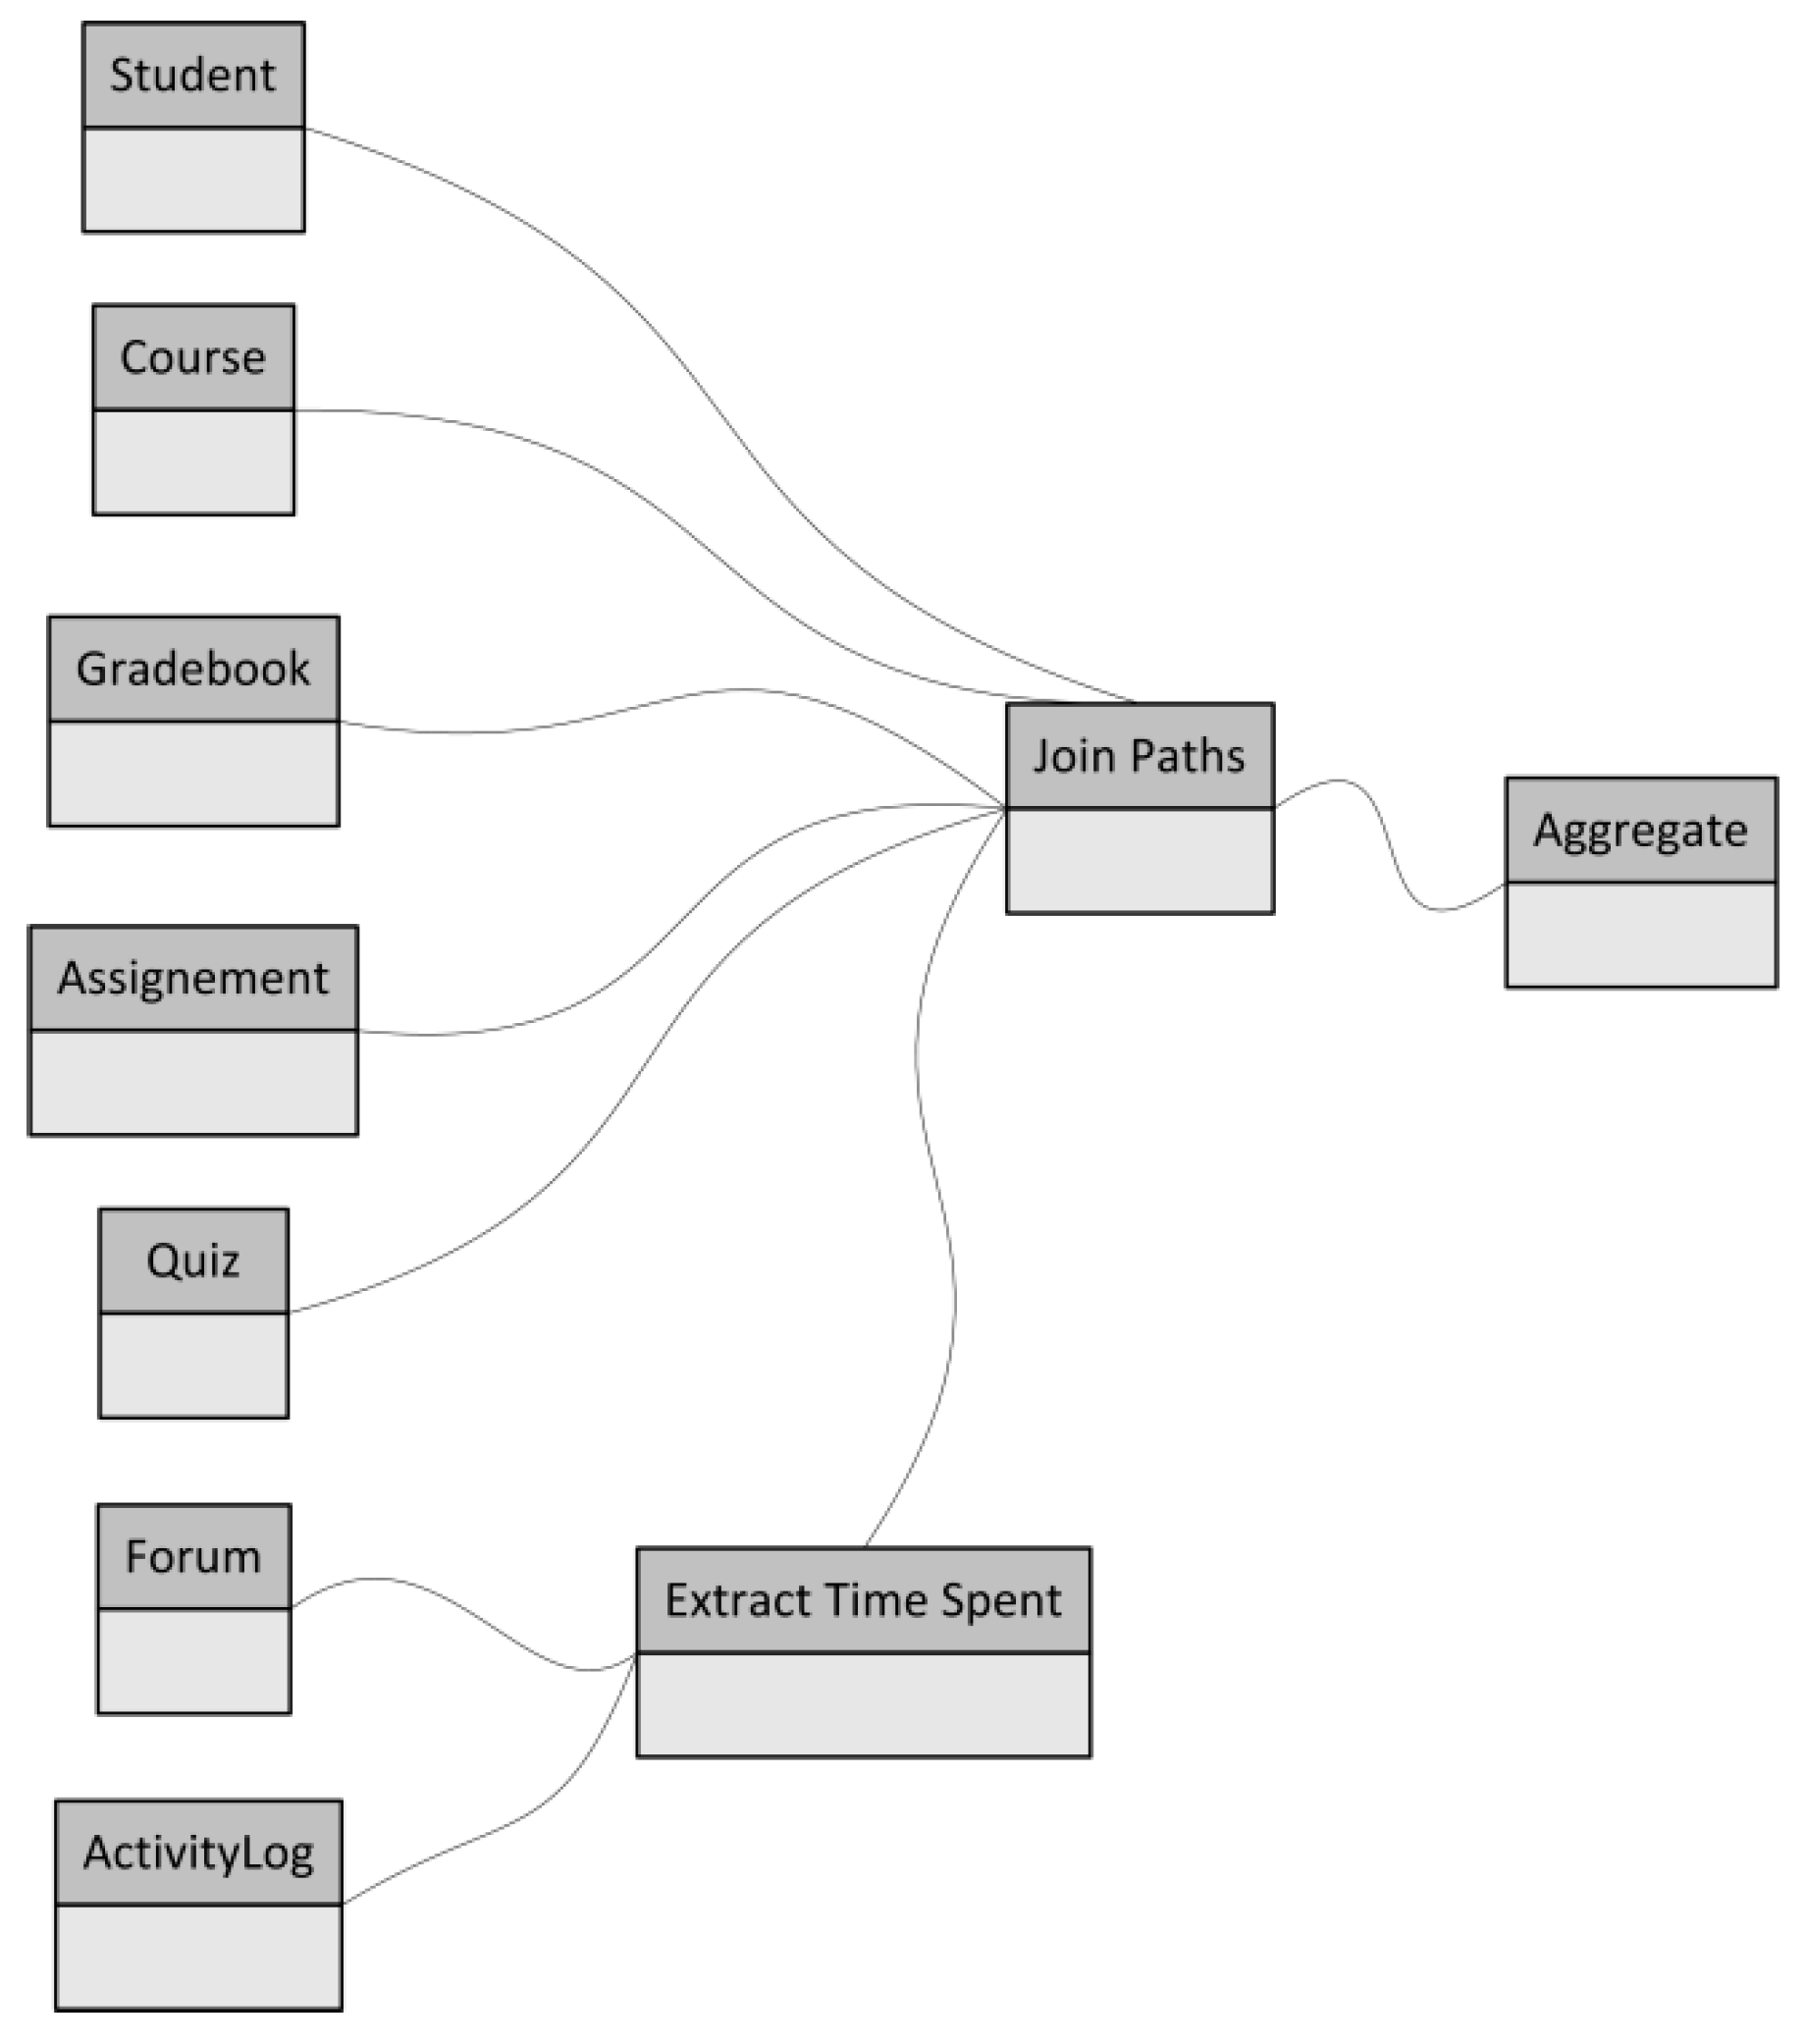
The second approach to extracting data is using a set of tables that are created for each individual module. The data in these tables keep track of students’ significant activities regarding that particular module. For example, when a student performs an assignment, the module in question will keep track of when the student reads the assignment, submits it, and so forth. Nonetheless, these data provide little information on each action a student performs on the Sakai platform. As a way of getting better information, I will utilise data from both approaches, as combining these two types of data is a better foundation for EDM analysis, as highlighted in Figure 1.
Furthermore, Table 1 shows a stream of automatic extraction and aggregation of Sakai data for EDM analyses. Preparing data as described in the table, I will first extract the data about students, courses, and grades achieved in every course. Secondly, the data from various modules will be extracted, that is, forum, assignment, and quiz modules. These data define the basic user model to support student performance in UNIR’s methodology framework.
Given that Sakai is an LMS, it faces the common issues of such systems. For instance, the system uses resources from many alternative sources. In addition, Sakai is an open-source system, meaning that the system has no specific developer, and the information sources may use different representations and ways of encoding the data. Vieira, Parsons, and Byrd (2018) suggest that syntactic interoperability can be achieved when compatible forms of encoding and access protocols are used to allow information systems to communicate.
For this analysis, the data were extracted from the standard Sakai module that was developed over a period of time. These data were part of an integrated production issuer of Sakai, which helped to standardise the data and, as a result, avoid data heterogeneity. No system is ever problem-free, and as such, data inconsistency is a common occurrence, but then again, inconsistency is common in any open-source system. However, Sakai happens to be stable and consistent with the data it uses. For example, the time values are always in a stamp format, which simplifies the pre-processing steps. Moreover, this action also enables more comfortable and faster manipulation of the data by subtracting the beginning time from the end time of each activity. The main reason for why most systems fail or generate errors is the improper use of these systems. For instance, when a student does not complete the assignment and upload it and then closes the browser, the assignment will be regarded as still open and the end time will be set to zero. The same will happen when the quiz or assignment page is left open by the educator. In the event that such cases exist in the primary data, they will be eliminated, and I will assume that the assignment was never opened.
On the other hand, a system that has many active users often suffers from data redundancy. For Sakai, the most common redundancy is the duplication of courses or user accounts. I recommend a more centralised approach in the generation of courses and user accounts as a way of dealing with this problem. That is, the system administrator will create a new user account only on request of the educator. Moreover, it is the educators’ responsibility to check for duplications of user details in the system. This process will ensure that no duplications occur in the system. As for the forum module, the main challenge is extracting the data on time spent by users in a particular online session. As a student may spend an unspecified amount of time on a given forum without necessarily giving feedback to the system, it becomes difficult to determine whether the user is active in the forum. In case this happens, I recommend the use of an activity log that will track user activity while the user is online. For instance, it will track every single click the user makes on a link in the system.
Sakai provides a module name as one of the metadata, which makes it easy to track a student’s activities on a given forum. For instance, it is easy to determine the time that a student spends on the forum by monitoring the time between the first and the last click. In the event that a student makes the last click in a forum and is inactive for a prolonged period of time, the system will take the average time between the two clicks in a forum context for all users. The above incident may be caused by various reasons. For instance, a student may not log out of the system properly. In most cases, students merely close the web browser and move on to other activities. Regrettably, in the event that such an incident occurs, the system is unable to get any meaningful data because the user did not leave any feedback when the activity ended. I designed a specific application that integrates the data into a stream and uses these data for the forum module and activity log to calculate the amount of time spent by students on each course forum. The extracted information is grouped based on the students’ course levels.
I used the data about students’ cognitive styles that were gathered from a questionnaire that was administered during the survey on Sakai; this self-report MBTI -Myers–Briggs Type Indicator- questionnaire is the best tool to analyse students’ profiles. The MBTI has 100 forced-choice items that are part of the four bipolar scales, that is, EI (extraversion–introversion), TF (thinking–feeling), SN (sensing–intuition), and JP (judging–perception). Combining the four dimensions results in 16 different types of cognitive functioning. For instance, introverts lean towards internal cues, whereas extroverts lean towards external cues, because of the difference in focusing their psychical energy. They perform different intellectual tasks differently. Further, the sensing mode type tends to perceive data obtained from one of the five senses, as opposed to the intuitive type, who is inclined to lean on inner processes, perceiving the bigger picture, which enables people of this type to concentrate and reveal the unseen implications and possibilities of the matter at hand.
According to Chin et al. [23], there are two decision-making systems that one must use when assessing the validity of perception, that is, thinking and feeling. There are individual differences in preference for the quality of the environment in which one learns. Moreover, there are two categories of the subject matter: (a) Perceivers, who need to keep options open and are less concerned with deadlines, and (b) judgers, who structure and order in a manner that promotes a predictable surrounding, in which decisions are made fast. The MBTI is an instrument that conceptualises, measures, and evaluates ideas, which I believe will be useful in the case of distance online learning. When the MBTI was put to a reliability test, it emerged that the split-half coefficient goes from 0.56 to 0.89, and the test-retest reliability shows that the results are relatively stable. The records on students will be extended with the attributes derived from their cognitive style.

3.2. Prediction of Students’ Success

This section introduces a classification model that predicts whether students would display excellent performance, that is, whether they attain the highest grades in a given course. The input data for this prediction module are the data used to access a student’s behaviour on the e-learning resources that were highlighted earlier in this paper, namely, forum discussions, posts, quizzes, and assignments. The data set in this category will contain 360 instances. I will first prepare the data by grouping them into main distinct categories, both social or mathematical; then, the normalisation features will be incorporated, and issues with any missing information resolved. The model used to predict students’ performance will utilise binary attributes that separate students with the highest grades from the rest. These categories of students will be assigned a binary value of 1, while the rest will be assigned a binary value of 0. The goal of the model is to predict whether a student will obtain an excellent result based on the input data.
For this model to work, it must identify the students that are performing well on a course in the early stages of teaching. The people who benefit from this model include (a) teachers, who can identify students that will work and are cooperative; (b) students, who are able to see if more efforts are needed for them to achieve better results; and (c) corporate executives and employers, who are able to identify students with top skills early so that that they could be nurtured and absorbed into the job market.
The following algorithms for classification, which have all been proven to yield good results in EDM, were utilised in the paper:
  • AdaBoost, abbreviated as Boost;
  • naïve Bayes;
  • linear discriminant analysis (LDA);
  • J4.8;
  • logistic regression;
  • neural net (NN); and
  • random forests, abbreviated as Forests.
The results of the algorithms are shown in percentages. Given that the model will be used in the future, a 10-fold cross-validation technique will be used on future data. The technique is useful for preventing the generation of an overtrained model and for assessing the model’s generalisation ability. That is, using stratified sampling, the cross-validation will keep similar class distributions in each fold. In addition, the model also measured other evaluation measures, such as the LIFT ratio and the area under curve (AUC) ratio. In this case, the AUC estimate is interpreted as the probability that the classifier will assign a higher score to a randomly chosen positive example than to a randomly chosen negative example. On the other hand, the LIFT ratio measures the degree to which predictions of classification models are better than randomly generated predictions. Romero-Zaldivar et al. [24] define LIFT as the ratio of true positives to total positives that result from the classification process compared with the fraction of true positives in the general population. Both measures will be used in the model to complement the evaluation based on accuracy. This approach is necessary because this study deals with imbalanced data [24].
In dealing with accuracy, there are apparent errors that are generally overlooked; for instance, the classifier’s inability to predict all of the classes singularly when it is focused on only one class. The testing of the model was done using the RapidMiner data mining platform, and default parameters and random seeds were utilised; the results are shown in Table 2.
From the above results, several algorithms show excellent performance in generating desirable classification models. For instance, AdaBoost, Random Forests, and Neural Net all have results that are comparable with respect to accuracy. Even though Random Forests seems to be the most useful one in terms of accuracy, the AUC evaluation suggests that it is not the best algorithm and, therefore, should be abandoned because it does not have the ability to predict both excellent and other students, which results in lower AUC performance. On the other hand, simple algorithms such as logistic regression, naïve Bayes, and LDA mostly performed poorly. Although LDA and J4.8 seemed to have better accuracy, the performance of the two algorithms is close to the random performance, and the accuracy is mostly attributable to class imbalance. The results also show that the best way to predict excellent students is to use nonlinear models. Generally, both AdaBoost and Neural Net showed good results, rendering quality models that can be used further. Given the results of the cross-validation, the acceptable, successful prediction was nine out of 10 students.
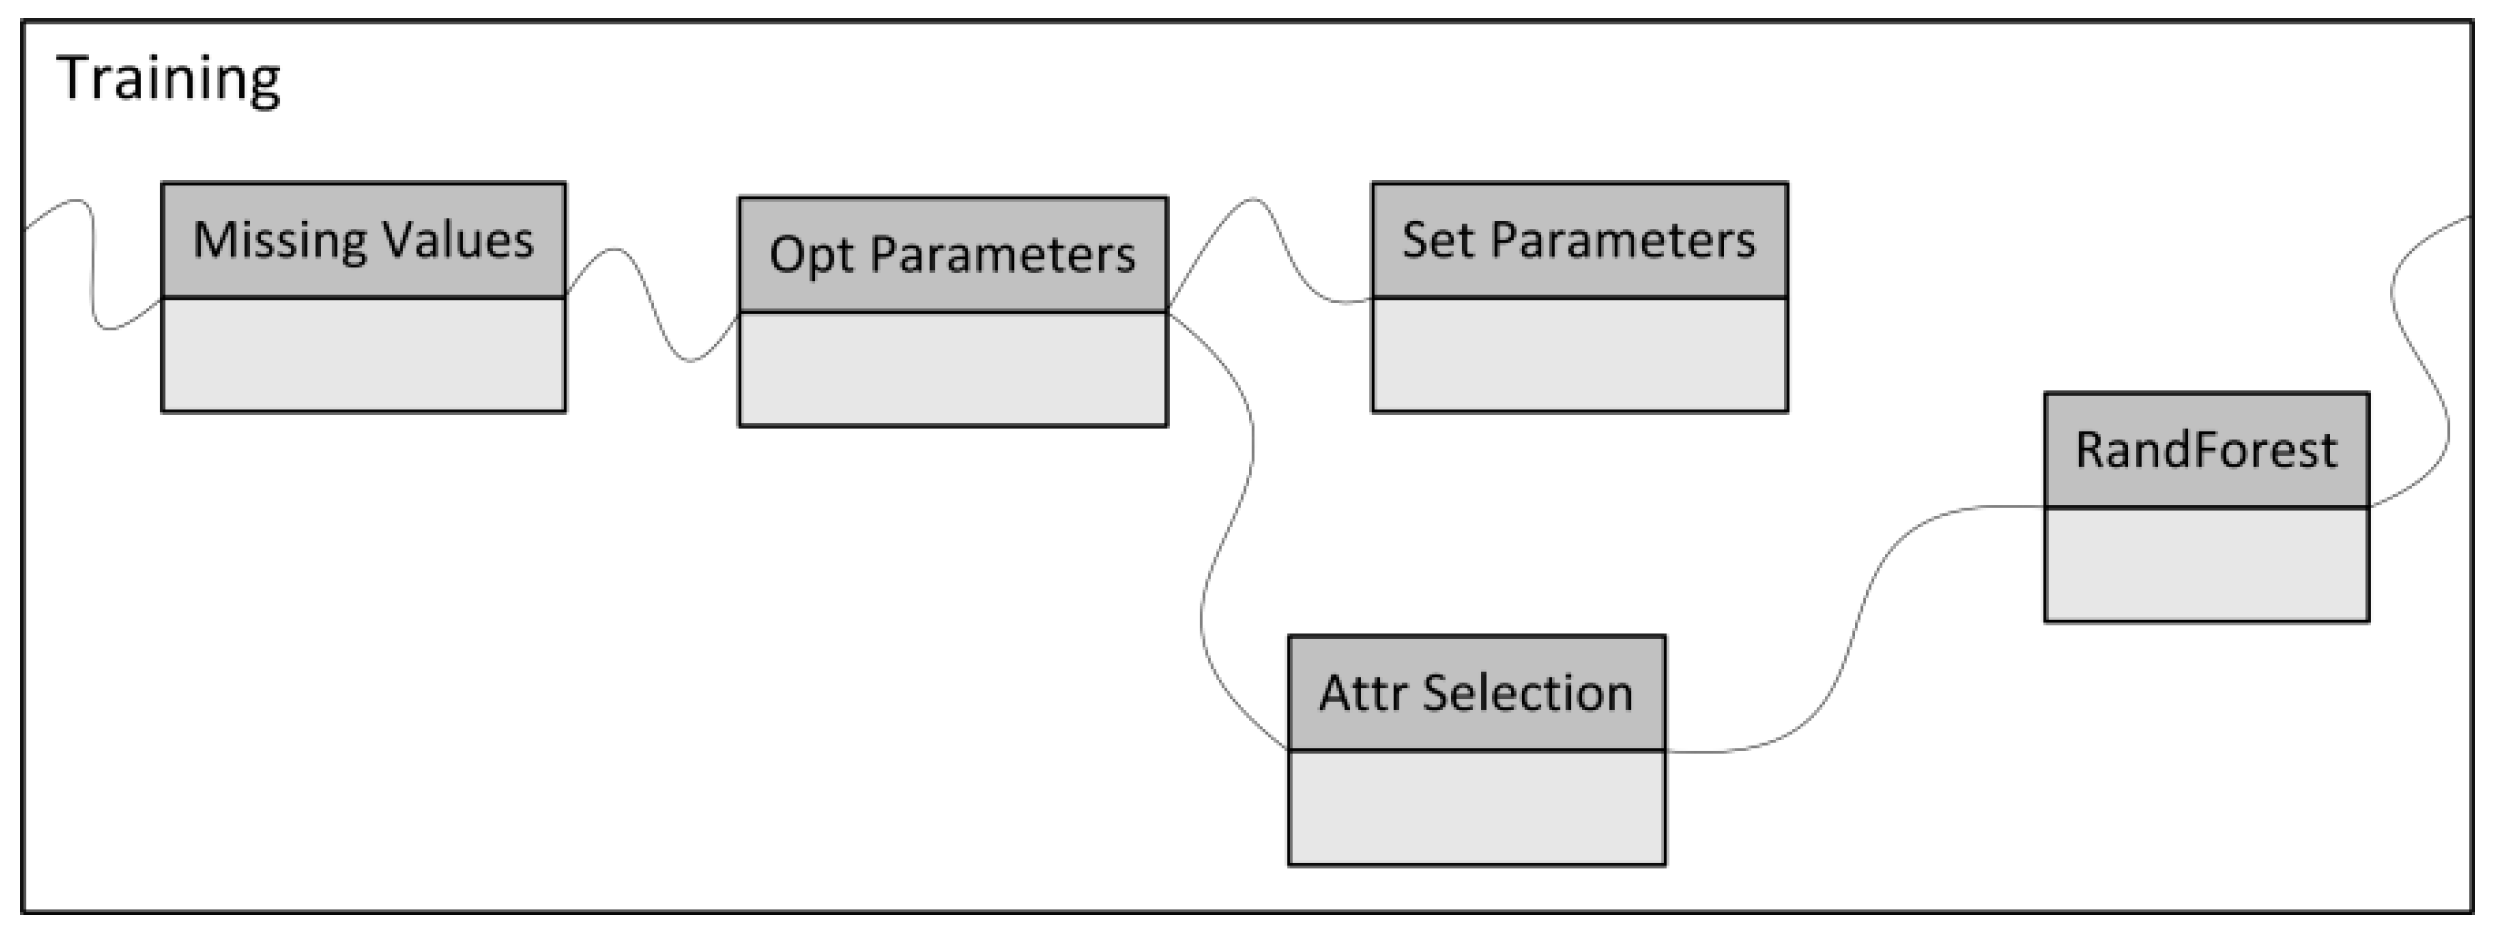
The next step after selecting the most promising algorithms is to improve the performance, as measured by the AUC through conducting different pre-processing and parameter optimisation steps. The setup of the pre-processing is shown in Figure 2.
The results of applying these steps are shown in Table 3.
In order to achieve the above result, I followed several steps; that is, for pre-processing, I first averaged out the missing values present in the data—namely, total_time_assignment or total_time_quiz attributes—to better fit the problem at hand. This will improve all three algorithms and should be considered when applying these algorithms. Next, I seek to minimise the noise level in the model by conducting an attribute selection test and removing attributes that bring about redundancy. Elimination of noise will be done manually, and it will remove one attribute at a time until the performance improves. Although after pre-processing the general performance of the model improved, I could not settle on one specific algorithm to use in the model; therefore, I recommend using all three for practical applications.

3.3. Grouping Students

This section will first define clustering models that would detect groupings of students with respect to their cognitive styles and general performance as a way of better understanding and adopting the learning material. In this regard, the students will be described based on their cognitive styles and the scores they achieve on a given course. The data in this model are classified based on the courses, and as such, the individual student profiles can be considered for each course separately. This model enables one to see the profiles of all students, to see which students are having a hard time, and to assess whether students performed poorly in the past. With this information, student mentors should adjust accordingly to enable poor-performing groups to improve on their course performance. To achieve an active clustering, the K-means clustering algorithm was used to group the data according to different categories, and the result is shown in Figure 3, Figure 4, Figure 5 and Figure 6. For each course, several student profiles are found based on similarities in cognitive style between students.
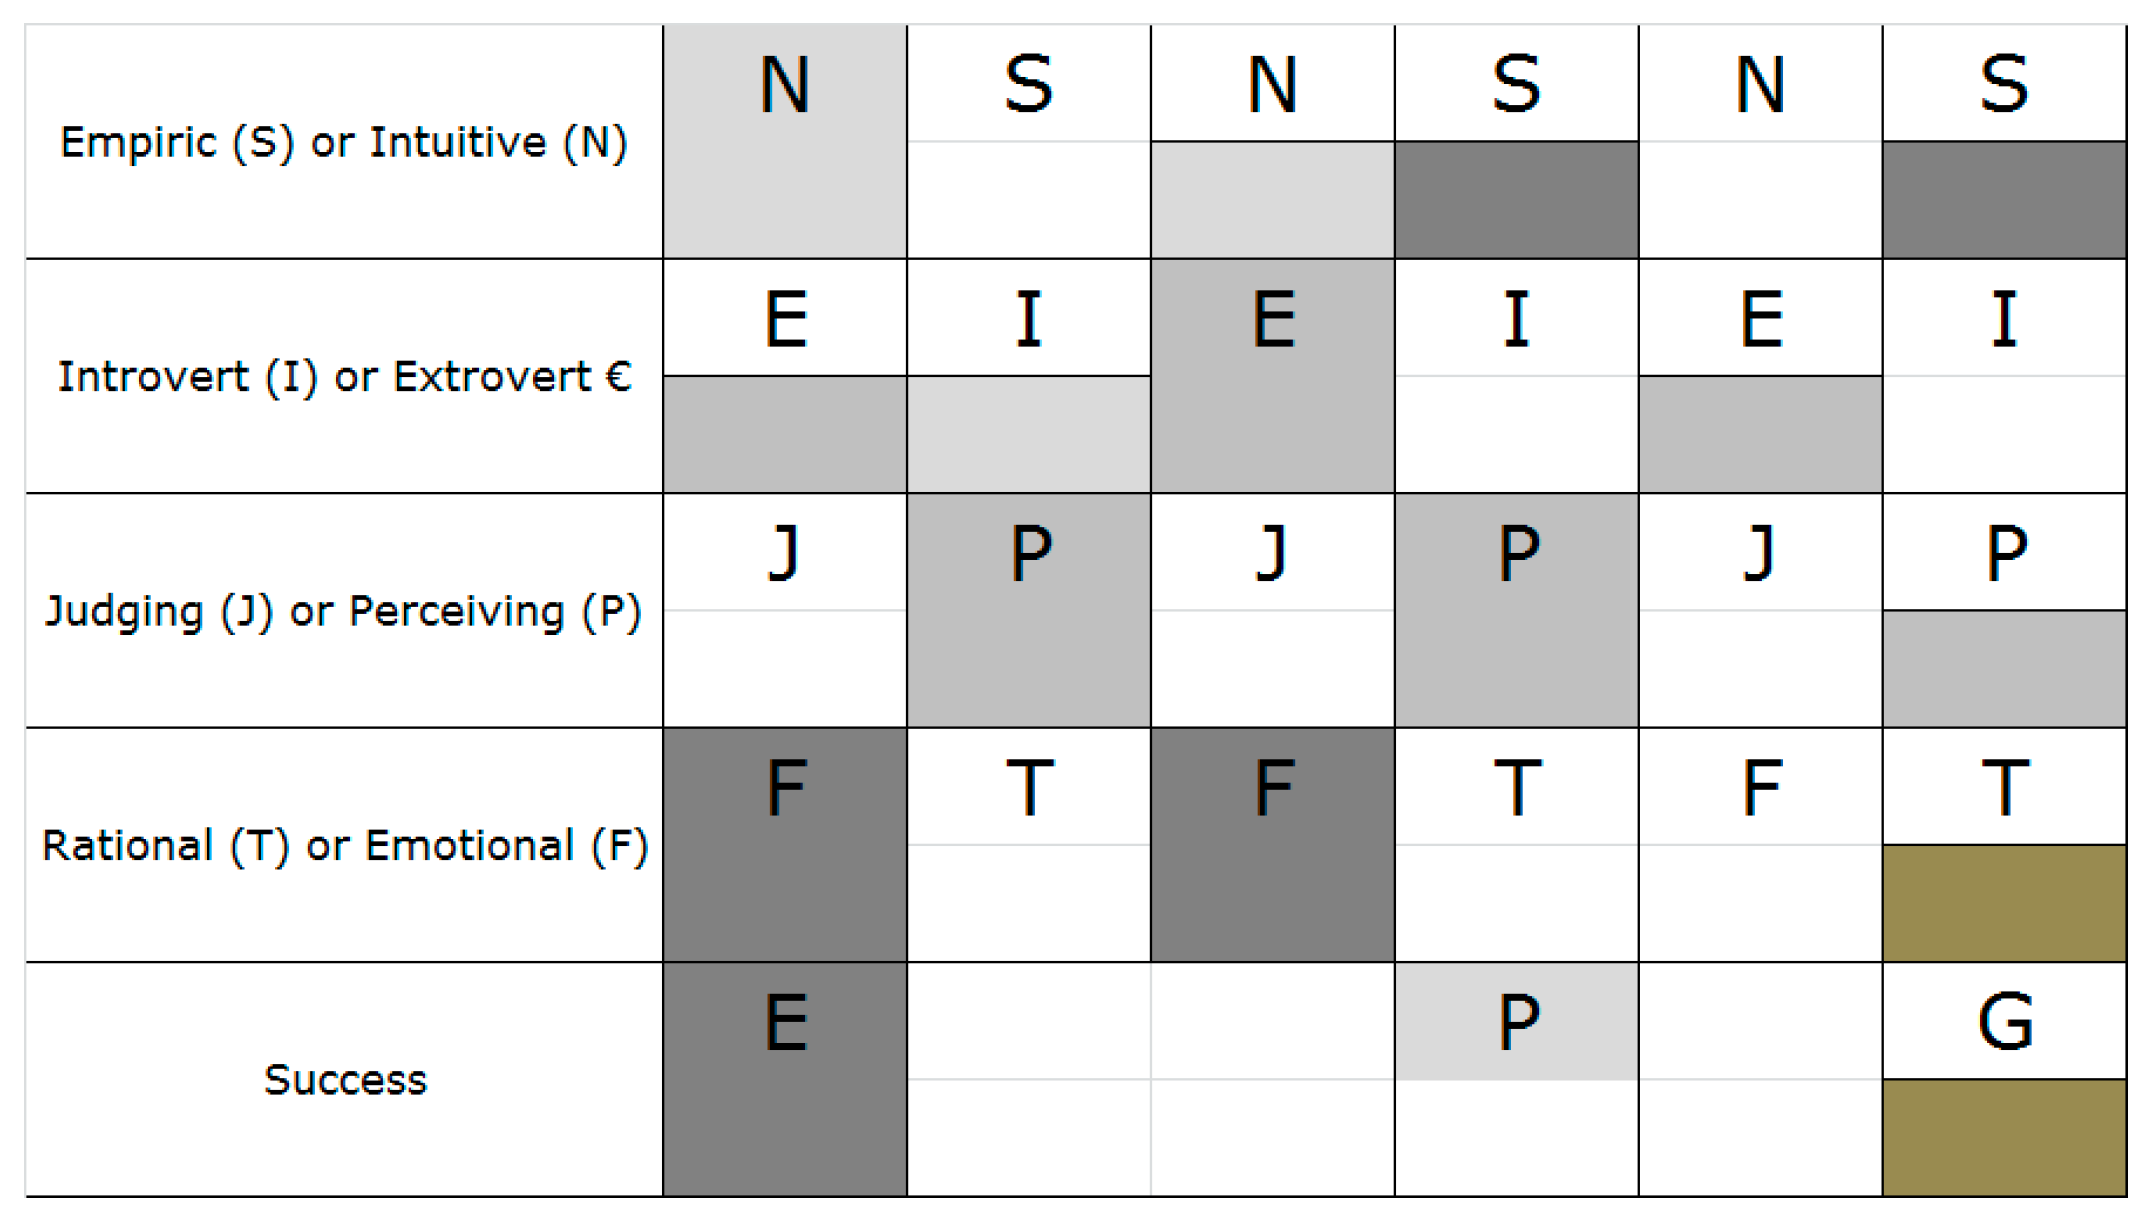
Figure 3 and 
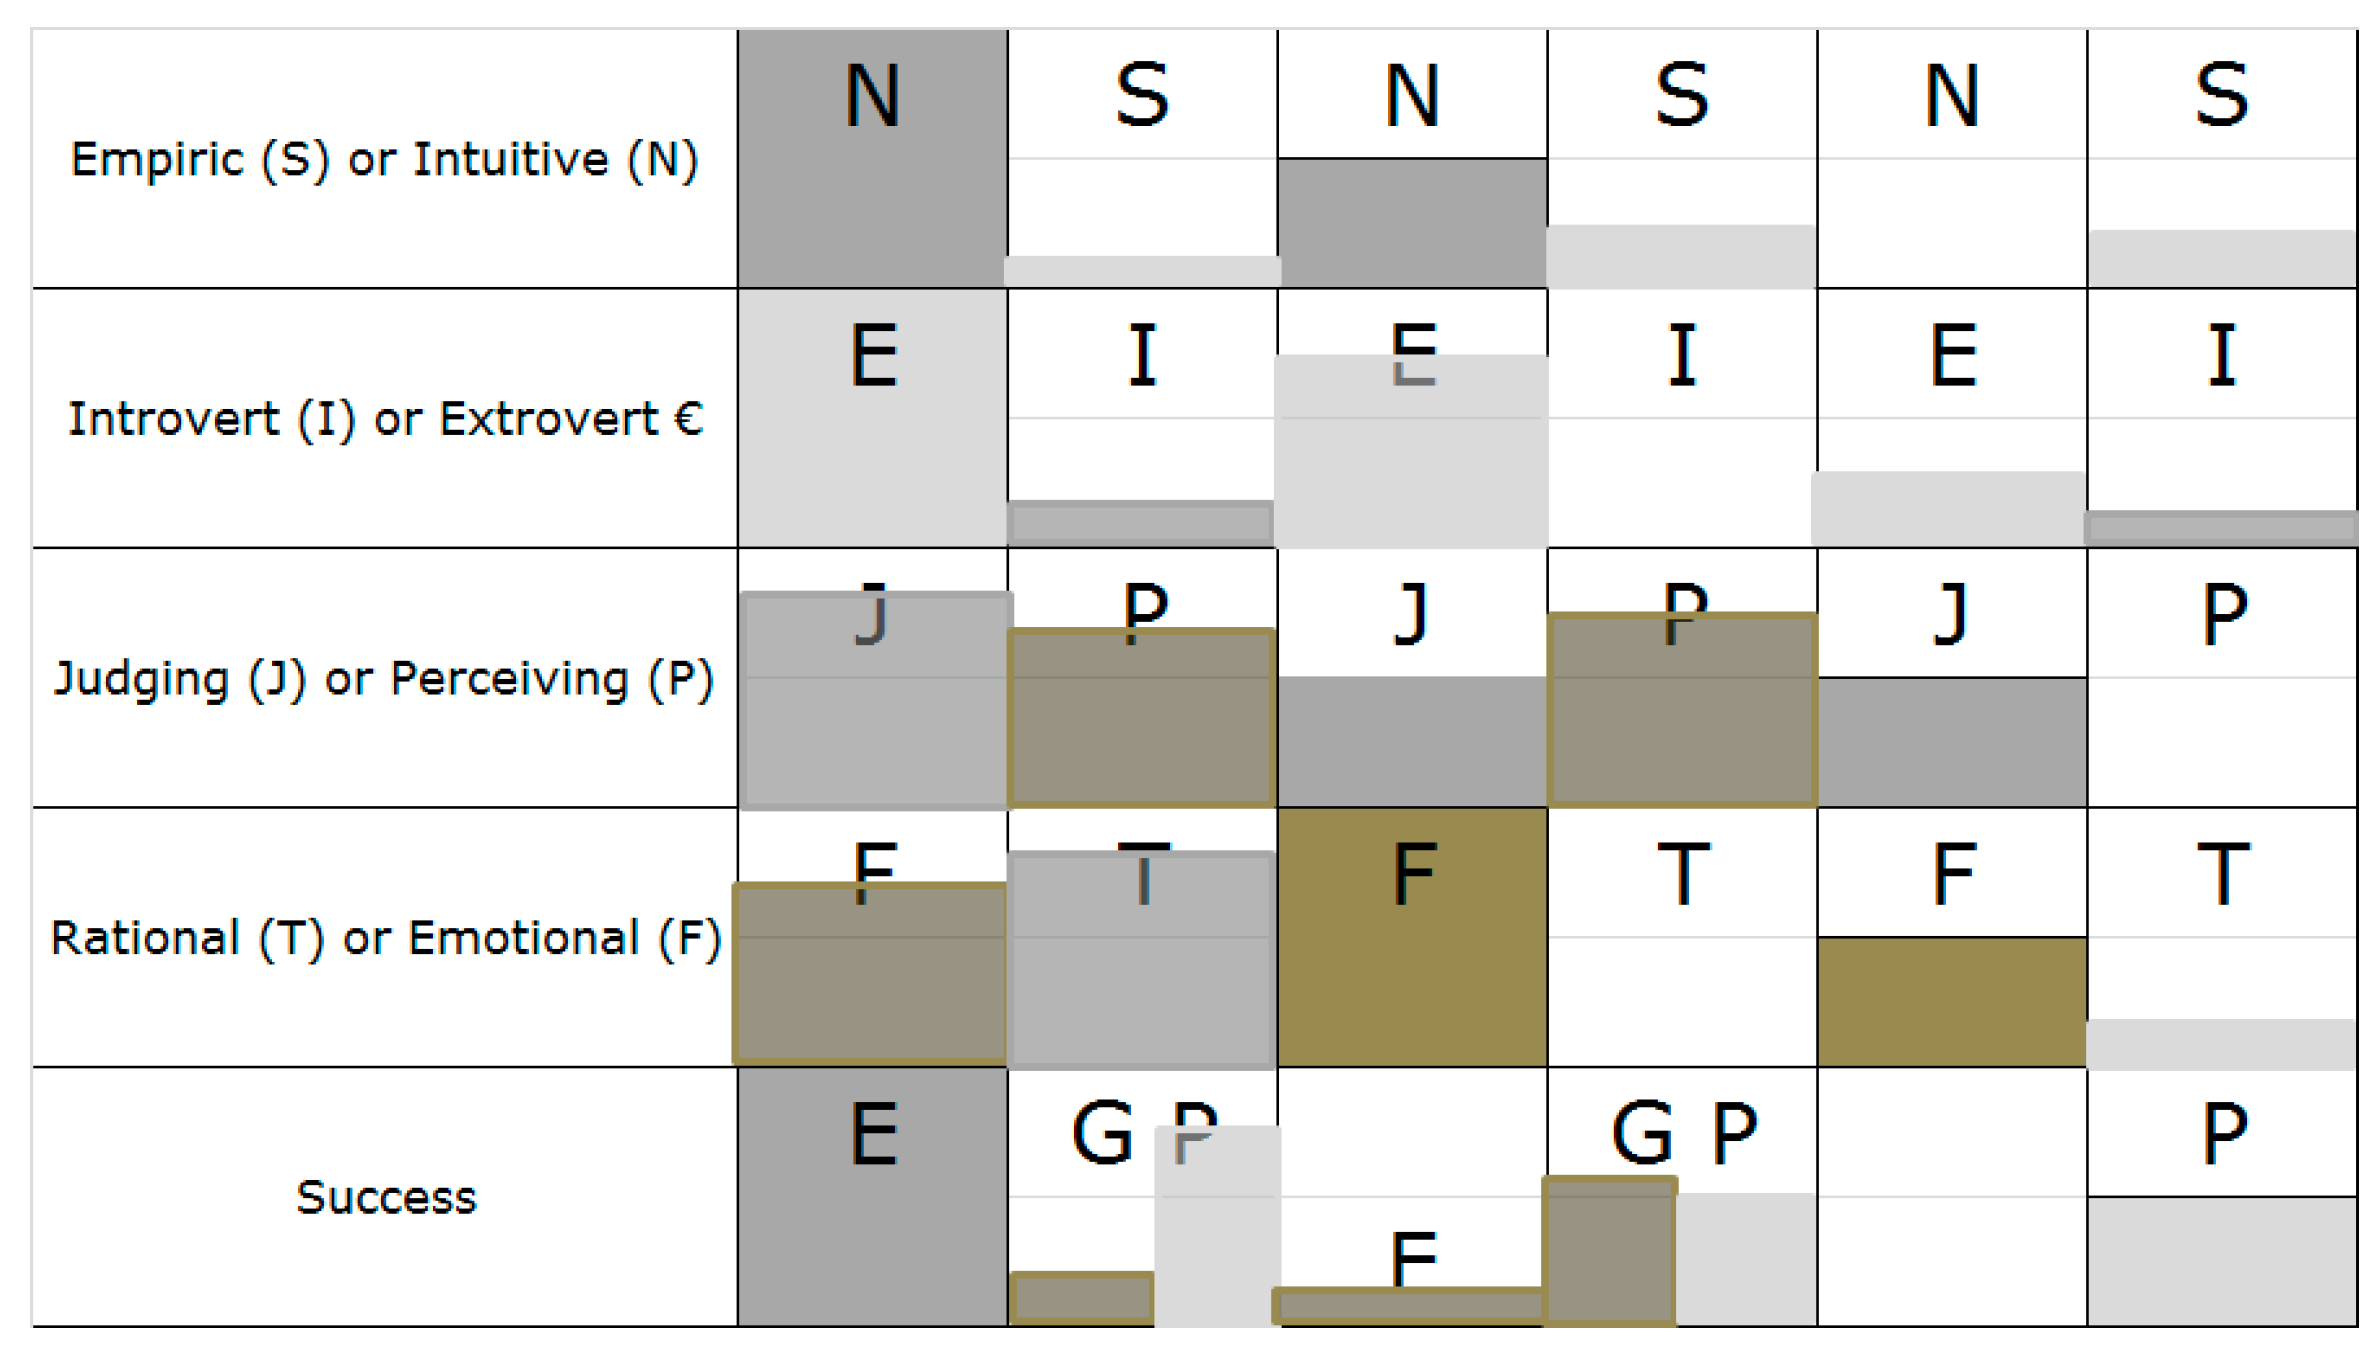
Figure 4 present different groups of students in different courses. Each row represents different cognitive properties, as discussed earlier in Section 3.1, and each column stands for one profile that is a cluster of students with similar cognitive properties. In the figures, the term success represents the success of students of a particular profile, in which P means poor performance, G stands for good performance, and E indicates excellent performance. In this case, I used a three-level categorisation of success instead of a two-level one to achieve a more detailed description of the clusters found. In principle, any number of success levels could be used; however, empirically, the model seeks to detect the highest clarity of cluster interpretations by using three levels. The same is true for the clusters, which were also set to three.
From Figure 3, for example, students with the profile SEFJ had excellent results, while other profiles have a moderate to good performance. This implies that students with other profiles than SEFJ had trouble delivering the best performance, which may be attributed to several factors.
Nonetheless, since the model has identified the cognitive profiles of these students, it is now the duty of the instructor to formulate course materials that fit the needs of the target groups; for example, from the analysis, the mathematics course is more suitable to empiric and judging cognitive styles. Therefore, the teacher could adopt materials that oppose the cognitive styles; that is, they could try introducing the intuitive and perceiver cognitive style, which might be beneficial to the other cluster of students [25,26,27]. Moreover, the instructor could also adopt a different approach to administering the examination. For instance, they could opt to seek further expertise from a psychologist on how to deal with introverts who have difficulties expressing themselves verbally.
It is expected that different courses will fit different profiles, which is primarily due to preference, different materials, and different areas of research offered by the instructors. 
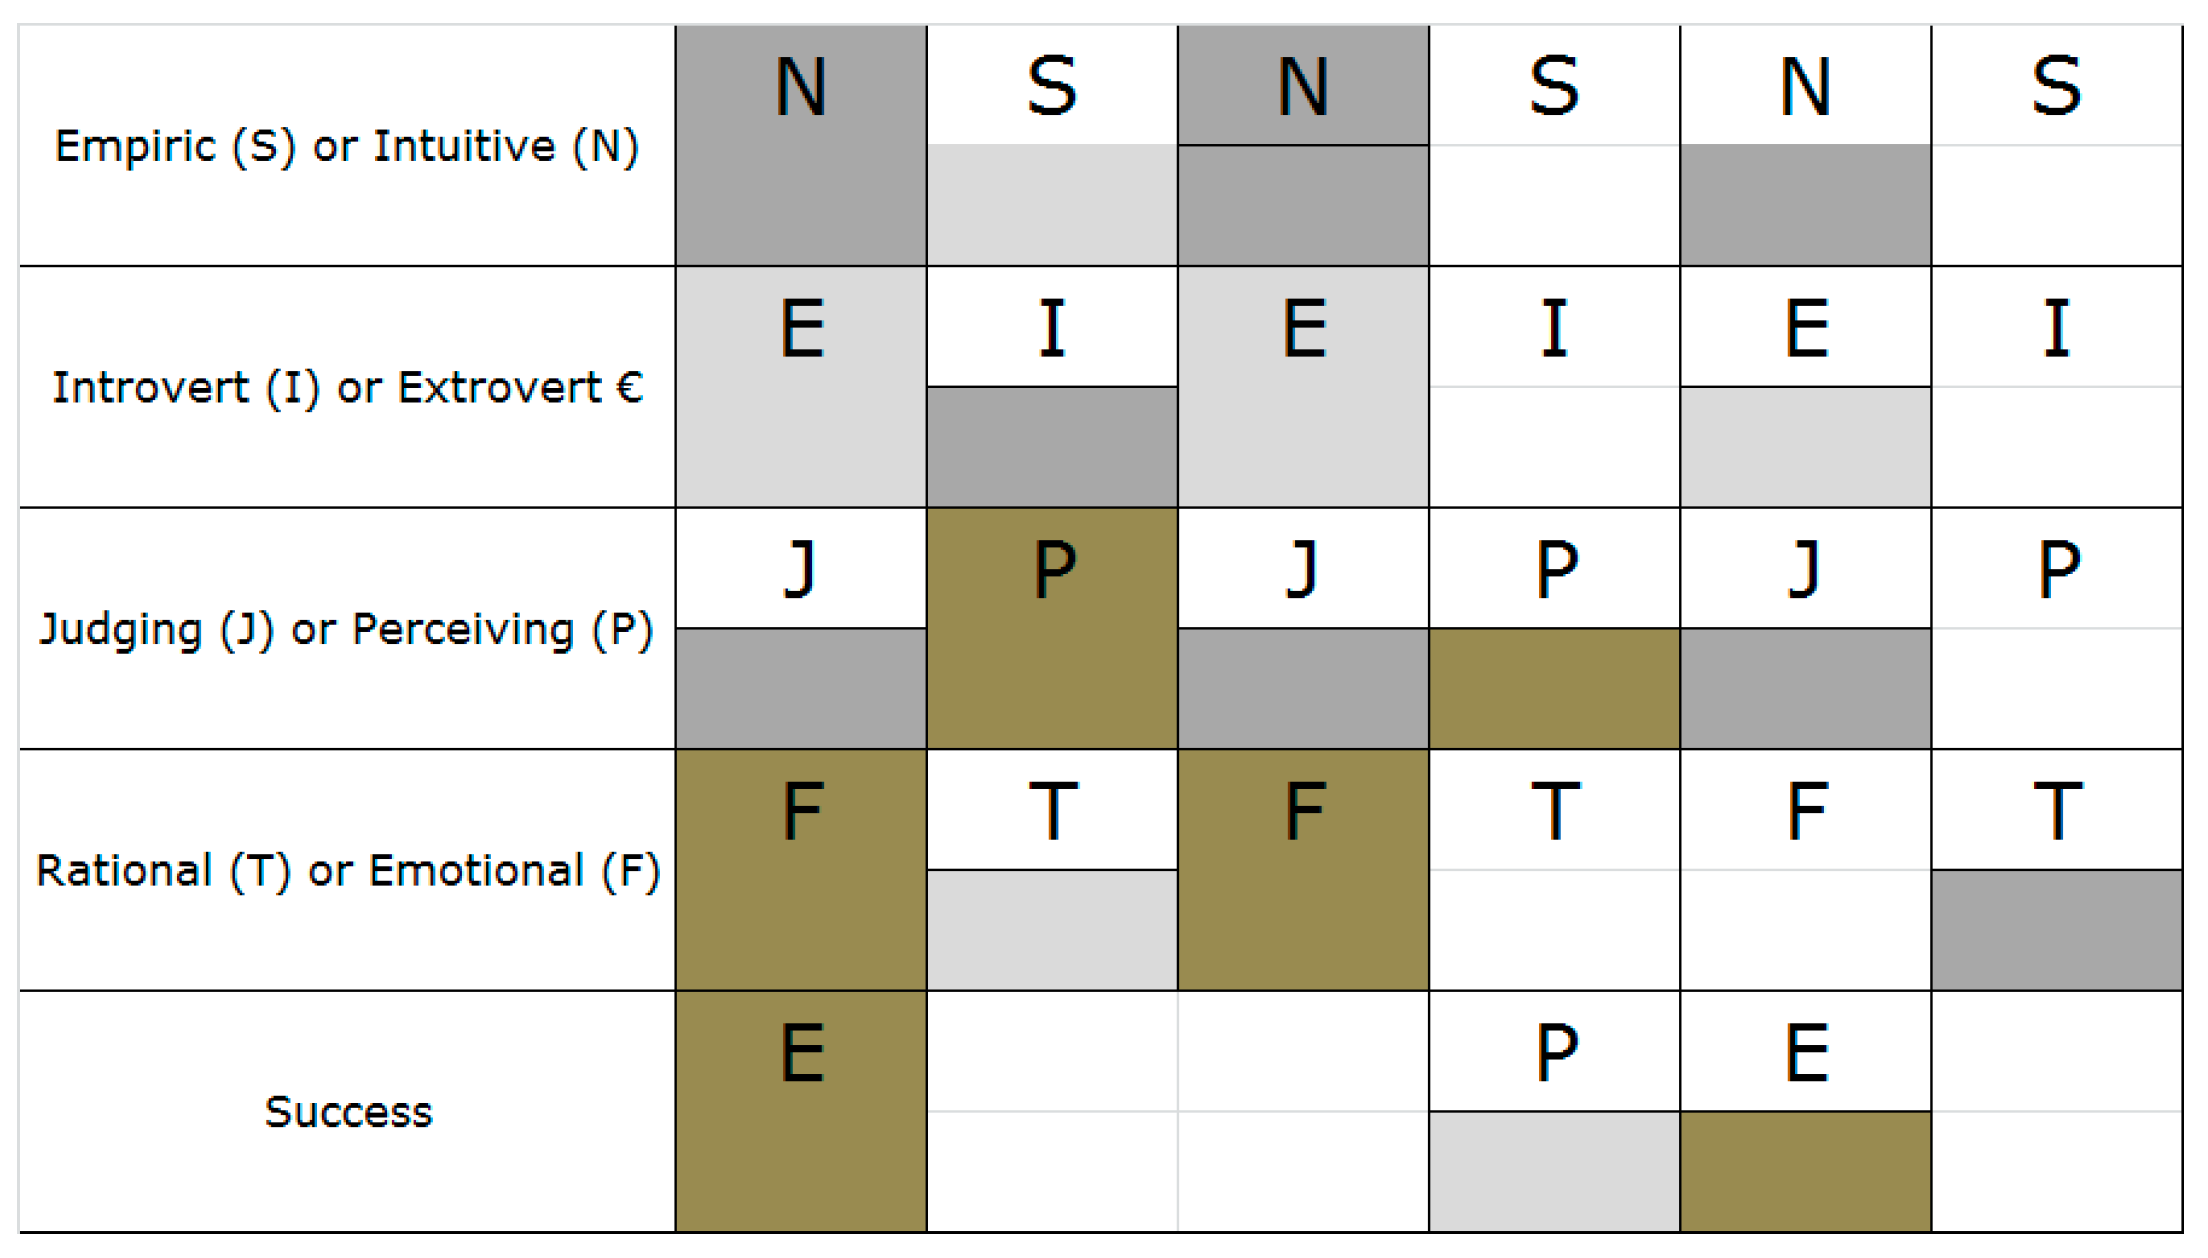
Figure 4 shows profiles for the course on competences, in which the profiles of excellent and poor were almost similar and the profile of good had different cognitive styles. What also stood out from these results is that the introverts were clustered in the excellent group, implying that they understood this course material better.
There are occasions in which it is impossible to isolate the complete cognitive profile of successful students, as shown in Figure 5. Nonetheless, partial information could be detected. For instance, taking a closer look at the first two cognitive attributes, the empiric and introvert students are only part of the first group of students in the first column. The two types of students all turned out to be excellent by the end of the course.
As for the open education course in Figure 6, the first cluster contained students with excellent and poor success, whereas the second cluster contained students with good and poor success. The two clusters overlapped in cognitive styles. This confusion was resolved in the third cluster, in which it was determined that students with poor success are empiric and judging, as opposed to in mathematics, in which deductive thinking and reasoning are applied. As a result, I recommend that these students should put more effort into developing a sense of language by listening to conversations between native speakers or by reading learning resources written by native speakers. Alternatively, perceiving and intuitive students have already developed a sense of language, and as a result, they do not need additional activities.

3.4. Deployment of Models

To provide the educator with relevant information acquired by using models defined in the previous subsection, I recommend a Sakai module that utilises the defined models. The instructors can browse through the list of students involved in their course and determine the success of each student. Depending on the predictions that the instructors will get, they will either improve or change their approaches to working with students that are not predicted to be excellent or to engage more with students that are predicted to be excellent.
The educators can then analyse and track each student according to his or her expected success based on the cognitive style. The result will inform them to either change their approach for the specific student or opt for learning materials that better fit the student’s needs.

4. Discussion

Predicting students’ success and the grouping of students are common practices in EDM and serve as valuable tools for educators and students. I have presented a case study that involves gathering information based on web usage from the distance learning system at Universidad Internacional de La Rioja (UNIR) in Spain. I further defined the automatic procedure for data extraction from the Sakai LMS and the pre-processing technique that converts the data into usable forms for EDM algorithms. I proceeded to create classification models that were accurate enough to predict whether students will have an excellent performance on a different course based on the data mined from their web usage. Moreover, describing students in terms of cognitive style is not a demanding exercise within an educational context. However, I encourage further use of these data; therefore, I built a clustering model that identifies the groups of students with similar cognitive styles and different success. Afterwards, the defined models were evaluated and used to construct a Sakai module that informed instructors to consider the following: To differentiate students with whom they can collaborate or to identify students in need of extra attention on a given course. The instructor could also tell from the prediction how best to adapt their learning materials to better suit the specific needs of individual students based on their cognitive styles.

5. Limitations of the Study

I acknowledge the limitation of the sample size, which was smaller than intended. The research was planned with a slightly larger number of participating students and instructors. However, organisational issues prevented some students and instructors from taking part in the study. In particular, the different start dates between semesters in various locations (Latam and Spain) do not support coordinated actions across learning centres. Along with this limitation, there was a potential cultural bias: The study was conducted at a Spanish university with students from Spain and Latin America. Usually, the respect and joint work between universities in Spain and Latam are satisfactory, although sometimes, the ways of expression and cultural approaches to specific research make a study’s implementation subject to interpretation. These factors must be considered when interpreting the results. Nonetheless, having almost 400 students from nine editions of two postgraduate courses over four years makes the results significant enough to extract several interesting conclusions, as I will show in Section 6.

6. Conclusions and Future Work

This article presents a case study of Sakai being deployed in a real learning scenario in which the faculty members provided support to 392 students from the nine last editions of two academic postgraduate programmes, from 2015 to 2019. The tool, aimed at helping the instructors in tailoring the learning resources to meet the students’ needs, makes use of similarity metrics to compare students with those from background courses, observing how they performed. In a way, the system analyses the users’ current behaviour to predict their future evolved behaviour and the final related outcome. The goal of the case study was the validation of the tool in terms of usability, perceived usefulness, and accuracy. In terms of usability, no major usability issues were detected, and the users had a favourable opinion of the interface. Therefore, Sakai’s usability is considered to be in a stable state. As for perceived usefulness, the analysis of the instructors’ usage of the tool, responses to the survey, and responses during the interviews show that the instructors were able to identify cases that they would not have identified otherwise. Therefore, Sakai was perceived as a useful tool that supported tutoring tasks. Finally, in terms of accuracy, the information presented by Sakai was contextualised by the instructors, who were able to estimate the students’ scores. The instructors estimated that the students were better in those cases in which the students ended up passing the course, while Sakai behaved as an early warning system for students at risk.
The results of this study largely agree with previous research that demonstrates the stable status of Sakai’s usability: That is, no major issue was identified, and a new function was suggested to provide better support. The instructors recognised the utility of the tool since they detected situations that would not have been detected otherwise. Furthermore, they scheduled tasks to overcome these situations, which is precisely the goal of a supporting tool.
One important lesson learned is the need to separate description from estimation; that is, Sakai is a descriptive system that provides a visual representation of the similarities between students from previous courses, and the end-user can easily understand such information as an estimation. Despite the results showing the estimation capability of Sakai, the nature of the tool is descriptive, and this fact must be understood by the end-user in order to interpret its results. The data show that Sakai’s predictions complemented those of the tutor, showing its potential as a supportive tool for instructors and teachers.
In the future, I seek a larger data sample that will enable more classification and clustering algorithms to achieve better fitting of models to web usage data. I also propose the incorporation of data from students’ social network pages to better understand their personalities.

Funding

No external funding received.

Conflicts of Interest

The author declares no conflict of interest.

References

  1. Cavus, N.; Zabadi, T. A comparison of open source learning management systems. Proced.-Soc. Behav. Sci. 2014, 143, 521–526. [Google Scholar] [CrossRef] [Green Version]
  2. De Bra, P.; Smits, D.; Van Der Sluijs, K.; Cristea, A.I.; Foss, J.; Glahn, C.; Steiner, C.M. GRAPPLE: Learning management systems meet adaptive learning environments. In Intelligent and Adaptive Educational-Learning Systems; Springer: Berlin/Heidelberg, Germany, 2013; pp. 133–160. [Google Scholar]
  3. Siemens, G.; Baker, R.S.J.d. Learning analytics and educational data mining. In Proceedings of the 2nd International Conference on Learning Analytics and Knowledge—LAK ’12, Vancouver, BC, Canada, 29 April–2 May 2012; ACM Press: New York, NY, USA, 2012; p. 252. [Google Scholar] [CrossRef]
  4. Gronlund, N.E. Assessment of Student Achievement; Allyn & Bacon Publishing: Boston, MA, USA, 1998. [Google Scholar]
  5. Salehi, M.; Kamalabadi, I.N.; Ghoushchi, M.B.G. An effective recommendation framework for personal learning environments using a learner preference tree and a GA. IEEE Transactions on learning technologies. IEEE 2013, 6, 350–363. [Google Scholar]
  6. Lorenzen, S.; Hjuler, N.; Alstrup, S. Tracking behavioral patterns among students in an online educational system. arXiv 2019, arXiv:1908.08937. [Google Scholar]
  7. Dunn, K.E.; Rakes, G.C.; Rakes, T.A. Influence of academic self-regulation, critical thinking, and age on online graduate students’ academic help-seeking. Distance Educ. 2014, 35, 75–89. [Google Scholar] [CrossRef]
  8. Greene, J.A.; Azevedo, R. A theoretical review of Winne and Hadwin’s model of self-regulated learning: New perspectives and directions. Rev. Educ. Res. 2007, 77, 334–372. [Google Scholar] [CrossRef] [Green Version]
  9. Leony, D.; Crespo, R.M.; Pérez-Sanagustín, M.; Parada G., H.A.; de-la-Fuente-Valentín, L.; Pardo, A. Coverage metrics for learning-event datasets based on client-side monitoring. In Proceedings of the 1st Workshop on Bootstrapping Learning Analytics Held at ICALT, Rome, Italy, 4–6 July 2012. [Google Scholar]
  10. Tobarra, L.; Ros, S.; Hernández, R.; Robles-Gómez, A.; Caminero, A.C.; Pastor, R. Integration of multiple data sources for predicting the engagement of students in practical activities. Int. J. Int. Multimed. Artif. Intell. 2014, 2, 53–62. Available online: http://www.ijimai.org/journal/node/676 (accessed on 30 November 2019). [CrossRef]
  11. Mangaroska, K.; Giannakos, M.N. Learning analytics for learning design: A systematic literature review of analytics-driven design to enhance learning. IEEE Trans. Learning Technol. 2018. [Google Scholar] [CrossRef] [Green Version]
  12. Lukarov, V.; Chatti, M.A.; Schroeder, U. Learning analytics evaluation—Beyond usability. In Proceedings of the DeLFI Workshops; Rathmayer, S., Pongratz, H., Eds.; CEUR Workshop Proceedings: Aachen, Germany, 2015; pp. 123–131. [Google Scholar]
  13. Dawson, S.; Gašević, D.; Siemens, G.; Joksimovic, S. Current state and future trends: A citation network analysis of the learning analytics field. In Proceedings of the Fourth International Conference on Learning Analytics and Knowledge—LAK ’14, Indianapolis, IN, USA, 24–28 March 2014; ACM Press: New York, NY, USA; pp. 231–240. [Google Scholar] [CrossRef]
  14. Shneiderman, B. The eyes have it: A task by data type taxonomy for information visualizations. In Proceedings of the 1996 IEEE Symposium on Visual Languages, Boulder, CO, USA, 3–6 September 1996. [Google Scholar] [CrossRef] [Green Version]
  15. Cambruzzi, W.; Rigo, S.J.; Barbosa, J.L.V. Dropout prediction and reduction in distance education courses with the learning analytics multitrail approach. J. Univers. Comput. Sci. 2015, 21, 23–47. [Google Scholar]
  16. Agudo-Peregrina, Á.F.; Iglesias-Pradas, S.; Conde-González, M.Á.; Hernández-García, Á. Can we predict success from log data in VLEs? Classification of interactions for learning analytics and their relation with performance in VLE-supported F2F and online learning. Comput. Hum. Behav. 2014, 31, 542–550. [Google Scholar] [CrossRef]
  17. Papamitsiou, Z.; Economides, A.A. Learning analytics and educational data mining in practice: A systematic literature review of empirical evidence. J. Educ. Technol. Soc. 2014, 17, 49–64. [Google Scholar]
  18. Romero, C.; López, M.I.; Luna, J.M.; Ventura, S. Predicting students’ final performance from participation in on-line discussion forums. Comput. Educ. 2013, 68, 458–472. [Google Scholar] [CrossRef]
  19. Prieto, L.P.; Rodríguez Triana, M.J.; Martínez Maldonado, R.; Dimitriadis, Y.A.; Gašević, D. Orchestrating learning analytics (OrLA): Supporting inter-stakeholder communication about adoption of learning analytics at the classroom level. Australas. J. Educ. Technol. 2019, 35, 14–33. [Google Scholar] [CrossRef]
  20. IMS. IMS Global Learning Learning and Tools Interoperability, v1.3. 2018. Available online: https://www.imsglobal.org/activity/learning-tools-interoperability (accessed on 29 November 2019).
  21. Bainbridge, J.; Melitski, J.; Zahradnik, A.; Lauría, E.J.M.; Jayaprakash, S.; Baron, J. Using learning analytics to predict at-risk students in online graduate public affairs and administration education. J. Public Aff. Educ. 2015, 21, 247–262. [Google Scholar] [CrossRef]
  22. Jayaprakash, S.M.; Moody, E.W.; Lauría, E.J.M.; Regan, J.R.; Baron, J.D.; Baron, J.D. Early alert of academically at-risk students: An open source analytics initiative. J. Learn. Anal. 2014, 1, 6–47. [Google Scholar] [CrossRef] [Green Version]
  23. Chin, W.W.; Salisbury, W.D.; Pearson, A.W.; Stollak, M.J. Perceived cohesion in small groups: Adapting and testing the perceived cohesion scale in a small-group setting. Small Group Res. 1999, 30, 751–766. [Google Scholar] [CrossRef]
  24. Romero-Zaldivar, V.-A.; Pardo, A.; Burgos, D.; Delgado Kloos, C. Monitoring student progress using virtual appliances: A case study. Comput. Educ. 2012, 58, 1058–1067. [Google Scholar] [CrossRef] [Green Version]
  25. Allinson, C.W.; Hayes, J. The cognitive style index: A measure of intuition-analysis for organizational research. J. Manag. Stud. 1996, 33, 119–135. [Google Scholar] [CrossRef]
  26. Reeve, J. Why teachers adopt a controlling motivating style toward students and how they can become more autonomy supportive. Educ. Psychol. 2009, 44, 159–175. [Google Scholar] [CrossRef]
  27. Riding, R.; Rayner, S. Cognitive Styles and Learning Strategies: Understanding Style Differences in Learning and Behavior; David Fulton Publishers: London, UK, 2013. [Google Scholar]
Figure 1. Educational data mining (EDM) analysis.
Sustainability 11 06883 g001
Figure 2. Setup of the pre-processing.
Sustainability 11 06883 g002
Figure 3. Students’ profiles for a course on mathematics.
Sustainability 11 06883 g003
Figure 4. Students’ profiles for a course on competences.
Sustainability 11 06883 g004
Figure 5. Students’ profiles for a course on project management.
Sustainability 11 06883 g005
Figure 6. Students’ profiles for a course on open education.
Sustainability 11 06883 g006
Table 1. Stream of automatic extraction and aggregation.
NameDescription
CourseIdentification number of the course
n_assigmentNumber of the assignment done
n_quizNumber of quizzes taken
n_quiz_aNumber of quizzes passed
n_quiz_sNumber of quizzes passed
n_postsNumber of messages sent to the forum
n_readMessages read on the forum
Total_time_assignmentTotal time spent on assignments
Total_time_quizTotal time spent on quizzes
Total_time_forumTotal time spent on forum
MarkFinal mark obtained by the student in the course.
Table 2. Default parameters and random seeds.
AlgorithmAccuracyAUCLift
AdaBoost (J4.8)91.74%0.82564.1071
Bagging (J4.8 unprunned)90.87%0.75042.0536
J4.893.04%0.50001
LDA93.04%0.50001
Logistic Regression92.17%0.51811.0575
Nauve Bayes53.48%0.72221.5375
Neural Net (Rapid default)91.30%0.83464.7917
Random Forests93.04%0.74987.1875
Table 3. Results out of the pre-processing and parameter optimisation steps.
No PreprocessHandle MissingOptimize ParametersAttribute Selection
RandForests0.7500.8580.8900.848
Adaboost0.8260.7790.8390.838
NeuralNet0.8350.7670.8530.812

