4.2. The Impact of Green Bond Issuance on Corporate Stock Prices
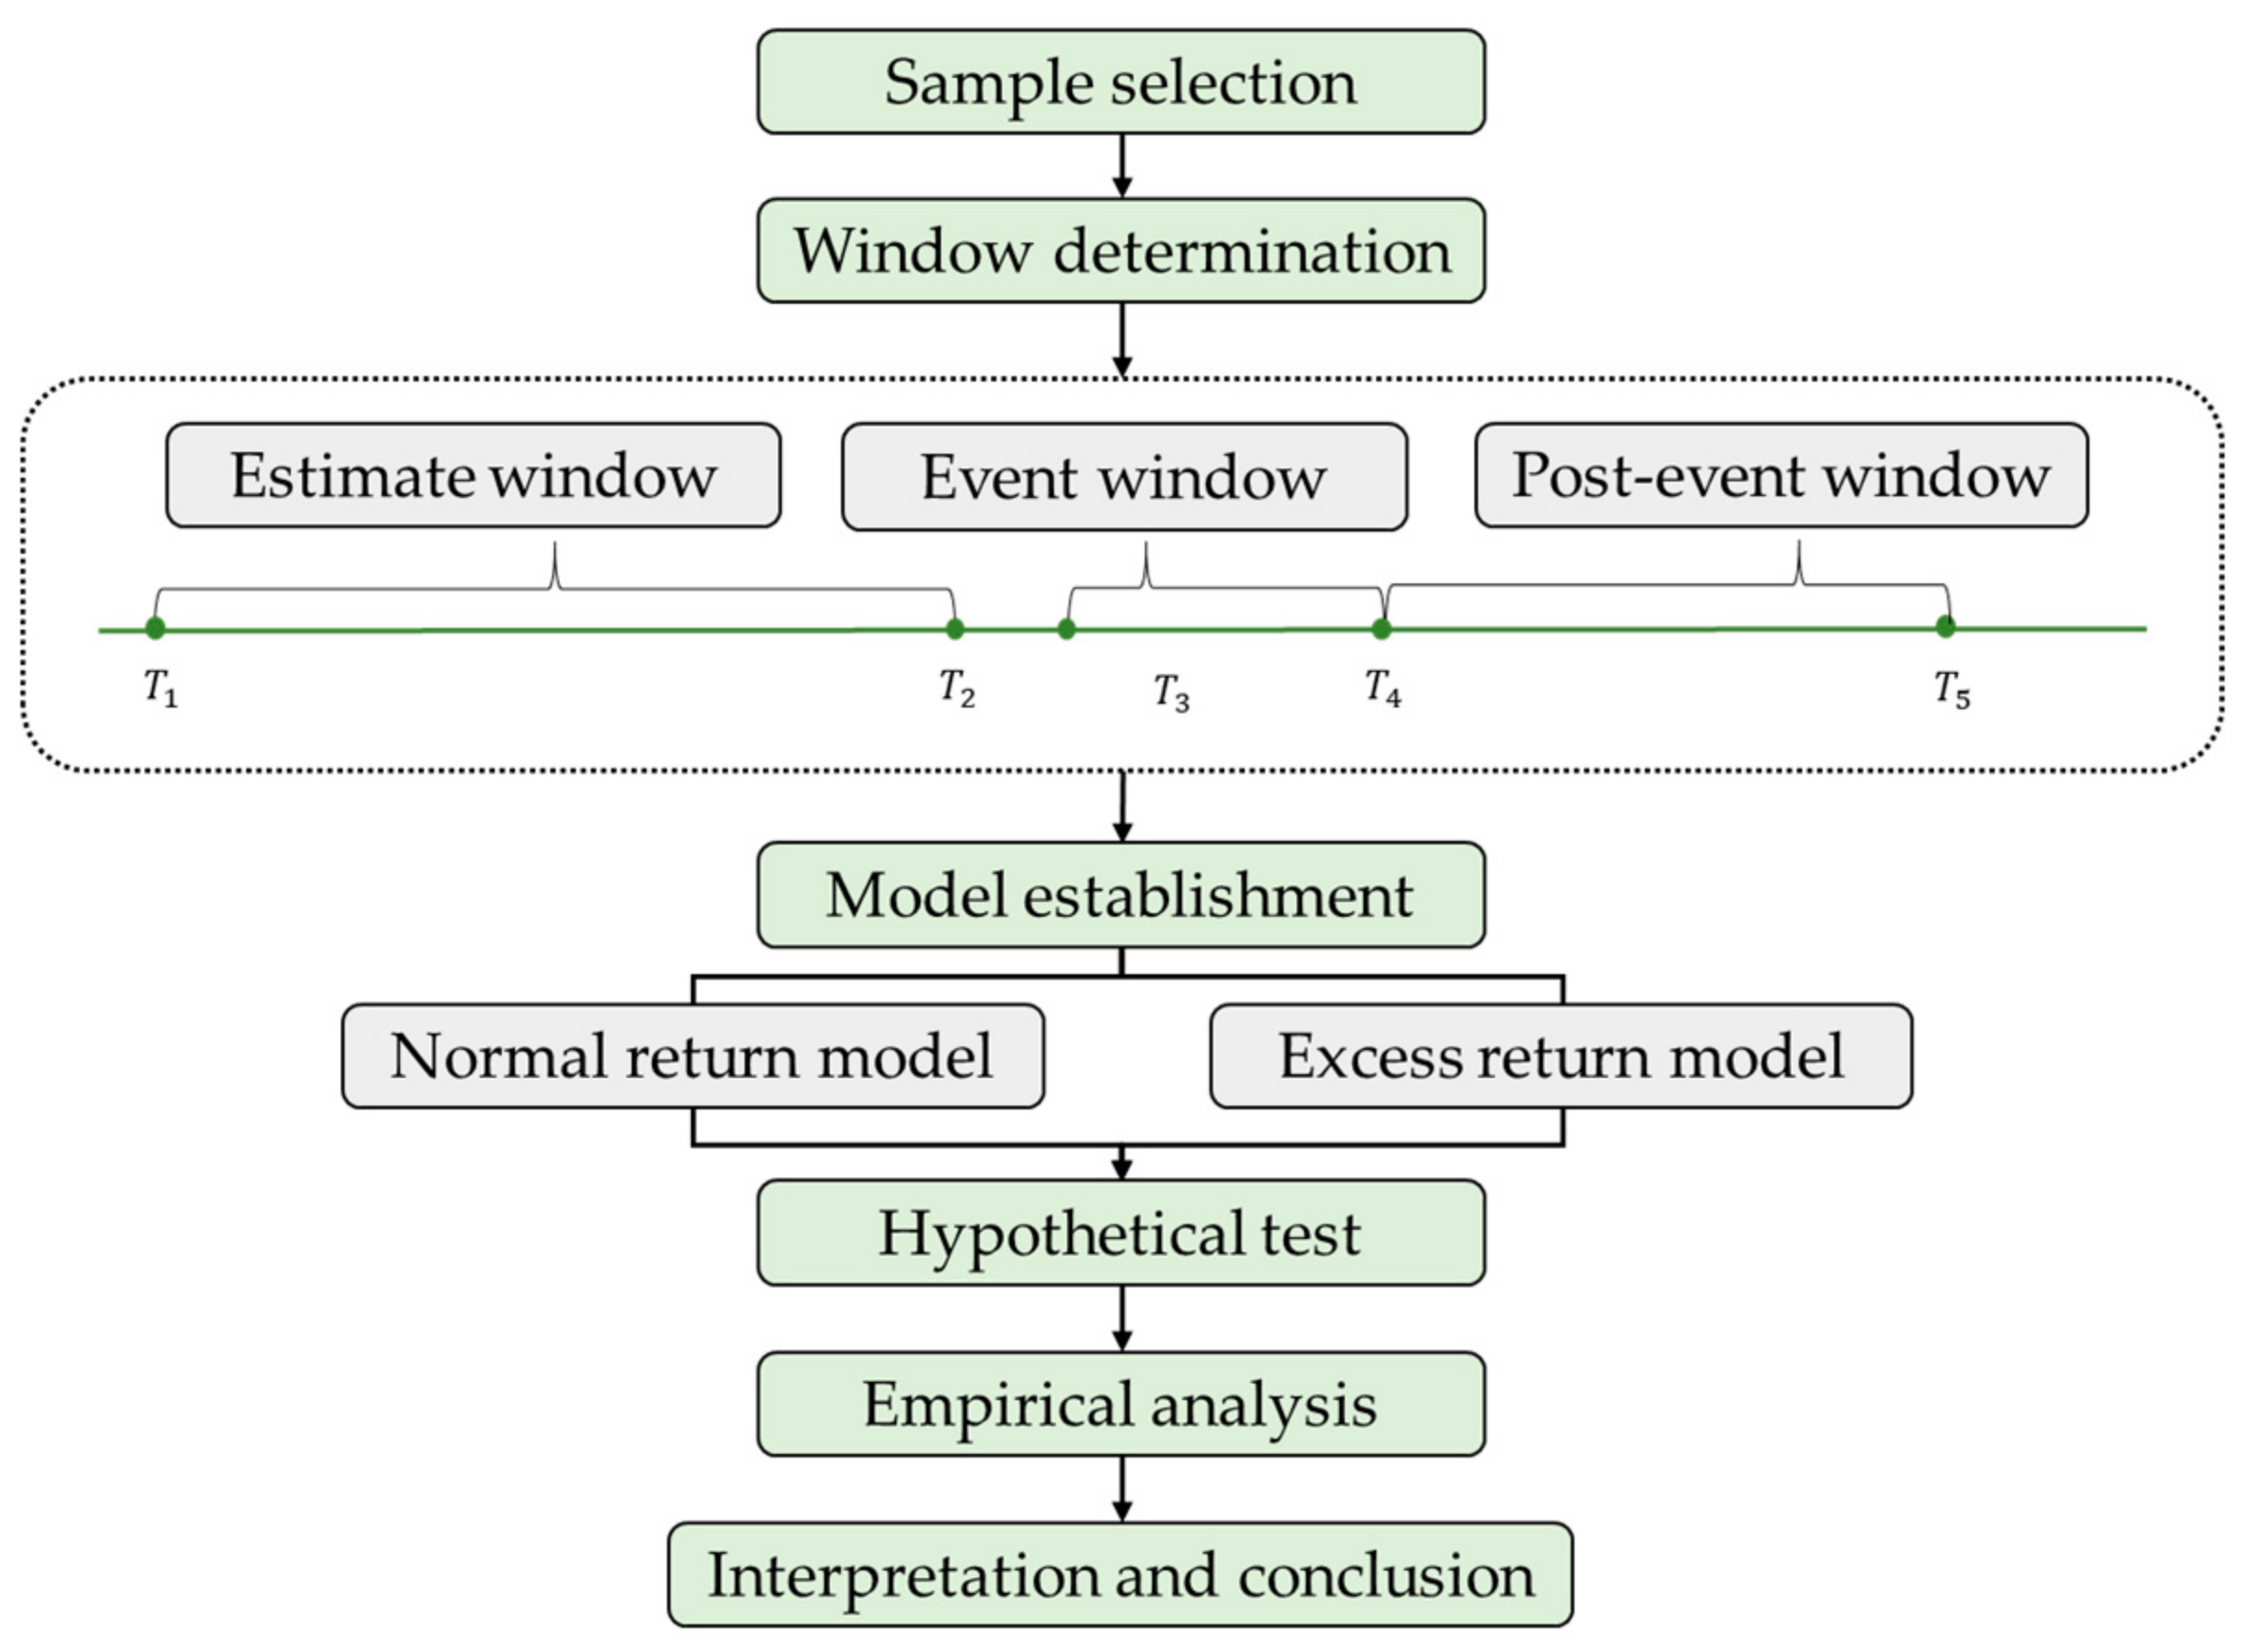
In this paper, the date of the bond issuance announcement is considered to be the date of the occurrence of the event, and the event study approach is used to evaluate the reaction of the stock market to the issuance of green bonds. The announcement date is preferred over the issuance date because the announcement date is when new information is transferred to the market, while no new information is transferred to the market on the issuance date.
Selection of windows is related to the degree of the event’s impact and the research objective, which should be determined in accordance with the specific situation. For example, when examining the impact of the announcement and the factors influencing the issuance of bonds, Chin and Abdullah [
29] considered numerous windows including [−20, −1], [−5, −1], [0, 1], [1, 5], and [1, 10]. Considering that some information may be exposed in advance, the transaction date prior to the announcement of green bond issuance is also included in the event window; thus, the event window in this paper is [−1, 1]. To analyze changes in stock prices before and after the event, time intervals of [−20, −11] and [−10, 2] prior to the event window and time intervals of [2, 5], [6, 10] and [11, 20] after the event window are used in this paper.
The time interval [−250, −20] is used as the estimation window, and the market model is used to calculate abnormal returns. Cumulative abnormal returns are obtained by adding the daily abnormal returns over a particular time interval. Then, statistical tests are conducted with respect to the daily abnormal returns and cumulative abnormal returns to measure the significance of the event’s impact. In order to show the calculation process in more detail and more clearly, we take "16 SPC G1" green bonds which were issued by Beijing SPC Environment Protection Tech Co., Ltd. (stock code: 002573 SZ, hereinafter referred to as SPC) and listed on the Shenzhen Stock Exchange as an example. The issuance announcement date of "16 SPC G1" green bonds is on 21 October 2016. We take the time interval from 250 days before the issue date to the 20 days before the issue date as the estimation window, which consists of 231 valid trading days from 15 May 2015 to 14 September 2016. According to Equation (1), the daily return rate of Shenzhen composite index (SZCI) was taken as the independent variable and the daily return rate of SPC as the dependent variable for general regression analysis. Intercept and slope of SPC’s market model are obtained through regression. The results are shown in Equation (10), and the R2 of the model is 0.3915.
According to Equation (10), the expected return (
ER) of SPC in the event window [−1, 1], the time interval before the event window [−20, −2], and the time interval after the event window [2, 20] can be predicted. According to Equation (2), the daily abnormal return (
AR) is the difference between the real daily return of SPC and its expected daily return. The results are shown in
Table 3. According to Equation (3), the cumulative abnormal return of each green bond in a certain time interval can be obtained.
In this paper, the 70 green bond issuing companies were divided into 22 financial companies and 48 non-financial companies. The financial companies issued 44 green financial bonds, while the non-financial companies issued 80 green bonds (excluding two green bonds issued by companies that were not listed when the announcement of green bond issuance was made and 18 green bonds that were issued in situations where a company simultaneously issued more than one green bond). After repeating the above calculation process of "16 SPC G1" green bonds, calculating the daily average abnormal returns (
AARs) and significance statistics of green finance bonds according to Equation (4) and Equation (6), we obtained results regarding the 44 green finance bonds issued by financial companies shown in
Table A1 and
Figure 7, and results regarding the 80 green financial bonds issued by non-financial companies shown in
Table A2 and
Figure 8. According to Equation (5) and Equation (7), the average cumulative abnormal returns (
CAARs) and significance statistics of green finance bonds are calculated, and the results for the 44 green finance bonds issued by financial companies are shown in
Table A3 and
Figure 9, while those of the 80 green finance bonds issued by non-financial companies are shown in
Table A4 and
Figure 10.
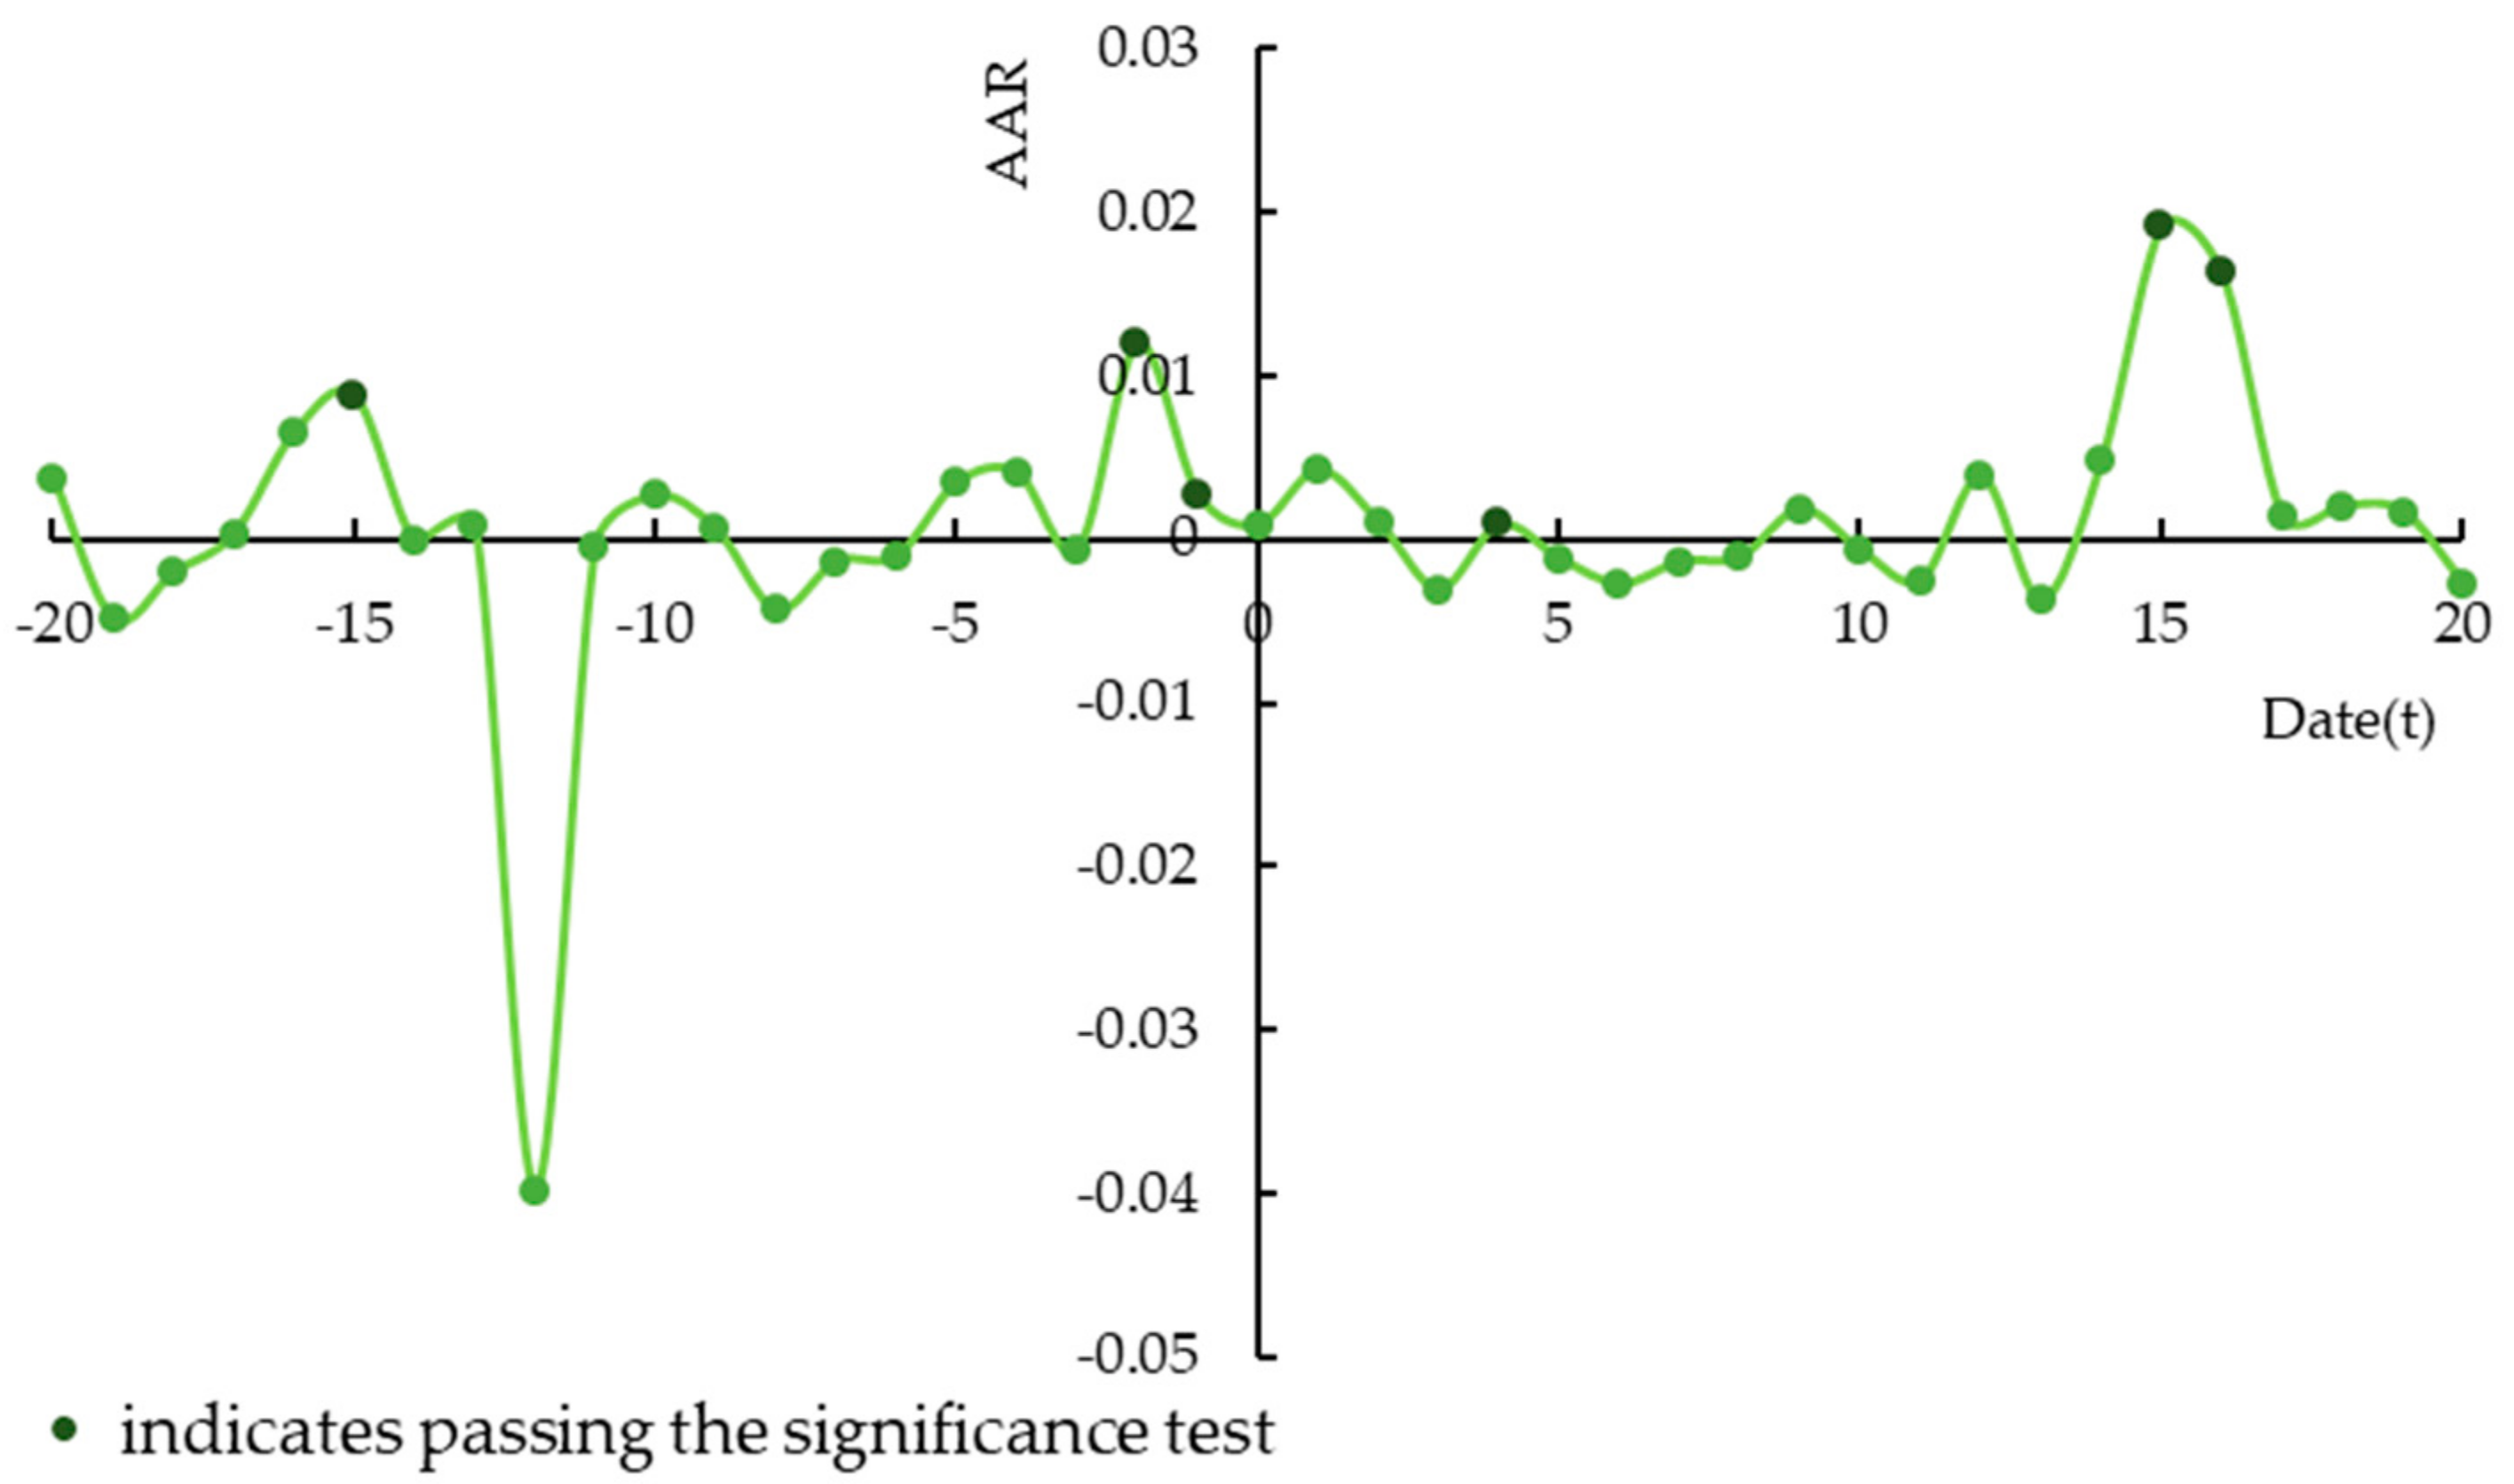
The results shown in
Table A1 and
Figure 7 reveal the daily
AARs and significance in the [−20, 20] window (41 days). The
AARs are negative on 18 days and positive on 23 days. There is no significant change in the situation regarding negative
AARs before and after the occurrence of the event. However, before the event occurs,
AARs are significantly positive at the 1% level when
t = −1 and at the 10% level when
t = −15 and
t = −2. On the day of occurrence,
AARs are positive but not significant. After the event occurs,
AARs are significantly positive at the 5% level when
t = 4 and at the 1% level when
t = 15 and
t = 16. After the event,
AARs are significantly higher than before the event. This indicates that the stock market reacts positively to the issuance of green bonds by financial companies. The significantly positive values when
t = −2 and
t = −1 suggest that information may be disclosed in advance.
The results shown in
Table A2 and
Figure 8 are similar to those shown in
Table A1 and
Figure 7. However, in
Table A2 and
Figure 8, there is no significant
AAR value prior to the event (except for
t = −1). After the event, when
t = 6, the
AAR value is significantly negative at the 5% level. When
t = 10 and
t = 15,
AARs are significantly positive at both the 10% and 5% levels. The significance of
AARs before the event is not obvious, while the significance of
AARs after the event is higher than it is before the event, thus green bond issuance affects the stock market. In addition, the
AAR value is positive at the 5% level when
t = −1. It can also be seen that information about green bond issuance may be disclosed before a formal announcement is made to the stock market, which may have a significant positive impact on the stock prices of the issuing companies.
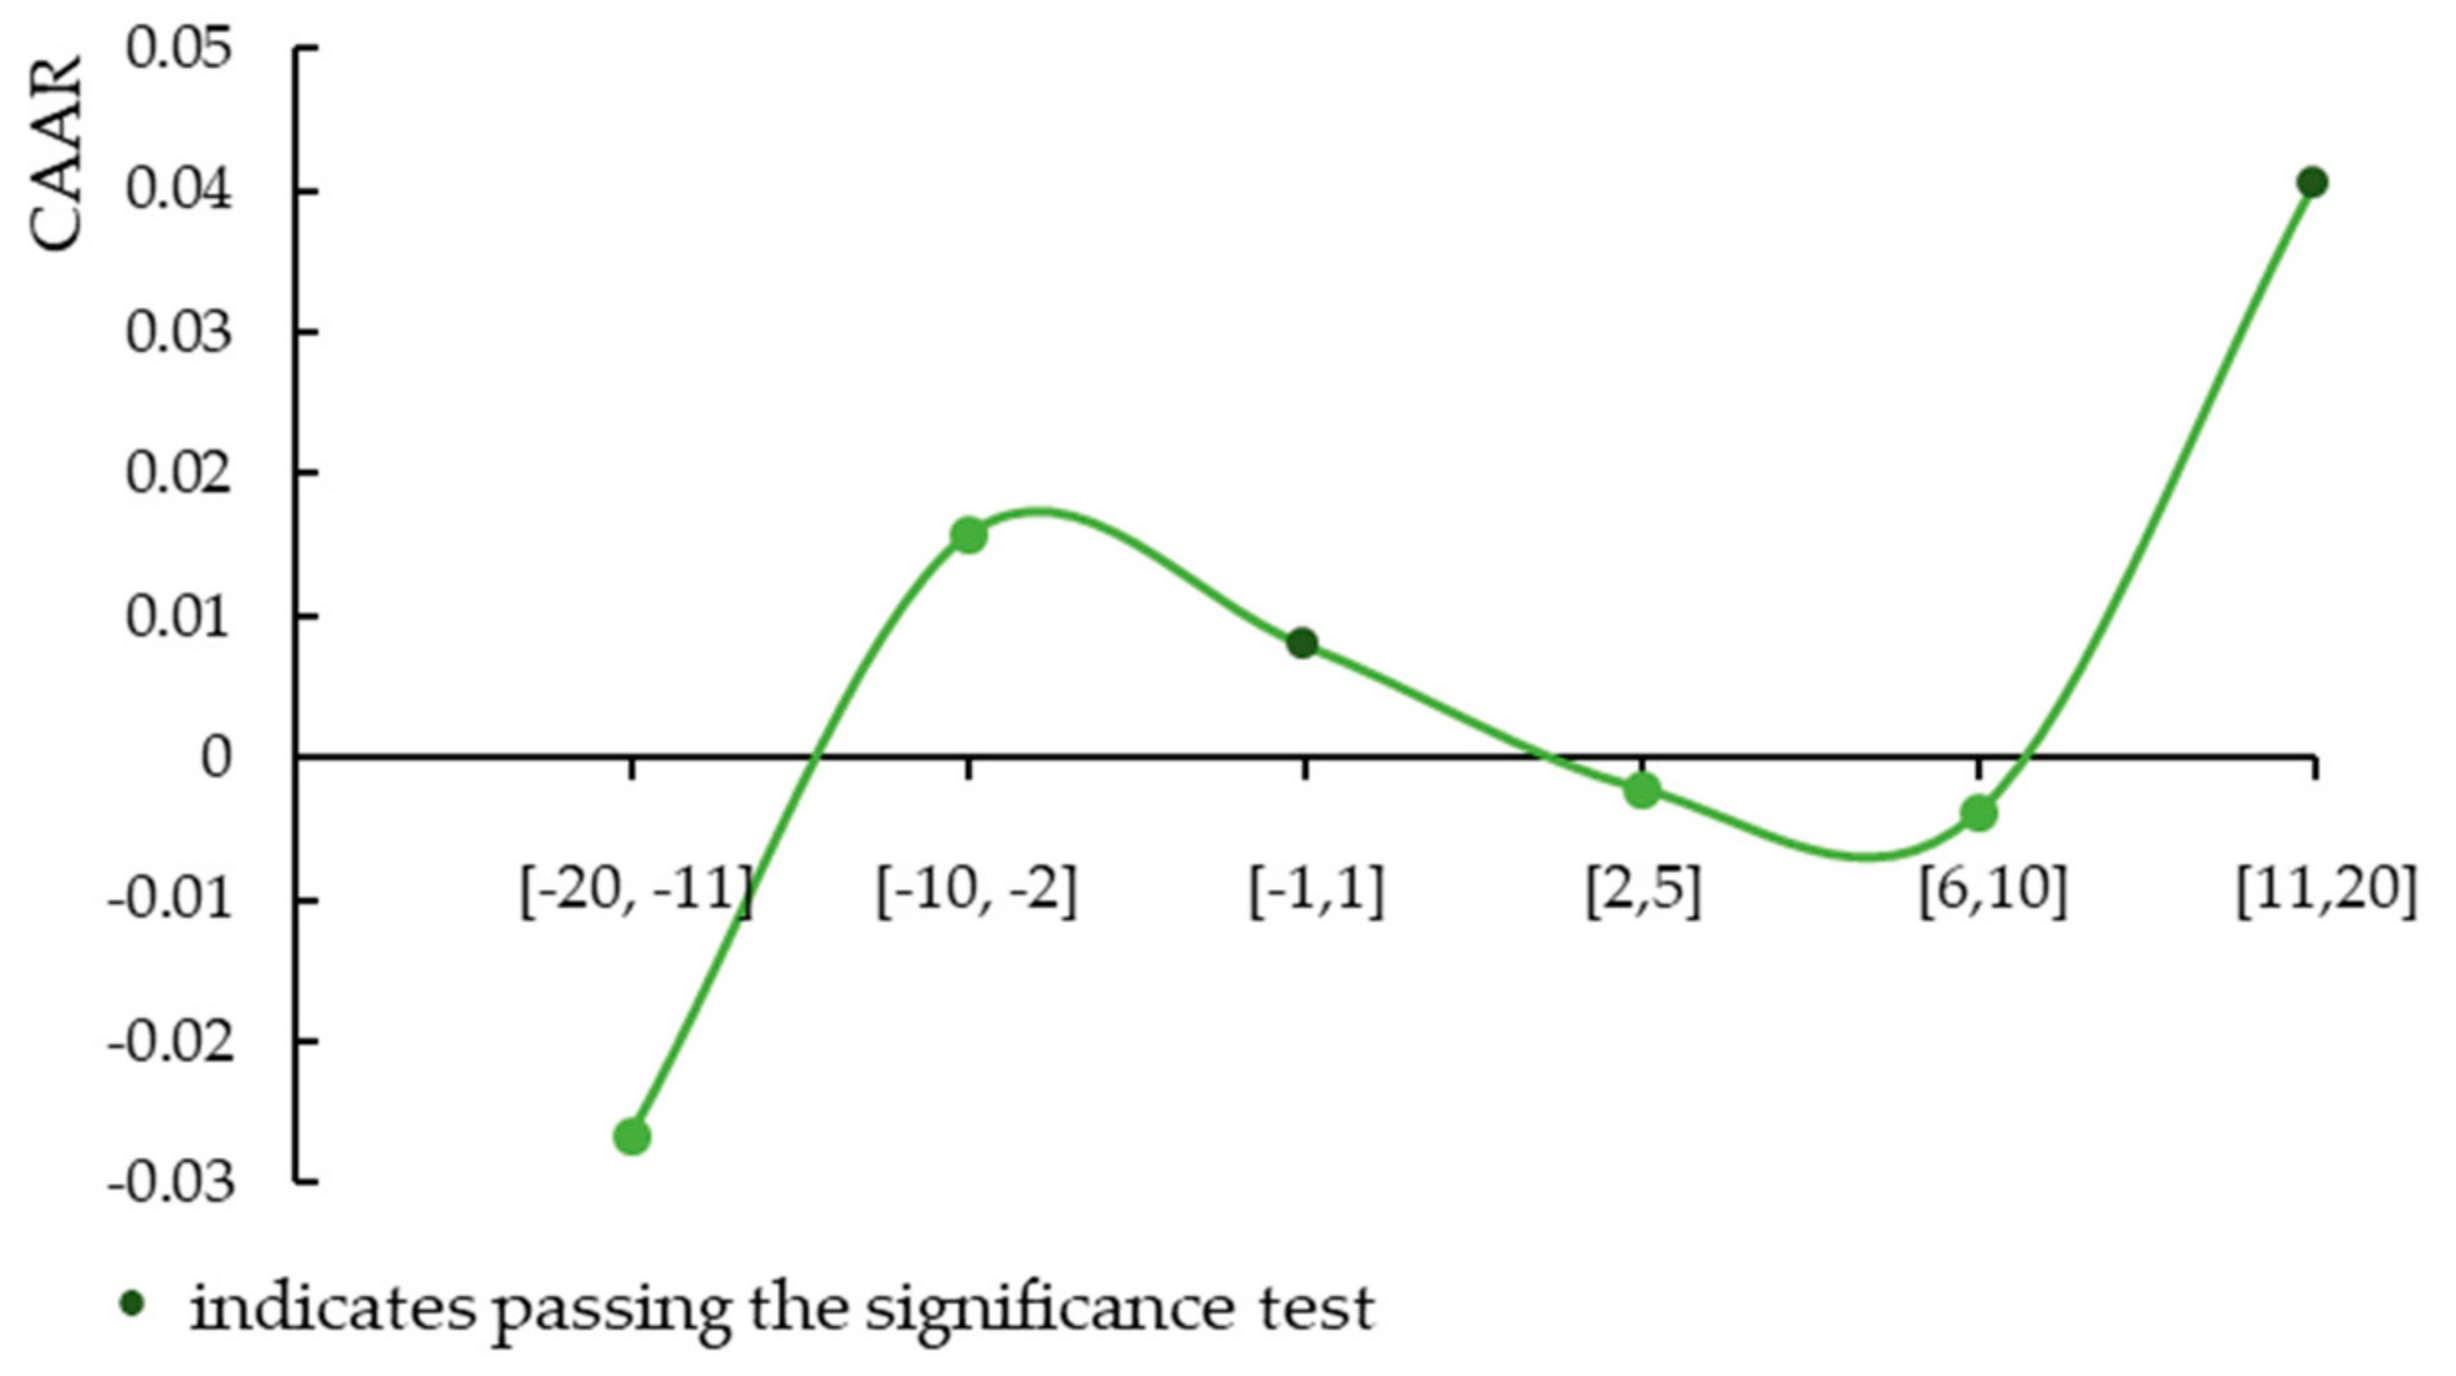
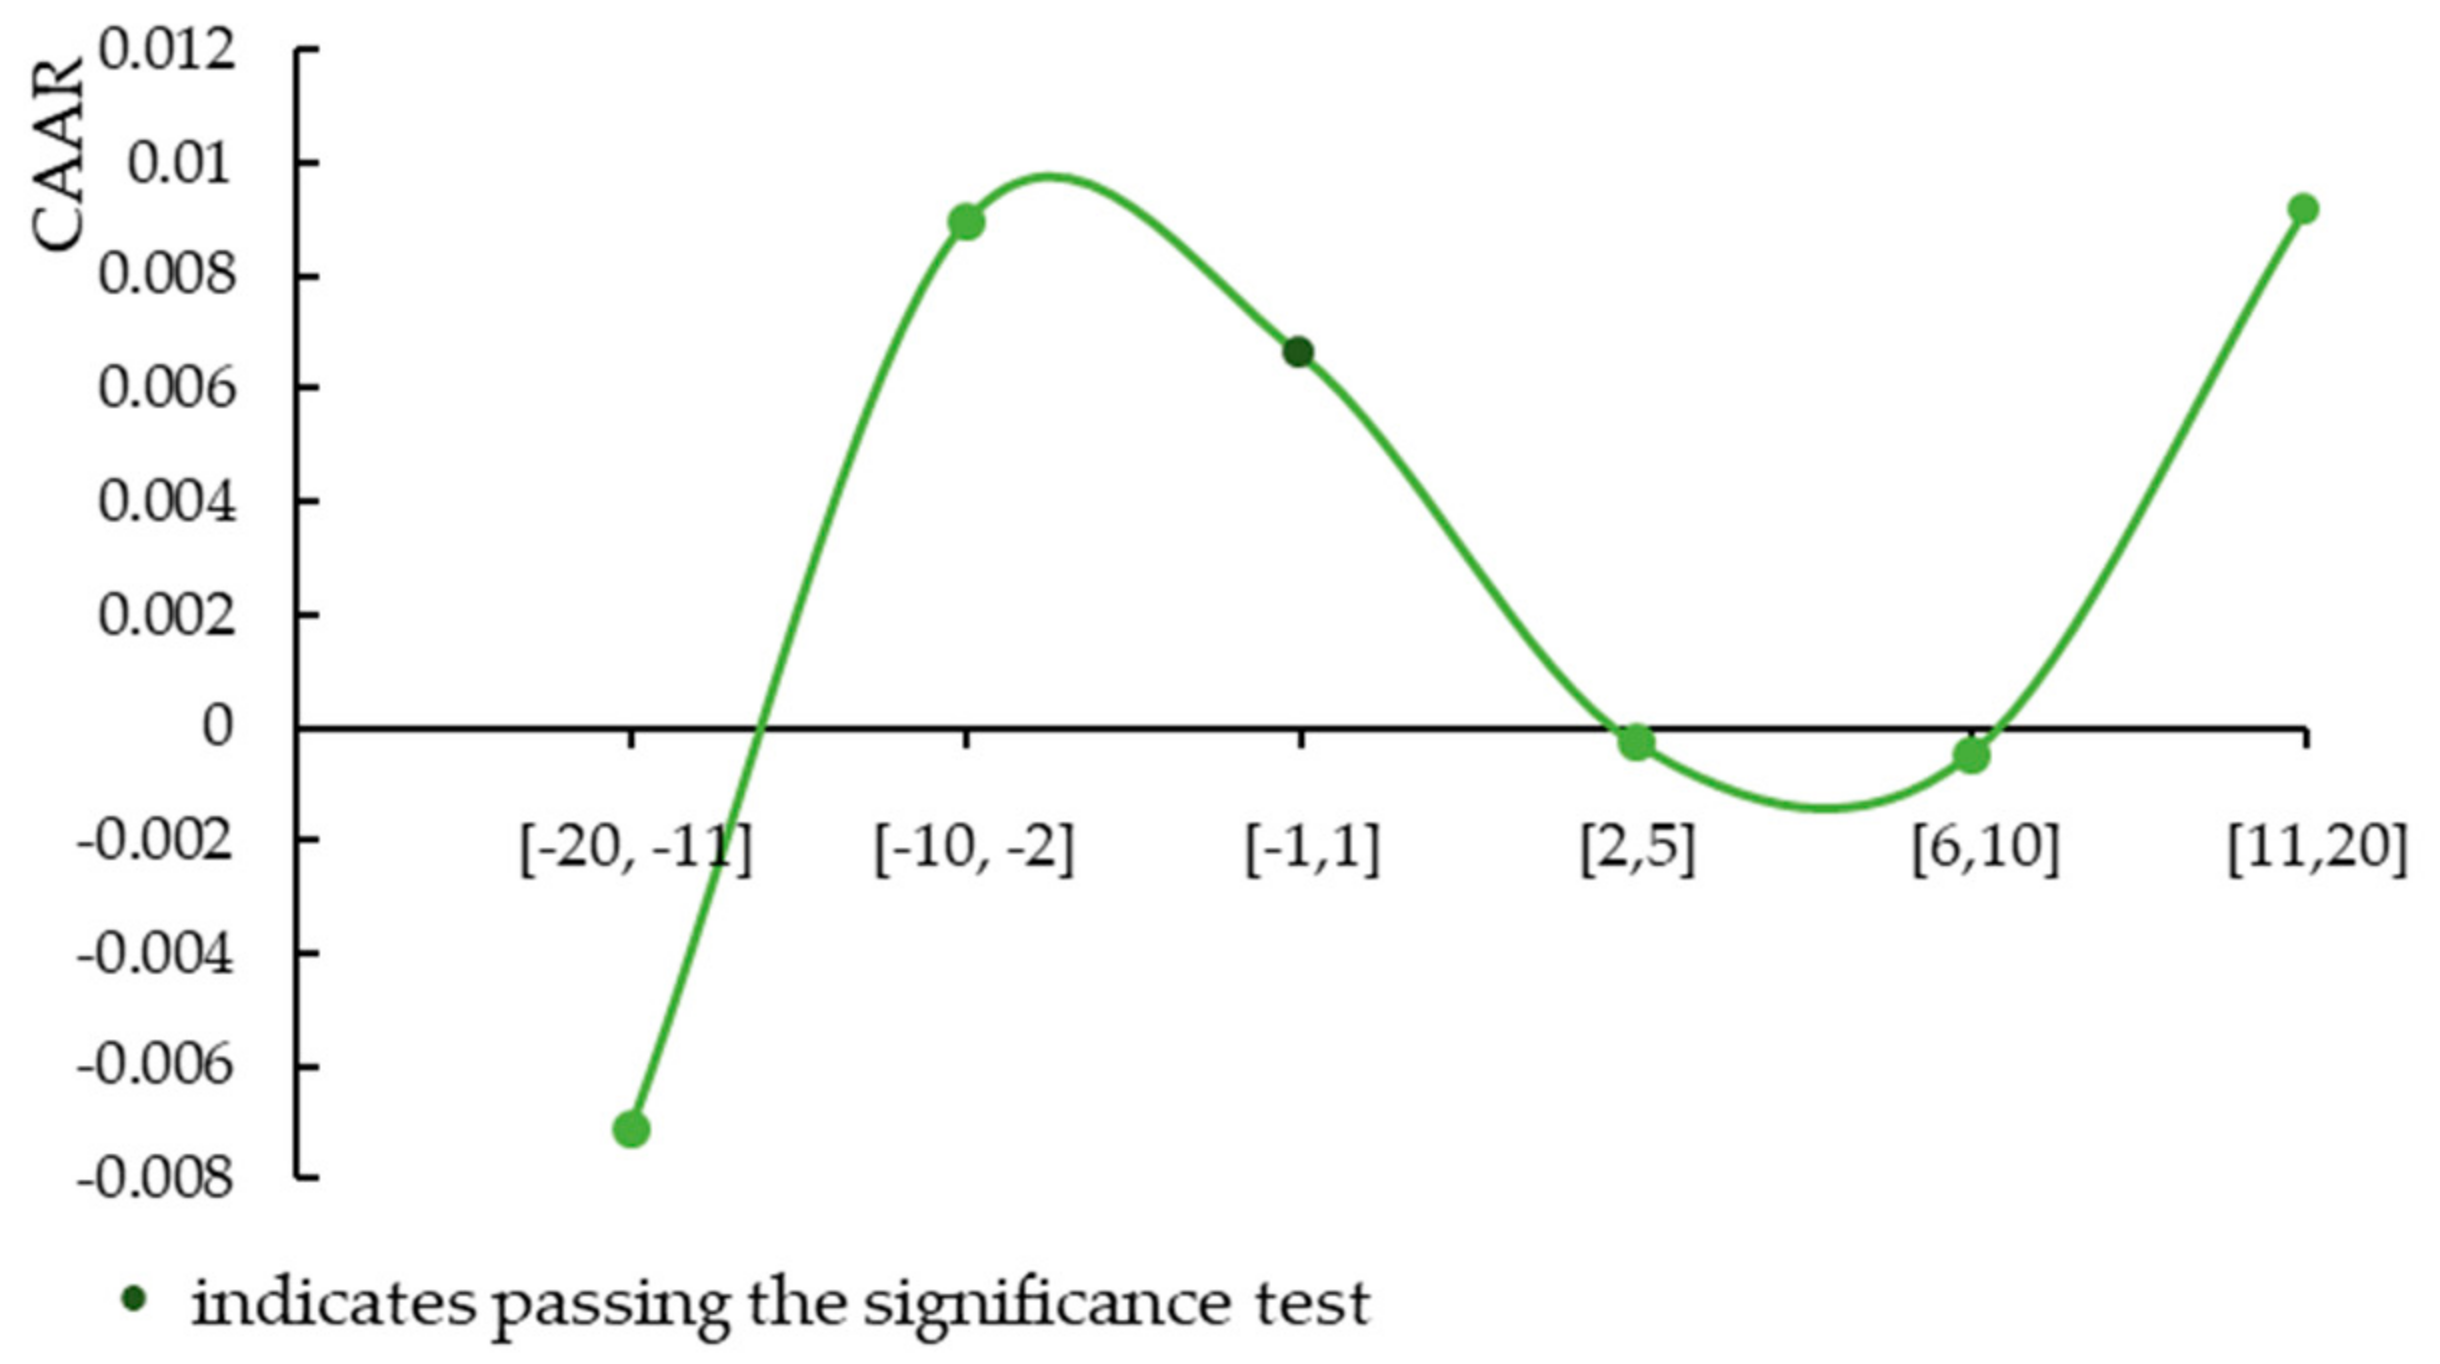
Table A3 and
Figure 9 show the
CAARs and significance of the 44 green financial bonds issued by financial companies within the 41-day time frame ([−20, 11], [−10, −2], [−1, 1], [2, 5], [6, 10], and [11, 20]).
Table A4 and
Figure 10 show the
CAARs and significance of the 80 green bonds issued by non-financial companies within all the above time intervals. It can be seen from
Figure 9 and
Figure 10 that
CAARs are not significantly positive or negative prior to the event, while the
CAAR is significantly positive at the 10% level in the [−1, 1] event window, indicating that green bond issuance has a positive impact on the stock prices of issuing companies. Thus,
H1 is supported. Similar to the findings of Haesen et al. [
18] and Reboredo’s study [
31], we have demonstrated a link between the stock market and the bond market in China. The announcement of issuing green bonds can convey the company’s intention to external stakeholders and thus achieve the purpose of attracting investors.
In contrast to the previous studies, we found that the effect is not satisfactory in the long run although green bonds have a positive announcement effect. Observing the window after the occurrence of the event, it can be seen that
CAARs are negative in the [2, 5] and [6, 10] time intervals, but are not significant, indicating that the market appears to behave bearishly when positive events occur. Meanwhile, it also indicates that investors are not as enthusiastic about the good news associated with green bond issuance, and quickly lose interest [
42]. However, it can be seen from the [11, 20] time interval that the
CAARs of financial companies are significantly positive at the 10% level, while those of non-financial companies are positive but not significant. This suggests that although the attraction is not particularly sustainable, green bond issuance can attract some investors in the long run.
4.3. The Impact of Green Bond Issuance on Corporate Performance
To examine the impact of green bond issuance on corporate performance, three aspects of corporate performance were measured in this paper: Profitability, operational performance, and innovation capacity. Return on total assets (ROA) was used to analyze profitability. This is the ratio of the total returns achieved by an enterprise over a given period to the enterprise’s average total assets and represents overall profitability. Gross profit margin (GPM) is used to represent operational performance, and it is an important operational indicator for listed companies, as it reflects both the current profitability and potential profitability of a company. The ratio of research and development (R&D) to total operational income (short for RDTOI) is used to represent innovation capacity, as this is the enterprise’s key means of achieving core competitiveness and sustainable development. It includes expenses incurred during R&D of products, technologies, materials, processes, and standards, and represents the enterprise’s level of investment in innovation.
To provide more accurate results, financial companies were not included in the analysis of financial performance. The research object was the 43 non-financial companies that issued green bonds from 2016 to 2018. Based on the relevant research on PSM method, a non-alternative one-to-one nearest neighbor matching method was selected. Considering that companies issued green bonds every year from 2016 to 2018, this paper used the year-by-year matching method to find a matching control group for each year’s treatment group, which is similar to the relevant studies conducted by Blundell and Dias [
71] and Heyman et al. [
72]
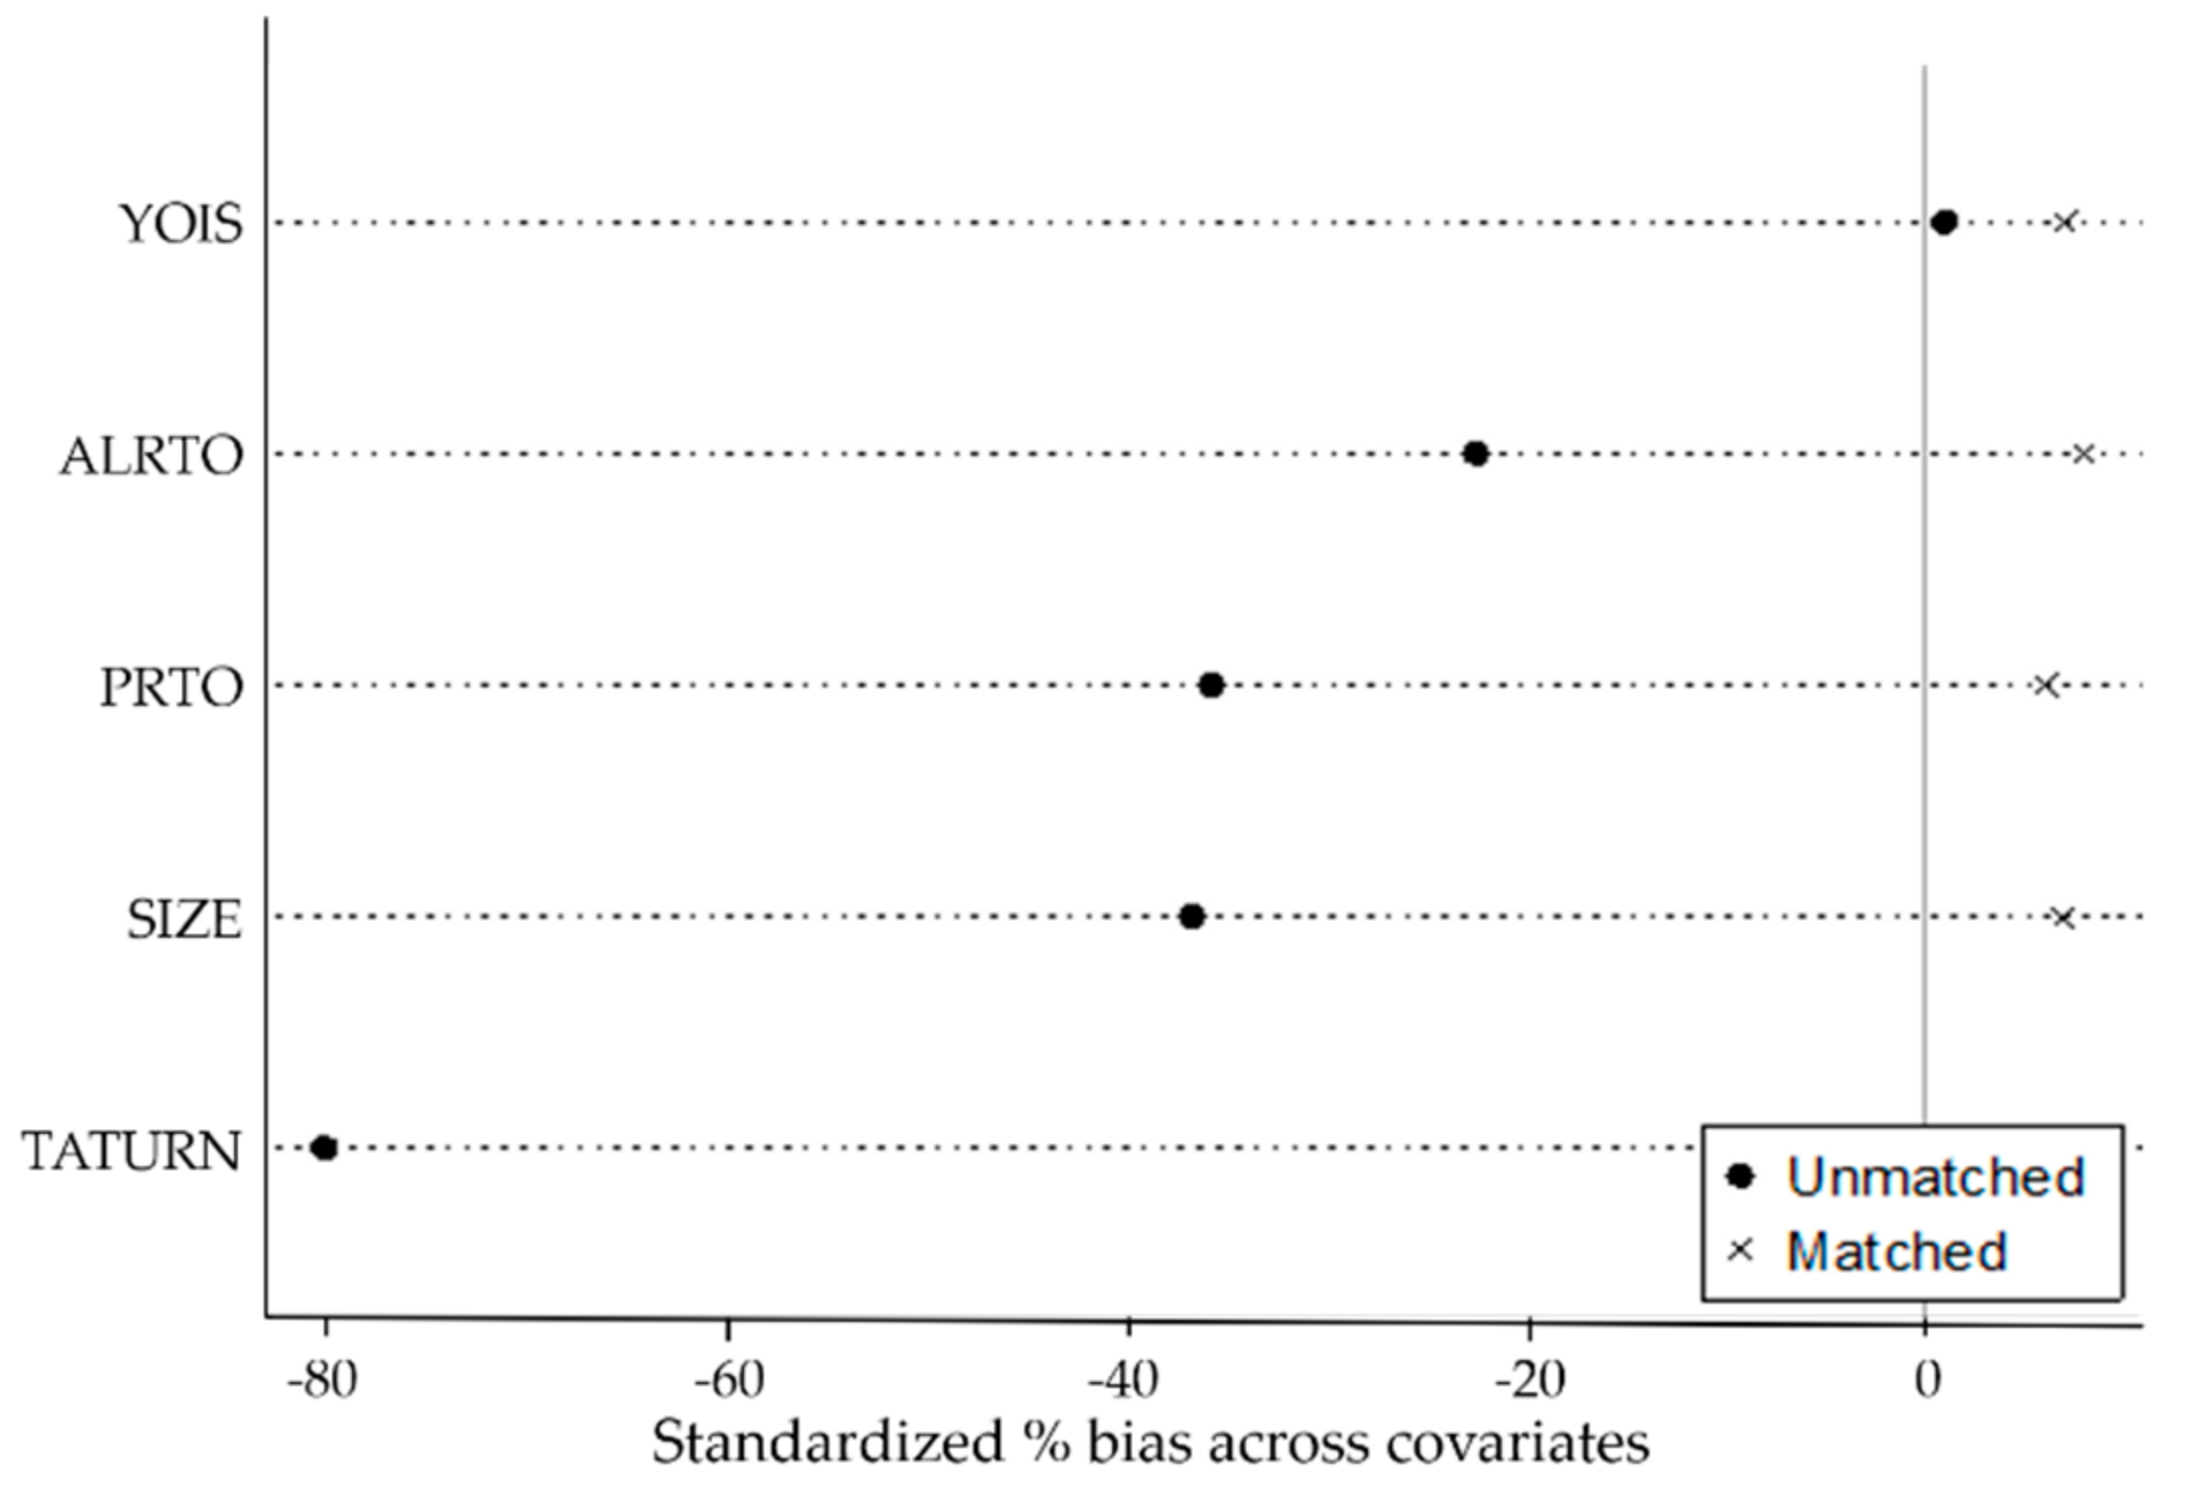
Specifically, companies corresponding to these 43 companies that had issued straight bonds were identified by setting specific matching conditions. There are two levels of matching conditions. The bond level includes the year of issuance (
YOIS) and the bond term (
BTERM), while the company level includes the industry (
INDU), corporate size (
SIZE), asset/liability ratio (
ALRTO), property ratio (
PRTO), and total asset turnover ratio (
TATURN). Companies were individually matched based on conditions at these two levels. In the matching process, in order to verify the reliability of the matching results, the equilibrium hypothesis of score matching is tested in this paper. Only the equilibrium test results for
ROA are shown in
Figure 11. Information on both the treatment group and the control group for
ROA is shown in
Table 4.
It can be seen from
Figure 11 that the standard deviations prior to matching are significant, while all the points revert to 0 after matching, indicating the selected variables and match method is reasonable. At the same time, it can be seen from
Table 4 that the indexes for the control group and the treatment group are relatively close after matching. It indicates that no significant differences in control variables existed between the treatment group and the control group after matching. In other words, given the propensity score
p(
X), the processing is independent of the matching variable. Therefore, the samples obtained after matching guarantee the randomness of sample processing and the reliability of the estimated results in this paper.
Regression analysis was carried out for the 86 listed companies using the DID method. A dual-difference model of the impact of green bond issuance on companies’
ROA is established, as shown in Equation (11).
The data are panel data that may contain heterogeneity in both individual (companies) and time dimensions. To ensure that regression analysis provides the same results as a pre-post comparison of means, we considered the double-fixed effects model of time and individual. We regressed the model according to Equation (11).
SIZEi,t,
ALRTOi,t,
PRTOi,t,
TATURNi,t are the control variables,
ui,t and
τi,t represent the double-fixed effect model of individual fixed effect and time fixed effect, respectively. The interaction term is the focus of our research. “Treated” and “Post” are virtual variables. In relation to Treated, the value of 1 indicates the treatment group, while the value of 0 indicates the control group. As for Post, the value of 1 indicates the time after the green bond issuance, while the value of 0 indicates the time before the green bond issuance. The value of 1 for Treated*Post indicates the performance of companies in the treatment group after green bonds issuance. The results of DID analysis are shown in
Table 5.
It can be seen from
Table 5 that the coefficient for the item
Treated*Post is positive and passes the significance test, indicating that green bond issuance has a positive impact on companies’
ROA. In other words, sufficient capital is raised for corporate projects through green bond issuance, and corporate investments achieve adequate returns.
Analyses of the impact of green bond issuance on operational performance and innovation capacity were carried out using the same method. The results are shown in
Table 6 and
Table 7, respectively.
It can be seen from
Table 6 and
Table 7 that the coefficients for
Treated*Post are positive and pass the significance test. This indicates that green bond issuance can improve operational performance and innovation capacity. Comparing the results shown in
Table 5,
Table 6, and
Table 7, it can be seen that the impact of control variables on corporate
ROA and
GPM are generally consistent, indicating that larger companies with a sound asset structure (
ALRTO and
PRTO) and faster capital turnover (
TATURN) have greater marketing capacity, and thus can achieve better returns on investment. However, the impact of control variables on corporate
RDTOI differs, mainly in relation to corporate size (
SIZE) and the asset/liability ratio (
ALRTO). This might be related to the type of company that issues green bonds. In general, green bond issuance has a positive impact on financial performance. Thus,
H2 is supported.
To further verify the impact of green bond issuance on financial performance, alternative variables (return on invested capital (
ROIC), net profit margin on sales (
SAM), and year-on-year growth of
R&
D expenses (
RDG)) were used to represent profitability, operational performance, and innovation capacity, respectively. The results of these analyses using PSM and DID are shown in
Table 8.
It can be seen from
Table 8 that the impact of
Treated*Post on
ROIC,
SAM, and
RDG remains positive, and the sign and significance of the control variables are basically consistent with those shown in
Table 5,
Table 6 and
Table 7. The impact of green bond issuance on profitability and operational performance is weaker in the results shown in
Table 8 than in those shown in
Table 5 and
Table 6, mainly because
ROIC stresses the need for returns on investment, while it has only been three years since the introduction of green bonds in China. Thus, it might be the case that capital raised through the issuance of green bonds has not yet been invested in projects, or some projects have not yet been completed, resulting in the finding that green bond issuance does not appear to have had a significantly positive impact on
ROIC. There is a positive correlation between
SAM and net profit, but a negative correlation between
SAM and sales revenue. Companies must achieve a sufficiently large
GPM to enable the improvement of
SAM. In other words, companies must achieve greater net profits while increasing sales income so that
SAM can be maintained or improved. Thus, more rigorous conditions and impactive modes are required, such as raising prices and sales volumes, while reducing costs. This paper mainly examines corporate bonds and enterprise bonds, with emphasis on the long-term impact on corporate profits, and thus a positive short-term impact on
SAM, may not be significant.
In general, our results fall somewhere between the findings by Zerbib and Flammer. Zerbib’s results suggest that investors attracted by the "green" label do not seem to promote green bond development [
10,
16], while Flammer demonstrated that green bond issuance can indeed generate positive economic benefits and improve corporate financial performance [
15]. Our findings suggest that the issuance of green bonds in China is not only a form of greenwashing, it also can improve the financial performance of enterprises. As time goes on and the number of mature green bonds increases, the significance of green bonds in promoting corporate profitability, financial performance and innovation ability will also be improved.
4.4. The Impact of Green Bond Issuance on CSR
CSR reports on Chinese listed companies published on hexun.com were used to analyze the impact of green bond issuance on CSR. The data contained in these reports included responsibility for shareholders, employees, suppliers, and customers; the environment; and society. There are 13 level-II indexes (including environmental governance and value of contribution) and 37 level-III indexes (including environmental awareness, environmental management system certification, investment in environmental protection, number of sewerage types, number of types of energy saving, ratio of income tax to total profits, and public welfare donations). Normally, the shareholder responsibility weight accounts for 30% of the total, with 15% allocated for employees, 15% for suppliers and customers, 20% for the environment, and 20% for society.
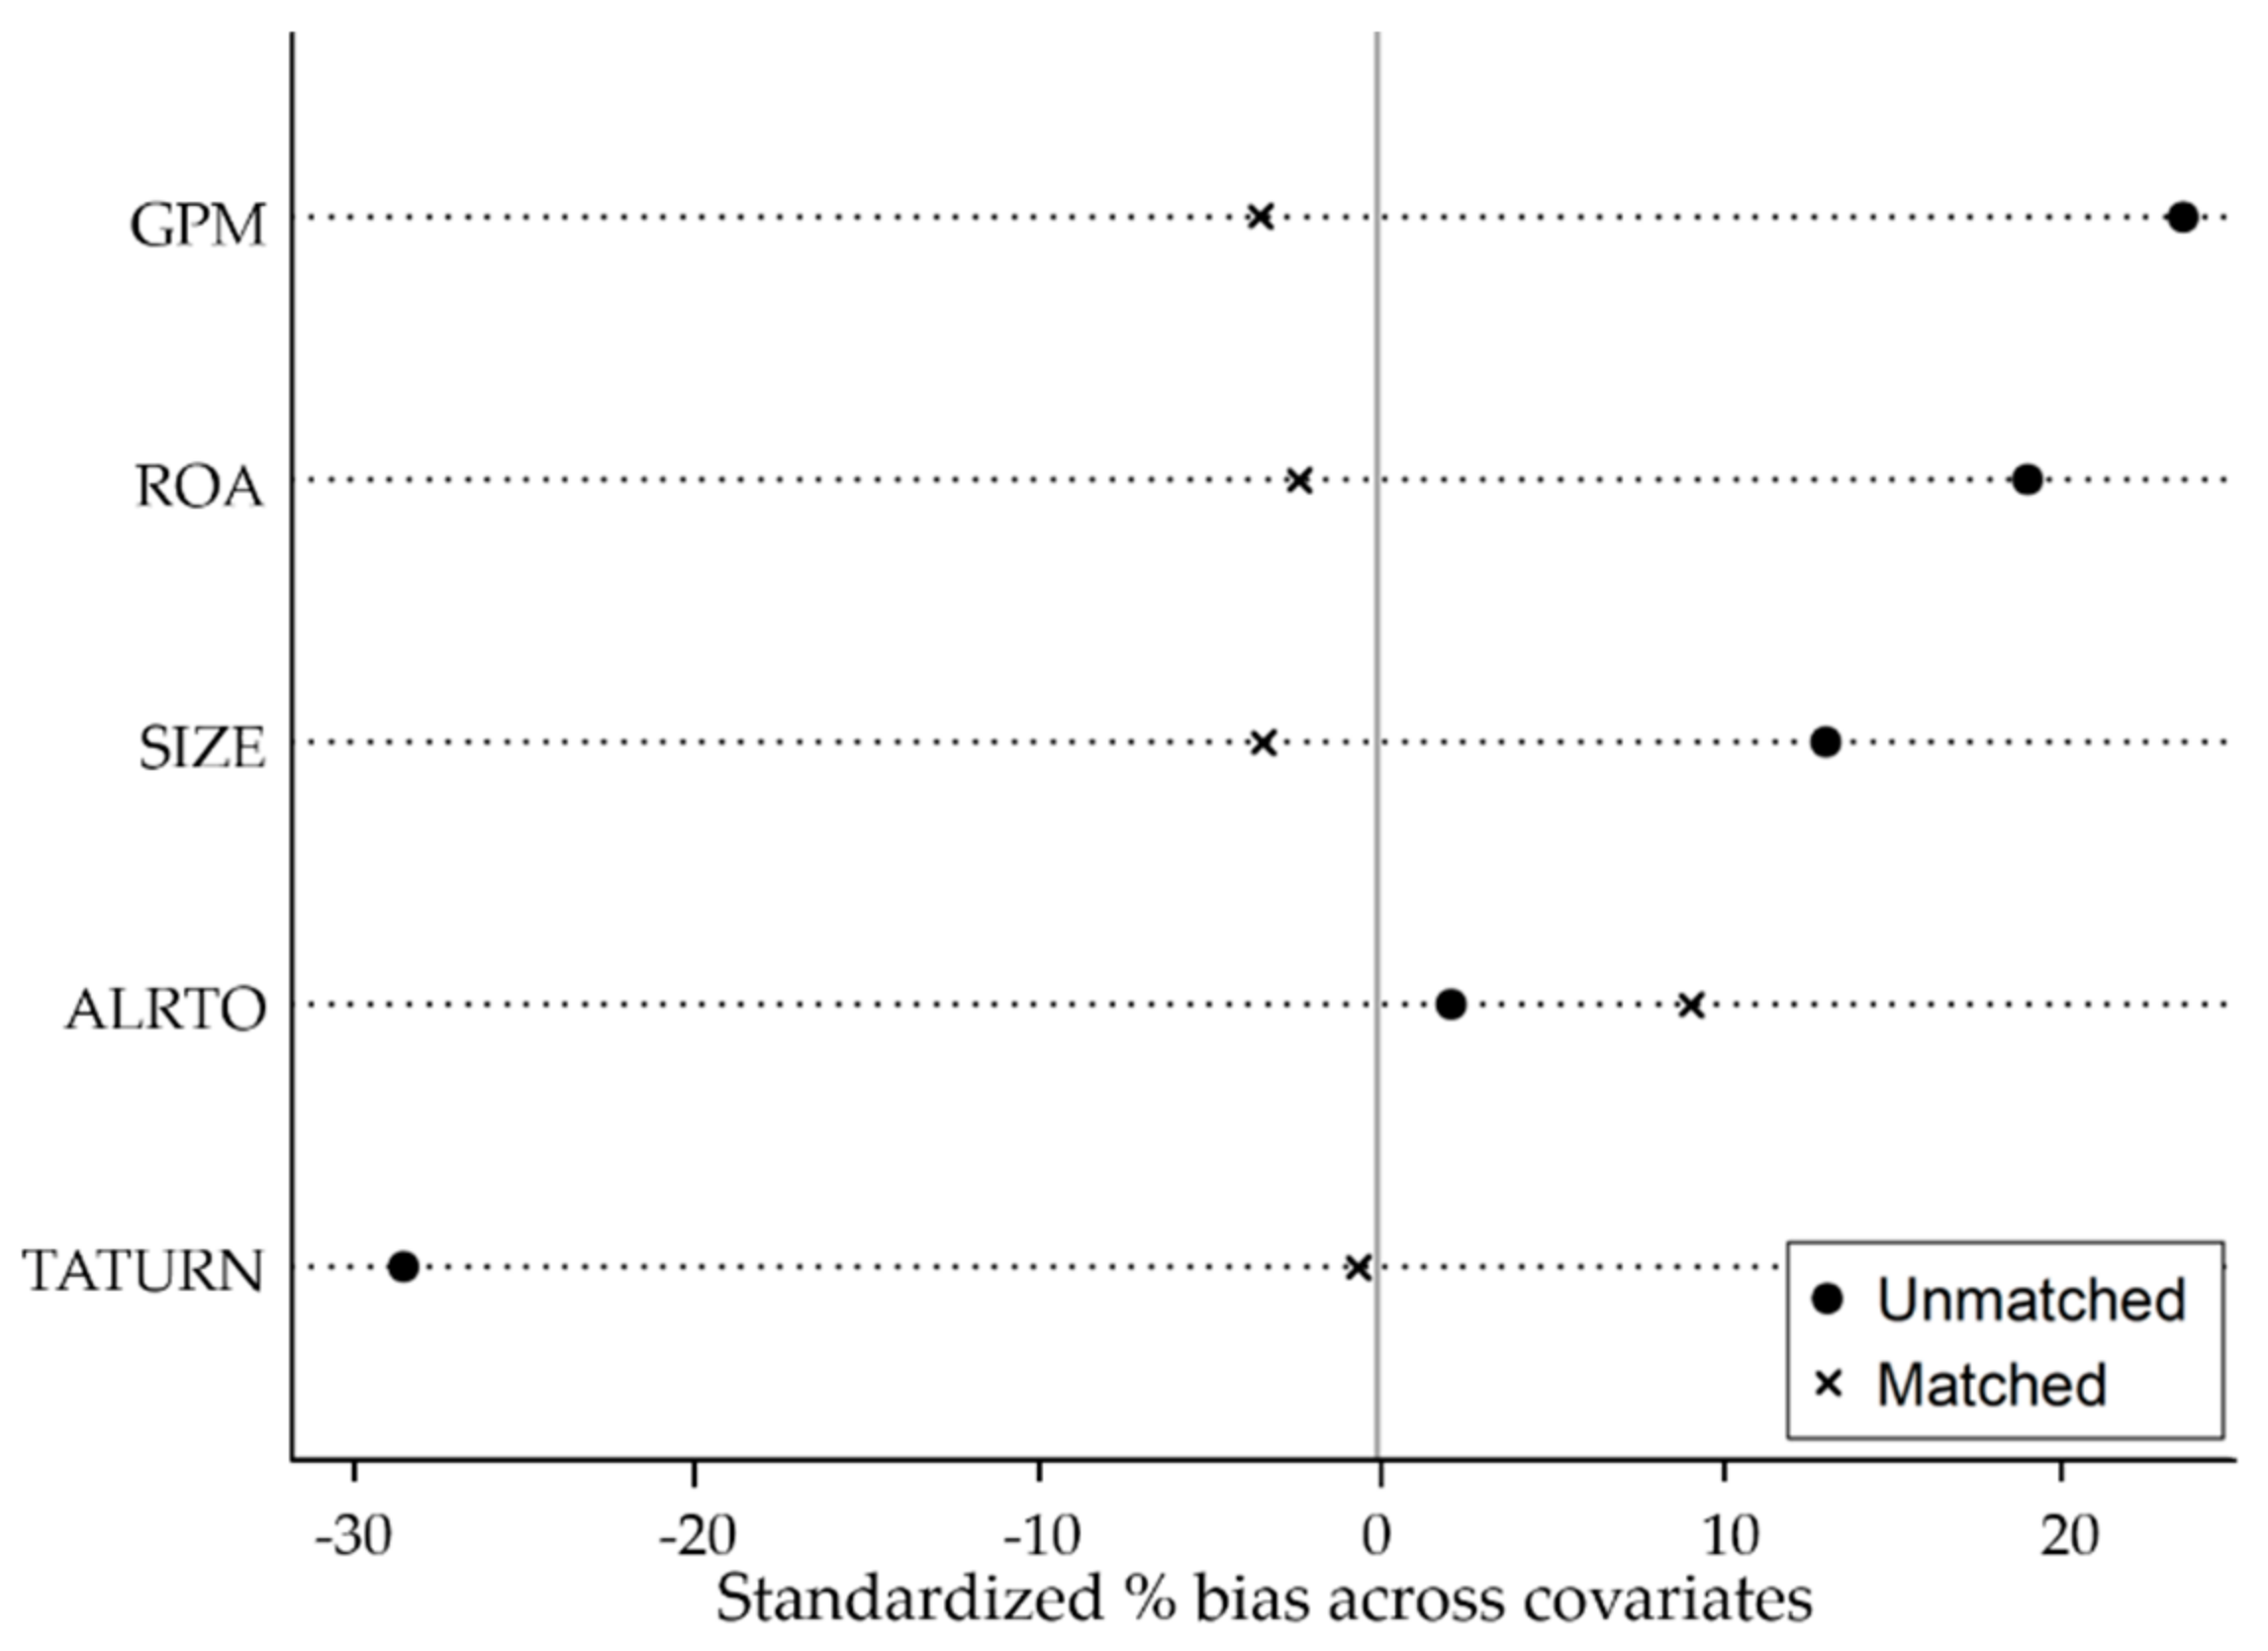
Companies that issued green bonds and straight bonds were individually matched using PSM, and the PSM equilibrium test results for CSR are shown in
Figure 12.
It can be seen from
Figure 12 that there are significant standard deviations prior to matching, while all the points are around 0 after matching, indicating that the matching is effective.
A dual-difference model of the impact of green bond issuance on companies’ CSR is established, as shown in Equation (12).
The results of the DID analysis are shown in
Table 9.
It can be seen from
Table 9 that the coefficients of
Treated and
Treated*Post are positive and pass the significance test. The coefficient of
Treated shows that the CSR scores of companies issuing green bonds are higher than those of companies issuing straight bonds. In other words, companies that issue green bonds shoulder a greater CSR load than those issuing straight bonds. In addition, the coefficient of
Treated*Post indicates that following the issuance of bonds, the increase in CSR scores of companies that issue green bonds is greater than that of companies issuing straight bonds. In other words, green bond issuance improves participation in CSR activities (including responsibilities relating to shareholders, creditors, and the government, as well as those relating to environmental protection and the public). This result supports
H3.
Considering the increasing CSR of the companies after the green bonds issuance, there may be several reasons. Firstly, as for the issuance motive, green bonds are usually issued in order to participate in the green or environmental protection project. The project itself is useful to the society and the environment, so the activities of supporting green projects can promote CSR level of participation. Secondly, as for the issuance costs, the issuance of green bonds reduces the financing costs and improves the efficiency of using resources, and thus helps company to provide products and services for the society. Thirdly, as for the issuance significance, the issuance of green bonds is conducive to establishing a good corporate image. By disclosing the use of the raised funds on relevant websites, companies continuously release positive information, which is conducive to the promotion of corporate reputation and social responsibility.
To further investigate the impact of green bond issuance on CSR, a robustness test was conducted using the event study approach. There is only one set of CSR rating data, and thus annual data are used, and the years of green bond issuance are used as event windows. Taking green bonds issued in 2016 as an example, 2016 is the event window, and 2012–2015 is the event observation period and the estimation window. Some companies’ ratings are not included in the CSR reports on Chinese listed companies published on hexun.com, and so these companies were excluded from the sample, leaving 41 listed companies for the robustness test. Normal CSR scores of the event window are the expected scores that were predicted by the CSR values of the estimation window. Abnormal CSR scores were calculated based on the real and normal numerical values of the 41 companies, and the results are shown in
Table 10.
RCSR denotes the real CSR value,
ACSR denotes the abnormal CSR value, and
AACSR denotes the average abnormal CSR value, using the arithmetic mean of the
ACSR of all companies.
Table 10 shows the real and abnormal CSR values for the 41 companies. The
AACSR passes the significance test, indicating that the
ACSR value is significantly different from 0. It also indicates that CSR ratings changed significantly after green bond issuance. The
AACSR and
T-test values are positive, indicating that CSR ratings improved significantly after issuance. Therefore, the hypothesis that green bond issuance improves the participation of issuing companies in CSR activities is reasonable, and thus
H3 is supported.


