Article

A Four-Dimensional Evaluation of the Urban Comprehensive Carrying Capacity of the Yangtze River Delta, China

1
China Center for Special Economic Zone Research, Shenzhen University, Shenzhen 518060, China
2
Shenzhen Institutes of Advanced Technology Chinese Academy of Sciences, Shenzhen 518055, China
*
Author to whom correspondence should be addressed.
Sustainability 2019, 11(23), 6816; https://doi.org/10.3390/su11236816
Submission received: 31 October 2019 / Revised: 25 November 2019 / Accepted: 29 November 2019 / Published: 1 December 2019

Abstract

:
The evaluation of urban comprehensive carrying capacity (UCC) is of great importance in maintaining urban socio-economic sustainable development. However, UCC is still in its nascent period with limited applications and a lack of credible assessment methods. To enrich this field, this study constructed an objective scientific index to evaluate the UCC of the Yangtze River Delta (YRD) region from a four-dimensional perspective, examining economy, society, environmental, and transportation subsystems. The improved entropy method based on 18 weighted indicators was used to measure the UCC of the 26 cities of the YRD for the period 1990–2018. Results indicate that nine cities were overloaded in 2018, meaning comprehensive carrying capacity demand exceeds supply, and the other seventeen were in loadable condition, meaning such demand did not exceed supply; the social and transportation subsystems are the most important because their index weights and UCC levels are higher than the other two subsystems; the overall UCC for all cities in the YRD is at a medium level, and there are large disparities between the various cities. The empirical results imply that the government should take effective measures to improve UCC in these cities, combining cities’ specific advantages to enhance the efficiency of resource allocation and utilization and improve carrying capacities, and changing the mode of economic development. Based on UCC levels, it is also important to improve environmental conditions and coordination and integration in the development of urbanization. Policy implications on improving UCC have been highlighted in the final section.

1. Introduction

Cities in the Yangtze River Delta (YRD) region are distinguished by their economic strength and competitive advantages [1], forming one of the largest urban agglomerations and one of the most important economic complexes in China [2,3]. As a representative case of the application of the major national strategies for China’s regional development, it is important to study the capacities of the YRD urban agglomeration. However, with the acceleration of urbanization, cities in the YRD area face such problems as population expansion, traffic congestion, destruction of the ecological environment, and other bottlenecks of urban development [2,4,5]. A shortage of resources has become an obstacle to the sustainable development of the YDR that threatens human livelihoods and economic and social development [6]. Therefore, it is in urgent need to realize that the research on the environmental impacts of urbanization processes is a key issue in the sustainability context, especially for the developing countries. On the one hand, the level of urbanization can reflect the economic capacity of a region, which is one of the key indicators used to measure urban development [7]. On the other hand, the sustainable development of an urban agglomeration cannot be measured by the level of urbanization alone [8]; the balance between economic development and environmental quality should be taken into consideration. Excessive emphasis on the development of urbanization and neglect of ecological environmental protection can lead to severe results that harm the sustainability of urban agglomerations. In this light, the motivation for this research is to study cities’ adaptation in terms of urban comprehensive carrying capacity (UCC) and to scientifically evaluate levels of UCC for specific regions.
Literally, in the field of ecology, carrying capacity is defined as “the maximum number of a species that a habitat can support” [9]. In the late 18th century, Malthus published his profoundly influential masterpiece An Essay on the Principle of Population, which gave modernity to the concept of carrying capacity. Since the 1960s, the outbreak of global issues such as the depletion of natural resources and environmental degradation have led to extensive research on the Earth’s carrying capacity and related topics, among which The Limits to Growth, written by the authors of [10], is an outstanding representation. In the late 1970s and early 1980s, the Food and Agriculture Organization of the United Nations (FAO) and United Nations Educational, Scientific and Cultural Organization (UNESCO) organized large-scale studies on carrying capacity and proposed methods by which it can be defined and quantified.
UCC can be promoted by economic development; the logic is that upgrading of industrial structures and spatial optimization increase economic scale. For example, water resource carrying capacity in urban areas can be improved by investment. A case study of Changzhou City has confirmed this logic in practice [11]. The authors of [3] constructed a three-dimensional model encompassing 25 indicators of socio-economic, ecological, and environmental conditions for 11 prefecture-level cities in the Jiangxi province as a research sample, and found that environmental indicators, namely industrial sulfur dioxide emissions, industrial smoke (dust) emissions, and industrial wastewater discharge, have significant impact on regional socio-economic development. The authors of [7] also constructed an urban ecological capacity capability framework to evaluate the relationship between ecological carrying capacity and economic development in Beijing during the period from 1996 to 2012 and revealed that both population and economic levels had exceeded the city’s ecological carrying capacity. A similar situation applies to Xi’an; under current growth patterns, resource exploration cannot sustain a water resource carrying capacity [12], and therefore, an environmentally friendly economic growth pattern and substantial investment in environmental protection are necessary. Thus, generally speaking, research on carrying capacities globally and within China take one of two approaches: studying the carrying capacity of a single factor based on the shortage of, for example, land, water, or key mineral resources, to determine resource carrying capacity, environmental carrying capacity, or population carrying capacity; or taking urban resources, environmental conditions, and other factors as the objects of research, and exploring the carrying capacity of multiple factors closely related to economic and social activities, i.e., comprehensive carrying capacity, such as regional carrying capacity, ecological carrying capacity, or UCC.
However, research gaps remain. Even though the concept of carrying capacity has been widely adopted by researchers in different areas, a lack of scientific assessment of UCC in the analysis of environmental policies is still an obvious problem. Especially in developing countries like China, the rapid development of urbanization has caused potential negative impacts on environment protection. However, the current policies are not able to keep abreast of the changing situation due to few researches providing enough evidence to accurately measure the UCC in urban agglomerations. Previous studies of UCC measurement provide different research perspectives, but they do not analyze UCC from a comprehensive perspective, and the data are not updated. The objective of this paper is to provide insights into a scientific evaluation of comprehensive UCC with the up-to-date data and method, which helps to fill gaps in understanding of how to balance the demand and supply in the process of urbanization. Specifically, this study investigated a generalized four-dimensional framework for regional UCC evaluation and its implementation for the YRD region. To provide a comprehensive perspective for the empirical investigation of UCC in the YRD urban agglomeration, a UCC evaluation index was constructed based on 18 indicators and comprising four subsystems: economy, society, environment, and transportation. Spatial distribution characteristics are utilized in the UCC evaluation [13,14]. The four-dimensional indicators are based on annual statistical data for the 26 cities in the YRD region for the period from 1990 to 2018. The improved entropy method was used to calculate weights for each indicator.
This evaluation yields three main findings: first, nine of the cities (Shanghai, Nanjing, Suzhou, Hangzhou, Ningbo, Zhoushan, Wuhu, Ma’anshan, and Tongling) were overloaded in 2018, meaning comprehensive carrying capacity demand exceeded supply, and the other seventeen were in a loadable condition, meaning comprehensive carrying capacity demand did not exceed supply. Second, among the four subsystems (social, economic, environmental, and transportation), the social and transportation subsystems play the most important roles in the evaluation system because their index weights and UCC levels are higher than the other two subsystems. From a city-level perspective, Shanghai had the highest social, economic, and transportation carrying capacity levels. Third, the spatial distribution of UCC is “high in the East and low in the West”; hence, there is great potential for development and room for improvement, particularly in the west of the region. In particular, the spatial aspect of development requires adjustment.

2. Method and Data

2.1. Model Specification

The entropy method measures the uncertainty contained within each of the variables of a complete theoretical concept. In essence, the method provides a deeper description of the concept’s overall uncertainty and can be used to minimize the uncertainty in an evaluation’s analysis, thus making the evaluation more objective. Following [3,12], this paper uses the improved entropy method to measure the comprehensive carrying capacity of the 26 cities in the YRD, using Matlab 2016 b software.
In this method, first, the data (described below) are treated as dimensionless and standardized by standard deviation. The steps are as follows:
Assume there are m schemes to be evaluated and n evaluation indexes, which form the original index data matrix X = ( x i j ) m × n .
y i j = ( x i j x ¯ j ) / s j
x i j represents the j t h index of the i t h scheme (each city represents one scheme), x ¯ j is the mean value of the j t h index, and s j is the standard deviation of the j t h index. The negative sign should be added to reverse the signage of the index.
X i j = y i j + 5
In general, the value range for y i j is from −5 to 5. To eliminate negative values, the coordinate is shifted.
Second, the weight of each index is assigned, and the comprehensive carrying capacity of each scheme is calculated. The steps are as follows:
p i j = X i j / i = 1 m X i j
where p i j means to calculate the proportion of the i t h scheme index of the j t h index;
e j = k i = 1 m ( p i j × ln p i j ) , k = 1 ln m
where e j [ 0 , 1 ] represents the entropy value of the j t h term;
g j = 1 e j , w j = g j / j = 1 n g j
where g j represents the difference in the coefficient of the j t h index, w j represents the index weight, and the sum of all index weights is 1;
v i = j = 1 n ( w j × p i j ) , ( i = 1 , 2 , 3 , ... , m ) .
The city comprehensive carrying capacity evaluation model is constructed with v i representing the comprehensive carrying capacity index of scheme i .

2.2. Data Collection

The YRD region includes 26 cities: Shanghai (the province-level municipality); Nanjing, Wuxi, Changzhou, Suzhou, Nantong, Yancheng, Yangzhou, Zhenjiang, and Taizhou cities in Jiangsu Province; Hangzhou, Ningbo, Jiaxing, Huzhou, Shaoxing, Jinhua, Zhoushan, and Tai’zhou cities in Zhejiang Province; and Hefei, Wuhu, Ma’anshan, Tongling, Anqing, Chuzhou, Chizhou, and Xuancheng cities in Anhui Province.
This study used the improved entropy method to evaluate the comprehensive carrying capacity of the 26 cities in the YRD for the period from 1990 to 2018, based on the analysis of the four subsystems, social, economic, environmental, and transportation, using 18 indicators (see Table 1). To enable estimation of the UCC from the perspectives of both supply and demand, the 18 indicators were divided equally into two groups: nine were attributed to supply (positive indicators), and are beneficial to UCC (contributing to a higher value of UCC), and the other nine were attributed to demand (reverse indicators), and are detrimental to UCC (lowering its value). The four subsystems and the grading standards for the agglomeration are presented in Table 1.
Data were primarily obtained from the China Statistical Yearbook (1991–2019) and the China Energy Statistical Yearbook (1991–2019). To ensure the quality of the sample data, indicators with a significant number of missing values were excluded. Where necessary, missing values were extrapolated using the linear regression method. In addition, original data and estimation results are attached, which can replicate the results.

3. Empirical Analysis and Discussion

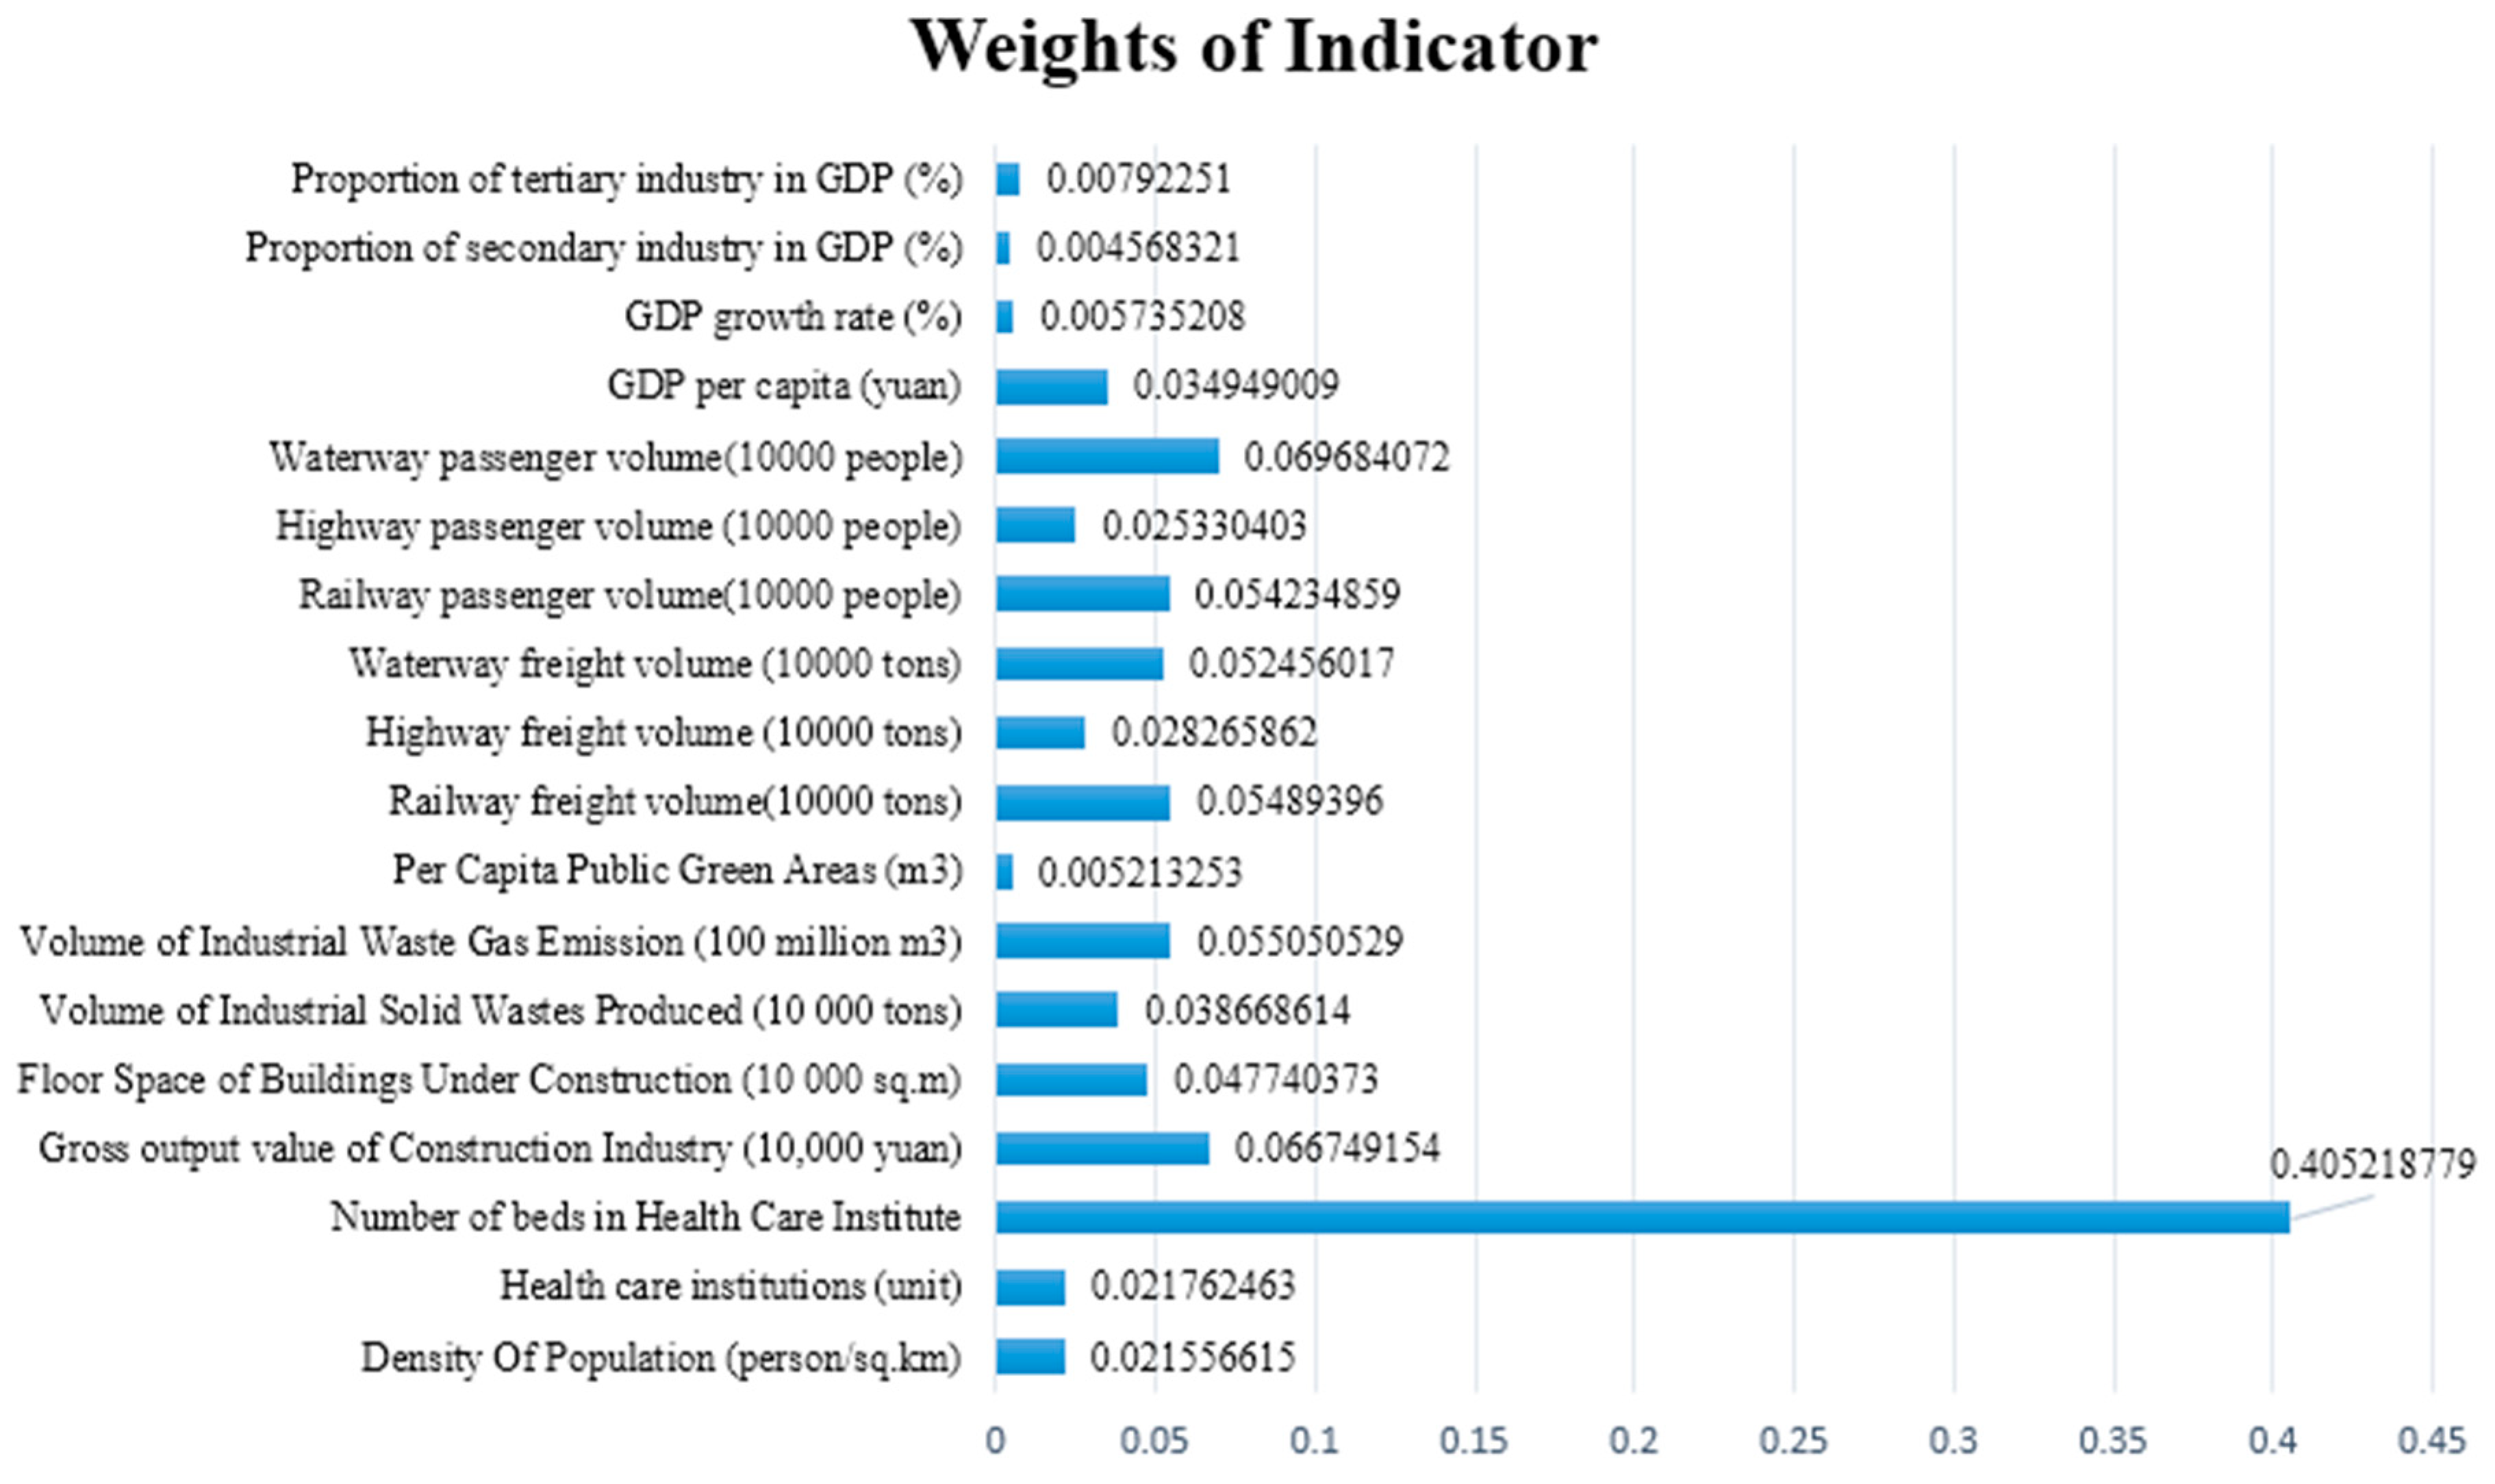
3.1. Estimation of Weights

Among the 18 indicators, nine were positive indicators, and the other nine were reverse indicators, as shown in Table 1. All the indexes were dimensionless. The improved entropy weighting method was used to calculate the weight of each index. The results are shown in the Radar plot, Figure 1.
The weights of the indicators are generally very similar, with most values being between 0.004568 and 0.405219. The weight for the number of beds in health care institutions is the highest of the indicators, and this indicator is positive, representing a positive aspect of the social subsystem. Waterway passenger traffic and gross output value of the construction industry have the next highest weightings; the former is a reverse indicator belonging to the transportation subsystem, and the latter is a positive indicator belonging to the social subsystem. These results illustrate the significant role of the social and transportation subsystems in the evaluation system.

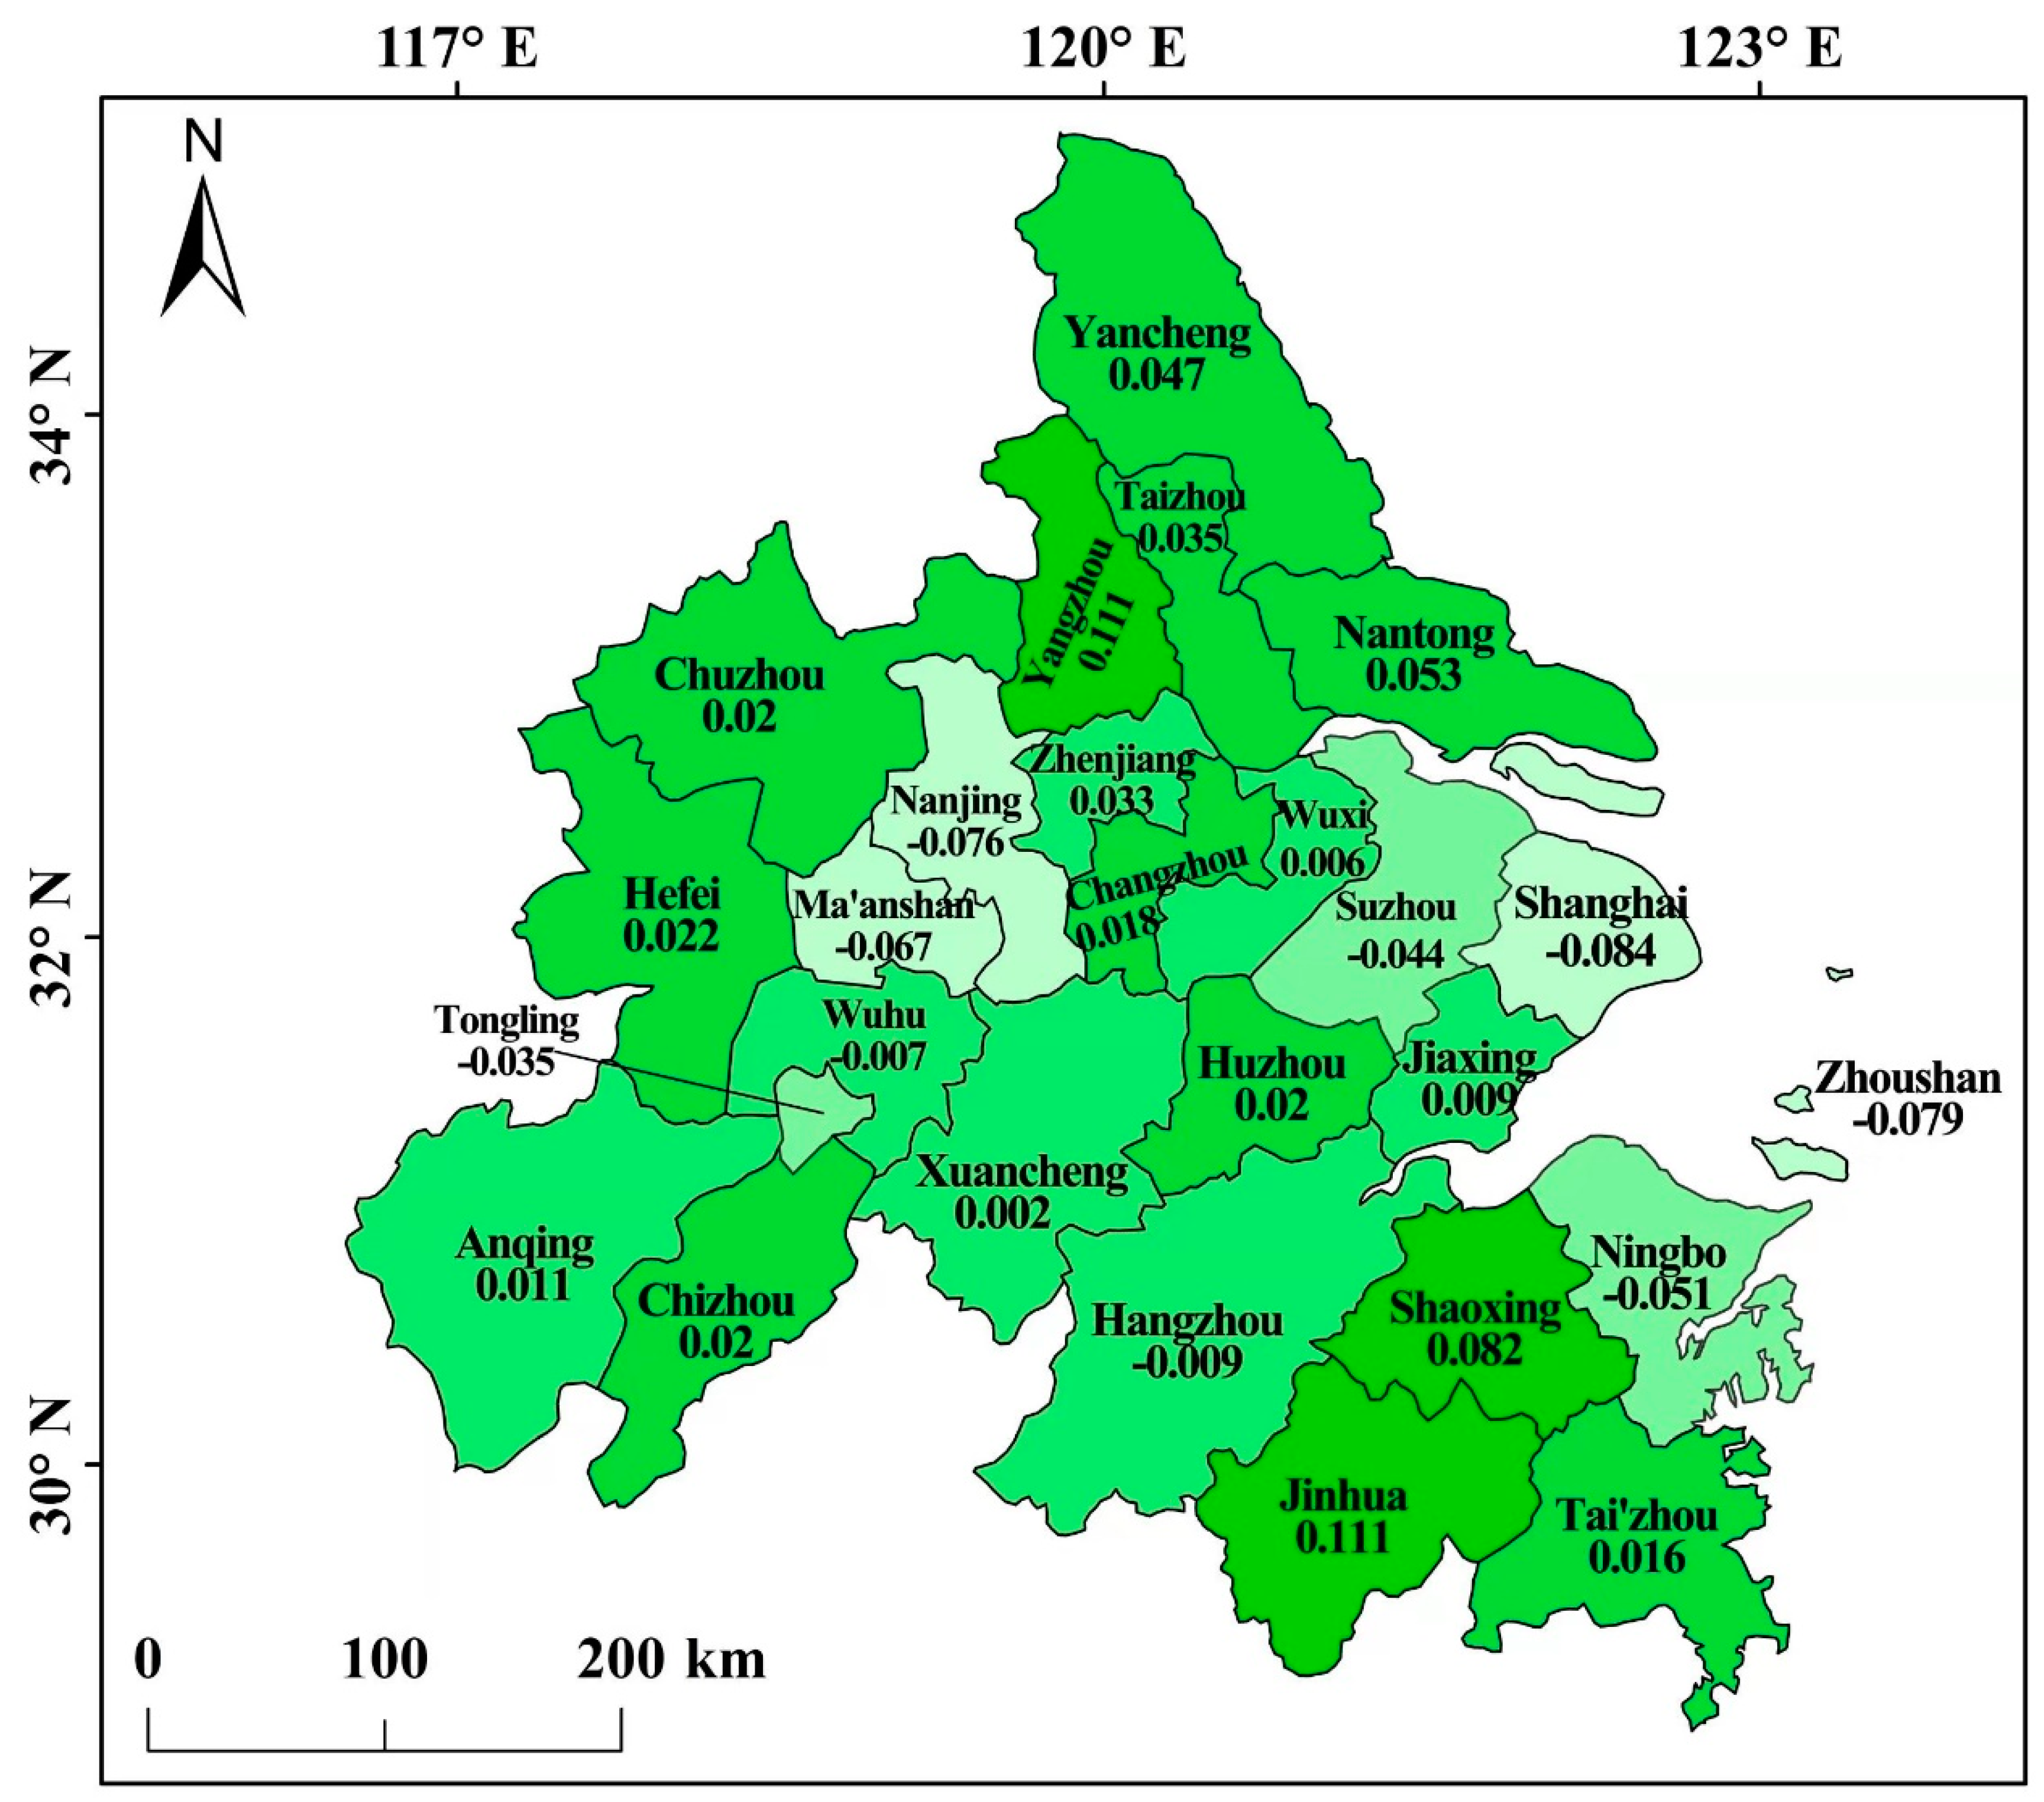
3.2. Comprehensive Carrying Capacity of the 26 Cities in the YRD

Using the improved entropy method from the perspectives of supply and demand, the comprehensive carrying capacity values of the 26 cities were calculated (see Table 2). In Figure 2, depth of color is used to represent the magnitude of values. The UCC values for 2018, ranked from high to low, are as follows: Yangzhou (0.111), Jinhua (0.111), Shaoxing (0.082), Nantong (0.053), Yancheng (0.047), Taizhou (0.035), Zhenjiang (0.033), Hefei (0.022), Huzhou (0.020), Chuzhou (0.020), Chizhou (0.020), Changzhou (0.018), Tai’zhou (0.016), Anqing (0.011), Jiaxing (0.009), Wuxi (0.006), Xuancheng (0.002), Wuhu (−0.007), Hangzhou (−0.009), Tongling (−0.035), Suzhou (−0.044), Ningbo (−0.051), Ma’anshan (−0.067), Nanjing (−0.076), Zhoushan (−0.079), Shanghai (−0.084).
In general, Zhejiang and Jiangsu Provinces perform better than Anhui Province, and this is inconsistent with our intuitive expectations based on perceptions of the provinces. Due to their adequate land reserves and economic development potential, Yangzhou and Jinhua show relatively high carrying capacity compared to surrounding cities. The capital city, Hefei, has the highest UCC values in Anhui Province. However, Shanghai performs worst of all the cities in the YRD; a possible reason is the city’s limited unexplored land resources and very high levels of traffic and logistical pressures (in this study, traffic indicators are reverse indicators in the evaluation system).
Overall, based on the spatial perspective, the distribution of UCC values in the urban agglomeration can be described as “high in the East and low in the West”, mainly because the Eastern cities, such as Yangzhou, Jinhua, Shaoxing, and Nantong, have balanced economic development distribution and superior environmental conditions.

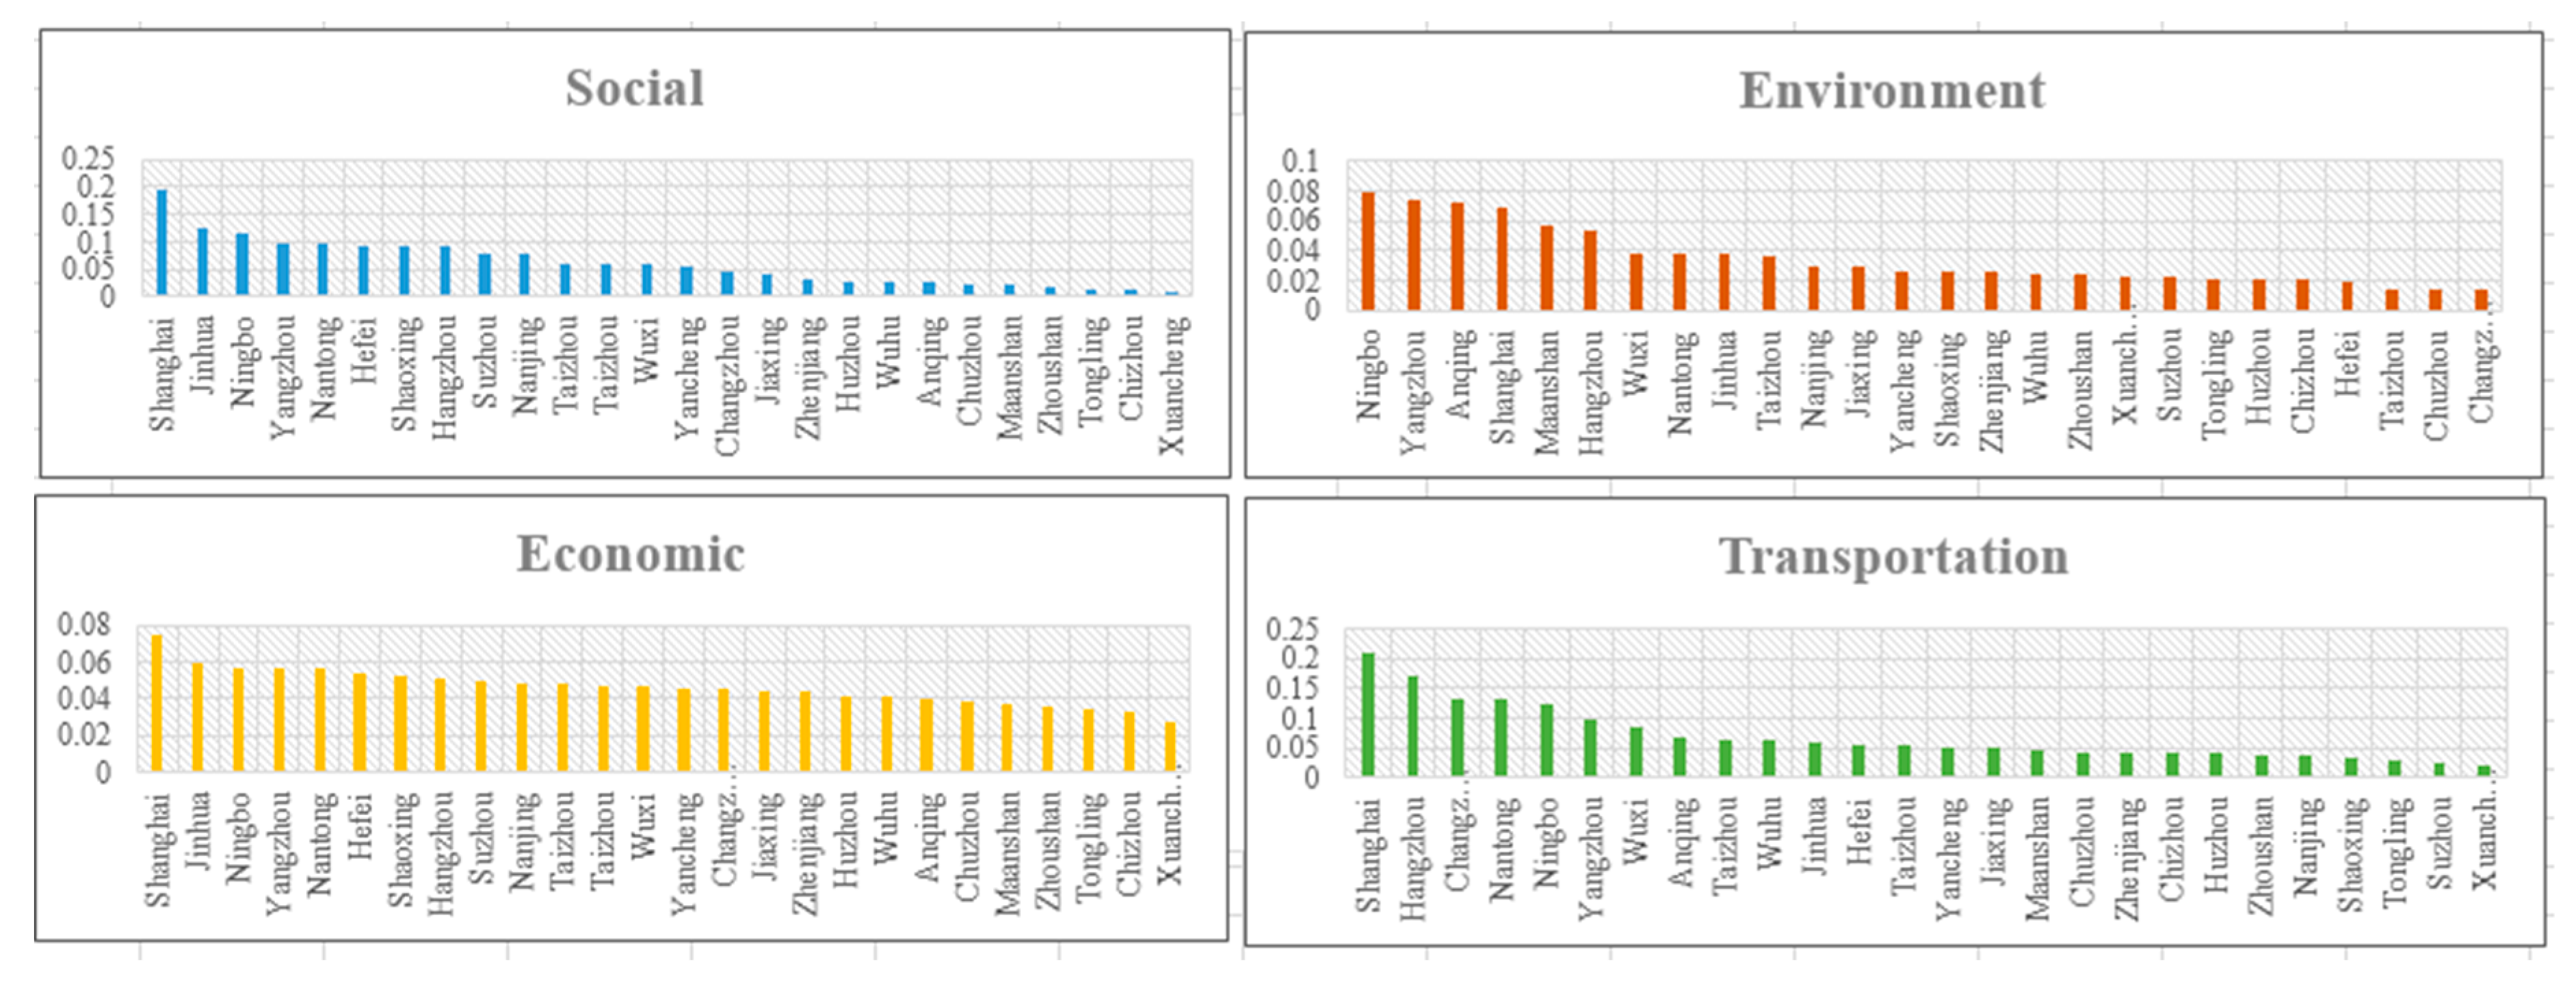
3.3. Comprehensive Carrying Capacity of the Four Subsystems

The carrying capacity values for the four subsystems, that is, the social subsystem, economic subsystem, environmental subsystem, and transportation subsystem, for each city in 2018 are presented in Figure 3. As can be seen, the values of the social and transportation subsystems are generally higher than those of the other two subsystems, and this finding is consistent with the results in Section 4.1; that is, the weights of the social and transportation subsystems are comparatively high and, therefore, these subsystems play the most important roles in the evaluation system, followed by the economic and environmental subsystems, respectively. Shanghai performed the best in social subsystem measures, due to the excellent provision of education and medical resources; Jinhua, Ningbo, Yangzhou, Nantong, and Shaoxing also had high scores in this category. Shanghai also ranks first in its transportation subsystem, followed by Ningbo, Zhoushan, and Hangzhou, all of which have excellent harbors as well as huge logistics and transportation capacities. In accordance with expectations, Shanghai performs the best in economic measures, although other cities in the Delta are very close to Shanghai in this respect because economic development conditions are quite evenly distributed in the area. In terms of environmental measures, Nanjing, Suzhou, and Shanghai are the best-performing cities.

3.4. Comprehensive Carrying Capacity Analysis from the Perspective of Supply and Demand

UCC can be divided into two components of supply and demand: indicators X1, X10, X11, X13, X14, X15, X16, X17, and X18 signify UCC demand, and the remaining indicators represent UCC supply. To remove the effect in our calculations of the different quantities of indicators for the two categories, the supply and demand indicators were unitized. By calculating the product of the index weight and the corresponding standardized index for each city, the supply and demand index data for each city in 2018 were obtained (see Table 3).
Nine cities in the Delta are found to be in a state of overload, meaning comprehensive carrying capacity demand exceeds supply, among which Shanghai has the largest difference between unit supply and unit demand, with its overall score being −0.0136, and the imbalance between supply and demand is highly meaningful; thus, there is an urgent need to optimize the city’s structure of resource allocation. The remaining cities in the Delta are in a loadable state, meaning comprehensive carrying capacity demand does not exceed supply. Due to the city’s clear advantages with respect to the provision of land, Jinhua maintains a relatively high comprehensive carrying capacity level. The difference between unit supply and unit demand is 0.0123, ranking Jinhua first in urban agglomeration and signifying that the city is able to guarantee long-term sustainable development.

4. Conclusions and Policy Implications

4.1. Conclusions

Based on the theoretical analysis framework for UCC of urban agglomerations, this study, using the improved entropy method, has examined the UCC levels of the YRD during the period from 1990 to 2018 based on the four dimensions of social, economic, transport, and environment. Three points can be highlighted.
First, nine of the cities (Shanghai, Nanjing, Suzhou, Hangzhou, Ningbo, Zhoushan, Wuhu, Ma’anshan, and Tongling) were overloaded in 2018, meaning comprehensive carrying capacity demand exceeded supply, while the other seventeen were in a loadable condition, meaning comprehensive carrying capacity demand did not exceed supply. The difference between supply and demand unit values varied greatly from city to city; Jinhua had the highest value (0.0123), and Shanghai had the lowest (−0.0136). Thus, it can be seen that economically-developed cities in YRD, such as Shanghai, usually demand much more resources than the city can provide, indicating the close interdependence of cities in the region on one side, and on the other side, this phenomenon also illustrates the injustice situation of the member cities. For example, local inhabitants in Shanghai enjoy high-quality goods and services, while the resources, including talents, are provided by neighboring cities. In this light, how to give back to less-developed numbering cities is the key to promote coordinated development in this region.
Second, among the four subsystems of social, economic, environmental, and transportation, the social and transportation subsystems play the most important roles in the evaluation system, because their index weights and UCC levels are higher than the other two subsystems. In this light, emphasis in improving UCC can be put on increasing the number of health care institutions as well as their beds, reduce floor space of buildings and increase per capita public green areas, adjust the freight and passenger volumes of waterway, highway, and railways according to each city’s situation. From a city-level perspective, within our expectation, Shanghai had the highest social, economic, and transportation carrying capacity levels, due to its highly developed economy, a sound social welfare system, and the position of an international transportation hub.
Third, the overall comprehensive carrying capacity of all cities in the Delta is considered to be at a medium level, although there are large differences between individual cities. The spatial distribution of UCC can be described as “high in the East and low in the West” due to the comparatively better performance for cities in the east; hence, there is great potential for development and improvement, particularly in the west of the region, and therefore, the spatial balance of development should be adjusted. In essence, the coordination development of a region is an inherent requirement for completing the building of a moderately prosperous society in China and achieving common prosperity for all the people. Under the background of the transformation from high-speed growth to high-quality growth, China should optimize industrial spatial layout, promote the spatial balance of population, economy, resources, and environment, so as to achieve more efficient and equitable sustainable development.
Although the method employed in this study is an objective weighting method that determines the weight of indicators according to the information provided by the observed values of various indicators, limitations remain. On the one hand, how many dimensions should be evaluated in an urban agglomeration sample have not been widely-recognized in academia. In most cases, researchers choose the dimensions according to the data availability. Thus, the reliability of research results is largely dependent on data quality. On the other hand, comparisons between cities are possible, but it is not feasible to compare the indicators.

4.2. Policy Implications

The aim of this study was to provide insights into regional sustainability in order to help produce rational strategic policies for improving UCC. More specifically, restrictive factors of urban agglomeration were analyzed by systematic and qualitative evaluation of UCC in the YRD region. This analysis illustrates that the evaluation of carrying capacity is essential to facilitate sustainable development, and suggestions for how UCC can be improved are put forward. Governments at all levels should attach great importance to improving governance abilities, and it is necessary to pay more attention to the development of the urban agglomeration and the evaluation of UCC, in order to facilitate the provision of effective policies to better enhance the comprehensive carrying capacity of the YRD region.

4.2.1. Combining Advantages to Improve Carrying Capacities

This case study of the YRD region has demonstrated the informativeness of balancing supply and demand indicators. In particular, cities in the YRD region should adjust their measures based on local conditions and seek to improve their carrying capacities by utilizing their own specific advantages and characteristics. It is necessary to utilize positive linkages and synergistic effects among different indicators, whilst avoiding the reverse amplification effect, in the process of urban agglomeration development and construction [6]. Relevant industries with distinctive features and advantages should be positively supported by the government. A number of leading and pillar enterprises should be actively cultivated. Through improvements in market mechanisms and system design, the spillover effect of economic growth should be fully used to promote cities’ levels of UCC. Additionally, a rational level of economic growth should be maintained, keeping the balance between carrying capacities and economic development.

4.2.2. Changing the Mode of Economic Development

Blindly improving the urbanization levels and ignoring environmental protection can lead to the unsustainable development of urban agglomerations [15]. The evaluation system constructed by recent research links human activities with the environment and has raised public awareness of the need to enhance sustainability. Thus, it is essential to change the mode of economic development in the YRD region to improve UCC. Problems of excess production capacity and imbalances between supply and demand should be addressed. To date, cities’ comprehensive carrying capacities in the YRD region have not been very high, and nine of the cities were overloaded in 2018. This reflects a mode of economic development that has a strong dependence on resources. Shanghai and the other 25 cities in the YRD area are expected to develop sustainably in the future. In order to coordinate the relationship between environmental deterioration and economic development, the analyzed cities must reform their current modes of economic development and improve their comprehensive carrying capacities. Their economic growth pattern should be changed to improve the efficiency of urban resource use instead of depending on resource consumption. Specifically, energy-intensive industries and environmentally damaging modes of economic development should be reduced and eliminated where possible. Large-scale expansion of urbanization should be limited. It is inevitable that accelerating efficient and environmentally-friendly transformations in various industries will be necessary in order to improve UCC.

4.2.3. Enhance the Development of a Coordinated and Integrated Economy

In terms of economic development in the YRD area, the improvement of carrying capacity can be better achieved by enhancing a coordinated and integrated economy. Three-year action plan for the integrated development of the Yangtze River Delta (2018–2020), released in 2018, has provided the task book, timetable, and roadmap for the integrated development. It pointed out that by 2020, the YRD should form a framework of world-class city clusters, build a networked infrastructure system, make major progress in building a green and beautiful region, and significantly improve public services. To fill this aim, major cross-regional infrastructure should be constructed to facilitate the integration of economy and society. Governments need to continue to increase investment in infrastructure and constantly improve investment in the environment. In general, the promotion of common development and harmonious coexistence among cities should be emphasized, strengthening regional economic integration. In the course of this process, the government can appropriately guide the diversion of industry and the population to small- and medium-sized cities of higher UCC instead of to already overloaded cities. It is necessary to accelerate the realization of the integration process in order to promote a coordinated regional development. Meanwhile, cooperation between different regions should be strengthened in order to stimulate coordination [16]. Therefore, the government should design mechanisms for regional coordination and take measures to enhance sustainability in the YRD region.

Author Contributions

Conceptualization, L.Z. and Q.S.; methodology, J.L. and Q.S.; software, J.L.; writing—original draft preparation, L.Z.; supervision, L.Z.; funding acquisition, Q.S.

Funding

This research was funded by China Postdoctoral Science Foundation, grant number 2019M653047; National Natural Science Foundation of China, grant number 71903131.

Conflicts of Interest

The authors declare no conflict of interest.

References

  1. Hang, Y.; Wang, Q.; Zhou, D.; Zhang, L. Factors influencing the progress in decoupling economic growth from carbon dioxide emissions in China’s manufacturing industry. Resour. Conserv. Recycl. 2019, 146, 77–88. [Google Scholar] [CrossRef]
  2. Kim, Y.; Lee, J.; Ahn, J. Innovation towards sustainable technologies: A socio-technical perspective on accelerating transition to aviation biofuel. Technol. Forecast. Soc. Chang. 2019, 145, 317–329. [Google Scholar] [CrossRef]
  3. Wang, J.; Wei, X.; Guo, Q. A three-dimensional evaluation model for regional carrying capacity of ecological environment to social economic development: Model development and a case study in China. Ecol. Indic. 2018, 89, 348–355. [Google Scholar] [CrossRef]
  4. Lu, X.; Yao, T.; Fung, J.C.H.; Lin, C. Estimation of health and economic costs of air pollution over the Pearl River Delta region in China. Sci. Total Environ. 2016, 566–567, 134–143. [Google Scholar] [CrossRef] [PubMed]
  5. Liang, J.; Zhong, M.; Zeng, G.; Chen, G.; Hua, S.; Li, X.; Yuan, Y.; Wu, H.; Gao, X. Risk management for optimal land use planning integrating ecosystem services values: A case study in Changsha, Middle China. Sci. Total Environ. 2017, 579, 1675–1682. [Google Scholar] [CrossRef] [PubMed]
  6. Liu, K. A rational view of the appraisal system and the statistical measurement of cultural and creative industries--and an analysis of the institutional and cultural roots of the GDP competition. Stat. Decis. 2012, 349, 7–11. (In Chinese) [Google Scholar]
  7. Fang, W.; An, H.; Li, H.; Gao, X.; Sun, X. Urban Economy Development and Ecological Carrying Capacity: Taking Beijing City as the Case. Energy Procedia 2017, 105, 3493–3498. [Google Scholar] [CrossRef]
  8. Zhou, Y.; Shan, Y.; Liu, G.; Guan, D. Emissions and low-carbon development in Guangdong-Hong Kong-Macao Greater Bay Area cities and their surroundings. Appl. Energy 2018, 228, 1683–1692. [Google Scholar] [CrossRef]
  9. Long, T.; Jiang, W.; He, Q. Water resources carrying capacity: New perspectives based on eco-economic analysis and sustainable development. J. Hydraul. Eng. 2004, 35, 38–45. (In Chinese) [Google Scholar]
  10. Meadows, D.H.; Meadows, D.L.; Randers, J. The Limits to Growth: A Report for the Club of Rome’s Project on the Predicament of Mankind. Technol. Forecast. Soc. Chang. 1972, 323–332. [Google Scholar]
  11. Zhou, X.Y.; Lei, K.; Meng, W.; Khu, S.T. Industrial structural upgrading and spatial optimization based on water environment carrying capacity. J. Clean. Prod. 2017, 165, 1462–1472. [Google Scholar] [CrossRef]
  12. Yang, Z.; Song, J.; Cheng, D.; Xia, J.; Li, Q.; Ahamad, M.I. Comprehensive evaluation and scenario simulation for the water resources carrying capacity in Xi’an city, China. J. Environ. Manag. 2019, 230, 221–233. [Google Scholar] [CrossRef] [PubMed]
  13. Orenstein, D.E.; Shach-Pinsley, D. A Comparative Framework for Assessing Sustainability Initiatives at the Regional Scale. World Dev. 2017, 98, 245–256. [Google Scholar] [CrossRef]
  14. Wang, Y.; Wang, Y.; Su, X.; Qi, L.; Liu, M. Evaluation of the comprehensive carrying capacity of interprovincial water resources in China and the spatial effect. J. Hydrol. 2019, 575, 794–809. [Google Scholar] [CrossRef]
  15. Carroli, L. Planning roles in infrastructure system transitions: A review of research bridging socio-technical transitions and planning. Environ. Innov. Soc. Transit. 2018, 29, 81–89. [Google Scholar] [CrossRef]
  16. Wang, K.; Tian, H.; Hua, S.; Zhu, C.; Gao, J.; Xue, Y.; Hao, J.; Wang, Y.; Zhou, J. A comprehensive emission inventory of multiple air pollutants from iron and steel industry in China: Temporal trends and spatial variation characteristics. Sci. Total Environ. 2016, 559, 7–14. [Google Scholar] [CrossRef] [PubMed]
Figure 1. Weights of the 18 indicators.
Sustainability 11 06816 g001
Figure 2. Comprehensive carrying capacity values of the 26 cities in the Yangtze River Delta in 2018.
Sustainability 11 06816 g002
Figure 3. The comprehensive carrying capacity for four subsystems for 26 cities in the Yangtze River Delta in 2018.
Sustainability 11 06816 g003
Table 1. Social, economic, environment, and transportation evaluation index systems and grading standards for the Yangtze River Delta.
System LayerIndicator Layer (Units)Serial NumberPoor ValueMean ValueExcellent ValueAttributes
Social subsystemPopulation density (persons/sq.km)X10.04300.00840
Health care institutions (unit)X200.00840.0380+
Number of beds in health care institutions (unit)X300.00080.0600+
Gross output value of construction industry (10,000 yuan)X400.00750.0550+
Floor space of buildings under construction (10,000 sq.m)X500.00780.0670+
Economic subsystemGDP per capita (yuan)X600.00810.0480+
GDP growth rate (%)X700.00870.0450+
Share of secondary industry to GDP (%)X800.00870.0160+
Share of tertiary industry to GDP (%)X900.00860.0210+
Environment subsystemVolume of industrial solid wastes produced (10,000 tons)X100.03800.00800
Volume of industrial waste gas emission (100 million m3)X110.04500.00770
Public green areas per capita (m3)X1200.00870.0140+
Transportation subsystemRailway freight traffic volume (10,000 tons)X130.09300.00780
Highway freight traffic volume (10,000 tons)X140.03700.00820
Waterway freight traffic volume (10,000 tons)X150.06800.00770
Railway passenger traffic (10,000 persons)X160.07500.00770
Highway passenger traffic (10,000 persons)X170.04700.00830
Waterway passenger traffic volume (10,000 persons)X180.07600.00740
Note: All indicators are standardized; 0 denotes small values near to 0.
Table 2. Comprehensive urban carrying capacity index values from 1990 to 2018 for the 26 cities in the Yangtze River Delta.
ShanghaiNanjingWuxiChangzhouSuzhouNantongYanchengYangzhouZhenjiangTaizhouHangzhouNingboJiaxing
1990−0.0870.001−0.002−0.012−0.0030.009−0.0170.019−0.015−0.009−0.031−0.018−0.017
1991−0.142−0.068−0.002−0.004−0.0080.007−0.0160.023−0.016−0.007−0.031−0.004−0.007
1992−0.143−0.066−0.002−0.004−0.0130.008−00190.024−0.016−0.006−0.033−0.013−0.002
1993−0.154−0.066−0.007−0.001−0.0080.005−0.0200.026−0.011−0.004−0.032−0.0120.004
1994−0.151−0.069−0.0020.000−0.0080.010−0.0200.041−0.010−0.002−0.028−0.017−0.003
1995−0.080−0.065−0.006−0.001−0.0170.008−0.0180.028−0.0090.000−0.029−0.0230.005
1996−0.093−0.067−0.0020.003−0.0100.012−0.0090.036−0.005−0.001−0.027−0.0260.005
1997−0.089−0.0710.0000.001−0.0100.020−0.0070.036−0.0050.001−0.014−0.0190.006
1998−0.107−0.0730.0030.004−0.0060.023−0.0070.035−0.0030.002−0.015−0.0200.006
1999−0.106−0.0690.0030.002−0.0090.023−0.0030.034−0.0020.002−0.012−0.0220.006
2000−0.108−0.073−0.0070.006−0.0080.0230.0030.037−0.0020.015−0.018−0.0280.003
2001−0.131−0.072−0.0060.008−0.0200.0220.0080.023−0.0140.012−0.017−0.025−0.003
2002−0.132−0.075−0.0020.009−0.0180.0230.0110.0260.0010.015−0.017−0.0360.003
2003−0.133−0.0720.0080.015−0.0080.0280.0120.0300.0020.021−0.009−0.0320.004
2004−0.138−0.0630.0040.013−0.0110.0390.0120.0370.0030.023−0.025−0.042−0.001
2005−0.145−0.076−0.0040.013−0.0270.0280.0070.0330.0110.028−0.027−0.036−0.002
2006−0.164−0.072−0.0080.012−0.0380.0500.0160.0420.0130.033−0.029−0.047−0.013
2007−0.166−0.068−0.0080.012−0.0290.0640.0170.0500.0140.034−0.023−0.048−0.003
2008−0.141−0.095−0.0050.010−0.0310.0300.0240.0530.0100.030−0.025−0.0790.001
2009−0.156−0.089−0.0270.015−0.0280.0260.0250.0610.0160.036−0.008−0.0720.004
2010−0.142−0.094−0.0180.018−0.0330.0230.0290.0480.0140.046−0.028−0.0610.011
2011−0.142−0.108−0.0240.018−0.0360.0230.0380.0670.0090.046−0.028−0.0820.013
2012−0.142−0.101−0.0250.017−0.0460.0300.0390.0720.0110.052−0.027−0.0560.010
2013−0.122−0.068−0.0150.018−0.0260.0160.0430.1460.0270.047−0.007−0.0400.014
2014−0.122−0.0690.0040.016−0.0250.0470.0430.0650.0300.0250.005−0.0550.014
2015−0.118−0.0680.0040.019−0.0290.0520.0490.0620.0300.0280.007−0.0520.014
2016−0.114−0.057−0.0090.022−0.0320.0470.0480.1020.0360.0810.007−0.0660.017
2017−0.122−0.0720.0010.026−0.0390.0520.0470.0700.0360.0270.000−0.0660.013
2018−0.084−0.0760.0060.018−0.0440.0530.0470.1110.0330.035−0.009−0.0510.009
Average−0.1267−0.0708−0.00510.0094−0.02140.02760.01200.04950.00650.0210−0.0183−0.03960.0038
HuzhouShaoxingJinhuaZhoushanTai’zhouHefeiWuhuMa’anshanTonglingAnqingChuzhouChizhouXuancheng
1990−0.0140.0130.001−0.042−0.0100.015−0.0140.013−0.0060.0010.0270.0180.026
1991−0.0100.005−0.002−0.0250.0030.015−0.0110.015−0.0070.0060.0240.0090.025
1992−0.0010.0010.000−0.0250.0030.014−0.0110.0170.010.0050.0230.0090.025
19930.0060.0000.001−0.0240.0060.016−0.0180.0160.0090.006−0.0060.0090.024
19940.000−0.002−0.001−0.0190.0090.020−0.0070.0150.0090.0080.020.0090.024
1995−0.004−0.0010.003−0.0230.0070.012−0.0010.0080.0090.0050.0110.0090.023
19960.000−0.0010.002−0.0300.0000.0130.0000.0080.010.0030.0120.0090.023
19970.0020.0040.004−0.037−0.0080.0100.0000.0090.0080.0040.0090.0090.022
19980.0040.0080.001−0.035−0.0040.0130.0000.0090.0060.0010.0070.0090.022
1999−0.0010.0110.001−0.036−0.0020.0130.0000.0080.0120.0000.0110.0090.021
2000−0.0010.0100.007−0.0370.0000.010−0.0050.0030.0090.0030.0080.0160.009
20010.0040.0120.004−0.0330.0020.0440.0090.0010.0060.0110.0100.0170.012
20020.0010.017−0.003−0.0330.0060.0110.0130.0010.0030.0080.0080.0170.011
20030.0020.020−0.005−0.0310.0070.0030.0170.0040.0130.0120.0100.0240.008
20040.0010.0210.004−0.0340.0100.0010.0120.0200.0150.0160.0110.0260.012
2005−0.0060.0210.023−0.0360.0110.0080.007−0.0030.011−0.0020.0190.0240.014
2006−0.0060.0250.010−0.0450.010−0.0010.000−0.0020.0160.0060.0060.0240.016
2007−0.0010.0320.008−0.0480.006−0.003−0.003−0.0150.0110.0030.0060.0240.015
20080.0010.0300.004−0.054−0.013−0.013−0.014−0.027−0.003−0.0100.0140.0280.011
20090.0010.0830.034−0.0480.009−0.003−0.012−0.046−0.002−0.0120.0020.021−0.005
20100.0000.0420.014−0.049−0.0080.013−0.005−0.062−0.0010.0100.0080.0250.009
2011−0.0010.0610.029−0.0510.000−0.020−0.014−0.067−0.0050.015−0.0100.023−0.003
20120.0020.0650.032−0.0570.003−0.023−0.004−0.082−0.0090.0130.0100.0290.001
20130.0070.0680.040−0.0630.015−0.024−0.004−0.083−0.0180.0080.0110.0280.001
20140.0130.0710.058−0.0480.019−0.009−0.004−0.075−0.0160.0080.0020.0280.002
20150.0140.0730.058−0.0580.0210.0020.001−0.071−0.0260.0030.0010.0210.000
20160.0220.0800.059−0.0550.0210.0020.003−0.066−0.0300.0080.0190.0270.009
20170.0240.0800.057−0.0700.0200.0010.003−0.062−0.0300.0090.0200.0260.002
20180.0200.0820.111−0.0790.0160.022−0.007−0.067−0.0350.0110.0200.0200.002
Average0.00270.03210.0191−0.04220.00550.0056−0.0024−0.0200−0.00110.00550.01080.01890.0124
Table 3. The balance between supply and demand for comprehensive carrying capacity for the 26 cities in the Yangtze River Delta in 2018.
CitySupply Indicator ValueSupply Unit ValueDemand Indicator ValueDemand Unit ValueDifference between Supply and Demand Unit ValueBalance SituationComprehensive Carrying Capacity Situation
Shanghai0.23300.02170.31700.0352−0.0136supply < demandoverload
Nanjing0.13200.01470.20800.0231−0.0084supply < demandoverload
Wuxi0.11100.01230.10500.01170.0007supply > demandloadable
Changzhou0.09700.01080.07900.00880.0020supply > demandloadable
Suzhou0.13300.01480.17700.0197−0.0049supply < demandoverload
Nantong0.15000.01670.09700.01080.0059supply > demandloadable
Yancheng0.09800.01090.05100.00570.0052supply > demandloadable
Yangzhou0.15400.01710.04300.00480.0123supply > demandloadable
Zhenjiang0.09000.01000.05700.00630.0037supply > demandloadable
Taizhou0.10700.01190.07200.00800.0039supply > demandloadable
Hangzhou0.15500.01720.16400.0182−0.0010supply < demandoverload
Ningbo0.17100.01900.22200.0247−0.0057supply < demandoverload
Jiaxing0.08900.00990.08000.00890.0010supply > demandloadable
Huzhou0.08100.00900.06100.00680.0022supply > demandloadable
Shaoxing0.14400.01600.06200.00690.0091supply > demandloadable
Jinhua0.16900.01880.05800.00640.0123supply > demandloadable
Zhoushan0.06700.00740.14600.0162−0.0088supply < demandoverload
Tai’zhou0.10400.01160.08800.00980.0018supply > demandloadable
Hefei0.14400.01600.12200.01360.0024supply > demandloadable
Wuhu0.07200.00800.07900.0088−0.0008supply < demandoverload
Ma’anshan0.06700.00740.13400.0149−0.0074supply < demandoverload
Tongling0.06000.00670.09500.0106−0.0039supply < demandoverload
Anqing0.06600.00730.05500.00610.0012supply > demandloadable
Chuzhou0.06500.00720.04500.00500.0022supply > demandloadable
Chizhou0.05200.00580.03200.00360.0022supply > demandloadable
Xuancheng0.05600.00620.05400.00600.0002supply > demandloadable

