Article

Different Time Windows Provide Divergent Estimates of Climate Variability and Change Impacts on Maize Yield in Northeast China

1
State Key Laboratory of Vegetation and Environmental Change, Institute of Botany, Chinese Academy of Sciences, Beijing 100093, China
2
University of Chinese Academy of Sciences, Beijing 100049, China
*
Author to whom correspondence should be addressed.
Sustainability 2019, 11(23), 6659; https://doi.org/10.3390/su11236659
Submission received: 8 October 2019 / Revised: 21 November 2019 / Accepted: 21 November 2019 / Published: 25 November 2019
(This article belongs to the Special Issue Systems Approaches to Complex and Sustainable Food Systems)

Abstract

:
Maize is the main crop in Northeast China (NEC), but is susceptible to climate variations. Using county-level data from 1980 to 2010, we established multiple linear regression models between detrended changes in maize yield and climate variables at two time windows—whole-season and vegetative and reproductive (V&R) phases. Based on climate change trends, these regression models were used to assess climate variability and change impacts on maize yield in different regions of NEC. The results show that different time windows provide divergent estimates. Climate change over the 31 years induced a 1.3% reduction in maize yield at the time window of whole-season, but an increase of 9.1% was estimated at the time window of V&R phases. The yield improvement is attributed to an increase in minimum temperature at the vegetative phase when the temperatures were much lower than the optimum. Yield fluctuations due to inter-annual climate variability were estimated to be ±9% per year at the time window of V&R phases, suggesting that the impact of climate variability on maize yield is much greater than climate change. Trends in precipitation were not responsible for the yield change, but precipitation anomalies contributed to the yield fluctuations. The impacts of warming on maize yield are regional specific, depending on the local temperatures relative to the optimum. Increase in maximum temperature led to a reduction of maize yield in western NEC, but to an increase in mid-east part of NEC. Our findings highlight the necessity of taking into account the phenological phase when assessing the climate impacts on crop yield, and the importance of buffering future crop production from climate change in NEC.

Graphical Abstract

1. Introduction

Maize is a main grain crop in Northeast China (NEC), contributing approximately 34% to the total maize production in China (National Bureau of Statistics of China, http://data.stats.gov.cn/). The harvest area of maize in NEC has been increased since 2000 at an annual rate of 439 × 103 ha (National Bureau of Statistics of China, http://data.stats.gov.cn/). Over the past decades, NEC has experienced a rapid increase in temperature [1]. The maximum, minimum and mean temperature during the maize growing season has increased by 0.28°C, 0.43°C and 0.34°C, respectively, per decade from 1970 to 2009, but no significant change in the precipitation was found due to large interannual variations [2]. Zhao et al. [3] suggested that 1°C warming reduced maize yield by 7.4% at global scale and by 8.0% in China. Efforts to project how climate change will affect future maize production can benefit from understanding the impacts of changes to date [4].
Statistical yield-climate relationships are commonly used to assess the impacts of historical climate change on crop production [5,6,7]. Several studies have assessed climate change impacts on maize yield in China and NEC using statistical yield-climate relationships, while these assessments showed inconsistent results. Based on county level data from 1980 to 2008, Zhang and Huang [8] reported an average loss of 5.8% in maize yield across China due to increase in growing-season mean temperature, and the regions with the most decreases were northeast and northwest China. Similar results were also reported by Zhang et al. [9]. However, Chen et al. [10] reported that maize yield in NEC was positively correlated with growing-season temperature, particularly with growing-season minimum temperature. Statistical analyses by Yin et al. [11] also showed the benefit of maize yield from higher minimum temperature. It should be noted that the average values of climatic factors during growing season were used in these studies similar to other studies [12,13,14].
There is much evidence that the effects of climate on maize growth and yield formation are distinct in the vegetative and the reproductive phase. A review work conducted by Sánchez et al. [15] indicated that the cardinal temperatures for maize are distinct in different phenological phases, being particularly sensitive to elevated temperatures during silking and grain filling [16] or in the reproductive phase [17,18]. The accumulation and partitioning of maize dry matter varied with temperature, and the responses of dry matter accumulation and partitioning to temperature were quite distinct at different stages of maize growth [19]. Temperatures higher than the optimum in anthesis and grain filling increased non-germinated pollen, and reduced pollen viability and individual kernel mass [20,21,22]. Maize yields are also highly susceptible to water deficit. A three-year field experiment indicated that water deficit in one or two sensitive stages (tasseling and/or ear formation) resulted in serious grain yield reduction [23]. The limited irrigation imposed on maize during reproductive stage induced more yield reduction than that during vegetative stage under semi-arid climatic conditions [24]. All of these investigations suggested that the assessment of climate change impacts on maize yield should take the phenological phase into consideration.
Climate change impact on crop yield might be regional or sub-regional specific. Butler and Huybers [16] found the regional variations on the temperature sensitivity of maize yield in the USA. Zhang and Huang [8] reported that increases in growing season temperature reduced maize yield in the southern part but improved maize yield in the eastern part of NEC. Moreover, the climatological determinants of maize yield were also different across NEC [25]. Using province-scale data in NEC, Wang et al. [26] found a divergence of climate impacts on maize yield, and thus, they highlighted future needs in the yield-climate relationships at fine spatial scales.
Attention has been given to the impacts of inter-annual climate variability on crop yield. On a global scale, climate variation explained a third of crop yield variability [27]. In particular, droughts and extreme heat could have reduced national cereal production by 9–10% [28]; the change in variability of the agro-climatic index could explain over 21% of the yield (maize, soybean, rice and wheat) variability [29]; more than 40% of the inter-annual variability in wheat production was attributed to heat waves and drought [30]. The role of climate variability and change in maize yield change in NEC remain largely unknown, though several investigations have focused on climate change impacts [10,11,25,26,31].
Although several studies have revealed the effect of climate change on maize yield based on a time window of whole-season [8,9,12,13,14], it is unclear how climate variability and change at different growth stages affects maize yield. In light of previous studies [15,16,22,24], we hypothesize that the responses of maize growth and yield formation to climate variability and change are distinct in different phenological phases. To test this hypothesis, we used two time windows of climate variable—growing season average and averages in vegetative phase and reproductive phase (V&R phases)—to examine the impacts of climate variability and change on maize yield in NEC over the period 1980–2010. Our objective is to address how climate variability and change in entire growing season (whole-season) and V&R phases impact maize yield in different regions, and how much climate variability and change contribute to the changes in NEC’s maize yield so that policy-makers could make sensible region-oriented adaption decisions.

2. Materials and Methods

2.1. Study Area

Northeast China (NEC) is located between 39° N to 53° N with three provinces of Heilongjiang, Jilin and Liaoning (Figure S1). Annual harvest area of spring maize is approximately 11 million hectares (National Bureau of Statistics of China, http://data.stats.gov.cn/). Maize growing season is from late April to September. The vegetative and reproductive phases are generally from late April to mid-July, and from late July to mid-September, respectively [32]. The mean air temperature of the growing season ranged from 14.7 to 21.6°C, decreasing from south to north. The precipitation of the growing season decreased from the southeast (978 mm) to the northwest (375 mm). The sunshine hours of growing season ranged from 947 to 1383 h (China Meteorological Data Sharing Service System, http://data.cma.cn/).

2.2. Data Sources

We obtained county-level data of maize yield and harvest area from the Chinese Academy of Agricultural Sciences. Maize is currently planted at 190 counties across NEC, while only 52 counties completely recorded the data from 1980 to 2010. We used these data to establish the yield-climate relationships. Climate data over the period 1980–2010 were obtained from the China Meteorological Data Sharing Service System (http://data.cma.cn/), which included 87 county-level weather stations over NEC. The climate data consisted of daily average temperature (Tave), maximum temperature (Tmax), minimum temperature (Tmin), precipitation (Pre) and sunshine in hours (SH). The county-level data of maize yield and climate have been checked and adopted in our previous study [8]. For those counties where no stations existed, climate data were spatially interpolated using the algorithm described by Thornton et al. [33].

2.3. Calculations of Climate Variability and Change Impacts on Maize Yield

Firstly, we established multiple linear regression models between detrended changes in maize yield and climate variables at two time windows—whole-season and vegetative and reproductive (V&R) phases. The demarcation of two time windows is to test the hypothesis that the responses of maize growth and yield formation to climate variability and change are distinct in different phenological phases. The time window of whole-season covers the period from sowing to maturity; the V&R window includes two periods, i.e., vegetative phase (from sowing to tasseling), and reproductive phase (from tasseling to maturity). Following Mu et al. [32], the vegetative phase was assigned from 21 April to 20 July, and the reproductive phase was assigned from 21 July to 20 September. This is consistent with available observations in NEC (Tables S1 and S2). Secondly, we detected the trends in climate change using a linear regression. Finally, we estimated the yield responses to climate change and variability in light of the model parameters with the detected trends in climate variables.

2.3.1. Identification of Climate Effects on Maize Yield

Using the first-difference method [34,35], we calculated the year-to-year changes in maize yield (∆yield; %) and climate (∆X) to remove the possible confounding effects of non-climate factors (Equations (1) and (2)). The first-difference method was applied in 52 counties where both yearly maize yield and climate data were available. Correlation analysis between ∆yield and ∆X was conducted for each county to determine the climatic factors that affect year-to-year changes in maize yield. The first-differences of climate included average maximum and minimum temperature (Tmax,Tmin), sunshine (∆SH) and precipitation (∆Pre):
Δ yield   ( % ) = ( Y i Y i 1 ) Y i 1 × 100 %
Δ X = X i X i 1
where ∆yield (%) represents year-to-year changes in maize yield. Yi and Yi−1 are maize yields (kg ha−1) in the ith and the (i − 1)th year, respectively. ∆X represents the first-difference value of climate variables; Xi and Xi−1 are the values of climate variable in the ith and the (i − 1)th year, respectively.
Hierarchical cluster analysis was used to arrange a set of correlation coefficients between ∆yield and ∆X for each county into clusters, which allows establishing a set of clusters. The cluster analysis was performed using a measure of similarity levels and Euclidean distance [36]. The correlation coefficients within a cluster (i.e., region) were more similar to each other than within other clusters [37], namely, there is a similar relationship between yield and climate variables in a specific cluster. In light of the hierarchical cluster analysis, the study area was clustered into three regions (Figure S2). Region I is located at northwest part of NEC. Region II is in the east part of Liaoning Province. Region III covers the eastern part of Heilongjiang and Jilin Province (Figure S3).
Following Lobell and Field [12], the first-difference values of yield and climate variables were used to compute a multiple linear regression model (Equation (3)) for each region. Backward stepwise regression (F-statistic to enter and remove in the model with a p-value of <0.1) was used to identify the determinants of the model.
Δ y i e l d ( % ) = β 0 + β j Δ X j + ε
where ∆Xj represents the first-difference value of the jth climate variable, β0 is the model intercept, other βs are the coefficients for corresponding climate variable, and ε is the model error. Multi-collinearity may occur when a large number of variables were considered in the regression models. We used the variance inflation factor (VIF) to assess multi-collinearity of the models in the study. The VIF of all the six models were less than 2, while VIF greater than 10 is deemed multi-collinear [38,39]. Thus, the multi-collinearity of the models was negligible.
Two time windows of the ∆Xj were used in the multiple linear regression models to investigate climate effects on maize yield. In the time window of whole-season, the X represents the mean value of a given climate variable over the period from sowing to maturity. In the time window of V&R phases, the X has two mean values for a given climate variable. One is for the vegetative phase, and the other is for the reproductive phase. Accordingly, the candidate ∆Xj in the V&R window included average maximum and minimum temperature (∆Tmax_v,Tmax_r;Tmin_v,Tmin_r) and precipitation (∆Pre_v,Pre_r) when stepwise regression was performed. The subscripts v and r represent vegetative and reproductive phases, respectively. The ∆SH was not included in the candidate ∆Xj, because approximately 70% of the counties did not show a significant correlation between ∆yield and ∆SH.

2.3.2. Estimation of Yield Response to Climate Change

To estimate the effects of climate change on yield, we first detected the trend in climate change using a linear regression:
X i = k i × t + c + ε
where Xi is the climate variables in year t for a given county, ki is the slope of the linear regression and represents the time trend in X, c is an intercept and ε is the residual error for each data series.
We then calculated the changes in maize yield that were attributed to climate change for each county using Equation (5):
Y c h a n g e = 31 β i × k i
where Ychange represents the changes in maize yield (%) over a 31-year period from 1980 to 2010 for a given county, βi is the regression coefficient for corresponding climate variable in Equation (3) and ki is the slope of the linear regression in Equation (4). The calculation of Ychange did not take into consideration the X that does not show significant trend (p > 0.05) in Equation (4) for a given county. Regional response of maize yield to climate change was then estimated by:
Y C C = Y c h a n g e _ i × S i S i
where YCC is the regional mean of yield change (%) or mean in all counties (NEC) of yield change (%) and Ychange_i and Si represent the yield change calculated using Equation (5) and harvest area in the ith county, respectively.

2.3.3. Estimation of Yield Response to Climate Variability

Inter-annual variation in climate was calculated to estimate the impact of climate variability on yield by:
Δ X + = ( X i X a v g ) n   for   X i X a v g 0
Δ X = ( X i X a v g ) 31 n   for   X i X a v g < 0
where ∆X+ and ∆X represent the positive and negative anomaly for a given climate variable, Xi is the value of climate variable in year i and Xavg is an average value over the period from 1980 to 2010. Constant 31 represents the number of years.
The influence of inter-annual climate variations on regional maize yield was estimated by:
Y C V R + / = β i × Δ X + /
where YCVR+/– is the estimation of positive or negative yield anomaly (the deviation from the 1980–2010 mean; %) that is attributed to the climate anomaly in Equation (7). βi is the regression coefficient for corresponding climate variable in Equation (3).
Regional influence of inter-annual climate variations on maize yield was estimated by:
Y C V R = Y C V R + / , i × S i S i
where YCVR is the regional mean of positive or negative yield anomaly or mean in all counties (NEC) determined by climate anomaly. YCVR+/−,i and Si represent the yield change (%) calculated using Equation (8) and harvest area in the ith county, respectively.
We estimated the impacts of both climate change and variability on maize yield for each county. For example, we calculated the yield change attributed to X1 as climate change impact when X1 shows a significant trend, and the yield change attributed to X2 and X3 as climate variability impact when these two climate variables do not show significant trend in Equation (4) for a given county.

3. Results

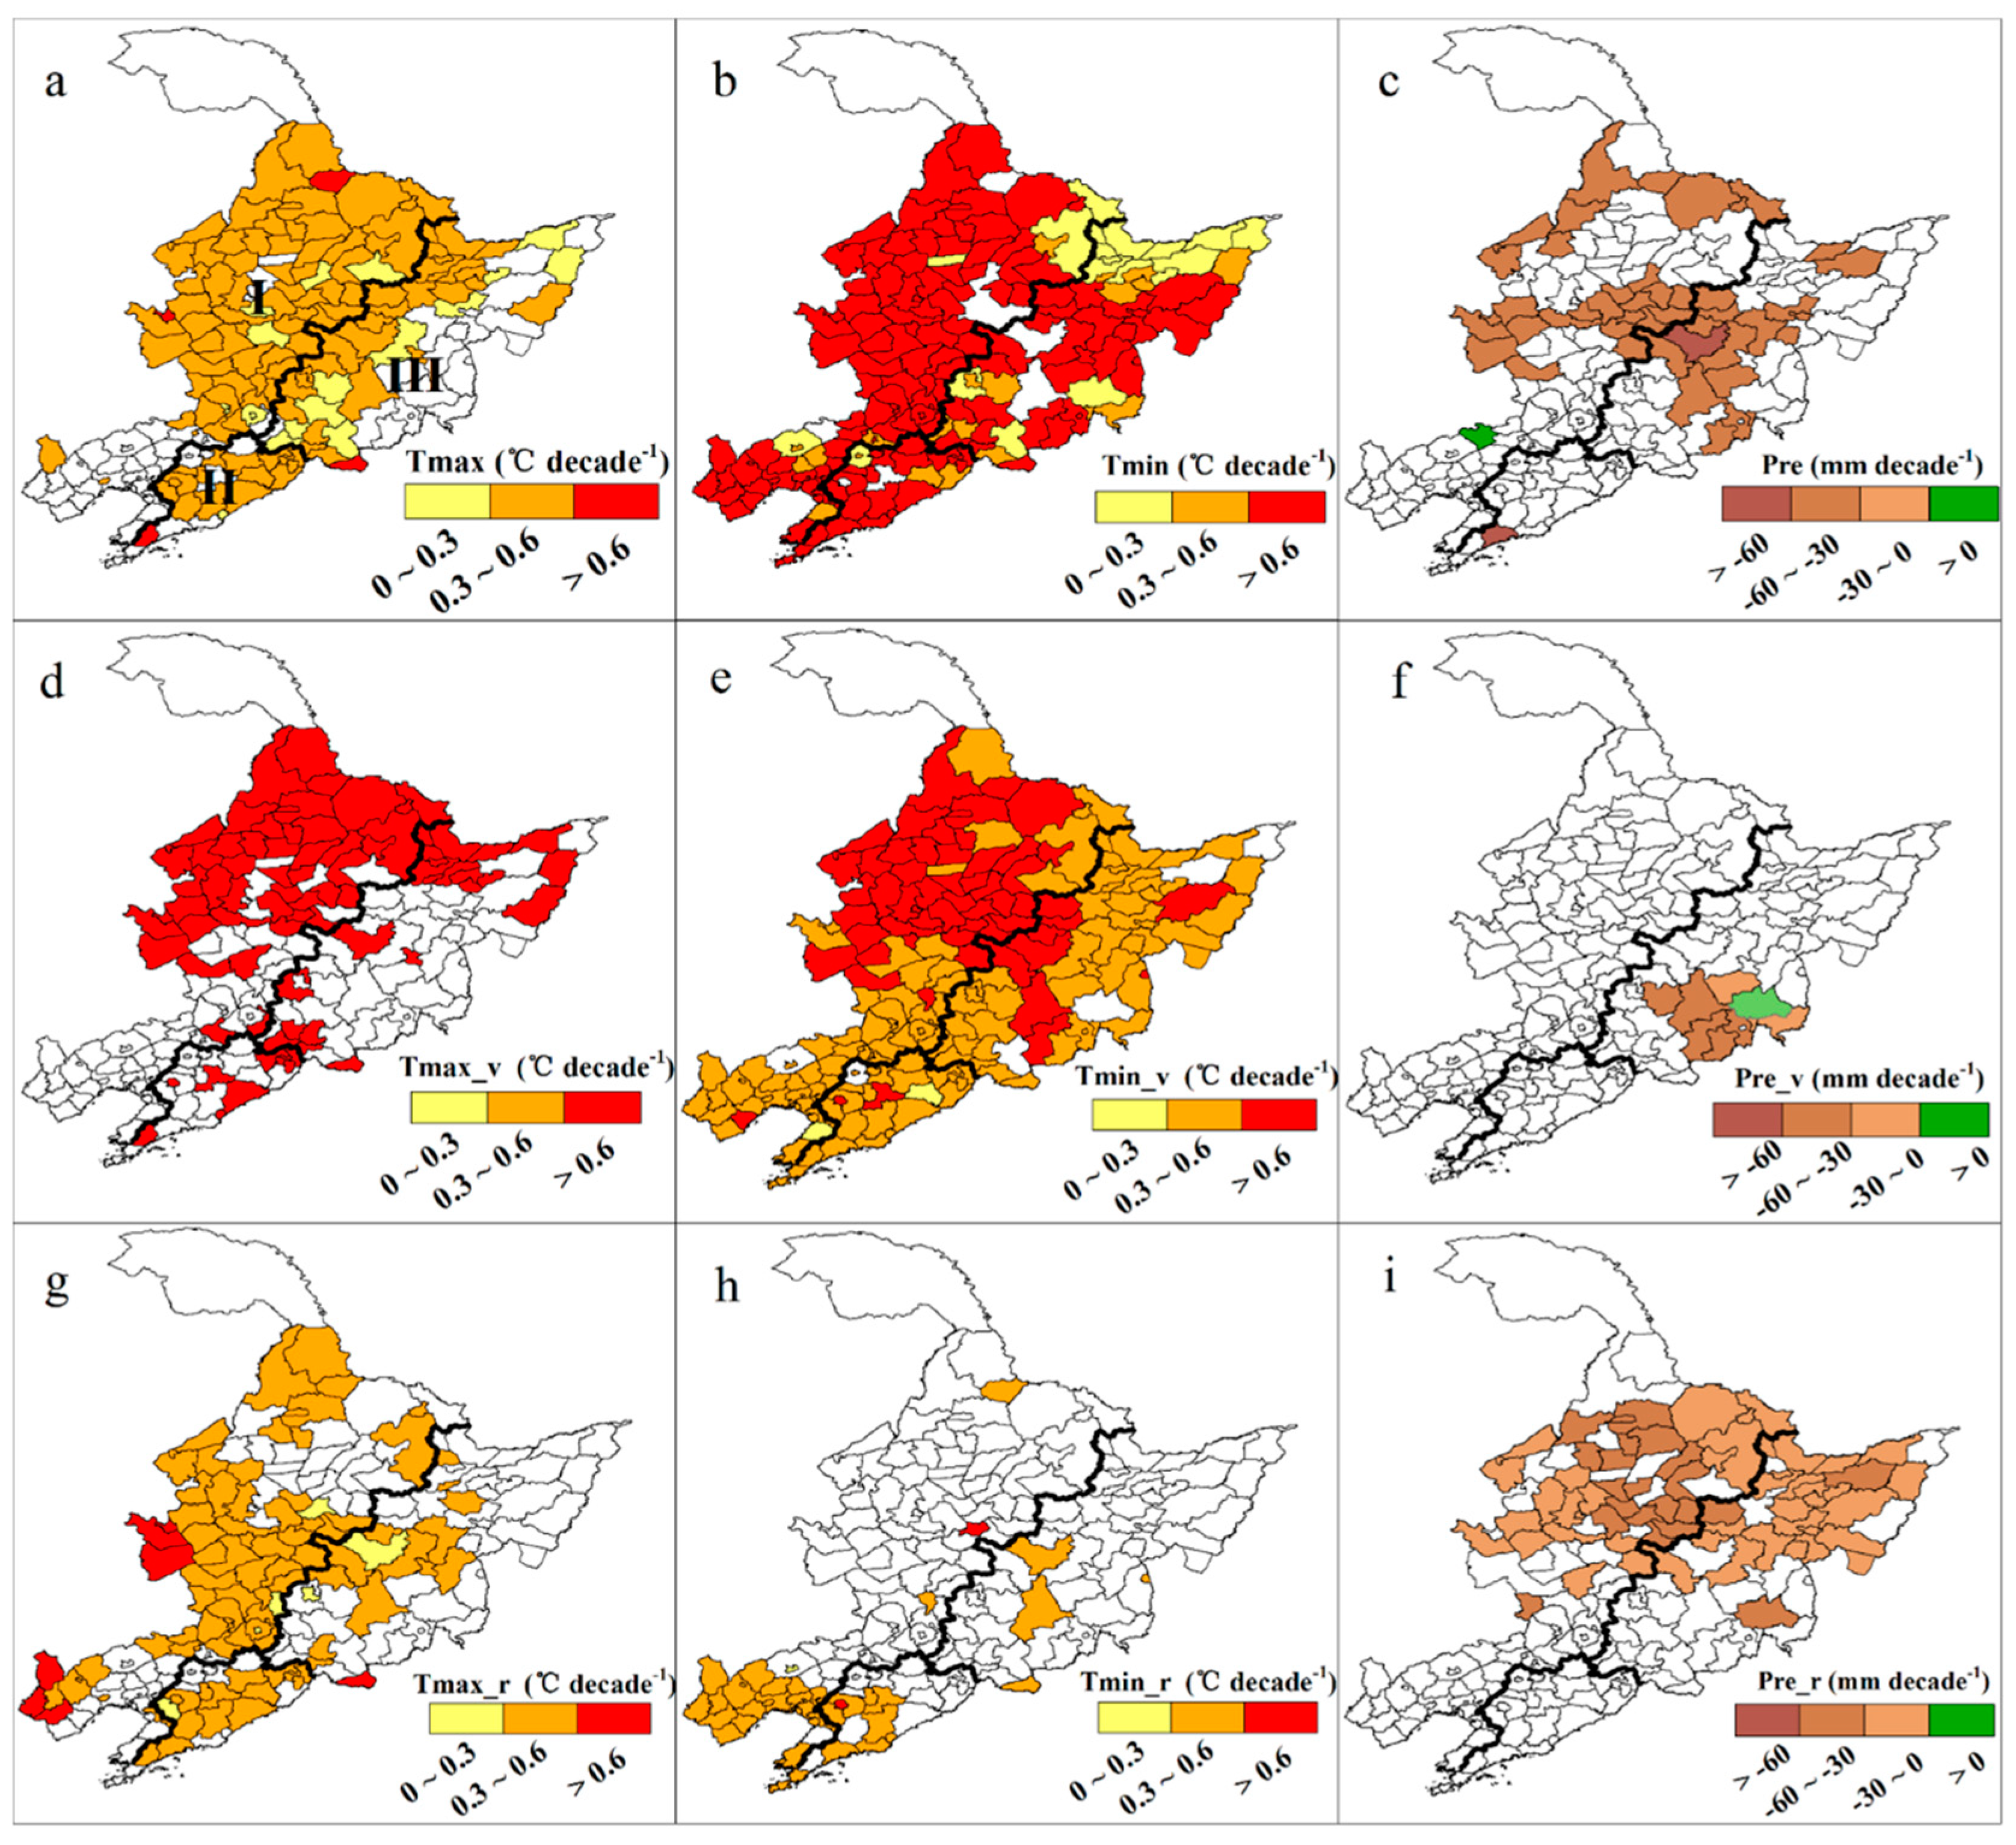
3.1. Climate Change during Whole-Season and V&R Phases

Of the 190 counties, 126 and 170 counties show a significant increase in Tmax (Figure 1a) and Tmin (Figure 1b) over the growing season. On average, Tmax and Tmin increased by 0.37°C and 0.41°C per decade, respectively. The seasonal total precipitation decreased significantly in 48 counties located at the central part and north edge of NEC (Figure 1c), at rates ranging from 30 to 71 mm per decade.
It is noteworthy that warming in NEC shows remarkable difference not only between vegetative and reproductive phases (Table 1), but spatial distribution (Figure 1d,e,g,h). Of the 190 counties, 77 and 96 counties showed significant increase in Tmax_v and Tmax_r at the rates of 0.42°C and 0.41°C per decade, respectively (Table 1). By contrast, 182 of the 190 counties showed significant increase in Tmin_v (Figure 1e), but few counties showed increase in Tmin_r (Figure 1h). The mean rates of Tmin_v and Tmin_r are 0.55°C and 0.38°C per decade (Table 1), respectively, indicating a more pronounced increase in minimum temperature at vegetative phase. Moreover, the mean increasing rate of Tmin_v in Region II is lower than in Regions I and III (Table 1). Significant increases in Tmax_v occurred mainly in the north part of NEC (Figure 1d), while the increases in Tmax_r were primarily distributed in the central part and southward of NEC (Figure 1g).
No significant trends in precipitation in the vegetative phase were detected in most counties of NEC (Figure 1f, Table 1), while 74 counties showed significant decrease in Pre_r that distributed in Heilongjiang Province (Figure 1i), with the mean decrease rates of 32 and 27 mm per decade in Region I and Region III, respectively (Table 1).

3.2. Climatic Determinants of Yield Change

Increase in Tmax led to a reduction of maize yield in region I. The yield decreased by 16.7% for 1°C warming during growing season, or by 11.2% and 4.6% for 1°C warming at the vegetative and reproductive phases (Table 2). By contrast, maize yield benefited from an increase in Tmin, with the yield increase of 9.1% or 12.6% for 1°C warming during whole-season or vegetative phase, respectively. Increase in precipitation at vegetative phase also improved maize yield. However, increase in Tmin at reproductive phase reduced maize yield by 4.5% for 1°C warming (Table 2).
Increase in precipitation generally induced a reduction of maize yield in region II. The yield losses were estimated to be 2.0%, 6.1% or 3.2%, respectively, when an increase in precipitation of 100 mm occurred during whole-season, vegetative or reproductive phase in region II (Table 2). Nevertheless, increase in Tmin increased yield by 13.4% for 1°C warming at vegetative phase. By contrast, increase in Tmax at reproductive phase resulted in yield loss of 9.7% for 1°C warming (Table 2).
Maize yield in region III benefited from an increase in Tmax. The contribution of Tmax increase to maize yield is more pronounced at vegetative phase than at reproductive phase, with the yield improvements of 7.0% and 4.5% for 1°C warming (Table 2).

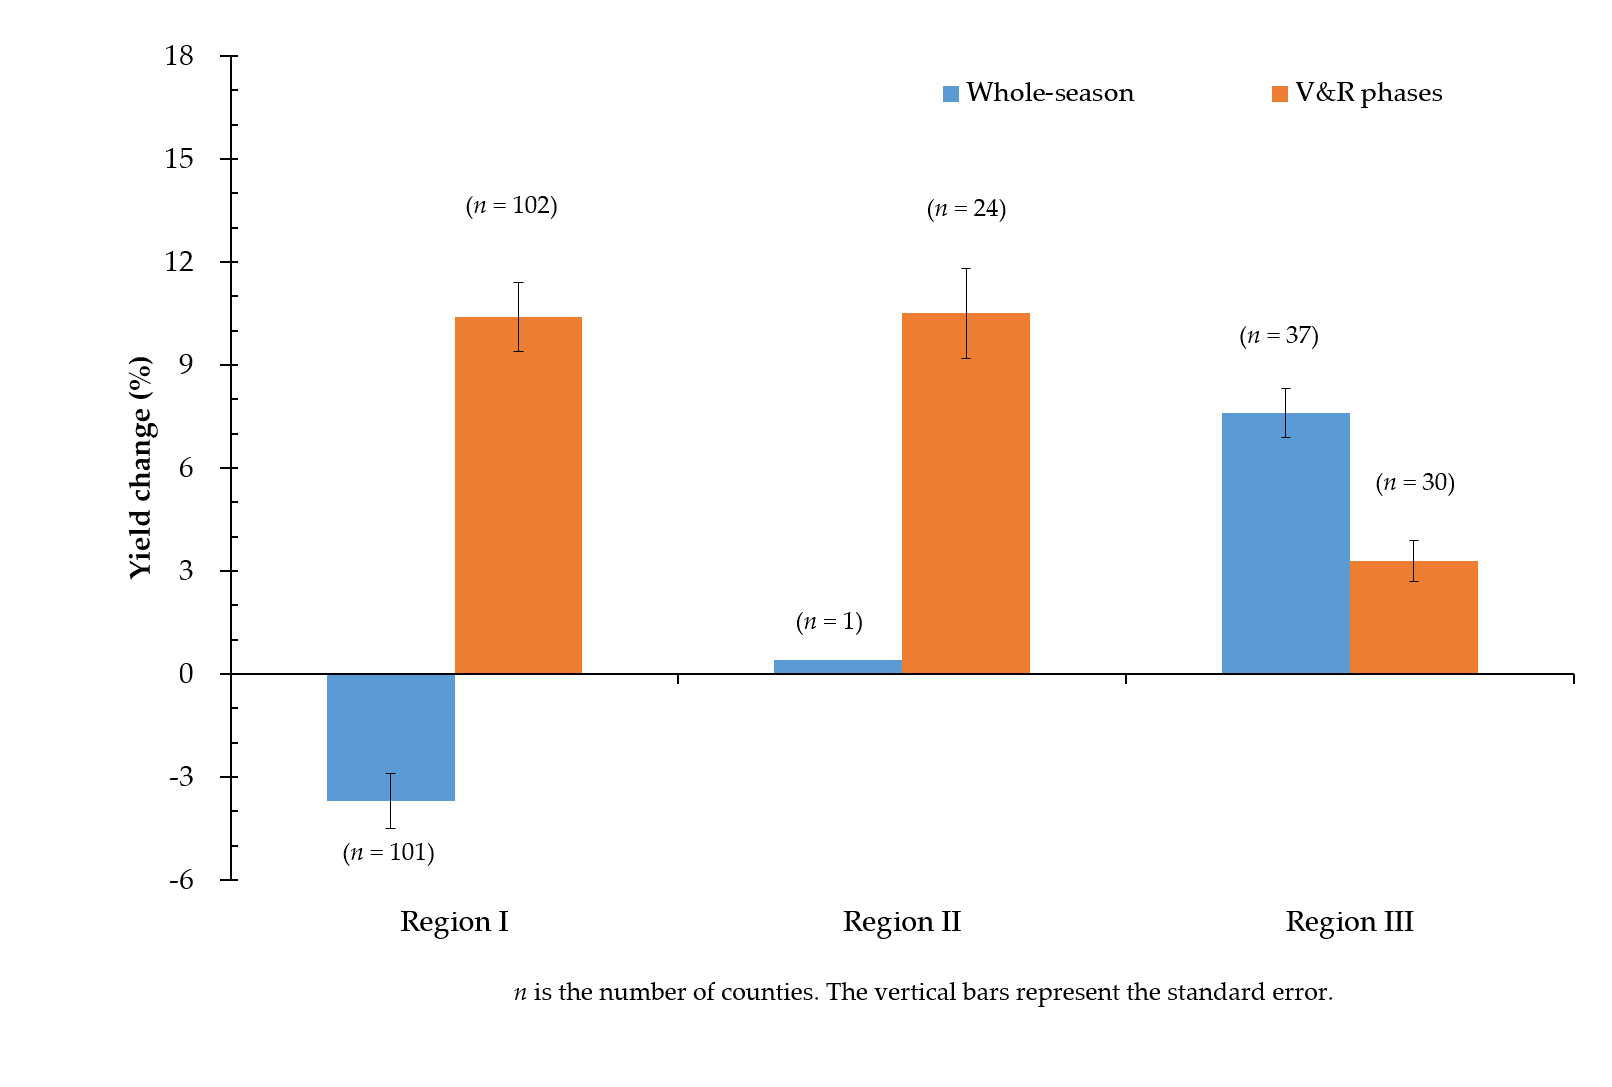
3.3. Yield Change Induced by Climate Change

Using Equation (5), we estimated the changes in maize yield induced by climate change at two time windows, whole-season (Figure 2a), and the V&R phases (Figure 2b) over the period 1980–2010. The counties with yield reduction, increase and no significant change accounted for 37%, 27% and 36% of the 190 counties, when climate change over the whole-season was concerned. Yield reduction due to climate change occurred in the west part of NEC, while yield increase was identified in the east-central part of NEC. Counties in the eastern edge of NEC did not show a significant change in maize yield (Figure 2a).
When climate change at V&R phases was taken into consideration, however, maize yield was found to have increased in 81% of the 190 counties. No significant change occurred in the eastern edge of NEC, and only 4% of all counties showed yield reduction due to climate change (Figure 2b).
Using Equation (6), we estimated the impacts of climate change over the period 1980–2010 on maize production at three regions (Table 3). Increase in Tmax depressed maize yield, but increase in Tmin particularly at vegetative phase improved yield in region I. The impact of climate change on maize yield was estimated to be a loss of 3.7% based on the time window of whole-season, but to show an increase of 10.4% when the climate change at V&R phases was taken into account. In region II, an increase in Tmin at vegetative phase improved maize yield by 18.2%, which compensated for the yield reduction due to an increase in Tmax at reproductive phase. As a result, climate change at V&R phases in region II increased the maize yield by 10.5%, but no significant impacts on the yield were detected when the yield-climate relationship was used at the window of whole-season. Rising Tmax was generally favorable to maize production in region III, but the increase in the yield was different between two time windows. Overall, trends in precipitation were not responsible for the yield change.
Taking into consideration the harvest area of maize at different counties, the area-weighted impact of climate change on maize production in NEC was estimated to be a reduction of 1.3% at the time window of whole-season, and to be a total increase of 9.1% at the time window of V&R phases over the period 1980–2010.

3.4. Yield Response to Climate Variability

Using Equation (8), we estimated yield fluctuations due to inter-annual climate variability. Climate variability during the whole-season led to maize yield fluctuation in 38% of the 190 counties. By contrast, the yield fluctuations due to climate variability at V&R phases were found in 95% of the 190 counties.
Using Equation (9), we estimated the effect of inter-annual climate variability on maize yield for each region (Table 4). On average, the yield fluctuations per year ranged from −2.5% to 2.2% in region I, from −4.3% to 2.2% in region II and from −1.0% to 1.1% in region III, respectively, when the inter-annual climate variability was calculated in terms of whole-season window. By contrast, the yield fluctuations ranged from −9.8% to 9.6% in region I, from −10.5% to 9.4% in region II and from −5.5% to 5.6% in region III, respectively, when the inter-annual climate variability was calculated in terms of V&R window. The yield fluctuations were principally attributed to the variability in Tmax_v, Tmin_r and Pre_v for region I, Pre_v and Pre_r for region II and Tmax_v and Tmax_r for region III (Table 4).
The area-weighted yield fluctuations induced by inter-annual climate variability in NEC were estimated to be ±2% per year in terms of whole-season window, or ±9% per year in terms of V&R window.

4. Discussion

4.1. Diverse Impact of Climate Change on Maize Yield in Different Regions

The optimum temperature for spring maize growth in NES is 26°C during vegetative phase and 24°C during reproductive phase, respectively [40]. The response of maize yield change to maximum temperature was different between region I and region III (Table 2), which is likely attributed to local temperatures relative to optimum. Tmax in region III was lower than in region I, whether during the whole-season or V&R phases (Table 5). Moreover, the temperatures in region III (Table 5) were much lower than the optimum temperature for spring maize growth, and thus, warming in this region improved maize yield.
Maize was significantly affected by extreme heat [28] and direct extreme heat (over 30°C) imposed on reproductive processes reduced yield [41]. However, even the average Tmax was generally lower than 30°C in NEC (Table 5) due to relatively high latitude. Furthermore, the extreme heat days in NEC did not show significant increased trend in the past five decades [42], suggesting that maize yield change in NEC might not be attributed to the extreme heat.
Maize is highly sensitive to waterlogging and submergence caused by flooding, excessive rains and poor drainage. Waterlogging reduces germination, survival and growth rate of maize seedlings [43] and depresses leaf photosynthesis [44]. Dietzel et al. [45] revealed that 430 mm seasonal rainfall resulted in optimal water use efficiency, whereas yields did not benefit from additional precipitation above these levels. Another study showed 446–460 mm precipitation can meet the requirement for potential maize yield in NEC [46]. It should be noted that the precipitation during growing season in three regions (Table 5) could meet the demand for maize growth. The precipitation in region II was much higher than in regions I and III, with 375 mm in vegetative phase and 390 mm in reproductive phase (Table 5). Increase in precipitation appears to raise the risk of waterlogging in region II, and thus, reduced maize yield (Table 2). This is supported by a more recent study of model simulation [47].

4.2. Importance of Phenological Phase in Assessing Climate Change Impacts on Crop Yield

Similar to other studies [9,48,49], climate change over the course of a growing season reduced maize yield by 1.3% in NEC. However, the trends in temperatures and precipitation at V&R phases differed from the trends under the time window of whole-season (Figure 1). It has been well recognized that responses of maize growth and yield formation to climate are distinct in different phenological phases [15,16]. Early season low temperature affects germination, seedling growth and leaf development [50]. The mean temperature at vegetative phase was 18°C in regions I and II, and 15.5°C in regions III (Table 5), much lower than the optimum temperature of 26°C [40]. Furthermore, the minimum temperature at vegetative phase (Table 5) approached the low threshold of 12°C [40]. An increase in Tmin_v would no doubt increase maize yield (Table 5).
Consistent with Liu et al. [51], an increase in low temperature increased maize yield in regions I and II, and this benefit was more pronounced at vegetative phase than the whole-season (Table 2 and Table 3). Note that 96% of counties showed a significant increase in Tmin_v (Figure 1e), but few counties showed an increase in Tmin_r (Figure 1h). Over the period 1980–2010, minimum temperature at vegetative phase increased 1.8°C in region I and 1.4°C in region II. This slowed down greatly the negative effects of rising Tmax on maize yield, resulting in an overall 10% improvement of yield (Table 3). As an interpretable case, we suggest that the assessment of climate change impacts on crop yield should take the phenological phase into consideration.
The county-level data of maize phenology over 31 years in NEC appears to be difficult to obtain. Available observations from 12 Agro-meteorological Experimental Stations located at NEC (Table S1) show that the occurrence dates of maize phenology are relatively stable (Table S2) and agree well with the assignment of V&R phases, though new cultivars were frequently introduced over the time (Table S1). However, using the maize phenology from Mu et al. [32] may limit the accuracy of our estimations, although the data from the 12 Agro-meteorological Experimental Stations are comparable with Mu et al. [32]. It is expected that the assessment of climate change impacts on maize yield could be more robust when the county-level data of phenology are available.

4.3. Yield Variability against Inter-Annual Variation of Climate

Much attention has been given to the climate change impacts on crop yield in China [1,9,49], but little is known about the effects of climate variability. Zhang and Huang [52] reported that inter-annual variations in precipitation and solar radiation have driven changes in cereal yields in China over the period 1980–2008. Tao et al. [53] addressed the variability in crop yields associated with climate anomalies in China, and found that high variability in crop yields occurred in northern and northeastern China. Our study further quantified the yield variability induced by climate anomalies in northeastern China, deepening our understanding of the effects of climate variability on maize yield.
Changes in maize yield induced by climate variability in NEC was estimated to be ±9% per year in terms of V&R phases, lower than global crop yield variability due to climate variation [27]. The impact of climate change on maize yield over the 31 years (9.1%) is equivalent to the yield variability per year. This not only improves our understanding of the attribution of climate to yield change, but also highlights the importance of buffering future crop production from climate variability.
It is noteworthy that the variability in precipitation was very large in NEC, with ±100 mm in region I, ±90 mm in region II and ±140 mm in region III (Table 4), although no significant droughts occurred in maize season over the period 1970–2009 [2]. NEC has experienced a rapid increase in temperature over the last decades (Figure 1). The temperature in NEC will most likely continue to increase at a higher warming rate in the future [54], which may induce drought particularly in region I and III. A development of irrigation system is expected to reduce the risk of yield loss caused by drought.

4.4. Comparison with Other Studies

Previous studies dedicated to Northeast China showed a common picture that increase in Tmin increased maize yield, which is in agreement with our study (Table 6). Nevertheless, our study further demonstrated that the yield increase in response to increased Tmin is in the vegetative phase rather than in the reproductive phase (Table 3 and Table 6). This is also attributed to a significant increase in Tmin_v in the majority of counties (96%). By contrast, only 22% of the counties showed a significant increase in Tmin_r (Table 1), which may not affect maize production overall (Table 3).
Wang et al. reported that maize yield in NEC decreased by 13.4% in response to a 1°C increase in growing season mean Tmax. However, our study showed region-specific responses of yield to increased Tmax—yield decreased in regions I and II but increased in region III (Table 3 and Table 6). This further suggests the importance of spatial scale when the yield-climate relationships are determined.
It should be noted that the data used in this study have not only higher spatial resolution but two developmental phases in comparison with previous studies (Table 6). This could lead to a convincing case to some extent. Moreover, the present study is dedicated to quantitatively assessing climate change and climate variability impacts on maize yield in NEC, which could help policy-makers to make sensible region-oriented decisions on climate change impact on crop production.

5. Conclusions

Climate change over the period 1980‒2010 has indeed impacted maize yield in Northeast China (NEC), but different time windows of climate provides divergent estimates of this impact. Climate change at the time window of whole-season induced a reduction in maize yield, while an increase in the yield was estimated at the time window of vegetative and reproductive phases. This yield increase is interpretable in terms of three cardinal temperatures of maize growth. Yield fluctuations due to inter-annual climate variability were equivalent to the impact of climate change on maize yield over the 31 years. The impacts of climate variability and change on maize yield show region specific, depending on the local climate relative to the optimum. Precipitation anomalies contributed to the yield fluctuations, but were not responsible for the trends in yield change. The inter-annual variability in precipitation was very large in NEC. The temperature in NEC will most likely continue to increase at a higher warming rate in the future, which may induce drought particularly in region I and III. Increase in precipitation appears to raise the risk of waterlogging in region II, and thus, would reduce maize yield. Policy-makers should pay special attention to this regional-oriented potential risk. The development of irrigation-drainage systems and an adoption of maize cultivars with low sensitivity to water stress are expected to reduce the risk of yield loss caused by drought and/or waterlogging. Our findings not only improve the understanding of the attribution of climate to yield change, but also show the importance of buffering future crop production from climate change in NEC.

Supplementary Materials

The following are available online at https://www.mdpi.com/2071-1050/11/23/6659/s1, Figure S1. Geographical location of study area. Yellow area shows three provinces of Heilongjiang, Jilin and Liaoning in Northeast China. Green area shows the counties where maize was planted. Fine lines are county boundaries. Solid circles show the location of meteorological stations, Figure S2. Dendrogram of hierarchical cluster analysis. x-axis is the rescaled distance cluster combine, and y-axis is the county code. The red marks show the three clusters. Variables using in the hierarchical cluster analysis are a set of correlation coefficients between the yield change (∆yield %) and the changes in climate variable (∆X) for each county. The X includes Tmax, Tmin, Pre and SH during entire growing season, and Tmax_v, Tmin_v, Pre_v, SH_v, Tmax_r, Tmin_r, Pre_r and SH_r in the time window of V&R phases, Figure S3. Three regions were oriented in light of the hierarchical cluster analysis in Figure S2, Table S1. Information about the period of observation and the number of cultivars planted at 12 agrometeorological stations in NEC, Table S2. Descriptive statistics for the observed date (mm/dd) of sowing, tasseling and maturity at 12 agrometeorological stations in NEC.

Author Contributions

Conceptualization, Y.H.; Methodology, X.D., Y.H.; Calculation and Analysis, X.D., Y.H.; All authors have reviewed, edited and approved this manuscript.

Funding

This research was funded by the National Natural Science Foundation of China, grant number 41530533.

Acknowledgments

We thank the Chinese Academy of Agricultural Sciences for providing county level crop data, and Chinese Meteorological Administration for providing climate data. Thanks are also dedicated to three anonymous reviewers who provided helpful comments that led to the improvement of this paper.

Conflicts of Interest

The authors declare no conflict of interest.

References

  1. Piao, S.; Ciais, P.; Huang, Y.; Shen, Z.; Peng, S.; Li, J.; Zhou, L.; Liu, H.; Ma, Y.; Ding, Y.; et al. The impacts of climate change on water resources and agriculture in China. Nature 2010, 467, 43–51. [Google Scholar] [CrossRef] [PubMed]
  2. Chen, C.; Qian, C.; Deng, A.; Zhang, W. Progressive and active adaptations of cropping system to climate change in Northeast China. Eur. J. Agron. 2012, 38, 94–103. [Google Scholar] [CrossRef]
  3. Zhao, C.; Liu, B.; Piao, S.; Wang, X.; Lobell, D.B.; Huang, Y.; Huang, M.; Yao, Y.; Bassu, S.; Ciais, P.; et al. Temperature increase reduces global yields of major crops in four independent estimates. Proc. Natl. Acad. Sci. USA 2017, 114, 9326–9331. [Google Scholar] [CrossRef] [PubMed]
  4. Lobell, D.B.; Schlenker, W.; Costa-Roberts, J. Climate Trends and Global Crop Production Since 1980. Science 2011, 333, 616–620. [Google Scholar] [CrossRef]
  5. Lobell, D.B.; Burke, M.B. On the use of statistical models to predict crop yield responses to climate change. Agric. For. Meteorol. 2010, 150, 1443–1452. [Google Scholar] [CrossRef]
  6. Lobell, D.B.; Bänziger, M.; Magorokosho, C.; Vivek, B. Nonlinear heat effects on African maize as evidenced by historical yield trials. Nat. Clim. Chang. 2011, 1, 42–45. [Google Scholar] [CrossRef]
  7. Li, X.; Troy, T.J. Changes in rainfed and irrigated crop yield response to climate in the western US. Environ. Res. Lett. 2018, 13, 6. [Google Scholar] [CrossRef]
  8. Zhang, T.; Huang, Y. Estimating the impacts of warming trends on wheat and maize in China from 1980 to 2008 based on county level data. Int. J. Climatol. 2013, 33, 699–708. [Google Scholar] [CrossRef]
  9. Zhang, Z.; Song, X.; Tao, F.; Zhang, S.; Shi, W. Climate trends and crop production in China at county scale, 1980 to 2008. Theor. Appl. Climatol. 2016, 123, 291–302. [Google Scholar] [CrossRef]
  10. Chen, C.; Lei, C.; Deng, A.; Qian, C.; Hoogmoed, W.; Zhang, W. Will higher minimum temperatures increase corn production in Northeast China? An analysis of historical data over 1965–2008. Agric. For. Meteorol. 2011, 151, 1580–1588. [Google Scholar] [CrossRef]
  11. Yin, X.G.; Olesen, J.E.; Wang, M.; ÖZtÜRk, I.; Chen, F. Climate effects on crop yields in the Northeast Farming Region of China during 1961–2010. J. Agric. Sci. 2016, 154, 1190–1208. [Google Scholar] [CrossRef]
  12. Lobell, D.B.; Field, C.B. Global scale climate-crop yield relationships and the impacts of recent warming. Environ. Res. Lett. 2007, 2, 014002. [Google Scholar] [CrossRef]
  13. Osborne, T.M.; Wheeler, T.R. Evidence for a climate signal in trends of global crop yield variability over the past 50 years. Environ. Res. Lett. 2013, 8, 2. [Google Scholar] [CrossRef]
  14. Xiong, W.; Holman, I.P.; You, L.; Yang, J.; Wu, W. Impacts of observed growing-season warming trends since 1980 on crop yields in China. Reg. Environ. Chang. 2014, 14, 7–16. [Google Scholar] [CrossRef]
  15. Sánchez, B.; Rasmussen, A.; Porter, J.R. Temperatures and the growth and development of maize and rice: A review. Glob. Chang. Biol. 2014, 20, 408–417. [Google Scholar] [CrossRef] [PubMed]
  16. Butler, E.E.; Huybers, P. Variations in the sensitivity of US maize yield to extreme temperatures by region and growth phase. Environ. Res. Lett. 2015, 10, 34009. [Google Scholar] [CrossRef]
  17. Luo, Q. Temperature thresholds and crop production: A review. Clim. Chang. 2011, 109, 583–598. [Google Scholar] [CrossRef]
  18. Rattalino Edreira, J.I.; Otegui, M.E. Heat stress in temperate and tropical maize hybrids: Differences in crop growth, biomass partitioning and reserves use. Field Crops Res. 2012, 130, 87–98. [Google Scholar] [CrossRef]
  19. Tollenaar, M. Response of dry matter accumulation in maize to temperature: I. dry matter partitioning. Crop Sci. 1989, 29, 1239–1246. [Google Scholar] [CrossRef]
  20. Schoper, J.B.; Lambert, R.J.; Vasilas, B.L.J.C.S. Pollen Viability, Pollen Shedding, and Combining Ability for Tassel Heat Tolerance in Maize. Crop Sci. 1987, 27, 27–31. [Google Scholar] [CrossRef]
  21. Cárcova, J.; Otegui, M.E. Ear temperature and pollination timing effects on maize kernel set. Crop Sci. 2001, 41, 1809–1815. [Google Scholar] [CrossRef]
  22. Lizaso, J.I.; Ruiz-Ramos, M.; Rodríguez, L.; Gabaldon-Leal, C.; Oliveira, J.A.; Lorite, I.J.; Sánchez, D.; García, E.; Rodríguez, A. Impact of high temperatures in maize: Phenology and yield components. Field Crops Res. 2018, 216, 129–140. [Google Scholar] [CrossRef]
  23. Cakir, R. Effect of water stress at different development stages on vegetative and reproductive growth of corn. Field Crops Res. 2004, 89, 1–16. [Google Scholar] [CrossRef]
  24. Mansouri-Far, C.; Modarres Sanavy, S.A.M.; Saberali, S.F. Maize yield response to deficit irrigation during low-sensitive growth stages and nitrogen rate under semi-arid climatic conditions. Agric. Water Manag. 2010, 97, 12–22. [Google Scholar] [CrossRef]
  25. Zhao, J.F.; Guo, J.P.; Mu, J. Exploring the relationships between climatic variables and climate-induced yield of spring maize in Northeast China. Agric. Ecosyst. Environ. 2015, 207, 79–90. [Google Scholar] [CrossRef]
  26. Wang, X.; Peng, L.; Zhang, X.; Yin, G.; Zhao, C.; Piao, S. Divergence of climate impacts on maize yield in Northeast China. Agric. Ecosyst. Environ. 2014, 196, 51–58. [Google Scholar] [CrossRef]
  27. Ray, D.K.; Gerber, J.S.; MacDonald, G.K.; West, P.C. Climate variation explains a third of global crop yield variability. Nat. Commun. 2015, 6, 5989. [Google Scholar] [CrossRef]
  28. Lesk, C.; Rowhani, P.; Ramankutty, N. Influence of extreme weather disasters on global crop production. Nature 2016, 529, 84–87. [Google Scholar] [CrossRef]
  29. Iizumi, T.; Ramankutty, N. Changes in yield variability of major crops for 1981–2010 explained by climate change. Environ. Res. Lett. 2016, 11, 34003. [Google Scholar] [CrossRef]
  30. Zampieri, M.; Ceglar, A.; Dentener, F.; Toreti, A. Wheat yield loss attributable to heat waves, drought and water excess at the global, national and subnational scales. Environ. Res. Lett. 2017, 12, 064008. [Google Scholar] [CrossRef]
  31. Meng, Q.; Hou, P.; Lobell, D.B.; Wang, H.; Cui, Z.; Zhang, F.; Chen, X. The benefits of recent warming for maize production in high latitude China. Clim. Chang. 2014, 122, 341–349. [Google Scholar] [CrossRef]
  32. Mu, J.; Zhao, J.; Guo, J.; Chinese Academy of Meteorological Sciences. Response of Spring Maize Growth Stage to Climate Change in Northeast China over the Past 30 Years. J. Appl. Meteorol. Sci. 2014, 25, 680–689. [Google Scholar]
  33. Thornton, P.E.; Running, S.W.; White, M.A. Generating surfaces of daily meteorological variables over large regions of complex terrain. J. Hydrol. 1997, 190, 214–251. [Google Scholar] [CrossRef] [Green Version]
  34. Nicholls, N. Increased Australian yheat yield due to recent climate trends. Nature 1997, 387, 484–485. [Google Scholar] [CrossRef]
  35. Lobell, D.B. Changes in diurnal temperature range and national cereal yields. Agric. For. Meteorol. 2007, 145, 229–238. [Google Scholar] [CrossRef]
  36. Xu, R.; WunschIi, D. Survey of Clustering Algorithms. IEEE Trans. Neural Netw. 2005, 16, 645–678. [Google Scholar] [CrossRef] [Green Version]
  37. Leilah, A.A.; Al-Khateeb, S.A. Statistical analysis of wheat yield under drought conditions. J. Arid. Environ. 2005, 61, 483–496. [Google Scholar] [CrossRef]
  38. Miles, J. Tolerance and variance inflation factor. In Encyclopedia of Statistics in Behavioral Science; Everitt, B.S., Howell, D.C., Eds.; John Wiley and Sons: Hoboken, NJ, USA, 2005; pp. 2055–2056. [Google Scholar]
  39. O’Brien, R.M. A caution regarding rules of thumb for variance inflation factors. Qual. Quant. 2007, 41, 673–690. [Google Scholar] [CrossRef]
  40. Yuan, B.; Guo, J.; Ye, M.; Zhao, J. Variety distribution pattern and climatic potential productivity of spring maize in Northeast China under climate change. Chin. Sci. Bull. 2012, 57, 3497–3508. [Google Scholar] [CrossRef] [Green Version]
  41. Zhu, P.; Zhuang, Q.; Archontoulis, S.V.; Bernacchi, C.; Muller, C. Dissecting the nonlinear response of maize yield to high temperature stress with model-data integration. Glob. Chang. Biol. 2019, 25, 2470–2484. [Google Scholar] [CrossRef]
  42. Lu, R.; Chen, R. A review of recent studies on extreme heat in China. Atmos. Ocean. Sci. Lett. 2016, 9, 114–121. [Google Scholar] [CrossRef] [Green Version]
  43. Campbell, M.T.; Proctor, C.A.; Dou, Y.; Schmitz, A.J.; Phansak, P.; Kruger, G.R.; Zhang, C.; Walia, H. Genetic and molecular characterization of submergence response identifies Subtol6 as a major submergence tolerance locus in maize. PLoS ONE 2015, 10, e0120385. [Google Scholar] [CrossRef] [PubMed]
  44. De Souza, T.C.; Magalhães, P.C.; Pereira, F.J.; de Castro, E.M.; Parentoni, S.N. Morpho-physiology and maize grain yield under periodic soil flooding in successive selection cycles. Acta Physiol. Plant. 2011, 33, 1877–1885. [Google Scholar] [CrossRef]
  45. Dietzel, R.; Liebman, M.; Ewing, R.; Helmers, M.; Horton, R.; Jarchow, M.; Archontoulis, S. How efficiently do corn- and soybean-based cropping systems use water? A systems modeling analysis. Glob. Chang. Biol. 2016, 22, 666–681. [Google Scholar] [CrossRef] [PubMed]
  46. Meng, Q.; Chen, X.; Lobell, D.B.; Cui, Z.; Zhang, Y.; Yang, H.; Zhang, F. Growing sensitivity of maize to water scarcity under climate change. Sci. Rep. 2016, 6, 19605. [Google Scholar] [CrossRef] [PubMed] [Green Version]
  47. Zhao, J.; Yang, X. Distribution of high-yield and high-yield-stability zones for maize yield potential in the main growing regions in China. Agric. For. Meteorol. 2018, 248, 511–517. [Google Scholar] [CrossRef]
  48. Tao, F.; Yokozawa, M.; Liu, J.; Zhang, Z. Climate–crop yield relationships at provincial scales in China and the impacts of recent climate trends. Clim. Res. 2008, 38, 83–94. [Google Scholar] [CrossRef]
  49. Wei, T.; Cherry, T.L.; Glomrød, S.; Zhang, T. Climate change impacts on crop yield: Evidence from China. Sci. Total Environ. 2014, 499, 133–140. [Google Scholar] [CrossRef] [Green Version]
  50. Miedema, P. The Effects of Low Temperature on Zea mays. Adv. Agron. 1982, 35, 93–128. [Google Scholar]
  51. Liu, Z.; Yang, X.; Hubbard, K.G.; Lin, X. Maize potential yields and yield gaps in the changing climate of northeast China. Glob. Chang. Biol. 2012, 18, 3441–3454. [Google Scholar] [CrossRef]
  52. Zhang, T.; Huang, Y. Impacts of climate change and inter-annual variability on cereal crops in China from 1980 to 2008. J. Sci. Food Agric. 2012, 92, 1643–1652. [Google Scholar] [CrossRef] [PubMed]
  53. Tao, F.; Zhang, Z.; Zhang, S.; Rötter, R.P. Variability in crop yields associated with climate anomalies in China over the past three decades. Reg. Environ. Chang. 2016, 16, 1715–1723. [Google Scholar] [CrossRef]
  54. National Development and Reform Commission. Second National Communication on Climate Change of the People’s Republic of China; National Development and Reform Commission: Beijing, China, 2013. [Google Scholar]
Figure 1. Spatial distribution of the trends in maximum temperature (Tmax), minimum temperature (Tmin) and precipitation (Pre) over the period 1980–2010. (ac) show the trends for the time window of whole-season; (df) show the trends over the vegetative phase in the time window of vegetative and reproductive (V&R); (gi) show the trends over the reproductive phase in the time window of V&R. Only the counties with significant trend (p < 0.05) are presented. The three regions are expressed by I, II and III, respectively. The bold black lines show the region boundaries.
Sustainability 11 06659 g001
Figure 2. Spatial distribution of the yield change induced by climate change at two time windows. (a) Whole-season and (b) V&R phases. The insets at the right top corner show the frequency of yield change based on the estimates for each county.
Sustainability 11 06659 g002
Table 1. Trends in temperature and precipitation over the period 1980–2010 a.
Item bNortheast ChinaRegion IRegion IIRegion III
Mean ± SD cnMean ± SDnMeannMeann
Tmax0.37 ±0.081260.39 ± 0.09720.37 ± 0.07170.32 ± 0.0537
Tmax_v0.42 ± 0.13770.43 ± 0.07500.53 ± 0.3570.38 ± 0.0620
Tmax_r0.41 ± 0.13960.43 ± 0.11650.41 ± 0.08150.33 ± 0.0916
Tmin0.41 ± 0.131700.42 ± 0.13980.42 ± 0.17270.37 ± 0.1245
Tmin_v0.55 ± 0.121820.57 ± 0.111020.46 ± 0.13270.56 ± 0.1053
Tmin_r0.38 ± 0.18410.40 ± 0.10250.40 ± 0.11120.15 ± 0.474
Pre−42.7 ± 15.748−40.8 ± 18.329−60.0 d −44.9 ± 10.418
Pre_v−24.9 ± 20.49n.t. e n.t. −24.9 ± 20.49
Pre_r−29.9 ± 5.974−31.7 ± 5.147n.t. −26.7 ± 5.927
a Only the counties with significant trend (p < 0.05) in temperature and precipitation were included. b °C per decade for trends in temperature; 100 mm per decade for trends in precipitation. c Standard deviation. d Only one county shows decrease in precipitation. e No trends were tested for all counties.
Table 2. Summary statistics of regression model (Equation (3)) between maize yield and climate first-differences, 1980–2010.
Time WindowVariable/UnitRegion I (n = 788)Region II (n = 289)Region III (n = 434)
β aSE b95% CI cp-ValueβSE95% CIp-ValueβSE95% CIp-Value
Whole-season∆Tmax/°C−16.71.8−20.2 – −13.30.000 11.51.87.9 – 15.10.000
∆Tmin/°C9.12.24.7 – 13.50.000
∆Pre/100 mm −2.00.8−3.7 – −0.40.017
VIF d1.381.001.00
V&R phases∆Tmax_v/°C−11.21.7−14.4 – −7.90.000 7.01.54.1 – 9.90.000
∆Tmin_v/°C12.62.48.0 – 17.20.00013.42.48.6 – 18.10.000
∆Pre_v/100 mm4.21.51.2 – 7.00.006−6.11.5−9.0 – −3.20.000
∆Tmax_r/°C−4.61.7−7.9 – −1.20.008–9.72.0−13.7 – −5.70.0004.51.51.6 – 7.40.002
ΔTmin_r/°C−4.51.6−7.5 – −1.40.005
∆Pre_r/100 mm −3.21.0−5.4 – −1.40.001
VIF1.731.151.04
a Coefficients. b Standard error of each coefficient. c Confidence interval of each coefficient. d Variance inflation factor.
Table 3. Yield change (%) induced by climate change over the period 1980–2010.
Time WindowVariableRegion IRegion IIRegion III
Whole-seasonTmax−15.4 7.6
Tmin11.8
Pre 0.4
Sum−3.70.47.6
V&R phasesTmax_v−7.2 2.3
Tmin_v22.418.2
Pre_v
Tmax_r−4.1−7.70.9
Tmin_r−0.7
Pre_r
Sum10.410.53.3
Table 4. Yield variation due to climate variability.
Time WindowVariableRegion IRegion IIRegion III
Climate AnomalyYield Variability (% per year)Climate AnomalyYield Variability (% per year)Climate AnomalyYield Variability (% per year)
Whole-seasonTmax/°C±0.6−2.3–2.0±0.6 ±0.7−1.0–1.1
Tmin/°C±0.5−0.2–0.2±0.5 ±0.6
Pre/100 mm±1.0 ±0.9−4.3–2.2±1.4
Sum −2.5–2.2 –4.3–2.2 −1.0–1.1
V&R phasesTmax_v/°C±0.7−4.2–3.7±0.7 ±0.8−3.2–3.4
Tmin_v/°C±0.6−0.1–0.1±0.6−0.5–0.6±0.6
Pre_v/100 mm±0.6−2.1–2.5±0.6−4.2–3.8±0.7
Tmax_r/°C±0.7−1.0–0.9±0.7−2.2–2. 3±0.6−2.3–2.2
Tmin_r/°C±0.6−2.3–2.4±0.7 ±0.7
Pre_r/100 mm±0.7 ±0.6−3.7–2.7±1.1
Sum −9.8–9.6 −10.5–9.4 −5.5–5.6
Table 5. Climatic condition averaged over the period 1980–2010.
Time WindowClimate VariableRegion IRegion IIRegion III
whole-seasonTmax (°C)24.725.022.8
Tmin (°C)13.814.611.4
Tmean (°C)19.119.416.8
Pre (mm)501766572
V&R phasesTmax_v (°C)23.723.821.8
Tmin_v (°C)12.412.89.7
Tmean_v (°C)18.018.015.5
Pre_v (mm)264376310
Tmax_r (°C)26.127.024.5
Tmin_r (°C)15.917.314.0
Tmean_r (°C)20.721.618.8
Pre_r (mm)237390262
mean temperature.
Table 6. Comparison with previous studies in NEC.
Study PeriodMethodsTime WindowSpatial ResolutionClimatic VariableClimate Change during Maize Growing SeasonImpacts on Maize YieldReference
1965–2008LRMonthly3 provincesTave, Tmax, Tmin, PreTave, Tmax, Tmin increased significantly.
No significant changes in Pre were found.
1°C increase in Tmin in May or in September could lead to an increment of 303 kg ha−1 or 284 kg ha−1 in yield.[10]
1980–2009MLRWhole-season36 refecturesTmax, Tmin, PreDid not report1°C increase in Tmin could lead to a 10.0% increase in yield, but 1°C increase in Tmax could reduce yield by 13.4%.
1961–2010MLRPre-F and Post-F phases44 stationsTmin, Pre, Rad, AridityTmin showed significant increase. Pre-F Rad decreased. No significant changes in other climatic factors were detected.1°C increase in Tmin during pre-flowering phase could lead to an increase of 204 kg ha−1 in yield.[11]
1980–2010SMLRWhole-season190 counties; divided into three regionsTmax, Tmin, Pre66% and 89% of the counties showed significant increase in Tmax and Tmin.
25% of the counties showed significant increase in Pre.
1°C increase in Tmin could lead to a yield change of +9.1% in region I. 1°C increase in Tmax could lead to yield changes of −16.7% in region I but +11.5% in region III.
A 1.3% reduction in maize yield was estimated across NEC.
This study
1980–2010SMLRV&R phases190 counties; divided into three regionsTmax_v, Tmax_r, Tmin_v, Tmin_r, Pre_v, Pre_r96% and 22% of the counties showed significant increase in Tmin_v and Tmin_r.
41% and 51% of the counties showed significant increase in Tmax_v and Tmax_r.
5% and 39% of the counties showed significant increase in Pre_v and Pre_r.
1°C increase in Tmin_v could lead to yield changes of +12.6% in region I and +13.4% in region II. 1°C increase in Tmax_v could induce yield changes of −11.2% in region I and +7.0% in region III. 1°C increase in Tmax_r could lead to yield changes of −4.6% in region I and −9.7% in region II but +4.5% in region III.
A 9.1% increase in maize yield was estimated across NEC.
This study
Abbreviation. LR: linear regression; MLR: multiple linear regression; SMLR: stepwise multiple linear regression; Pre-F: pre-flowering; Post-F: post-flowering; Tave: mean temperature; Tmax: maximum temperature; Tmax_v and Tmax_r: maximum temperature in vegetative and reproductive phases; Tmin: minimum temperature; Tmin_v and Tmin_r: minimum temperature in vegetative and reproductive phases; Rad- solar radiation; Pre: precipitation.

