Article

Investigating Sustainable Practices in Hotel Industry-from Employees’ Perspective: Evidence from a Mediterranean Island

Faculty of Tourism, Eastern Mediterranean University, 99450 Famagusta, Turkey
*
Author to whom correspondence should be addressed.
Sustainability 2019, 11(23), 6556; https://doi.org/10.3390/su11236556
Submission received: 26 September 2019 / Revised: 12 November 2019 / Accepted: 13 November 2019 / Published: 20 November 2019
(This article belongs to the Section Social Ecology and Sustainability)

Abstract

:
Although several studies have researched the hotel employees’ environmental behavior, none has addressed the hotel employees’ perception of their respective hotels’ sustainability practices. This study aims to investigate the sustainable practices in four and five star hotels in a Mediterranean island by employing Global Sustainable Tourism Council (GSTC) hotel criteria indicators, indicators of sustainable development for tourism destinations (WTO), and the European Union’s (EU) sustainability framework for the Mediterranean hotels—“Nearly Zero-Energy Hotels” (NEZEH), and global sustainable development goals (SDG) in the context of three dimensions: social, economic and environment. The sampled hotels claim that their operation system is conformed to sustainability principles with the aim of furthering their green agenda. In this study, we aim to investigate the validity and extent of this claim. About 290 (N = 290) employees in the specified hotels were surveyed. The measurement instruments were compiled based on sustainability indicators that encompassed addressing social, economic, and environmental dimensions. The research questions contextualized around four main themes: effective sustainability planning, maximizing social and economic benefits for the local community, enhancing cultural heritage, and reducing negative environmental impacts. For the statistical and data analysis, SEM (structural equation modeling) is used. Study revealed that employees are a legitimate and credible source of information about sustainability practices. It is also revealed that as going green is becoming a means toward branding, hotels are making efforts to implement a genuine sustainability practice. Study also indicated that the majority of employees validated the sustainability practices as genuine.

1. Introduction

Tourism is among the growing industries with tremendous environmental impact [1]. This subsequently shifts the concern toward tourism and its impact on an international scale. As the movement of sustainable development and environmental issues becoming textbook reality, destinations gearing toward formulating new policies to harmonize tourism and environment through sustainable practices, which has also become a global mantra [2]. Nowadays, most industries and businesses tend to consider sustainability and green practices in their operations; the tourism sector is not an exception.
Multiple organizations of tourism have also embarked upon various environmental policies to upgrade and harmonize their equipment and facilities to certain target markets who are demanding green practices and products [3]. In this context, corporate social responsibility (CSR) is an example of and commitment to environmentalism and social responsibilities around the world [4]. The tourism sector, as a global phenomenon, has also realized its role regarding sustainability as it makes use of the resources and generates measurable environmental impacts [1]. The tourism’s impact on environment and its contribution to global carbon footprint is a foregone conclusion [5,6].
Kyrenia (Girne in Turkish), is a major city in north Cyprus that captures the highest share of number of tourists and bed nights (71%), as well as, highest share of number of hotels (64%) [7]. In the meantime, north Cyprus’s economy is highly dependent on tourism [8] and at the consolidated stage of tourism area life cycle [9]. According to Butler [10]’s tourism area life cycle model (TALC), destinations, especially coastal resorts (e.g., Kyrenia), evolve through several stages. The stage of “consolidation,” which Kyrenia is experiencing [11], characterized as a stage whereby tourism is a major economic sector; heavy advertising; some opposition to tourism because of over-crowded and high-density of tourism destination; product deterioration and abandonment of facilities [10]. However, to reconcile the sustainability and growth, a new reality needs to be recognized, which is changing nature and behavior of tourists who are keen to consume green product and expect environmentally principled processes of production and consumption, and/or, they have pro-social attitude and green consumption values [12].
While consumers are demanding green services and green products, tourism accommodation sector has been a vanguard in responding to green consumers’ demand. Green hotel concept in the context of sustainable tourism has gained recognition as a business strategy, as well as, gaining a competitive edge in the global tourism market [13]. Studies revealed that “one of the most important reasons for going green is the customer, often touted as the central stakeholder in driving hotels to be environmentally friendly; indeed, a growing consumer base exists who are attracted by the ecological appeal of lodging facilities” [14]. Nevertheless, consumers’ demand has played a significant role in mediating hotels’ green practices. Fatma et al. [15] (p. 40) noted that “increased awareness among consumers toward social and environmental issues led to a demand that tourism companies protect the cultural heritage and places visited by tourists.” Furthermore, green hotels/ sustainable hotels are affected by green consumers’ demand for practices that are in line with sustainability [16,17,18].
Tourism destinations that are highly dependent on tourism have to face extra challenges in an uncertain environmental prospect such as climate change [19]. The case of north Cyprus is among many Mediterranean destinations whose recent economic growth is structured upon tourism sector. It is also a known reality that they are experiencing environmental degradation and uncertainty about sustainable future, especially in the coastal areas—location of many up-market/luxury hotels [20].
The main objective of this study is to investigate the sustainability practices of the accommodation sector on the environmental, social, and economic dimensions as an indication toward sustainability. It is assumed that environmental practices in hotels—as a sub-sector of tourism system—can be a formula to achieve the principles of sustainable development. The assumption is that when hotels’ operating system is embarking upon implementation of sustainability principles, it gains the recognition as “green hotels” with marketing as well as competitiveness implications in the long-run [21].
Managers of tourism industry, especially in accommodation sector are facing a rapidly growing environmental concern nationally and internationally. Accommodation sector in particular needs to adapt themselves and adopt new strategies as well as utilizing new methods and trends. It was estimated that the amount of total waste generated by hotels during the lean season amounted to 2010.5 kg/day in north Cyprus, in which the share of large hotels was (66.7%), followed by medium size hotels (19.4%), and guesthouses (2.6%) [22]. Therefore, this study adheres to tackling the issue of sustainability which resonates with statement that: “The United Nations Sustainable Development Goals of the 2030 Agenda for Sustainable Development indicate the need to rethink the current economic growth ideology in the context of social and environmental needs in development” [2] (p. 3). The question is to what extent the accommodation sector is in line with such agenda.
Even though “sustainability is widely accepted as a ’good business’ mega-trend in contemporary tourism and hospitality industry” [23] (p. 15), the acceptability of this attitude do not necessarily translate into sustainable practice. There are ample evidences of “greenwashing” as a sector-wide exercise [24,25,26]. Nevertheless, as Weaver, Davidson, Lawton, Patiar, Reid, and Johnston [23] stated “growing recognition and adoption of sustainability practices and corporate social responsibility charters amongst hotels internationally is nudging the sustainability paradigm” (p. 15). In the meantime, “despite the almost universal support for sustainability and participation in at least some related initiatives, empirical data that comprehensively describes and organizes these practices are lacking in the tourism and hospitality literature” [23]. This still resonates with the United Nations’ 2030 Sustainable Development Goals (SDGs) [27], which is an outcry for sustainable practice. Such practice is “commonly regarded as the care of the environment, society, and the production of economic benefits” [27] (p. 787). At the end, this study is a logical effort to push the SDG’s agendas forward, especially in less developed economies; whereas, “the literature is dominated by examples of hotels’ responsible and sustainable practices in the developed world” [27] (p. 787).
Furthermore, this study will add an insight into the literature, as well as, a contribution to enriching an awareness for managers. The study is also aiming to contribute to the literature which is limited in terms of receiving attention on this topic because of contradictory findings in regard to consumers’ green decision and hotels’ green practice [28,29].

2. Conceptualization

The following questions construct the conceptual logic that guides this research:
  • What is the extent of hotel managers’ commitment to sustainable practices?
  • What are the indications of hotels’ initiatives toward sustainable practices?
  • What is the nature of hotels’ sustainable strategy; and how these strategies are realized?
  • What are the methodologies that hotels apply to measure their progress toward achieving sustainable practice?
The main argument revolves around the concept of sustainability and its social, economic, and environmental agendas elaborated by WCED [30]; Weaver, Davidson, Lawton, Patiar, Reid, and Johnston [23]; and Harris and Goodwin [31].
The concept of sustainable practice includes social responsibility of the hotels toward the local community that they are embedded, economic fairness toward employees and contribution to the economic welfare of the local people, and measurable practices toward environmental protection and quality (i.e., triple bottom line) [32]. In the meantime, it is believed that the sustainable practices of hotels should be embedded in the overall supply side of tourism system where visitor’s expectation is fulfilled when they experience a mosaic of attractions with social, economic, and environmental connotations that affects their cognitive and affective perceptions [33,34]. Nevertheless, hotels that embark upon green marketing are aware of the changing market and changing tourist’s profile and values [35]. Theory of basic human value [36] contends that a measurable segment of the consumers possesses biospheric value and they are concerned with the benefits of nature and biosphere with willingness to contribute to the welfare of natural world [37].
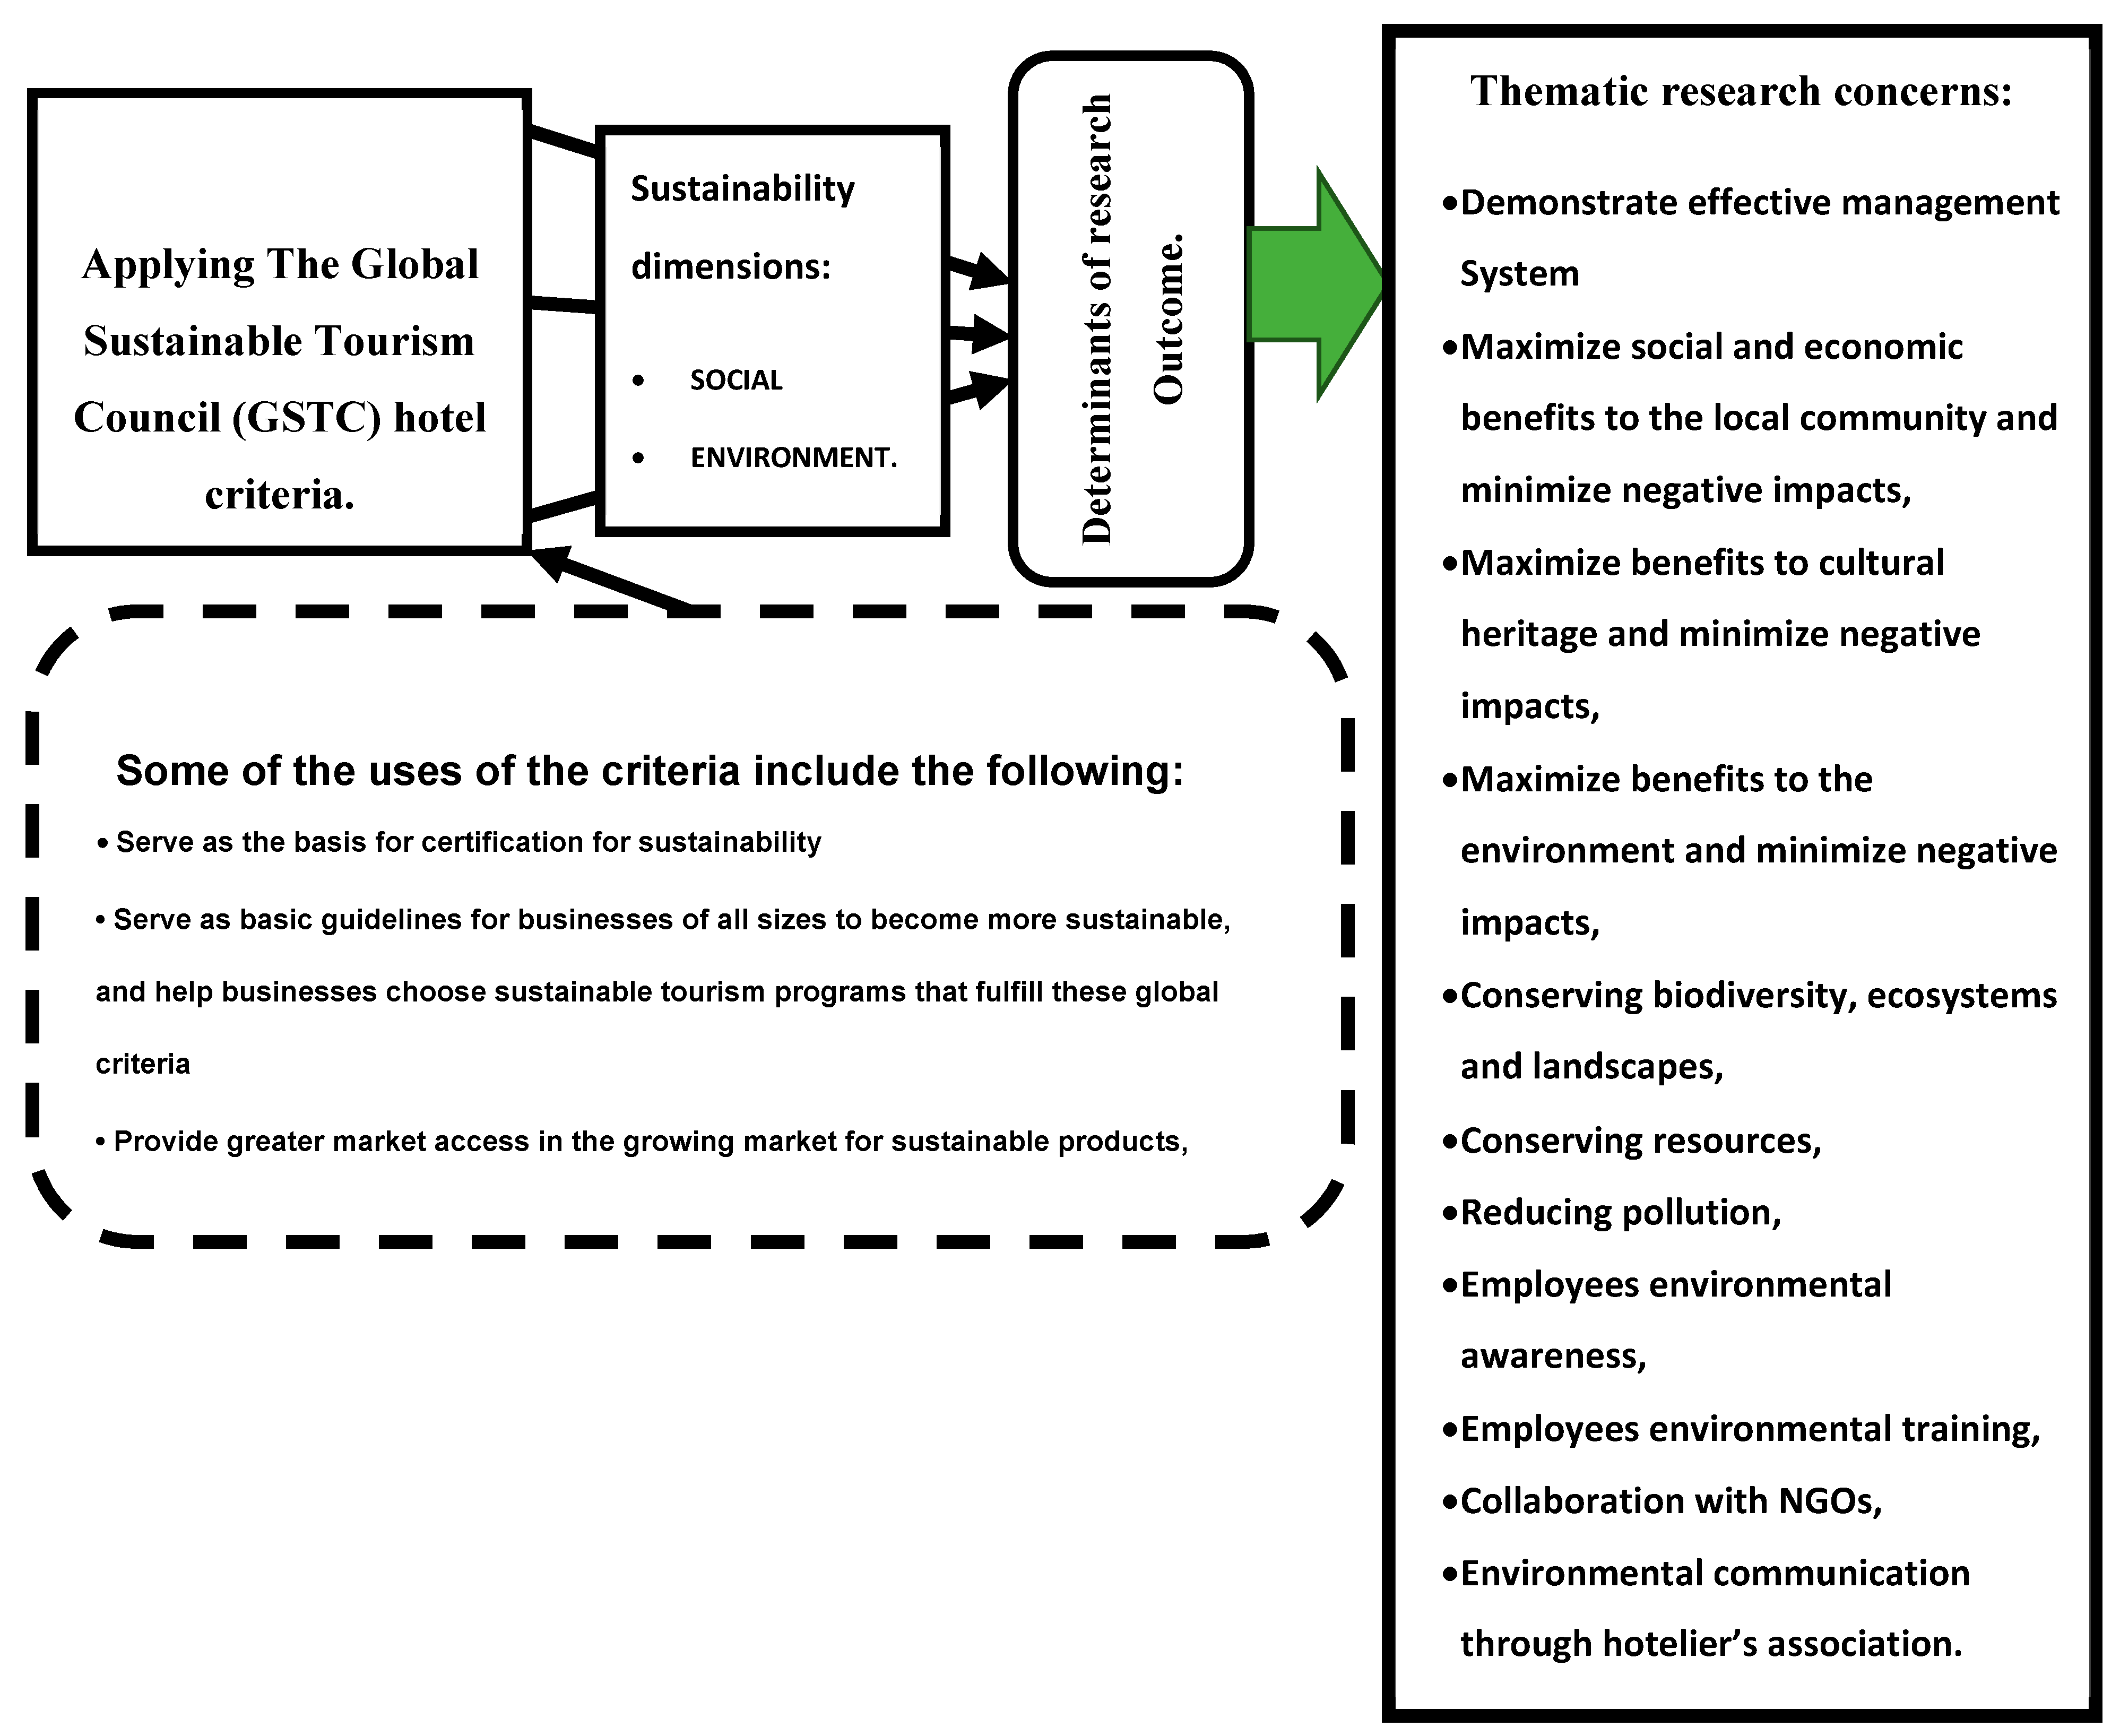
Based on the Global Sustainable Tourism Criteria [38], and sustainable development perspective [30], a framework has been structured to guide the study (see Figure 1). The accommodation sector is a business entity with constant marketing challenges in the global tourism market. However, their green practices cannot be isolated from their marketing strategies [39,
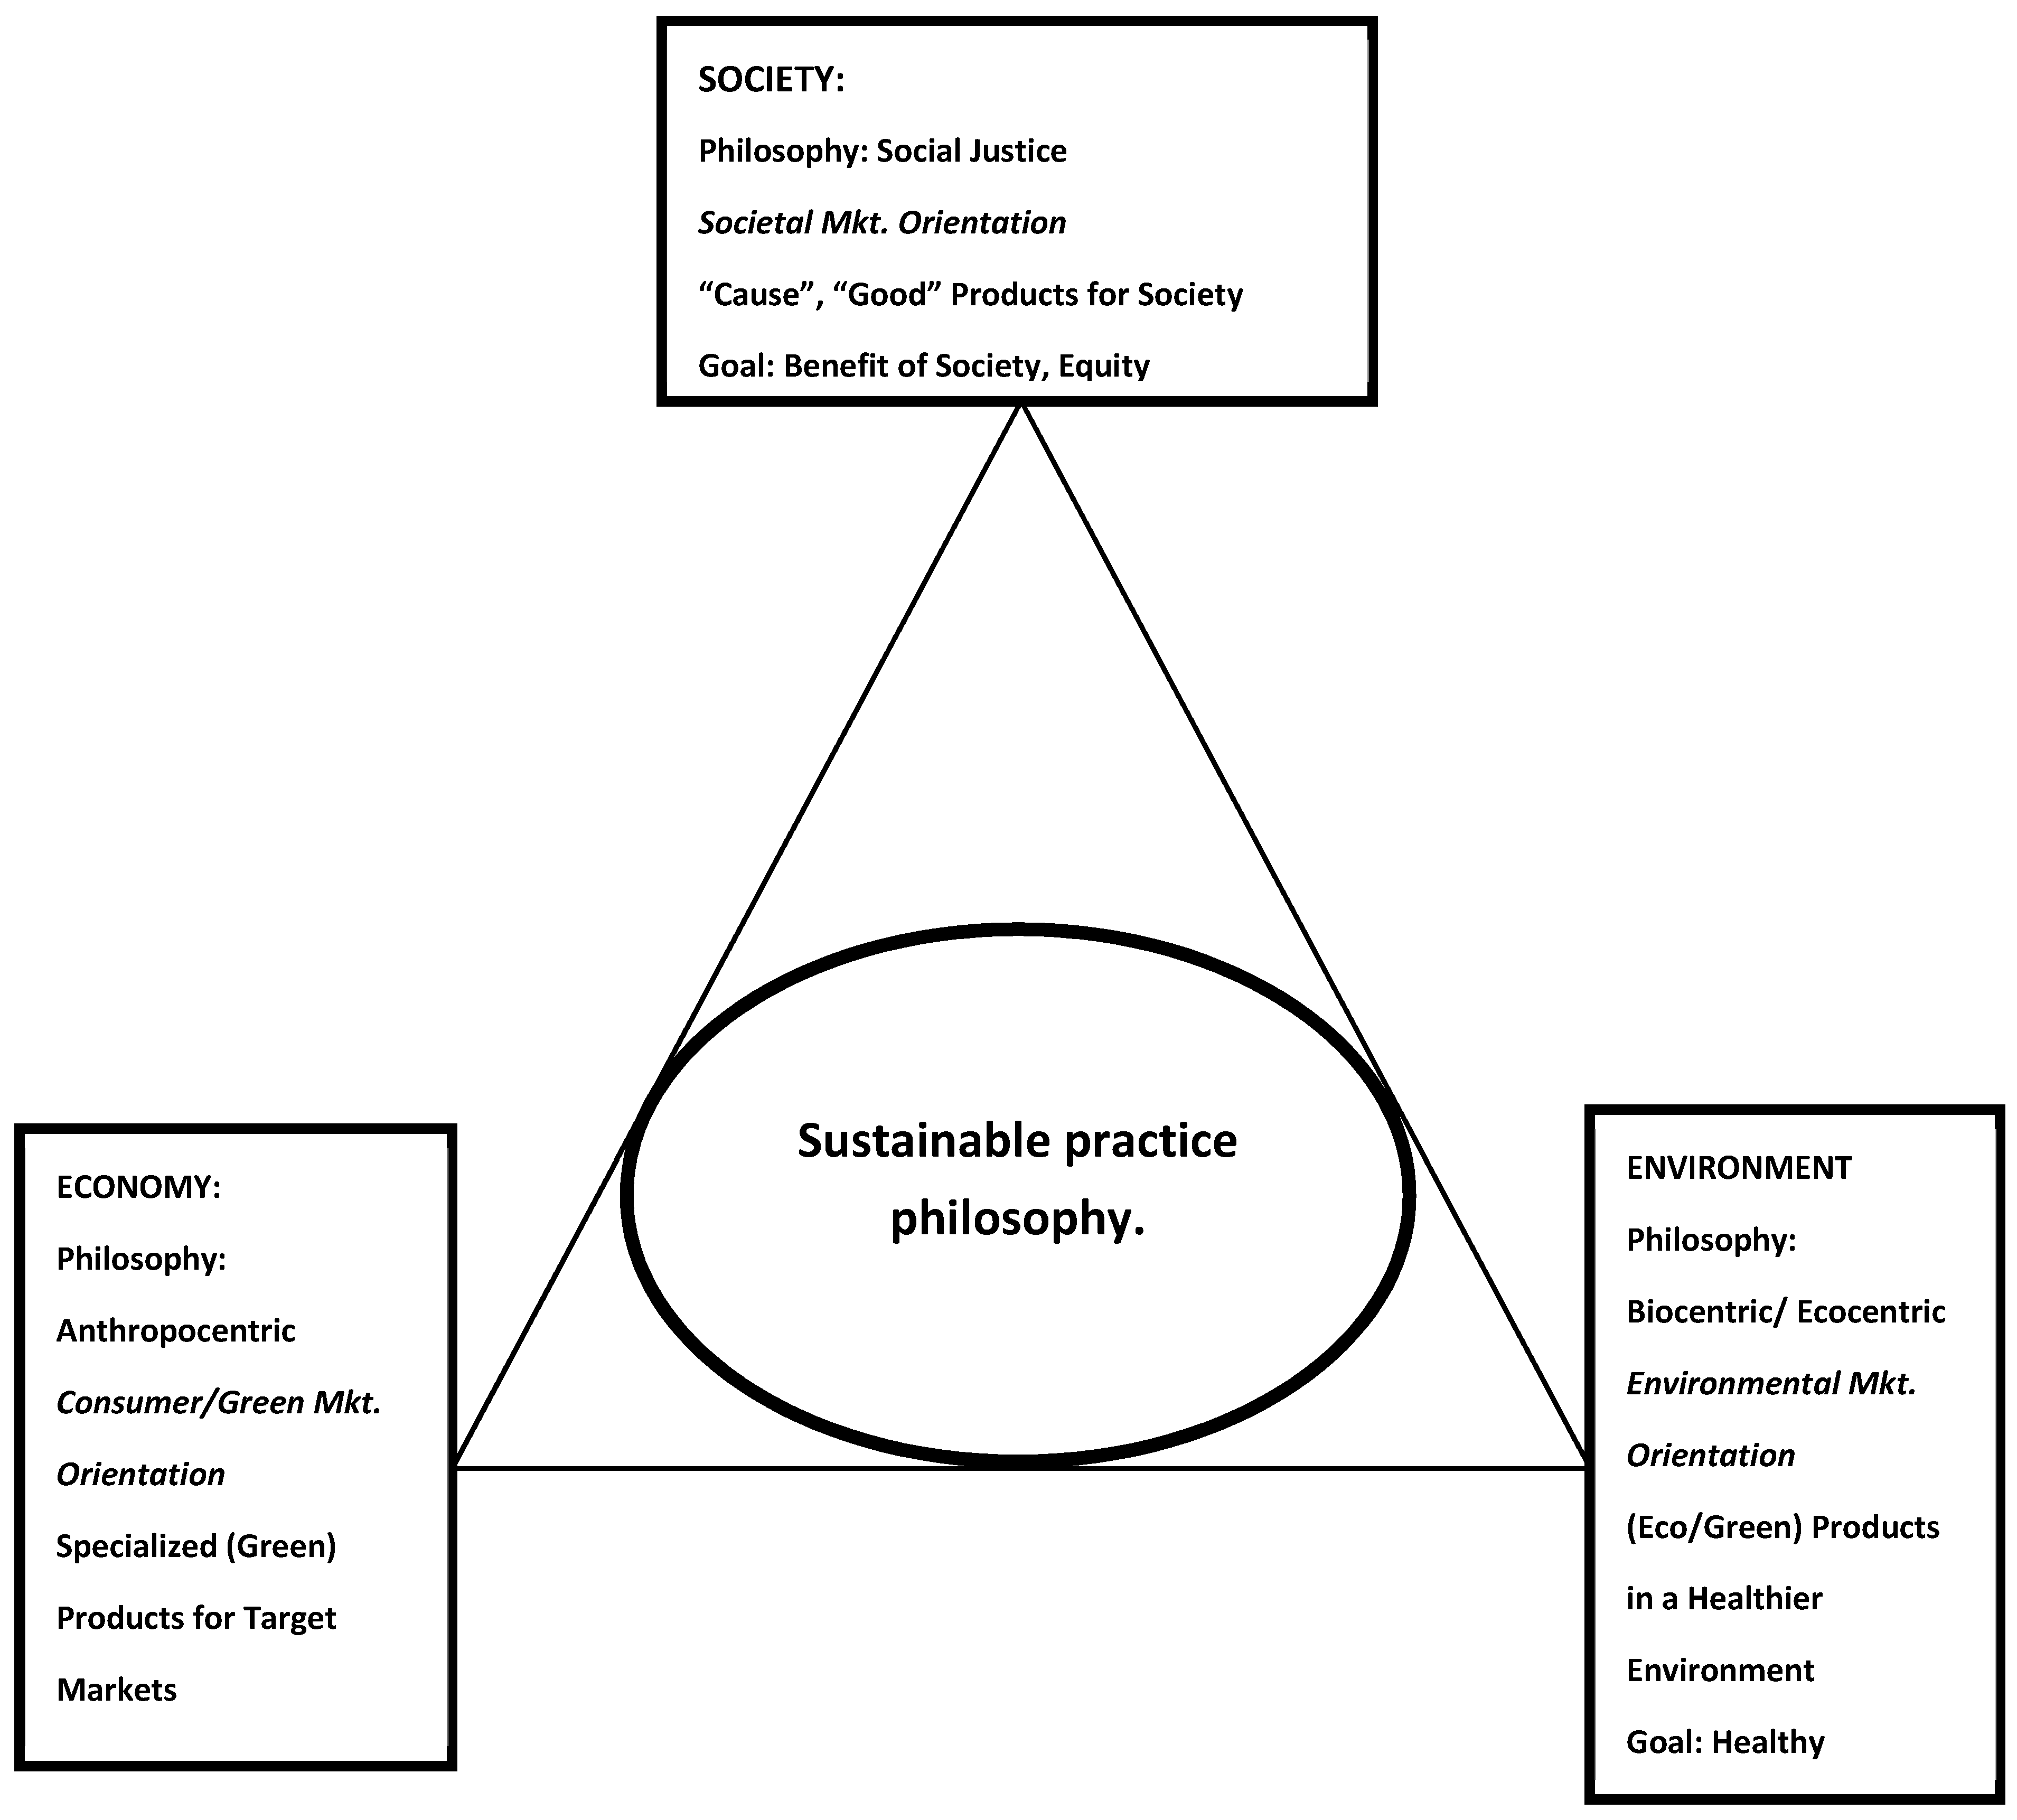
40]. Thus, the philosophical ethos of their sustainable practice should revolve around the triple bottom line (TBL) goals. In this regard Jamrozy [41] (p. 124) noted: “while many product development implications have already been discussed in sustainable tourism management, unique marketing missions such as the facilitation of synergies between a network of agents and the communication of triple bottom benefits of sustainable tourism experiences need to be addressed” (see also Figure 2). In the meantime, this is the first comprehensive research on hotel’s sustainability practices based on employees’ perspectives in the major destination in north Cyprus.
This study has also adhered to the European Union’s (EU) sustainability framework for the Mediterranean hotels which is manifested in its project called “Nearly Zero-Energy Hotels” (NEZEH); whereby “the aim is to reinforce businesses operating in the hospitality sector to meet the challenges of competitiveness, reduction of energy consumption, and adoption of green energy technologies, providing technical support and advice to selected hotels in order to develop sustainable and feasible large scale renovations toward Near Zero Energy consumption levels” [42] (p. 230). Such undertaking is rationalized as the hospitality industry is responsible for 2% of the world’s CO2 emissions can play a crucial role contributing to the 2020 and even more ambitious for 2050 energy targets in the Member States. This study is tantamount to EU’s NEZEH agenda.

3. Literature Review

The number of environmentally conscious tourists is rapidly growing, they demand green products during their travel, and they are willing to pay for it [43,44,45,46]. The belief and tendency among green consumers including tourists is that the companies and other related firms should have a sustainable approach and maintain a high level of environmentally friendly activities. This tendency toward sustainable and green practices have led travelers to prefer hotels whose sustainable practices are visible and genuine [47,48,49]. “Studies conducted by the International Hotels Environment Initiative (IHEI) reveal that 90% of the hotel guests prefer to stay in a hotel that cares for the environment” [43] (p. 214).
Nevertheless, the environmental behavior of the consumers in the one hand and marketing forces in the other hand has forced the tourism industry, with accommodation sector as a vanguard, to reconcile the conventionally conflictive relationships between economic interests and environmental quality. In macroeconomic context, Harris and Goodwin [31] stated that “the picture of environmental limits that we have sketched implies a much more critical view of increasing consumption; growth in consumption is not necessarily undesirable, but needs to be weighed against its negative effects on resources and environmental services” (p. 15).
However, the idea of sustainable practice in general and particularly in tourism emanates from a worldwide challenge that addresses social, economic, and environmental justice. In the context of sustainable practices in any organization and processes of production and consumption, Schlosberg [50] (p. 38), believes the new trends “extend a conception of environmental justice into a new realm—where environment and nature are understood to create the conditions for social justice.”
The tourism sector at the global level has become one of the major contributors to global environmental challenge with socio-economic ramifications. The recognition of sustainable tourism as a sub-discipline of sustainable development is an acknowledgment of problems associated with mass tourism [1,9,51]. Finally, the misperception about tourism as “smokeless industry” shifted the trajectory of tourism development. As elaborated by Tang, et al. [52] (p. 390), “the tourism industry is no longer regarded as a ‘smokeless’ industry accompanying the improvement of environmental consciousness. Tourism often involves travel and accommodations, which rely on fossil fuels for the transportation of tourists to and from as well as within destinations and for hosting tourists.”
To ensure the long-term existence and sustainability in the hospitality industry, there are several challenges that hotels—as a formidable sub-sector—need to overcome. First, they need to balance between economic interest and sustainability. Second, they have to overcome the challenge of climate change as they are highly vulnerable to this challenge [53]. In this context, the implementation of environmental, social, and economic practices within the sustainability framework “has become crucial into tourism facilities operations management” [54] (p. 471). Such a practice is known as “green practice,” which is defined as “a value-added business strategy that benefits hospitality operations that engages in environmental protection initiatives” [55] (p. 226).
Nevertheless, sustainable practice in tourism in general and particularly in accommodation/hotel sector has become a major part of policy spectrum worldwide. Such an indispensable policy resonates with two narratives. First, “many hotels acknowledge that adopting eco-friendly practices is not only an ethical practice but also beneficial in reducing costs, image enhancement, creating market differentiation, and corporate social responsibility” [43] (p. 212). Second, the ubiquitous acceptance of principled sustainability, especially in tourism, which “accounts for resource-based (e.g., impacts on natural and cultural capital), activity-based (e.g., growth and development of industry), and community-based (e.g., involvement of social capital in a local context) traditions” [56] (p. 919). Nevertheless, sustainable practice in hotels transcends the normative and cosmetic environmental gestures (i.e., labeled as “greenwash”) [57], because most of the five star hotels, especially in the Mediterranean destinations, are located in the coastal areas with socio-ecological implications not just locally, but also regionally and globally [58].

3.1. Green Consumers/Tourists

Green consumerism has its roots in demand for organic food that goes back to post world war II. During this time, as reported by Sparks and Shepherd [59] (p. 391):
“The use of synthetic nitrogen has increased six-fold and the production of pesticides has increased approximately twenty times. This development has been accompanied not only by increased agricultural production but also by a growing concern about associated health and environmental problems (e.g., nitrate in the water supply, pesticide toxicity, and pesticide resistance).”
“Green consumers are conventionally defined as consumers who engage in consumer practices that are viewed as environmentally friendly” [60] (p. 127). To reduce environmental impact, consumers involve in various forms of practices including: “reducing consumption; using public transportation; recycling; buying products with less packaging; buying second-hand goods; eating less meat; buying locally grown food; organic food; fair-trade items and other products that have a reduced environmental impact” [60].
Such attitude toward healthy food and environmentalism have been explained in the context of theory of planned behavior (TPB) [61], and theory of reasoned action (TRA) [62]. It was suggested that such behavior, which translated to a trend, had broader aim of concern for environment by the consumers and explained by differences between certain consumers’ political and technological attitudes. These theories have been highly useful in explaining and understanding the psychological and cognitive behaviors of consumer decision-making and their willingness to purchase green products and support green practices [12,28].
Nevertheless, there has been a growing concern for sustainability and green products among the consumers worldwide and the concern has also been growing among the tourists to demand green services and practices in the hospitality industry [36,63,64,65]. Travelers have also played an important role in the flourishment of alternative tourism that has sprung up in the global tourism arena in the forms of eco-village, eco-lodge, farm tourism, agri-tourism, and nature-based tourism, just to name a few [66,67]. In a global survey by Booking.com and TripAdvisor.com, which carried out in 2016, indicated an encouraging data for sustainable tourism. Accordingly, 68 percent of tourists prefer to book an eco-friendly accommodation, transportation, and meals.
It is important to point out that “customer satisfaction is critical for hotels’ business survival” and several theories have dealt with the construct of “satisfaction,” for instance, expectancy disconfirmation theory, equity theory, attribution theory, and motivation-hygiene theory [68]. In the meantime, constructs of tourists’ eco-friendly intentions, green marketing strategies, green image’s impact, etc., have captured the attention of the researchers and contextualized within the green hotel trends. The impact of green practices on customer demand for green product and their satisfaction have also attracted the curiosity of the marketers and scholars [68,69,70]. “In addition, in the hospitality industry, researchers found that customers that have a great awareness of problems regarding the environment prefer to make eco-friendly purchases” (as cited in [71] (p. 3404)).
Hotels are keen to uphold the intention of the tourists to revisit their facilities. This is due to a paradigm shift toward sustainability in marketing tourism [41], due to pro-environmental behavior of the so-called green tourists, who are responsible travelers that conserve natural environment [72], and they have become a segment in the tourism market [46]. Nonetheless, green tourists are capturing a measurable segment of the market that hotels cannot ignore. By definition they “behave in an environmentally friendly manner when on vacation in a wide range of tourism contexts” [46] (p. 320).
Nevertheless, those consumers, “exemplifying a greener lifestyle, are crucial to companies and to other consumers as they serve as examples (buying fair trade, recycling, saving energy, etcetera) contributing to the sustainability of the planet” [12] (p. 1001). In the meantime, the green lifestyle is a reaction to and sympathy with the environmental challenges (pollution, global warming, overpopulation, natural resource depletion, waste disposal, climate change, loss of biodiversity, and ocean acidification) that humanity faces.
Our assertion is that employees are not in a position to force hotels to go green; however, the consumers/tourists/guests (i.e., these terms have been used interchangeably in tourism literature as they consume tourism product) [73,74,75,76,77] (just to name a few), can force the hotels to go green, otherwise they will not patronize those hotels that are not practicing sustainability [45,55,78].

3.2. Green Hotels and Sustainable Practice

The tourism accommodation sector in general, hotels in particular, are challenged by changing market internationally and domestically. The supply and demand dimensions of tourism is highly dynamic as the host community and travelers have divergent and sometimes converging concerns about the nature of processes of production and consumption [79]. This is highly relevant to the hotels’ environmentally friendly services, green supply chain, and overall sustainable practices. Robin et al. [80] (p. 1415) stated that “these practices not only serve to lure certain types of clients who seek an explicit commitment to the natural environment but also provide hotels with a source of competitive advantage that allows for cost reductions and improves their image.”
The Global Sustainable Tourism Council (GSTC) in alliance with International Social and Environmental Accreditation and Labeling Alliance (ISEAL) are organized around four themes for hotels’ sustainable practices: “effective sustainability planning, maximizing social and economic benefits for the local community, enhancing cultural heritage, and reducing negative impacts to the environment” [38] (p. 1). Similar to manufacturing firms, green adoption in hotels that provide services is increasingly accepted as indispensable to generating long-term profitable services that positively reflect on the firms’ environmental and social responsibilities [81]. Furthermore, Saura et al. [82] explored that hotels’ environmental practices should expand beyond the physical location of the hotel, rather they should extend to the surrounding environment “including the pure air in the facilities and surroundings, the absence of noise, and the abundance of nature and plants, in the hotel ecosystem” (p. 14). They asserted that travelers’ positive sentiments regarding these indicators should translate to the hotel managers’ commitment to respect the sustainability of natural areas, as well as the use of local products and experiences.
In the meantime, the hotel industry has been identified as the most polluting sector within the hospitality industry. According to the American Hotel and Lodging Association, “in 2012, the USA hotels spent $8.2 billion on energy, created 7 million tons of waste, consumed 64 trillion gallons of water, and generated 23 million tons of CO2” [68] (p. 1341).
According to some studies [70,83], it is believed that because of the nature of hotels’ functions, they consume great amount of energy and water along with production of substantial quantity of waste material. It is estimated that “the hotel industry generates about 45.0% of all municipal solid wastes among municipal commercial sector facilities” [84] (p. 59). Researchers agree that the proper waste reduction management in hotel leads to not only environmental protection but also economic benefits. The environmental impact of hotels is more visible in the coastal areas where the “Sun, Sea and Sand” (3S) model tourism is dominant (e.g., Mediterranean region) [20,85].
At the same time, economic benefits of the hotels are interlinked to the green consumer’s demand for environmentally friendly services. To satisfy the consumers, hotels are obliged to focus on building their image as “green hotel” in line with sustainable practice. In a “survey conducted by TripAdvisor, it was revealed that about 62.0% of travelers are concerned about the environmental issue when deciding to stay at a hotel [81]; nearly 87.0% of guests are aware of the importance of eco-friendly hotel, about 80.0% of guests consider themselves as eco-conscious customers, and about 30.0% of them are willing to pay more for environmentally responsible hotels” [84] (p. 58).
Nonetheless, tourism industry in general and hotel sector in particular have realized the benefits of going green. This so-called “green revolution” [86] has come about because of the forces of supply and demand within the global tourism system. Kang, Stein, Heo, and Lee [86] (p. 565) stated that:
“People throughout the world seek to alter the current path of rapid environmental degradation. The hotel industry is not exempt from and has certainly participated in the growing trend. Over the past several years, the world’s leading hotel brands have increased their efforts to respond to environmental issues and invested significantly in going green.”
In an international survey conducted by TripAdvisor (2013), results revealed “more than 30,000 travelers indicate that 79 per cent of the travelers place importance on properties implementing green practices” [68] (p. 1341). Furthermore, as tourism has become a global phenomenon, hotels have also become aware of global response to environmental challenges. Thus, “in response to serious environmental concerns, the hotel industry is emphasizing energy conservation, environmental protection, and sustainable development by reducing waste, recycling materials, and reusing resources. As hotels are highly vulnerable to external factors and pressures in a global operating environment, many hotels are trying to adopt low-carbon energy technologies or green management to address environmental demand” [87] (p. 1).

4. Study Site

For the purpose of this study, the historical/coastal city of Kyrenia (also called Girne) was considered as a case study site. Kyrenia is also the major tourist city in north Cyprus. This case study was considered appropriate because it involves comprehensive and context analyses with a view to identify issues and generate insights. The city is home to the highest number of four and five star hotels, casinos, restaurants, and residential tourism [34,88] (See also Figure 3). It is also home to several universities with large number of international students (Edu-tourists). Kyrenia is also a coastal city with sun, sea, and sand tourism attractions. “According to the land-use survey, the vast majorities of the buildings (45%) are for touristic use, and mixed used buildings and hotels (47%) [89] (p. 1495,1498).
Around 64 percent of the tourist accommodations in north Cyprus is located in Kyrenia that accounts for over 59 percent bed nights [90]. Kyrenia also received 42 percent of tourist arrivals in north Cyprus in the year t [90]. Compare to other regions in north Cyprus, Kyrenia is experiencing “over-tourism.” Over- tourism has been associated with “anti-tourism movements, tourismphobia, and pollution” [91]. Kyrenia’s hotels attracted our attention because “as a large sector of the tourism industry, the hotel industry is resource-intensive and thus has a great impact on the natural environment. “The hotel industry has been suggested to be the most harmful to the environment among all hospitality sectors” [68]. Therefore, hotels have decisive role in upholding the principles of sustainability and its implementation. With the highest number of four- and five-star hotels and their associated casinos, Kyrenia has suffered from pollution, loss of green space, loss of open space, seawater pollution, and absence of an adequate sewage infrastructure. “The underground water resources are under extra pressure from the sewage produced by large hotels as their sewage treatment plants do not operate efficiently” [89] (p. 1496). On this ground, this study intends to put to test the hotel’s sustainable practices.

5. Methodology

5.1. Data Collection

As the main objective of this research is to investigate the sustainable practices in four- and five-star hotels in a Mediterranean island, a descriptive research design was deemed the most proper quantitative method to answer the research questions. The survey questionnaire designed for this study consists of a set of demographic questions (i.e., age, gender, duration of stay, and educational level). A 5-item Likert scale is designed to measure each indicator (1—strongly agree, 2—agree, 3—neutral, 4—disagree, 5—strongly disagree). This enables the researcher to transform each indicator on a reflective form to represent the variables/measures of the study. Data collection spanned almost two months (June–July 2018). Out of 290 survey questionnaires, three items were incomplete; therefore, around 287 items were useable for analysis. Out of twelve four- and five-star hotels, eight hotels were accessible. In total, four “4 star” and four “5 star” hotels were accessed. These hotels facilitated the survey on condition not to reveal their names. Therefore, they are given anonymous names (e.g., A, B, C…etc.). The survey instrument was originally prepared in English and then translated into Turkish based on the back-translation method [92]. The resulting instrument was tested with a pilot sample of 20 employees regarding the understandability of the scale items. Thus, no changes were made in the survey instrument, as there was not any difficulty in understanding the items.
The design of survey questionnaire (S/Q) started with linking the research aim (hotels’ sustainable practice on social, economic, and environmental dimensions—three pillars of sustainability), and each question in the context of relevancy to the issues that surrounded the research. To develop such link, a table of specifications with a two-dimensional matrix was developed. One dimension contained the domain of the research goal (i.e., sustainability practice on social, economic or environment), and the second dimension exhibited the respondents’ attitude/belief representative of those domains. Through a pilot study [93], we made sure that each S/Q was clearly understood by the respondents. Finally, the S/Q were structured into groups (i.e., three parts) whereby items relevant to each group were organized accordingly. The source of the S/Q was achieved by exploring the extant literature [54,94,95,96], just to name a few. Furthermore, the R/Q were enriched by the criteria established by global sustainable tourism council (GSTC) [97] (i.e., hotels’ sustainable performance indicators), indicators of sustainable development for tourism destinations [98], the European Union’s (EU) sustainability framework for the Mediterranean hotels—“Nearly Zero-Energy Hotels” (NEZEH) [42], and global Sustainable Development Goals (SDG) [99]. These sources are highly relevant to the aim of the study. Target population is justified as the “employees” are the legitimate reservoir of information about the organizational practices/behaviors [100,101,102]. Finally, each R/Q was examined to make sure that it generates a response that reveals the sustainability practice on each dimension. For instance, if the issue in question is social (i.e., hotels’ sustainability practice in terms of “social” aspect); the design of the question should solicit the level of hotel’s involvement in contribution to community’s cultural heritage.
In light of the information received from the hotels’ managers, the total number of employees working in these hotels was 1635. In order to collect data from employees, the researchers were able to receive permission from the hotels’ managers. At the outset of the research, hotels’ employees were given an assurance of anonymity and confidentiality [103], and it was explained that there were no right or wrong answers to the questionnaire items. Respondents were requested to self-administer the questionnaires. The number of respondents from each hotel was specified as proportional to the number of staffs in these hotels.

5.2. Sampling Method and Measurement

As the aim of this study was to examine hotel employees’ perception of sustainable practices of their respective working organization, the study population comprised of employees from various departments of the hotels. Consequently, 300 questionnaires were distributed to the employees; however, a total of 290 items were returned, in which 287 were valid responses. Therefore, the return rate was 95.67%.
The drop-off/pick-up method for employees’ survey research was applied that consisted of delivering questionnaires to the managers for distribution among the employees within the study hotels. For the purpose of this study convenience sampling method was undertaken which “is a type of nonprobability/ nonrandom sampling where members of the target population that meet certain practical criteria, such as easy accessibility, geographical proximity, availability at a given time, or the willingness to participate are included for the purpose of the study” [104] (p. 2). This is also commensurate with similar studies (e.g., [105,106]).
The measurement instruments compiled based on sustainability indicators including: Global Sustainable Tourism Council (GSTC) [97], hotel criteria indicators, indicators of sustainable development for tourism destinations [98], and the European Union’s (EU) sustainability framework for the Mediterranean hotels—“Nearly Zero-Energy Hotels” (NEZEH) [42], as well as extant literature (e.g., [18,101,107]). These studies have addressed sustainability practices on social, economic, and environmental dimensions. The social dimension (SUS_SOC) was measured using six (6) items; the environment dimension (SUS_ENV) was measured using eight (8) items; and the economic dimension (SUS_ECON) was measured using eight (6) items. Responses to the items were elicited on a five-point scale ranging from 1 (Strongly Agree) to 5 (Strongly Disagree). For the list of items’ description, see Table 2. Balcı [108] has developed an attitude scale based on the average of the Likert scale questionnaire as follows: 1–1.79 strongly agree; 1.80–2.59 agree; 2.60–3.39 undecided; 3.40–4.19 disagree; and 4.20–5 strongly disagree. By referring to Balcı [108], we demonstrate the extent of sustainability practices based on employees’ perception.
Several studies have addressed the relationship between sample size and the model fit indices and elaborated that for a maximum likelihood estimation (MLE), which is used in this study as an estimation procedure, a sample size of 200 to 400 is adequate [83,109,110,111]. The sample size is not only important for the statistical analysis, but also is the critical determinant for evaluating the reliability of the existing model. Although there is no standard rule for sample size, it is suggested that in SEM a minimum of five respondents per estimated parameter can be acceptable [112], however, a ratio of 10 is more appropriate [113].

5.3. Data Analysis

Data analysis method of this study employed structural equation modeling (SEM) to test the conceptual model. The structural equation modeling (SEM) as a statistical methodology is applied to explain and measure the unobserved (latent) variables in order to assess the conceptual model’s consistency with observed variables and collected data [114,115]. In the meantime, for the purpose of statistical and data analysis via SEM the AMOS software package version 24.0 was utilized. In addition, the data preparation and screening was conducted prior to SEM [116]. One should bear in mind that the missing data as a part of data preparation and screening is a critical issue when SEM is utilized [117]. Otherwise, missing data can result in bias as well as distortion of statistical test, which is necessary for estimation of parameters [113,118,119]. As the aim of this study is to confirm that the constructs of the proposed model (sustainability) load into the underlying sub-constructs (social, economic, and environment), the second-order confirmatory factor analysis (CFA) is employed in this study [113,120,121,122]. The validity of the instrument is also measured by testing the content validity and convergent validity [123]. The content validity is referred to the adequacy and comprehensibility of the instrument that is supposed to measure. The construct validity is the extent to which a scale adequately measures a certain variable, which is sub-categorized into convergent and discriminant validity. In the meantime, the content validity in this research was measured through the expert judgment and literature review [124,125]. The convergent validity, which is applied in this study, determines to what extent the scale items of the construct can be loaded in the model, which can be also appraised through the item-to-total correlation (ITC) [126].
The reliability of the constructs has been measured through the Cronbach’s alpha coefficient, composite reliability, and average variance extracted (AVE). Moreover, the R square (R2) values in AMOS, which is labelled as squared multiple correlations, are also used for further verification of the reliability [109]. This approach evaluates the representativeness level of the measurement model from the observed indicators [116,121]. In order to measure the overall model fit of the model, three types of indices were utilized consisting of parsimonious fit measure (PFM), absolute fit measure (AFM), and incremental fit measure (IFM) measures [111,113,122,127]. This is because in SEM the model fit refers to the extent to which the proposed model adequately fits the observed data [128]. As different estimation methods are different in terms of their functions for minimizing the discrepancy based on their distributional assumptions, obtaining the permissible values of the parameters is a common acceptable approach [129]. Therefore, since there are no exact guidelines and consensus about a “good fit,” estimating the different fit indices at the same time is the suitable procedure [130].

6. Results

6.1. Respondents’ Profile

The demographic profile of this study consists of age, gender, level of education, duration of employment. The result of descriptive analysis for the demographic variables shows that the majority of the respondents were mature adults aged 31–40 (48.1%). Education level of the employees comprised of a 4-year university degree (50.2%), 2-year College degree (28.9%), post-graduate degrees (11.8%), and the rest were holder of high school diploma (9.1%). The majority of the employees’ duration of work were 3–5 years (43. 2%). Overall, the employees’ gender profile was equal which comprised of females (48.4%) and males (51.6%). See also Table 1.

6.2. Descriptive Statistics of the Questions

Table 2 sets out the general perception of the respondents regarding the sustainability practices of the hotels where they are employed. The frequency and percentage of respondents’ perception regarding each item of the questionnaire is shown in Table 3. The result based on the mean scores shows that the majority of respondents either agree or are neutral. Based on the result of Table 3, 53.2% of the respondents agree or strongly agree, however, only 15% of the respondents were disagree or strongly disagree.
As exhibited in Table 3, employees’ responses on sustainability practices in relation to social, environmental, and economic dimensions in average for social is 2.54, for environmental is 2.50, and for economic is 2.58, which implies that employees “agreement” and validation of hotels sustainability practice. According to Balcı [108], it is shown that the attitude scale of the variables was “agree” that indicates the proposed sustainability practices are implemented in these hotels as it is perceived by their employees. For instance, on the social dimension (i.e., Staff are informed and trained about the natural and cultural heritage of the local area), response value of agreement registered is 2.45 (mean). In regard to environmental dimension (i.e., Native and endemic plants obtained from sustainable sources have been used in landscaping and decoration, avoiding exotic and invasive species), response value of agreement registered is 2.34 (mean). On economic dimension (i.e., Water saving equipment are regularly maintained and are efficient), the response value of agreement registered is 2.47 (mean).
While the overall analysis of employees’ perceptions about their hotel’s sustainability behavior indicated an agreement with the hotels’ sustainability practices; one-way ANOVA test and the post hoc test of Tukey HSD became necessary in order to explore the differences in variables between their subgroups as well as other demographic variables.
The result of one-way ANOVA test in Appendix A, Table A1 shows there is significant difference between the duration of employment of respondents as indicated by means of variables (i.e., SUS5_SOC, SUS6_SOC, and SUS6_ENV). In addition, Appendix A, Table A2 demonstrates the difference between groups of variables with significant and different means. The result of post hoc test of Tukey HSD (Appendix A, Table A2) shows that there is a significant difference for SUS5_SOC variable when comparing employment for a duration of 1–3 years, and for duration of more than 5 years. So that, the mean of employees with duration of more than 5 years is significantly lower than those with 1–3 years of employment. For instance, employees with more than 5 years of employment responded, “agree” to the item: “hotels seek to bring innovative green products and services to their establishments;” whereas, this was not the case for employees with less than 5 years of working duration.
The result for SUS6_SOC and SUS6_ENV variables is also significantly different for employment with duration of 1–3 years and 3–5 years. So that, the mean of duration of employment with 3–5 years is significantly lower than those with 1–3 years of employment. For instance, employees with 3–5 years employment duration responded “agree” to the items: “Hotel companies often use eco-labels on packaging, and show them on their corporate websites;” and “total direct and indirect greenhouse gas emissions are monitored and managed” in compare to the employees with the employment duration of 1–3 years.
This indicates that employees with higher duration of employment tend to express a positive view about the sustainability practices of their respective hotel. However, employees’ views toward the reset of the variables does not show significant difference in relation to their employment duration.
The result of one-way ANOVA test in Appendix A, Table A3 shows there is significant difference in employees’ views in relation to their level of education. This can be observed in Appendix A, Table A3 for the following variables (SUS1_ENV, SUS4_ENV, SUS5_ENV, and SUS6_ENV). Appendix A, Table A4 demonstrates the difference between groups of variables with significant and different means. The result of post hoc test of Tukey HSD (Appendix A, Table A4) shows that there is a significant difference for SUS4_ENV variable when comparing employees’ level of education. So that, the mean for employees with a “4-year” university education is significantly lower than those without a “4-year” university education. This indicates that employees with at least “4 years” of higher education have more knowledge and awareness of their organization’s green behavior.
The results for SUS5_ENV and SUS6_ENV variables are also significantly different for employees with different level of education. However, for SUS1_ENV variable there is no significant difference between groups in relation to the level of education. For instance, employees with university education (i.e., 4-year), expressed their disagreement with the following items: “Hotels seek to bring innovative green products and services to market;” and “hotel companies often use eco-labels on packaging, and show them on their corporate websites” compared to the employees with high-school level of education.
Therefore, results indicate that level of education of employees provides them with deeper understanding and observation of their organizations green practices, have different believes about the sustainability practices of the hotel which they work for regardless of the subject toward which they agree or remain neutral. However, this factor did not show significant difference toward the reset of variables in relation to the level of education.
The result of one-way ANOVA test in Appendix A, Table A5 shows there is significant difference in relation to the age of respondents as indicated by means of the following variables (i.e., SUS2_SOC, SUS3_SOC, SUS5_SOC, SUS6_SOC; SUS2_ECON, and SUS4_ECON).
The result of post hoc test of Tukey HSD (Appendix A, Table A6) shows that there is a significant difference for SUS2_SOC, SUS5_SOC, SUS6_SOC, SUS2_ECON, and SUS4_ECON variables when comparing employee’s age. As shown in Appendix A, Table A6, the result is different for age groups of 21–30 years and above 40 years. So that, the mean of the age of employees (21–30 years) or (31–40 years) are significantly lower than those who are above 40 years of age. For instance, employees with 40 years of age and above, expressed an agreement with the following items: (i)“Staff are informed and trained about the natural and cultural heritage of the local area;” (ii)“hotels seek to bring innovative green products and services to market; (iii)“hotel companies often use eco-labels on packaging, and show them on their corporate websites”; (iv)“energy used per tourist/night for each type of energy is monitored and managed”; and (v) “equipment and facilities for air quality are monitored and maintained”. Whereas, this was not the case compared to the younger employees. This indicates that older employees have more positive believe about the sustainability practices of the hotel which they work for. However, employees’ attitude toward the reset of variables does not have significant difference regarding their age.

6.3. Reliability Analysis

Table 4 shows Cronbach’s alpha coefficient results for latent variables from data analysis for internal consistency. The Cronbach alpha generally should be above 0.7; however, 0.6 is also acceptable [113]. In order to increase the Cronbach alpha, one approach is to delete the items based on item-to-total correlation (ITC), which can be above 0.2 to indicate the good discrimination [131].

6.4. SEM Analysis

As demonstrated in Table 5, all the indicators settle down on their located latent factors. They are significant with the t-value of greater than 3.30 at 0.001 level, which indicates the evidence for convergent validity [110]. The standardized loading for the first order constructs range between 0.818 and 0.974, and the R square (R2) values range from 0.670 to 0.949 and above 0.50, which demonstrate that reliability of the model is highly acceptable [109,132].
Furthermore, the results revealed that the composite reliability (CR) and average variance extracted (AVE) values of the second-order construct (overall model) are 0.924 and 0.803, respectively. These values exceeded the recommendation values of 0.70 for CR [133], and 0.5 for AVE [134], respectively. The CR and AVE were apprised to evaluate when three determined first-order constructs could demonstrate the second-order construct adequately. Accordingly, the first-order constructs consist of social, environment, and economics are significantly related to the second-order construct- sustainability.

6.5. Goodness-of-Fit Statistics for Overall Model

The results of goodness-of-fit statistics (Table 6) suggested that the overall model obtained a good fit with three first-order constructs to the observed data. The estimated value of standardized root mean square residual (SRMR) is 0.07 and less than 0.08, which shows a good fit [135]. One should bear in mind that if the value of root mean square error of approximation (RMSEA) is less than 0.05, it demonstrates a good fit; but if it is between 0.05 and 0.08, it can be considered as an adequate (acceptable) fit. Whereas, the value between 0.08 and 0.10, represents a mediocre fit. However, if it is greater than 0.10 the model is not considered fit [136]. The estimated RMSEA value is 0.076, which can be considered as an acceptable fit.
The adjusted goodness-of-fit index (AGFI) value of greater than 0.90 is considered to be a good fit [137,138,139], however, the value of greater than 0.80 is also can be acceptable [111,135,140]. The estimated AGFI value is 0.840, which demonstrates a good fit. The common rules for the value of Tucker Lewis index (TLI) [141] and comparative fit index (CFI) [142] is to be greater than 0.90 in order to show a good fit. However, according to Hu and Bentler [135], when the combination of estimation of CFI or TLI is less than 0.96 and for SRMR greater than 0.6 and the sample size is more than 250 and less than 500, then it can be concluded that the model is a good fit. Accordingly, the combination of the estimated values for TLI, CFI, and SRMR show a good fit for the overall model. The chi-square measure regarded as an absolute fit and its estimated ratio (CMIN/DF) of 2.642 indicates that the model is a good fit [113,143]. Since other indices like goodness of fit index (GFI) [100,144], Hoelter index [111], and normed fit index (NFI) [144,145] are not recommended to use, they are not reported in the table. To sum up, the goodness-of-fit indices and other estimated parameters revealed that the overall model including first- and second-order as well as observed indicators fit the data fairly well.

7. Discussion and Conclusions

This research contributes to the literature by presenting the employee perspective as an assessment and measurement of the sustainability practices framework in the context of social, environmental, and economic dimensions. The rationale for understating the employees’ perception of sustainability practices in accommodation sector is based on their organic embeddedness in their respective organization. [146], claimed that employees should be “treated as the main asset of the organization” (p. 709). Second, “evidence suggests that employees are centrally important in deploying CSR strategies, but it is equally true that the success of strategy implementation is a function of employee perception” [100].
Nowadays, various national and international institutions are pressing organizations to embark upon and involve in sustainable practices, which has become the most hot and frequently debated subject [147]. The outcome of sustainability discourse is abounded; however, sustainability management as a framework has gained significance because it melds social, economic, and environmental imperatives. Based on sustainability management framework, hotels (in our case), expected to formulate, implement, and evaluate environmental and socioeconomic sustainability-related decisions and actions [148]. The role of employees and their perceptions in achieving sustainability goals is explained by stakeholder theory, which considers employees as “the inner stakeholders.” Employees as stakeholders are also legitimate sources of information regarding the CSR activity in the organizations. As Sharma and Tewari [100] (p. 114) noted, there is a “framework explaining the manner in which the performance of an organization, society, and environment is affected as a result of the attitude and behavior stimulated in the employees due to change in their perception toward CSR.”
The main objective of this study was to investigate the sustainability practices of the accommodation sector based on employees’ perspective in order to explore the extent and validity of those practices that is usually claimed by this sector. In another words, we assume that employees’ perspective of sustainability practices can open a new window to understand whether the sustainability behaviors of the hotels are substantive or symbolic (i.e., genuine vs. greenwashing).
Nowadays, “the number of organizations putting the issue of sustainability on strategic agenda has been growing in the past few years. Although sustainable development gains more importance, discussion on measures of sustainability is continuing” [146] (p. 708). The study has been an attempt to investigate and contextualize the sustainability practices in three social, economic, and environmental dimensions. To achieve this, indicators from Global Sustainable Tourism Council (GSTC) [38], UN Sustainable Development Goal (SDG) [99], WTO [98], the European Union’s (EU) sustainability framework for the Mediterranean hotels—"Nearly Zero-Energy Hotels” (NEZEH) [42], provided integrated sustainability measurement frameworks.
Most of the studies have researched employees’ perspectives in one-dimensional context; studies to engage in observing this in three dimensions of sustainability is rarely done. This study will try to bridge this gap. As emerged from this study, there is no difference in perception regarding the sustainability practices based on gender. While the respondents were almost equally male and female, there was no statistically significant difference between genders in relation to sustainability dimensions. Findings revealed that majority of employees agreed that hotels are practicing sustainably, especially, in the areas of economics and environment. However, around one-third of employees were neutral in their responses to sustainability practices in their hotels. Interestingly, when the age is factored in, older employees with longer duration of employment in the same hotel expressed an agreement with sustainability practices of their hotels. In the meantime, the “star” of hotels did not make any difference and did not play a role in the responses and results. Nevertheless, the results of this study are in line with the findings of M. Wiernik et al. [149], and Sharma and Tewari [100], whose studies are a validation of employees as stakeholders and the source of awareness/knowledge about organizations’ sustainability practices. Result also showed that employees with higher education have better understandings of sustainability practices. In our study, we can conclude that managers are strongly committed to sustainability practices. This is also in line with the trend that green practices are beneficial for hotels as they want to develop a brand, as well as tap on the green customers market [74,80,150].
As the aim of this study is to confirm that the constructs of the proposed model (sustainability) load into the underlying sub-constructs (social, economic, and environment), the second-order confirmatory factor analysis (CFA) results show that the overall model including first- and second-order as well as observed indicators fit the data fairly well. This confirmed the hotels’ claim that their operation is involved in sustainability practices and are determined to follow the green agenda. Therefore, understanding employees’ perception is a relevant and legitimate source to investigate organizations’ sustainable practices knowing the fact that employees are an organic part of the organizational structure, as well as its main asset.
Findings of this study is echoing previous studies that going green and practicing sustainability by hotel sector has come about because of green-conscious customers who are willing to pay higher prices for green products/services [76]. In the case of north Cyprus, the situation is strongly influenced by international demand, especially European clients who are frequent visitors. “In this respect, one way to increase the quality of tourist product is to include sustainability measures to attract new markets” [80] (p. 1416). This study is also in consonant with findings of studies by Robin, Pedroche, and Astorga [80], and Wu, Thongma, Leelapattana, and Huang [95], who revealed that sustainability practices in hotels has become a management tool to achieve quality performance and efficiency.
The analysis revealed that the sampled hotel’s sustainability practices transpired on three dimensions—social, environmental, and economic. Such findings emanated based on employee’s perception of hotel’s green behavior, “given that employees carry the main burden of responsibility for implementing ethical corporate behavior and are often the face of the organization’s CSR program [151] (p. 268), knowing that “CSR programs rooted in sustainable development” [152] (p. 85).
Nowadays going green and practicing sustainability has become a significant part of hotels’ strategy in terms of marketing, brand development, competitiveness, and cost cutting associated with waste disposal and material usage [153]. This aspect of hotel’s sustainability practice is a business-oriented approach. Coupled with the business behavior of going green is the CSR aspect, which is rooted in sustainability and incorporated in the hotels’ strategy. The CSR aspect is engendered by global environmental movement that has become “the driving factors for hotel operators to become competitive in minimizing and eliminating their operation [externalities] on the environment” (as cited in [153], p. 226). Furthermore, “environmentally friendly hotel,” an “eco-friendly hotel,” or a “sustainable hotel” has become a buzzword within the global tourism system. For instance, “the Ritz-Carlton, Kuala Lumpur, joined the annual global environmental awareness event created by the World Wildlife Fund to highlight the threat of climate change” [150] (p. 3). Our study revealed that hotels in north Cyprus are not in isolation from the global movements and demands.
Regarding the first research question, managers’ commitment to sustainability is rationalized and understandable from business point of view and in the context of CSR as discussed earlier. The second research question verified through employee’s positive validation of sustainability practices on social, environmental, and economic dimensions. Study revealed that hotels have strategized sustainability; however, a precise measurement of realization of each aspect of the strategy can be quantified as a topic for future research. In terms of methodologies that hotels apply to measure their progress toward achieving sustainable practice; again, this item can be observed through for example the application of solar system or landscape area; however, the precise weight and volume requires a mathematical analysis as a pathway for future research.

8. Research Contributions and Future Studies

Overall, the research contributes to new insights for understanding the concept of sustainability and how it is practiced, as well as the extent of those practices in accommodation sector. First, the research deepens understanding of the sustainability practices from the perspective of the employees. Second, this study transcends the role of employees in sustainability practices or their awareness of sustainability. This study assumed that employees are the legitimate assets of the accommodation sector and have legitimacy to judge on how their organizations are behaving regarding sustainability principles. Employees have the knowledge to issue a verdict on hotels sustainability practice whether is genuine or greenwash. Furthermore, the research provides hotels with a legitimate reference to rethink their sustainability practices, and be aware that greenwashing cannot camouflage their behavior for long. This study might be a benchmark for sustainability practice assessment by the hotels to reevaluate their behavior and overcome their lacking in the tourism market. Even though this study explored certain findings in this case, future research can investigate why employees are a legitimate source of and organic reservoir in the accommodation sector when it comes to revealing the sustainability practices.

9. Limitations

There are certain limitations that need consideration. Data was collected from 4- and 5-star hotels; other accommodation sectors should be investigated and compared. Although the findings of this study provide some insights into the accommodation sector in one city, it can be expanded to other locations as well. Future studies can also increase the sample size, especially in cases where tourism is a dominant activity.

Author Contributions

Conceptualization and literature review, H.A. and A.S.; survey execution, A.S.; methodology and analysis, F.S. and H.A.; review and editing, H.A.

Funding

This research received no external funding.

Conflicts of Interest

The authors declare no conflict of interest.

Appendix A

Table A1. Comparing means of all the variables and duration of employment.
Sum of SquaresdfMean SquareFSig.
SUS1_SOCBetween Groups0.16830.0560.0670.977
Within Groups237.4902830.839
SUS2_SOCBetween Groups2.26430.7550.9580.413
Within Groups222.8512830.787
SUS3_SOCBetween Groups2.52730.8420.9400.422
Within Groups253.5082830.896
SUS4_SOCBetween Groups4.04631.3491.5370.205
Within Groups248.2472830.877
SUS5_SOCBetween Groups10.52633.5093.3440.020 *
Within Groups296.9582831.049
SUS6_SOCBetween Groups8.59632.8652.9730.032 *
Within Groups272.7702830.964
SUS1_ENVBetween Groups0.76530.2550.3590.783
Within Groups200.7892830.710
SUS2_ENVBetween Groups0.43830.1460.2010.896
Within Groups205.2902830.725
SUS3_ENVBetween Groups1.22230.4070.6300.596
Within Groups182.9942830.647
SUS4_ENVBetween Groups0.64330.2140.2240.880
Within Groups271.1972830.958
SUS5_ENVBetween Groups1.63730.5460.7460.525
Within Groups206.9482830.731
SUS6_ENVBetween Groups8.56632.8552.9010.035 *
Within Groups278.5492830.984
SUS7_ENVBetween Groups0.93530.3120.3090.819
Within Groups285.4902831.009
SUS8_ENVBetween Groups1.26330.4210.5060.679
Within Groups235.5382830.832
SUS1_ECONBetween Groups2.52030.8401.0780.359
Within Groups220.4972830.779
SUS2_ECONBetween Groups1.75930.5860.5490.650
Within Groups302.4712831.069
SUS3_ECONBetween Groups2.34530.7820.9020.440
Within Groups245.2092830.866
SUS4_ECONBetween Groups0.79530.2650.2990.826
Within Groups250.9052830.887
SUS5_ECONBetween Groups0.30130.1000.0840.969
Within Groups339.6362831.200
SUS6_ECONBetween Groups0.98130.3270.3720.773
Within Groups248.6222830.879
*. The mean difference is significant at the p ≤ 0.05 level.; Note: df (Degree of freedom); F (F test); Sig. (Significance).
Table A2. Tukey HSD post hoc test for duration of employment and other significant variables.
Dependent VariableMean DifferenceStd. ErrorSig.90% Confidence Interval
Lower BoundUpper Bound
SUS5_SOCless than a year1–3 years−0.2830.2720.727−0.910.34
3–5 years0.0390.2580.999−0.560.63
more than 5 years0.2570.2680.773−0.360.87
1–3 yearsless than a year0.2830.2720.727−0.340.91
3–5 years0.3210.1560.169−0.040.68
more than 5 years0.5400.1710.009 ***0.150.93
3–5 yearsless than a year−0.0390.2580.999−0.630.56
1–3 years−0.3210.1560.169−0.680.04
more than 5 years0.2180.1470.451−0.120.56
more than 5 yearsless than a year−0.2570.2680.773−0.870.36
1–3 years−0.5400.1710.009 ***−0.93−0.15
3–5 years−0.2180.1470.451−0.560.12
SUS6_SOCless than a year1–3 years−0.2930.2610.676−0.890.31
3–5 years0.1280.2480.955−0.440.70
more than 5 years0.1130.2560.972−0.480.70
1–3 yearsless than a year0.2930.2610.676−0.310.89
3–5 years0.4210.1500.027 **0.080.77
more than 5 years0.4050.1640.0660.030.78
3–5 yearsless than a year−0.1280.2480.955−0.700.44
1–3 years−0.4210.1500.027 **−0.77−0.08
more than 5 years−0.0160.1411.000−0.340.31
more than 5 yearsless than a year−0.1130.2560.972−0.700.48
1–3 years−0.4050.1640.066−0.78-0.03
3–5 years0.0160.1411.000−0.310.34
SUS6_ENVless than a year1–3 years−0.0610.2640.996−0.670.55
3–5 years−0.4490.2500.278−1.020.13
more than 5 years−0.1980.2590.870−0.790.40
1–3 yearsless than a year0.0610.2640.996−0.550.67
3–5 years−0.3880.1510.052 *−0.74−0.04
more than 5 years−0.1380.1650.839−0.520.24
3–5 yearsless than a year0.4490.2500.278−0.131.02
1–3 years0.3880.1510.052 *0.040.74
more than 5 years0.2510.1430.298−0.080.58
more than 5 yearsless than a year0.1980.2590.870−0.400.79
1–3 years0.1380.1650.839−0.240.52
3–5 years−0.2510.1430.298−0.580.08
*. The mean difference is significant at the p ≤ 0.1 level; **. The mean difference is significant at the p ≤ 0.05 level; ***. The mean difference is significant at the p ≤ 0.01 level. Note: Std.Error (Standard error); Sig. (Significance).
Table A3. Comparing means of all the variables and level of education.
Sum of SquaresdfMean SquareFSig.
SUS1_SOCBetween Groups4.09131.3641.6520.178
Within Groups233.5682830.825
SUS2_SOCBetween Groups1.37630.4590.5800.629
Within Groups223.7392830.791
SUS3_SOCBetween Groups4.06431.3551.5210.209
Within Groups251.9712830.890
SUS4_SOCBetween Groups1.52830.5090.5750.632
Within Groups250.7652830.886
SUS5_SOCBetween Groups2.70830.9030.8380.474
Within Groups304.7762831.077
SUS6_SOCBetween Groups4.40331.4681.5000.215
Within Groups276.9632830.979
SUS1_ENVBetween Groups4.45631.4852.1330.096 *
Within Groups197.0982830.696
SUS2_ENVBetween Groups0.93530.3120.4300.731
Within Groups204.7942830.724
SUS3_ENVBetween Groups1.63930.5460.8470.469
Within Groups182.5772830.645
SUS4_ENVBetween Groups8.39832.7993.0070.031 **
Within Groups263.4422830.931
SUS5_ENVBetween Groups5.71831.9062.6590.049 **
Within Groups202.8672830.717
SUS6_ENVBetween Groups7.15032.3832.4090.067 *
Within Groups279.9652830.989
SUS7_ENVBetween Groups4.90631.6351.6440.179
Within Groups281.5192830.995
SUS8_ENVBetween Groups0.38030.1270.1520.929
Within Groups236.4212830.835
SUS1_ECONBetween Groups2.20930.7360.9440.420
Within Groups220.8082830.780
SUS2_ECONBetween Groups3.30331.1011.0350.377
Within Groups300.9272831.063
SUS3_ECONBetween Groups4.29631.4321.6660.175
Within Groups243.2582830.860
SUS4_ECONBetween Groups1.83930.6130.6940.556
Within Groups249.8612830.883
SUS5_ECONBetween Groups5.11831.7061.4420.231
Within Groups334.8202831.183
SUS6_ECONBetween Groups0.09130.0300.0340.991
Within Groups249.5122830.882
*. The mean difference is significant at the p ≤ 0.1 level; **. The mean difference is significant at the p ≤ 0.05 level. Note: df (Degree of freedom); F (F test); Sig. (Significance).
Table A4. Tukey HSD post hoc test for education level of employee and other significant variables.
Dependent VariableMean DifferenceStd. ErrorSig.90% Confidence Interval
Lower BoundUpper Bound
SUS4_ENVhigh schoolcollege−0.2640.2170.616−0.760.24
4-year university0.1220.2060.934−0.350.60
M.Sc. or PhD0.1150.2510.968−0.460.69
collegehigh school0.2640.2170.616−0.240.76
4-year university0.3860.1330.020 **0.080.69
M.Sc. or PhD0.3800.1960.217−0.070.83
4-year universityhigh school−0.1220.2060.934−0.600.35
college−0.3860.1330.020 **−0.69-0.08
M.Sc. or PhD−0.0070.1841.000−0.430.42
M.Sc. or PhDhigh school−0.1150.2510.968−0.690.46
college−0.3800.1960.217−0.830.07
4-year university0.0070.1841.000−0.420.43
SUS5_ENVhigh schoolcollege−0.2270.1900.633−0.660.21
4-year university−0.4480.1800.065 *−0.86-0.03
M.Sc. or PhD−0.3140.2210.484−0.820.19
collegehigh school0.2270.1900.633−0.210.66
4-year university−0.2210.1170.233−0.490.05
M.Sc. or PhD−0.0880.1720.957−0.480.31
4-year universityhigh school0.4480.1800.065 *0.030.86
college0.2210.1170.233−0.050.49
M.Sc. or PhD0.1330.1610.843−0.240.50
M.Sc. or PhDhigh school0.3140.2210.484−0.190.82
college0.0880.1720.957−0.310.48
4-year university−0.1330.1610.843−0.500.24
SUS6_ENVhigh schoolcollege−0.4630.2240.165−0.980.05
4-year university−0.5650.2120.040 **−1.05-0.08
M.Sc. or PhD−0.5320.2590.172−1.130.06
collegehigh school0.4630.2240.165−0.050.98
4-year university−0.1020.1370.878−0.420.21
M.Sc. or PhD−0.0690.2030.987−0.530.40
4-year universityhigh school0.5650.2120.040 **0.081.05
college0.1020.1370.878−0.210.42
M.Sc. or PhD0.0330.1900.998−0.400.47
M.Sc. or PhDhigh school0.5320.2590.172−0.061.13
college0.0690.2030.987−0.400.53
4-year university−0.0330.1900.998−0.470.40
*. The mean difference is significant at the p ≤ 0.1 level; **. The mean difference is significant at the p ≤ 0.05 level. Note: Std.Error (Standard error); Sig. (Significance).
Table A5. Comparing means of all the variables and age of employee.
Sum of SquaresdfMean SquareFSig.
SUS1_SOCBetween Groups3.82531.2751.5430.204
Within Groups233.8332830.826
SUS2_SOCBetween Groups6.51432.1712.8110.040 **
Within Groups218.6012830.772
SUS3_SOCBetween Groups9.96733.3223.8210.010 **
Within Groups246.0672830.869
SUS4_SOCBetween Groups0.71530.2380.2680.848
Within Groups251.5772830.889
SUS5_SOCBetween Groups12.82434.2754.1060.007 ***
Within Groups294.6602831.041
SUS6_SOCBetween Groups12.90434.3014.5340.004 ***
Within Groups268.4622830.949
SUS1_ENVBetween Groups2.40830.8031.1400.333
Within Groups199.1462830.704
SUS2_ENVBetween Groups0.49430.1650.2270.878
Within Groups205.2342830.725
SUS3_ENVBetween Groups2.39430.7981.2420.295
Within Groups181.8222830.642
SUS4_ENVBetween Groups2.46530.8220.8630.461
Within Groups269.3752830.952
SUS5_ENVBetween Groups1.83530.6120.8370.474
Within Groups206.7502830.731
SUS6_ENVBetween Groups4.86531.6221.6260.184
Within Groups282.2502830.997
SUS7_ENVBetween Groups3.86831.2891.2910.278
Within Groups282.5572830.998
SUS8_ENVBetween Groups3.96331.3211.6060.188
Within Groups232.8382830.823
SUS1_ECONBetween Groups1.61730.5390.6890.560
Within Groups221.4012830.782
SUS2_ECONBetween Groups9.58833.1963.0700.028 **
Within Groups294.6422831.041
SUS3_ECONBetween Groups0.13830.0460.0530.984
Within Groups247.4162830.874
SUS4_ECONBetween Groups9.34333.1143.6370.013 **
Within Groups242.3572830.856
SUS5_ECONBetween Groups3.95531.3181.1100.345
Within Groups335.9822831.187
SUS6_ECONBetween Groups0.96230.3210.3650.778
Within Groups248.6412830.879
*. The mean difference is significant at the p ≤ 0.1 level; **. The mean difference is significant at the p ≤ 0.05 level; ***. The mean difference is significant at the P ≤ 0.01 level. Note: df (Degree of freedom); F (F test); Sig. (Significance).
Table A6. Tukey HSD post hoc test for age of employee and other significant variables.
Dependent VariableMean DifferenceStd. ErrorSig.90% Confidence Interval
Lower BoundUpper Bound
SUS2_SOCunder 2021–300.0300.1960.999−0.420.48
31–400.1570.1800.818−0.260.57
above 400.4540.2020.114−0.010.92
21–30under 20−0.0300.1960.999−0.480.42
31–400.1270.1320.769−0.180.43
above 400.4240.1610.044 **0.050.80
31–40under 20−0.1570.1800.818−0.570.26
21–30−0.1270.1320.769−0.430.18
above 400.2970.1410.154−0.030.62
above 40under 20−0.4540.2020.114−0.920.01
21–30−0.4240.1610.044 **−0.80−0.05
31–40−0.2970.1410.154−0.620.03
SUS3_SOCunder 2021–30−0.3980.2080.224−0.880.08
31–40−0.4230.1900.120−0.860.02
above 40−0.0070.2151.000−0.500.49
21–30under 200.3980.2080.224−0.080.88
31–40−0.0260.1400.998−0.350.30
above 400.3910.1710.1050.000.78
31–40under 200.4230.1900.120−0.020.86
21–300.0260.1400.998−0.300.35
above 400.4160.1500.029 **0.070.76
above 40under 200.0070.2151.000−0.490.50
21–30−0.3910.1710.105−0.780.00
31–40−0.4160.1500.029 **−0.76−0.07
SUS5_SOCunder 2021–30−0.1700.2270.878−0.690.35
31–400.1810.2080.822−0.300.66
above 400.4650.2350.198−0.081.01
21–30under 200.1700.2270.878−0.350.69
31–400.3500.1530.1020.000.70
above 400.6350.1870.004 ***0.201.07
31–40under 20−0.1810.2080.822−0.660.30
21–30−0.3500.1530.102−0.700.00
above 400.2840.1640.307−0.090.66
above 40under 20−0.4650.2350.198−1.010.08
21–30−0.6350.1870.004 ***−1.07−0.20
31–40−0.2840.1640.307−0.660.09
SUS6_SOCunder 2021–300.1460.2170.908−0.350.65
31–400.2620.1990.552−0.200.72
above 400.6980.2240.0110.181.21
21–30under 20−0.1460.2170.908−0.650.35
31–400.1170.1460.854−0.220.45
above 400.5520.1790.012 **0.140.96
31-40under 20−0.2620.1990.552−0.720.20
21–30−0.1170.1460.854−0.450.22
above 400.4360.1560.029 **0.080.80
above 40under 20−0.6980.2240.011 **−1.21−0.18
21–30−0.5520.1790.012 **−0.96−0.14
31–40−0.4360.1560.029 **−0.80−0.08
SUS2_ECONunder 2021–30−0.1850.2270.848−0.710.34
31–40−0.0080.2081.000−0.490.47
above 400.3720.2350.389−0.170.91
21–30under 200.1850.2270.848−0.340.71
31–400.1770.1530.652−0.170.53
above 400.5570.1870.017 **0.130.99
31–40under 200.0080.2081.000−0.470.49
21–30−0.1770.1530.652−0.530.17
above 400.3800.1640.096 *0.000.76
above 40under 20−0.3720.2350.389−0.910.17
21–30−0.5570.1870.017 **−0.99−0.13
31-40−0.3800.1640.096 *−0.760.00
SUS4_ECONunder 2021–300.2060.2060.749−0.270.68
31–40−0.0420.1890.996−0.480.39
above 400.4200.2130.201−0.070.91
21–30under 20−0.2060.2060.749−0.680.27
31-40−0.2480.1380.279−0.570.07
above 400.2140.1700.590−0.180.60
31–40under 200.0420.1890.996−0.390.48
21–300.2480.1380.279−0.070.57
above 400.4620.1490.011 **0.120.80
above 40under 20−0.4200.2130.201−0.910.07
21–30−0.2140.1700.590−0.600.18
31–40−0.4620.1490.011 **−0.80−0.12
*. The mean difference is significant at the p ≤ 0.1 level; **. The mean difference is significant at the p ≤ 0.05 level; ***. The mean difference is significant at the p ≤ 0.01 level. Note: Std.Error (Standard error); Sig. (Significance).

References

  1. Gössling, S.; Peeters, P. Assessing tourism’s global environmental impact 1900–2050. J. Sustain. Tour. 2015, 23, 639–659. [Google Scholar] [CrossRef]
  2. Saarinen, J.; Gill, A.M. Resilient Destinations and Tourism: Governance Strategies in the Transition Towards Sustainability in Tourism; Routledge: Abingdon, UK, 2018. [Google Scholar]
  3. Morrison-Saunders, A.; Hughes, M.; Pope, J.; Douglas, A.; Wessels, J.-A. Understanding visitor expectations for responsible tourism in an iconic national park: Differences between local and international visitors. J. Ecotourism 2019, 18, 1–11. [Google Scholar] [CrossRef]
  4. Cavaco, S.; Crifo, P. CSR and financial performance: Complementarity between environmental, social and business behaviours. Appl. Econ. 2014, 46, 3323–3338. [Google Scholar] [CrossRef]
  5. Abounit, S.; Bousset, L.; Loria, F.; Zhu, S.; de Chaumont, F.; Pieri, L.; Olivo-Marin, J.C.; Melki, R.; Zurzolo, C. Tunneling nanotubes spread fibrillar α-synuclein by intercellular trafficking of lysosomes. EMBO J. 2016, 35, 2120–2138. [Google Scholar] [CrossRef] [PubMed]
  6. De Grosbois, D.; Fennell, D. Carbon footprint of the global hotel companies: Comparison of methodologies and results. Tour. Recreat. Res. 2011, 36, 231–245. [Google Scholar] [CrossRef]
  7. (MET) Ministry of Tourism and Environment. Statistical Year Book (2016); MET: Nicosia, Cyprus, 2017.
  8. Cavusoglu, B. Knowledge economy and North Cyprus. Procedia Econ. Financ. 2016, 39, 720–724. [Google Scholar] [CrossRef]
  9. Butler, R.W. Sustainable tourism: A state-of-the-art review. Tour. Geogr. 1999, 1, 7–25. [Google Scholar] [CrossRef]
  10. Butler, R.W. The concept of a tourist area cycle of evolution: Implications for management of resources. Can. Geogr./Le Géographe Can. 1980, 24, 5–12. [Google Scholar] [CrossRef]
  11. Kara, C. Sustinable Tourism Development in Small Island Developing States. Turkish Republic of Northern Cyprus (TRNC) As A Case Study. Master’s Thesis, Izmir Insitute of Technology, Urla/İzmir, Turkey, 2003. [Google Scholar]
  12. do Paço, A.; Shiel, C.; Alves, H. A new model for testing green consumer behaviour. J. Clean. Prod. 2019, 207, 998–1006. [Google Scholar] [CrossRef]
  13. Yeh, S.-S.; Ma, T.; Huan, T.-C. Building social entrepreneurship for the hotel industry by promoting environmental education. Int. J. Contemp. Hosp. Manag. 2016, 28, 1204–1224. [Google Scholar] [CrossRef]
  14. Rahman, I.; Reynolds, D. Predicting green hotel behavioral intentions using a theory of environmental commitment and sacrifice for the environment. Int. J. Hosp. Manag. 2016, 52, 107–116. [Google Scholar] [CrossRef]
  15. Fatma, M.; Rahman, Z.; Khan, I. Measuring consumer perception of CSR in tourism industry: Scale development and validation. J. Hosp. Tour. Manag. 2016, 27, 39–48. [Google Scholar] [CrossRef]
  16. Rahman, I.; Reynolds, D. The influence of values and attitudes on green consumer behavior: A conceptual model of green hotel patronage. Int. J. Hosp. Tour. Adm. 2019, 20, 47–74. [Google Scholar] [CrossRef]
  17. Njite, D.; Schaffer, J. Revisiting attributes: How important is green in the consumer selection of hotel rooms? Int. J. Hosp. Tour. Adm. 2017, 18, 219–244. [Google Scholar] [CrossRef]
  18. Chan, E.S.-W. Green marketing: Hotel customers’ perspective. J. Travel Tour. Mark. 2014, 31, 915–936. [Google Scholar] [CrossRef]
  19. Weir, B. Climate change and tourism–Are we forgetting lessons from the past? J. Hosp. Tour. Manag. 2017, 32, 108–114. [Google Scholar] [CrossRef]
  20. Drius, M.; Bongiorni, L.; Depellegrin, D.; Menegon, S.; Pugnetti, A.; Stifter, S. Tackling challenges for Mediterranean sustainable coastal tourism: An ecosystem service perspective. Sci. Total Environ. 2019, 652, 1302–1317. [Google Scholar] [CrossRef]
  21. Iraldo, F.; Testa, F.; Lanzini, P.; Battaglia, M. Greening competitiveness for hotels and restaurants. J. Small Bus. Enterp. Dev. 2017, 24, 607–628. [Google Scholar] [CrossRef]
  22. Azarmi, S.; Oladipo, A.; Vaziri, R.; Alipour, H. Comparative Modelling and Artificial Neural Network Inspired Prediction of Waste Generation Rates of Hospitality Industry: The Case of North Cyprus. Sustainability 2018, 10, 2965. [Google Scholar] [CrossRef]
  23. Weaver, D.; Davidson, M.C.; Lawton, L.; Patiar, A.; Reid, S.; Johnston, N. Awarding sustainable Asia-Pacific hotel practices: Rewarding innovative practices or open rhetoric? Tour. Recreat. Res. 2013, 38, 15–28. [Google Scholar] [CrossRef]
  24. Chen, H.; Bernard, S.; Rahman, I. Greenwashing in hotels: A structural model of trust and behavioral intentions. J. Clean. Prod. 2019, 206, 326–335. [Google Scholar] [CrossRef]
  25. Pizam, A. Green hotels: A fad, ploy or fact of life? Int. J. Hosp. Manag. 2009, 1, 1. [Google Scholar] [CrossRef]
  26. Higgins-Desbiolles, F. Justice tourism and alternative globalisation. J. Sustain. Tour. 2008, 16, 345–364. [Google Scholar] [CrossRef]
  27. Musavengane, R. Small hotels and Responsible Tourism Practice: Hoteliers’ perspectives. J. Clean. Prod. 2019, 220, 786–799. [Google Scholar] [CrossRef]
  28. Yadav, R.; Balaji, M.; Jebarajakirthy, C. How psychological and contextual factors contribute to travelers’ propensity to choose green hotels? Int. J. Hosp. Manag. 2019, 77, 385–395. [Google Scholar] [CrossRef]
  29. Choi, H.; Jang, J.; Kandampully, J. Application of the extended VBN theory to understand consumers’ decisions about green hotels. Int. J. Hosp. Manag. 2015, 51, 87–95. [Google Scholar] [CrossRef]
  30. WCED, S.W.S. World commission on environment and development. Our Common Future 1987, 17, 1–91. [Google Scholar]
  31. Harris, J.M.; Goodwin, N.R. Reconciling Growth and the Environment; Tufts University: Medford, MA, USA, 2003. [Google Scholar]
  32. Slaper, T.F.; Hall, T.J. The triple bottom line: What is it and how does it work. Indiana Bus. Rev. 2011, 86, 4–8. [Google Scholar]
  33. Toelkes, C. Sustainability communication in tourism–A literature review. Tour. Manag. Perspect. 2018, 27, 10–21. [Google Scholar] [CrossRef]
  34. Gunce, E. Tourism and local attitudes in Girne, Northern Cyprus. Cities 2003, 20, 181–195. [Google Scholar] [CrossRef]
  35. Papadas, K.-K.; Avlonitis, G.J.; Carrigan, M. Green marketing orientation: Conceptualization, scale development and validation. J. Bus. Res. 2017, 80, 236–246. [Google Scholar] [CrossRef]
  36. Zielinski, S.; Botero, C. Are eco-labels sustainable? Beach certification schemes in Latin America and the Caribbean. J. Sustain. Tour. 2015, 23, 1550–1572. [Google Scholar] [CrossRef]
  37. Nguyen, T.N.; Lobo, A.; Greenland, S. Pro-environmental purchase behaviour: The role of consumers’ biospheric values. J. Retail. Consum. Serv. 2016, 33, 98–108. [Google Scholar] [CrossRef]
  38. GSTC (Global Sustainable Tourism Council). Global Sustainable Tourism Criteria for Hotels and Tour Operators; Global Sustainable Tourism Council: Washington, DC, USA, 2013. [Google Scholar]
  39. Dangelico, R.M.; Vocalelli, D. “Green Marketing”: An analysis of definitions, strategy steps, and tools through a systematic review of the literature. J. Clean. Prod. 2017, 165, 1263–1279. [Google Scholar] [CrossRef]
  40. Papadas, K.-K.; Avlonitis, G.J.; Carrigan, M.; Piha, L. The interplay of strategic and internal green marketing orientation on competitive advantage. J. Bus. Res. 2019, 104, 632–643. [Google Scholar] [CrossRef]
  41. Jamrozy, U. Marketing of tourism: A paradigm shift toward sustainability. Int. J. Cult. Tour. Hosp. Res. 2007, 1, 117–130. [Google Scholar] [CrossRef]
  42. Tsoutsos, T.; Tournaki, S.; de Santos, C.A.; Vercellotti, R. Nearly zero energy buildings application in Mediterranean hotels. Energy Procedia 2013, 42, 230–238. [Google Scholar] [CrossRef] [Green Version]
  43. Kularatne, T.; Wilson, C.; Månsson, J.; Hoang, V.; Lee, B. Do environmentally sustainable practices make hotels more efficient? A study of major hotels in Sri Lanka. Tour. Manag. 2019, 71, 213–225. [Google Scholar] [CrossRef]
  44. Kostakis, I.; Sardianou, E. Which factors affect the willingness of tourists to pay for renewable energy? Renew. Energy 2012, 38, 169–172. [Google Scholar] [CrossRef]
  45. Bergin-Seers, S.; Mair, J. Emerging green tourists in Australia: Their behaviours and attitudes. Tour. Hosp. Res. 2009, 9, 109–119. [Google Scholar] [CrossRef]
  46. Dolnicar, S.; Matus, K. Are green tourists a managerially useful target segment? J. Hosp. Leis. Mark. 2008, 17, 314–334. [Google Scholar] [CrossRef]
  47. Verma, V.K.; Chandra, B.; Kumar, S. Values and ascribed responsibility to predict consumers’ attitude and concern towards green hotel visit intention. J. Bus. Res. 2019, 96, 206–216. [Google Scholar] [CrossRef]
  48. Berezan, O.; Raab, C.; Yoo, M.; Love, C. Sustainable hotel practices and nationality: The impact on guest satisfaction and guest intention to return. Int. J. Hosp. Manag. 2013, 34, 227–233. [Google Scholar] [CrossRef]
  49. Tzschentke, N.A.; Kirk, D.; Lynch, P.A. Going green: Decisional factors in small hospitality operations. Int. J. Hosp. Manag. 2008, 27, 126–133. [Google Scholar] [CrossRef]
  50. Schlosberg, D. Theorising environmental justice: The expanding sphere of a discourse. Environ. Politics 2013, 22, 37–55. [Google Scholar] [CrossRef]
  51. Clarke, J. A framework of approaches to sustainable tourism. J. Sustain. Tour. 1997, 5, 224–233. [Google Scholar] [CrossRef]
  52. Tang, Z.; Shang, J.; Shi, C.; Liu, Z.; Bi, K. Decoupling indicators of CO2 emissions from the tourism industry in China: 1990–2012. Ecol. Indic. 2014, 46, 390–397. [Google Scholar] [CrossRef]
  53. Scott, D.; Hall, C.M.; Gössling, S. Global tourism vulnerability to climate change. Ann. Tour. Res. 2019, 77, 49–61. [Google Scholar] [CrossRef]
  54. Merli, R.; Preziosi, M.; Acampora, A.; Lucchetti, M.; Ali, F. The impact of green practices in coastal tourism: An empirical investigation on an eco-labelled beach club. Int. J. Hosp. Manag. 2019, 77, 471–482. [Google Scholar] [CrossRef]
  55. Kim, S.-H.; Lee, K.; Fairhurst, A. The review of “green” research in hospitality, 2000-2014: Current trends and future research directions. Int. J. Contemp. Hosp. Manag. 2017, 29, 226–247. [Google Scholar] [CrossRef]
  56. Larson, L.R.; Poudyal, N.C. Developing sustainable tourism through adaptive resource management: A case study of Machu Picchu, Peru. J. Sustain. Tour. 2012, 20, 917–938. [Google Scholar] [CrossRef]
  57. Higgins-Desbiolles, F. The elusiveness of sustainability in tourism: The culture-ideology of consumerism and its implications. Tour. Hosp. Res. 2010, 10, 116–129. [Google Scholar] [CrossRef] [Green Version]
  58. Opdam, P. Exploring the role of science in sustainable landscape management. In An Introduction to the Special Issue; Multidisciplinary Digital Publishing Institute: Basel, Switzerland, 2018. [Google Scholar]
  59. Sparks, P.; Shepherd, R. Self-identity and the theory of planned behavior: Assesing the role of identification with “ green consumerism”. Soc. Psychol. Q. 1992, 55, 388–399. [Google Scholar] [CrossRef]
  60. McCarthy, B.; Liu, H.B. Food waste and the ‘green’consumer. Australas. Mark. J. (AMJ) 2017, 25, 126–132. [Google Scholar] [CrossRef]
  61. Ajzen, I. From intentions to actions: A theory of planned behavior. In Action Control; Springer: Berlin/Heidelberg, Germany, 1985; pp. 11–39. [Google Scholar]
  62. Ajzen, I.; Fishbein, M. Theory of reasoned action-Theory of planned behavior. Univ. South Fla. 1988, 2007, 67–98. [Google Scholar]
  63. Pulido-Fernández, J.I.; Cárdenas-García, P.J.; Espinosa-Pulido, J.A. Does environmental sustainability contribute to tourism growth? An analysis at the country level. J. Clean. Prod. 2019, 213, 309–319. [Google Scholar] [CrossRef]
  64. Dodds, R.; Holmes, M. Is there a Benefit from being Green. Assessing Benefits from Marketing Sustainability by North American Hotels. J. Hotel Bus. Manag. 2016, 5, 145. [Google Scholar] [CrossRef]
  65. Cronin, J.J.; Smith, J.S.; Gleim, M.R.; Ramirez, E.; Martinez, J.D. Green marketing strategies: An examination of stakeholders and the opportunities they present. J. Acad. Mark. Sci. 2011, 39, 158–174. [Google Scholar] [CrossRef]
  66. Prince, S.; Ioannides, D. Contextualizing the complexities of managing alternative tourism at the community-level: A case study of a nordic eco-village. Tour. Manag. 2017, 60, 348–356. [Google Scholar] [CrossRef]
  67. Meleddu, M.; Pulina, M. Evaluation of individuals’ intention to pay a premium price for ecotourism: An exploratory study. J. Behav. Exp. Econ. 2016, 65, 67–78. [Google Scholar] [CrossRef]
  68. Yu, Y.; Li, X.; Jai, T.-M. The impact of green experience on customer satisfaction: Evidence from TripAdvisor. Int. J. Contemp. Hosp. Manag. 2017, 29, 1340–1361. [Google Scholar] [CrossRef]
  69. Zou, L.W.; Chan, R.Y. Why and when do consumers perform green behaviors? An examination of regulatory focus and ethical ideology. J. Bus. Res. 2019, 94, 113–127. [Google Scholar] [CrossRef]
  70. Hao, Y.; Liu, H.; Chen, H.; Sha, Y.; Ji, H.; Fan, J. What affect consumers’ willingness to pay for green packaging? Evidence from China. Resour. Conserv. Recycl. 2019, 141, 21–29. [Google Scholar] [CrossRef]
  71. Cozzio, C.; Bullini Orlandi, L.; Zardini, A. Food sustainability as a strategic value driver in the hotel industry. Sustainability 2018, 10, 3404. [Google Scholar] [CrossRef] [Green Version]
  72. Dolnicar, S.; Crouch, G.I.; Long, P. Environment-friendly tourists: What do we really know about them? J. Sustain. Tour. 2008, 16, 197–210. [Google Scholar] [CrossRef] [Green Version]
  73. Kim, W.G.; Li, J.; Han, J.S.; Kim, Y. The influence of recent hotel amenities and green practices on guests’ price premium and revisit intention. Tour. Econ. 2017, 23, 577–593. [Google Scholar] [CrossRef]
  74. Merli, R.; Preziosi, M.; Acampora, A.; Ali, F. Why should hotels go green? Insights from guests experience in green hotels. Int. J. Hosp. Manag. 2019, 81, 169–179. [Google Scholar] [CrossRef]
  75. Janta, H.; Christou, A. Hosting as social practice: Gendered insights into contemporary tourism mobilities. Ann. Tour. Res. 2019, 74, 167–176. [Google Scholar] [CrossRef]
  76. Chan, E.S. Managing green marketing: Hong Kong hotel managers’ perspective. Int. J. Hosp. Manag. 2013, 34, 442–461. [Google Scholar] [CrossRef]
  77. Buhalis, D. The tourism phenomenon: The new tourist and consumer. In Tourism in the Age of Globalisation; Routledge: London, UK, 2005; pp. 83–110. [Google Scholar]
  78. Lee, J.-S.; Hsu, L.-T.; Han, H.; Kim, Y. Understanding how consumers view green hotels: How a hotel’s green image can influence behavioural intentions. J. Sustain. Tour. 2010, 18, 901–914. [Google Scholar] [CrossRef]
  79. Arbieu, U.; Grünewald, C.; Martín-López, B.; Schleuning, M.; Böhning-Gaese, K. Mismatches between supply and demand in wildlife tourism: Insights for assessing cultural ecosystem services. Ecol. Indic. 2017, 78, 282–291. [Google Scholar] [CrossRef]
  80. Robin, C.F.; Pedroche, M.S.C.; Astorga, P.S. Revisiting green practices in the hotel industry: A comparison between mature and emerging destinations. J. Clean. Prod. 2017, 140, 1415–1428. [Google Scholar]
  81. Hussain, M.; Al-Aomar, R.; Melhem, H. Assessment of lean-green practices on the sustainable performance of hotel supply chains. Int. J. Contemp. Hosp. Manag. 2019. [Google Scholar] [CrossRef]
  82. Saura, J.; Reyes-Menendez, A.; Alvarez-Alonso, C. Do online comments affect environmental management? Identifying factors related to environmental management and sustainability of hotels. Sustainability 2018, 10, 3016. [Google Scholar] [CrossRef] [Green Version]
  83. Jackson, D.L. Revisiting sample size and number of parameter estimates: Some support for the N: Q hypothesis. Struct. Equ. Model. 2003, 10, 128–141. [Google Scholar] [CrossRef]
  84. Han, H.; Lee, J.-S.; Trang, H.L.T.; Kim, W. Water conservation and waste reduction management for increasing guest loyalty and green hotel practices. Int. J. Hosp. Manag. 2018, 75, 58–66. [Google Scholar] [CrossRef]
  85. Tovar-Sánchez, A.; Sánchez-Quiles, D.; Rodríguez-Romero, A. Massive coastal tourism influx to the Mediterranean Sea: The environmental risk of sunscreens. Sci. Total Environ. 2019, 656, 316–321. [Google Scholar] [CrossRef] [PubMed]
  86. Kang, K.H.; Stein, L.; Heo, C.Y.; Lee, S. Consumers’ willingness to pay for green initiatives of the hotel industry. Int. J. Hosp. Manag. 2012, 31, 564–572. [Google Scholar] [CrossRef]
  87. Ge, H.; Chen, S.; Chen, Y. International alliance of green hotels to reach sustainable competitive advantages. Sustainability 2018, 10, 573. [Google Scholar] [CrossRef] [Green Version]
  88. Scott, J.E. Coffee shop meets casino: Cultural responses to casino tourism in Northern Cyprus. J. Sustain. Tour. 2003, 11, 266–279. [Google Scholar] [CrossRef]
  89. Vehbi, B.O.; Doratli, N. Assessing the impact of tourism on the physical environment of a small coastal town: Girne, northern cyprus. Eur. Plan. Stud. 2010, 18, 1485–1505. [Google Scholar] [CrossRef]
  90. (MET) Ministry of Tourism and Environment. Statistical Year Book, 2017; MET: Nicosia, Cyprus, 2018.
  91. Seraphin, H.; Sheeran, P.; Pilato, M. Over-tourism and the fall of Venice as a destination. J. Destin. Mark. Manag. 2018, 9, 374–376. [Google Scholar] [CrossRef]
  92. Parameswaran, R.; Yaprak, A. A cross-national comparison of consumer research measures. J. Int. Bus. Stud. 1987, 18, 35–49. [Google Scholar] [CrossRef]
  93. Kim, Y. The pilot study in qualitative inquiry: Identifying issues and learning lessons for culturally competent research. Qual. Soc. Work 2011, 10, 190–206. [Google Scholar] [CrossRef]
  94. Burgess, T.F. A General Introduction to the Design of Questionnaires for Survey Research, 1st ed.; University of Leeds: Leeds, UK, 2001. [Google Scholar]
  95. Wu, M.-H.; Thongma, W.; Leelapattana, W.; Huang, M.-L. Impact of hotel employee’s green awareness, knowledge, and skill on hotel’s overall performance. In Advances in Hospitality and Leisure; Emerald Group Publishing Limited: Bingley, UK, 2016; pp. 65–81. [Google Scholar]
  96. Chan, E.S.; Hawkins, R. Application of EMSs in a hotel context: A case study. Int. J. Hosp. Manag. 2012, 31, 405–418. [Google Scholar] [CrossRef]
  97. GSTC (Global Sustainable Tourism Council). Global Sustainable Tourism Criteria Hotel Criteria with Suggested Performance Indicators Preamble, 3rd ed.; Global Sustainable Tourism Council: Washington, DC, USA, 2016. [Google Scholar]
  98. WTO (World Tourism Organization). Indicators of Sustainable Development for Tourism Destinations: A Guidebook; World Tourism Organization: Madrid, Spain, 2004. [Google Scholar]
  99. SDG (Sustainable Development Goals). Improving Human and Planetary Wellbeing. 2013, Volume 495. Available online: https://sustainabledevelopment.un.org/content/documents/1696griggs2.pdf (accessed on 14 November 2019).
  100. Sharma, E.; Tewari, R. Engaging employee perception for effective corporate social responsibility: Role of human resource professionals. Glob. Bus. Rev. 2018, 19, 111–130. [Google Scholar] [CrossRef] [Green Version]
  101. Chan, E.S.; Hon, A.H.; Okumus, F.; Chan, W. An empirical study of environmental practices and employee ecological behavior in the hotel industry. J. Hosp. Tour. Res. 2017, 41, 585–608. [Google Scholar] [CrossRef]
  102. Droussiotis, A.; Austin, J. Company practices of Cypriot firms: Perceptual differences between employers and employees. Eur. Bus. Rev. 2008, 20, 208–221. [Google Scholar] [CrossRef]
  103. Goree, C.T.; Marszalek, J.F. Electronic surveys: Ethical issues for researchers. Coll. Stud. Aff. J. 1995, 15, 75–79. [Google Scholar]
  104. Etikan, I.; Musa, S.A.; Alkassim, R.S. Comparison of convenience sampling and purposive sampling. Am. J. Theor. Appl. Stat. 2016, 5, 1–4. [Google Scholar] [CrossRef] [Green Version]
  105. Asmelash, A.G.; Kumar, S. Assessing progress of tourism sustainability: Developing and validating sustainability indicators. Tour. Manag. 2019, 71, 67–83. [Google Scholar] [CrossRef]
  106. López, M.F.B.; Virto, N.R.; Manzano, J.A.; Miranda, J.G.-M. Residents’ attitude as determinant of tourism sustainability: The case of Trujillo. J. Hosp. Tour. Manag. 2018, 35, 36–45. [Google Scholar] [CrossRef]
  107. Park, J.; Jeong Kim, H.; McCleary, K.W. The impact of top management’s environmental attitudes on hotel companies’ environmental management. J. Hosp. Tour. Res. 2014, 38, 95–115. [Google Scholar] [CrossRef]
  108. Balcı, A. Sosyal Bilimlerde Araştırma: Yöntem Teknik Ve Ilkeler [Research in Social Sciences: Administration, Technique and Principles]; Pegem Akademi Yayıncılık: Ankara, Türkiye, 2004. [Google Scholar]
  109. Bollen, K.A. A new incremental fit index for general structural equation models. Sociol. Methods Res. 1989, 17, 303–316. [Google Scholar] [CrossRef]
  110. Anderson, J.C.; Gerbing, D.W. The effect of sampling error on convergence, improper solutions, and goodness-of-fit indices for maximum likelihood confirmatory factor analysis. Psychometrika 1984, 49, 155–173. [Google Scholar] [CrossRef]
  111. Hu, L.-T.; Bentler, P.M. Evaluating model fit. In Structural Equation Modeling: Concepts, Issues, and Applications; Hoyle, R.H., Ed.; Sage: New York, NY, USA, 1995; pp. 76–99. [Google Scholar]
  112. Hatcher, L.; O’Rourke, N. A Step-by-Step Approach to Using SAS for Factor Analysis and Structural Equation Modeling; Sas Institute: Cary, NC, USA, 2013. [Google Scholar]
  113. Hair, J.F.; Black, W.C.; Babin, B.J.; Anderson, R.E.; Tatham, R.L. Multivariate Data Analysis, 6th ed.; Pearson Prentice Hall: New Jersey, NJ, USA, 2006; Volume 87, pp. 49–74. [Google Scholar]
  114. Bollen, K.A.; Long, J.S. Testing Structural Equation Models; Sage: Thousand Oaks, CA, USA, 1993; Volume 154. [Google Scholar]
  115. Hoyle, R.H. The Structural Equation Modeling Approach: BASIC Concepts and Fundamental Issues; American Psychological Association: Washington, DC, USA, 1995. [Google Scholar]
  116. Kline, R.B. Structural Equation Modeling; Guilford Press: New York, NY, USA, 1998. [Google Scholar]
  117. Schafer, J.L.; Graham, J.W. Missing data: Our view of the state of the art. Psychol. Methods 2002, 7, 147. [Google Scholar] [CrossRef]
  118. De Vaus, D. Research Design in Social Research; Sage: Thousand Oaks, CA, USA, 2001. [Google Scholar]
  119. Roth, P.L. Missing data: A conceptual review for applied psychologists. Pers. Psychol. 1994, 47, 537–560. [Google Scholar] [CrossRef]
  120. Byrne, B.M. Structural Equation Modeling with LISREL, PRELIS, and SIMPLIS: Basic Concepts, Applications, and Programming; Psychology Press: East Sussex, UK, 2013. [Google Scholar]
  121. Byrne, B.M.; Stewart, S.M. Teacher’s corner: The MACS approach to testing for multigroup invariance of a second-order structure: A walk through the process. Struct. Equ. Model. 2006, 13, 287–321. [Google Scholar] [CrossRef]
  122. Byrne, B.M. Structural Equation Modeling with Mplus: Basic Concepts, Applications, and Programming; Routledge: London, UK, 2013. [Google Scholar]
  123. Straub, D.W. Validating instruments in MIS research. MIS Q. 1989, 13, 147–169. [Google Scholar] [CrossRef] [Green Version]
  124. Cronbach, L.J. Coefficient alpha and the internal structure of tests. Psychometrika 1951, 16, 297–334. [Google Scholar] [CrossRef] [Green Version]
  125. Cook, T.D.; Campbell, D.T. The design and conduct of true experiments and quasi-experiments in field settings. In Reproduced in Part in Research in Organizations: Issues and Controversies; Goodyear Publishing Company: Santa Monica, CA, USA, 1979. [Google Scholar]
  126. Garver, M.S.; Mentzer, J.T. Logistics research methods: Employing structural equation modeling to test for construct validity. J. Bus. Logist. 1999, 20, 33. [Google Scholar]
  127. Maruyama, G. Basics of Structural Equation Modeling; Sage: Thousand Oaks, CA, USA, 1997. [Google Scholar]
  128. Schermelleh-Engel, K.; Moosbrugger, H.; Müller, H. Evaluating the fit of structural equation models: Tests of significance and descriptive goodness-of-fit measures. Methods Psychol. Res. Online 2003, 8, 23–74. [Google Scholar]
  129. Marsh, H.W.; Grayson, D. Latent Variable Models of Multitrait-Multimethod Data; American Psychological Association: Washington, DC, USA, 1995. [Google Scholar]
  130. Tanaka, J.S. Multifaceted conceptions of fit in structural equation models. Sage Focus Ed. 1993, 154, 10. [Google Scholar]
  131. Shrock, S.A.; Coscarelli, W.C. Criterion-Referenced Test Development: Technical and Legal Guidelines for Corporate Training; John Wiley & Sons: Hoboken, NJ, USA, 2008. [Google Scholar]
  132. Steenkamp, J.-B.E.; Van Trijp, H.C. The use of LISREL in validating marketing constructs. Int. J. Res. Mark. 1991, 8, 283–299. [Google Scholar] [CrossRef]
  133. Barclay, D.; Higgins, C.; Thompson, R. The Partial Least Squares (PLS) Approach to Casual Modeling: Personal Computer Adoption ans Use as an Illustration. Technol. Stud. 1995, 2, 285–309. [Google Scholar]
  134. Fornell, C.; Larcker, D.F. Evaluating structural equation models with unobservable variables and measurement error. J. Mark. Res. 1981, 18, 39–50. [Google Scholar] [CrossRef]
  135. Hu, L.T.; Bentler, P.M. Cutoff criteria for fit indexes in covariance structure analysis: Conventional criteria versus new alternatives. Struct. Equ. Model. Multidiscip. J. 1999, 6, 1–55. [Google Scholar] [CrossRef]
  136. Browne, M.W.; Cudeck, R. Alternative ways of assessing model fit. Sage Focus Ed. 1993, 154, 136. [Google Scholar] [CrossRef]
  137. Cole, D.A. Utility of confirmatory factor analysis in test validation research. J. Consult. Clin. Psychol. 1987, 55, 584. [Google Scholar] [CrossRef]
  138. Jöreskog, K.G.; Sörbom, D. Recent developments in structural equation modeling. J. Mark. Res. 1982, 19, 404–416. [Google Scholar] [CrossRef]
  139. Jöreskog, K.G.; Sörbom, D. LISREL 8: User’s Reference Guide; Scientific Software International: Chicago, IL, USA, 1996. [Google Scholar]
  140. Hu, L.-T.; Bentler, P.M. Fit indices in covariance structure modeling: Sensitivity to underparameterized model misspecification. Psychol. Methods 1998, 3, 424. [Google Scholar] [CrossRef]
  141. Bentler, P.M.; Bonett, D.G. Significance tests and goodness of fit in the analysis of covariance structures. Psychol. Bull. 1980, 88, 588. [Google Scholar] [CrossRef]
  142. Bentler, P.M. Comparative fit indexes in structural models. Psychol. Bull. 1990, 107, 238. [Google Scholar] [CrossRef] [PubMed]
  143. Tabachnick, B.G.; Fidell, L.S. Using Multivariate Statistics Boston; Allyn Bacon: Needham Heights, MA, USA, 2007. [Google Scholar]
  144. Marsh, H.W.; Balla, J. Goodness of fit in confirmatory factor analysis: The effects of sample size and model parsimony. Qual. Quant. 1994, 28, 185–217. [Google Scholar] [CrossRef]
  145. Bearden, W.O.; Sharma, S.; Teel, J.E. Sample size effects on chi square and other statistics used in evaluating causal models. J. Mark. Res. 1982, 19, 425–430. [Google Scholar] [CrossRef]
  146. Staniškienė, E.; Stankevičiūtė, Ž. Social sustainability measurement framework: The case of employee perspective in a CSR-committed organisation. J. Clean. Prod. 2018, 188, 708–719. [Google Scholar] [CrossRef]
  147. Hanna, K.S. Planning for sustainability: Experiences in two contrasting communities. J. Am. Plan. Assoc. 2005, 71, 27–40. [Google Scholar] [CrossRef]
  148. Hörisch, J.; Freeman, R.E.; Schaltegger, S. Applying stakeholder theory in sustainability management: Links, similarities, dissimilarities, and a conceptual framework. Organ. Environ. 2014, 27, 328–346. [Google Scholar] [CrossRef]
  149. Wiernik, B.M.; Ones, D.S.; Dilchert, S. Age and environmental sustainability: A meta-analysis. J. Manag. Psychol. 2013, 28, 826–856. [Google Scholar] [CrossRef]
  150. Ahn, J.; Kwon, J. Green hotel brands in Malaysia: Perceived value, cost, anticipated emotion, and revisit intention. Curr. Issues Tour. 2019, 1–16. [Google Scholar] [CrossRef]
  151. Jenkin, T.A.; McShane, L.; Webster, J. Green information technologies and systems: Employees’ perceptions of organizational practices. Bus. Soc. 2011, 50, 266–314. [Google Scholar] [CrossRef]
  152. Luke, T.W. Corporate social responsibility: An uneasy merger of sustainability and development. Sustain. Dev. 2013, 21, 83–91. [Google Scholar] [CrossRef]
  153. Chandran, C.; Bhattacharya, P. Hotel’s best practices as strategic drivers for environmental sustainability and green marketing. J. Glob. Sch. Mark. Sci. 2019, 29, 218–233. [Google Scholar] [CrossRef]
Figure 1. Theoretical model of the study.
Sustainability 11 06556 g001
Figure 2. Sustainable practice philosophy for hotel business strategy. Source: Adopted from Jamrozy [41]. Permission obtained.
Sustainability 11 06556 g002
Table 1. Respondents’ profile.
Profile Category Frequency (N = 287)Percentage (%)
GenderFemale13948.4
Male14851.6
AgeUnder 202910.1
21–306623.0
31–4013848.1
Above 405418.8
Educational LevelHigh school269.1
College8328.9
4-year university14450.2
M.Sc. Or PhD3411.8
Duration of employmentLess than a year186.3
1–3 years6623.0
3–5 years12443.2
More than 5 years7927.5
Table 2. Descriptive statistics of questionnaire variables.
Variable LabelVariablesMeanMedianModeStd. Dev.Min.Max.
• The sustainability management system (SMS) is clearly documented and understood.SUS1_SOC2.41220.9115
• Staff are informed and trained about the natural and cultural heritage of the local areaSUS2_SOC2.45220.8915
• Organization participates in partnerships between local communities, NGOs and other local bodies where these existSUS3_SOC2.64330.9515
• Organization has identified groups at risk of discrimination, including women and local minoritiesSUS4_SOC2.61330.9415
• Hotels seek to bring innovative green products and services to marketSUS5_SOC2.59221.0415
• Hotel companies often use eco-labels on packaging, and show them on their corporate websitesSUS6_SOC2.54220.9915
• Records of these programs are listed and managedSUS1_ENV2.47220.8415
• There is an environmental awareness rising plan.SUS2_ENV2.49220.8515
• Native and endemic plants obtained from sustainable sources have been used in landscaping and decoration, avoiding exotic and invasive speciesSUS3_ENV2.34220.8015
• Organization uses green procurement criteriaSUS4_ENV2.62220.9715
• Hotel holds environmental protection awareness programs for community.SUS5_ENV2.37220.8515
• Total direct and indirect greenhouse gas emissions are monitored and managedSUS6_ENV2.60221.0015
• Chemicals especially those in bulk amounts, are stored and handled in accordance with appropriate standardsSUS7_ENV2.57221.0015
• Organization is aware of, and complies with, relevant laws and regulations concerning animal welfareSUS8_ENV2.56220.9115
• SMS includes a process for monitoring continuous improvement in sustainability performanceSUS1_ECON2.55220.8815
• Energy used per tourist/night for each type of energy is monitored and managedSUS2_ECON2.70321.0315
• Water saving equipment are regularly maintained and are efficientSUS3_ECON2.47220.9315
• Equipment and facilities for air quality are monitored and maintained SUS4_ECON2.72320.9415
• A solid waste management plan is in placeSUS5_ECON2.75321.0915
• Organization uses and promotes the usage of recyclable water or grey water in other operations (e.g., watering trees).SUS6_ECON2.52220.9315
Table 3. Descriptive statistics of Likert scale questions.
Strongly AgreeAgreeNeutralDisagreeStrongly Disagree
VariablesFrequencyPercentFrequencyPercentFrequencyPercentFrequencyPercentFrequencyPercent
SUS1_SOC3110.815052.37124.7269.193.1
SUS2_SOC3211.113246.09031.4279.462.1
SUS3_SOC2910.110235.510837.63913.693.1
SUS4_SOC3110.810335.910837.63712.982.8
SUS5_SOC3813.210938.08730.33913.6144.9
SUS6_SOC3612.511941.58529.63612.5113.8
Average SOC32.811.4119.241.591.531.934.011.99.53.3
SUS1_ENV279.413145.69934.5269.141.4
SUS2_ENV248.413647.49432.8289.851.7
SUS3_ENV3411.814650.98529.6207.020.7
SUS4_ENV289.811640.49332.43813.2124.2
SUS5_ENV3612.513948.48931.0175.962.1
SUS6_ENV289.812744.37927.53913.6144.9
SUS7_ENV3211.112242.58529.63411.8144.9
SUS8_ENV248.413045.39031.43512.282.8
Average ENV29.110.2130.945.689.331.129.610.38.12.8
SUS1_ECON248.412543.610235.5289.882.8
SUS2_ECON2910.110436.29533.14214.6175.9
SUS3_ECON3512.212744.38630.03211.172.4
SUS4_ECON186.311138.710335.94315.0124.2
SUS5_ECON3110.810335.97927.55519.2196.6
SUS6_ECON3311.511740.810135.2269.1103.5
Average ECON28.39.9114.539.994.332.937.713.112.24.2
Average30.010.5122.542.791.531.933.411.69.83.4
Note: Range = 1 (Strongly Agree) to 5 (Strongly Disagree).
Table 4. Reliability analysis—item-total statistics.
VariablesCorrected Item-Total CorrelationCronbach’s Alpha
SUS1_SOC0.3400.648 (N of Items = 6)
SUS2_SOC0.374
SUS3_SOC0.374
SUS4_SOC0.328
SUS5_SOC0.472
SUS6_SOC0.363
SUS1_ENV0.3090.650 (N of Items = 8)
SUS2_ENV0.357
SUS3_ENV0.210
SUS4_ENV0.392
SUS5_ENV0.263
SUS6_ENV0.381
SUS7_ENV0.438
SUS8_ENV0.375
SUS1_ECON0.4510.654 (N of Items = 6)
SUS2_ECON0.392
SUS3_ECON0.394
SUS4_ECON0.374
SUS5_ECON0.411
SUS6_ECON0.288
Table 5. Second-order confirmatory factor analysis (CFA) analysis for overall model.
First- & Second-Order Constructs/ItemsUnstandardized Loading (B)t-Values
SUS (AVE = 0.803; CR = 0.924; MaxR(H) = 0.960)
SOC (R2 = 0.789; Standardized loading (β) = 0.974)
SUS1_SOC1.9255.951 ***
SUS2_SOC *1.000n/a
SUS3_SOC1.8925.869 ***
SUS4_SOC1.1354.815 ***
SUS5_SOC2.3696.35 ***
SUS6_SOC2.1736.137 ***
ENV (R2 = 0.949; Standardized loading (β) = 0.888)
SUS1_ENV1.2014.482 ***
SUS2_ENV1.4385.055 ***
SUS3_ENV *1.000n/a
SUS4_ENV1.5164.751 ***
SUS5_ENV †-n/a
SUS6_ENV1.9785.589 ***
SUS7_ENV2.0045.471 ***
SUS8_ENV1.5795.153 ***
ECO (R2 = 0.670; Standardized loading (β) = 0.818)
SUS1_ECON1.4025.797 ***
SUS2_ECON1.3815.216 ***
SUS3_ECON1.6025.539 ***
SUS4_ECON *1.000n/a
SUS5_ECON2.4706.37 ***
SUS6_ECON1.2394.435 ***
Note: * fixed parameter; † removed during the CFA; *** p < 0.001.
Table 6. Goodness-of-fit statistics for overall model.
MeasureEstimateThresholdInterpretation
Chi-square (χ2) of estimate model341.98----
Degree of freedom (DF)136----
CMIN/DF2.515Between 1 and 3Excellent
Standardized root mean square residual (SRMR)0.067<0.08Excellent
Root mean square error of approximation (RMSEA)0.073<0.06Acceptable
Tucker Lewis Index (TLI)0.749>0.95Acceptable
Comparative Fit Index (CFI)0.801>0.95Acceptable *
Adjusted goodness-of-fit Index (AGFI)0.853>0.80Excellent
Note: * According to Hu and Bentler [135], when the combination of estimation of CFI or TLI for less than 0.96 and SRMR for greater than 0.06 is obtained for the sample size of more than 250 and less than 500; therefore, it can be concluded that model is fit. Accordingly, the combination of the estimated values for TLI, CFI, and SRMR show a good fit for the overall model.

