Article

Consolidated Climate Markets Mechanism Analysis—Case Studies of China, Japan, and Taiwan

1
Mt. Stonegate Green Asset Management Ltd., Taichung 408, Taiwan
2
Department of Civil and Environmental Engineering, National University of Kaohsiung, Kaohsiung 811, Taiwan
3
Sustainability Science and Engineering Program, International College, Tunghai University, Taichung 407, Taiwan
4
Department of Science and Mathematics, Texas A&M University-San Antonio, San Antonio, TX 78224, USA
*
Author to whom correspondence should be addressed.
Sustainability 2019, 11(22), 6478; https://doi.org/10.3390/su11226478
Submission received: 7 October 2019 / Revised: 30 October 2019 / Accepted: 10 November 2019 / Published: 18 November 2019
(This article belongs to the Section Economic and Business Aspects of Sustainability)

Abstract

:
The post-Kyoto Protocol era has seen a transition to focus on the development of a renewable energy (RE) market as a primary instrument to reduce greenhouse gas (GHG) emissions worldwide. This paper analyses the development of GHG reduction and RE market in China, Japan, and Taiwan that are geographically proximate but socioeconomically diverse, and each plays a different but significant role in the world’s economy. By deploying a consolidated model incorporating the key components of market drivers underlying the goal of achieving GHG reduction, we threaded through the policy- and market-instruments implemented for each of the case studies over the past 20 years using the model. One commonality is that subsidiary schemes in the form of feed-in tariffs have served as an effective policy tool to boost the growth of renewable energy installations, though the worsening financial burden renders this path unsustainable. Over-reliance on feed-in-tariff schemes may have also impeded the liberation of an energy market pivotal to the success of elevating RE portfolio through trading mechanisms. What followed were the implementations of renewable energy certificate (REC) systems that have experienced various roadblocks leading to failures of the certificate market. By understanding the paths engaged in each of the cases, a conceptualized strategy depicted by the consolidated model is proposed to show the links between a renewable market and a carbon market. The framework would expedite the trading of RECs and carbon credits to accelerate the attainment of GHG emission reduction goals.

1. Introduction

The ozone layer depletion and global warming are two separate but intertwined events, scientifically and politically, with colossal global implications as both events have been widely perceived as realistic threats to humanity. The success of the “Montreal Protocol” finalized in 1987 to reduce the emission of chlorofluorocarbons—the major group of ozone-depleting substances—which has been scientifically proven to be effective in mitigating ozone layer depletion [1,2], has paved the way to how the United Nations founded Intergovernmental Panel on Climate Change (IPCC) to slow down the effects of global warming by reducing the emissions of greenhouse gases (GHGs). This effort culminated in 1997 with the conclusion at the third conference of the United Nations Framework Convention on Climate Change (UNFCCC), widely known as the “Kyoto Protocol” in which the GHG reduction goals and committed state parties were determined [3,4]. However, outside of the commonality of both Protocols being a product of the concerted and unprecedented international endeavors to alleviate grave environmental concerns on the global scale, the Kyoto Protocol has proven to be a much more complicated process than the Montreal Protocol, stemming from wider political and socioeconomic impacts associated with the reduction of the six designated groups of GHGs, particularly the emission of CO2, which is inherently bound to the generation of carbon-based energy. As a result, the Kyoto Protocol has garnered more widespread attention, or even controversies, internationally [5,6].
The Kyoto Protocol mandates three market mechanisms for carbon trading, namely emissions trading (ET), joint implementation (JI), and clean development mechanism (CDM) designed as a cooperation scheme between Annex I and non-Annex I countries. These schemes operated in the framework of both regulation-driven (e.g., cap-and-trade) and market-driven (e.g., carbon credit trading) instruments [7,8]. Despite the vast optimism that attracted investors to implement carbon-reduction projects, the demand for carbon certificates started to mature and stopped growing by the first crediting period in 2012, when all Annex I countries were to hand over GHG emission reports to the UNFCCC. The carbon market eventually collapsed when it was flooded with issued carbon certificates without foreseeable buyers, and would not recover because of the lack of clarity on the long-term prospect of the market [9], despite the UNFCCC’s rescue attempt by extending the validity of the Kyoto Protocol for three more years.
Subsequently, in 2015, the outcome summarized in the Paris Agreement, which was successfully ratified, affirmed that a voluntary market mechanism was again being recognized as an important tool for international cooperation among Parties. In addition to mending loopholes in the market design (e.g., leakage) and achieving broader sustainability development, the major outcome that emerged from the Paris Agreement is the focus to promote the use of renewable energy. The escalating demand of energy, most of which is still generated by coal combustion and natural gas, only exacerbates the extent of CO2 emissions [5,10,11]. To date, still very few carbon capturing, sequestration, and utilization technologies have been matured enough to reduce the CO2 emissions at an economically competitive scale. However, the biggest reduction in carbon emissions can be expected to come mainly from enhanced energy efficiency coupled with a decreased energy demand. Electricity generation from renewable energy sources, primarily wind and solar power, is weather-dependent and typically entails high capital investment, thereby keeping them from being competitive in the energy marketplace [11,12].
In light of global warming issues, the international communities have initiated dialogue to advocate for strategic carbon reduction measures, by means of carbon credits and renewable energy certificates (RECs) [13,14]. The philosophy behind implementing a REC system is one in which power generation is no longer viewed as only power supply, but also possesses environmental benefits. However, power generation methods without CO2 emissions are not considered as beneficial to the environment because the environmental attributes (i.e., no CO2 emissions) of energy generated from renewable sources cannot be quantified. Therefore, RECs provide a means to verify that the power purchased by a firm is generated from renewable sources with quantifiable environmental benefits. Additionally, in a liberalized global power market, two of the most popular policy instruments administered by governments to stimulate the development of renewable energy market are the renewable portfolio standard (RPS) and feed-in tariff (FIT). FIT is a policy mechanism designed to accelerate investment in renewable energy technologies with dedicated supporting resources, most commonly tax relaxation and financial subsidies. RPS requires electricity suppliers to procure a certain percentage of their total supplied power from renewable-based sources [15,16,17]. Some countries also impose that requirement upon major power users [18]. RPS is often implemented with the use of RECs, and is a mechanism that converts environmental attributes to tradable instruments, while being backed by regulatory enforcement of the use of such certificates.
The degree to leveraging different techno-economic and regulatory means to provide clean, reliable, and competitive energy supply differs significantly between countries, as each country has its own distinct energy portfolio that meets the economic viability, social equity, and environmental profiles of the country. While restricting GHG emissions, often seen as an effective measure to alleviate global warming, policy-makers have now started to recognize the scale-up of renewable energy as an equally effective option that also addresses energy security concerns, yet the interlinkages of the policies between the GHG reduction and renewable energy development have not been sufficiently discussed. This is especially true for many of the emerging markets worldwide such as Far East Asia, where Japan, Korea and Taiwan had historically embodied the economic growth in the region that is now dominated by China. While capitalizing on the environmental value of green power is the common goal, one underlying factor, be it the environmental motivation (e.g., reducing fossil fuel dependence), political (e.g., phasing out nuclear power) or even business decisions (e.g., meeting the demand from international trading partners) may carry more weight than another. In the present study, we proposed a policy-oriented model, termed “Consolidated Climate Markets Mechanism Analysis” (CCLIMMA), integrating GHG reduction and renewable energy market development to describe the interlinkage between the two events. We aim to describe, retrospectively, in the framework of the proposed model how the East Asian markets of China (a fast-emerging economy, and the country that most invested in renewable energy development), Japan (a matured economy that seeks to meet energy demand while avoiding nuclear power generation), and Taiwan (a small and maturing economy seeking to liberalize its energy market and diversify its energy portfolio with increased share of renewable forms) evolved. The model can provide a basis for the prognostication of the markets moving forward.

2. Methodology

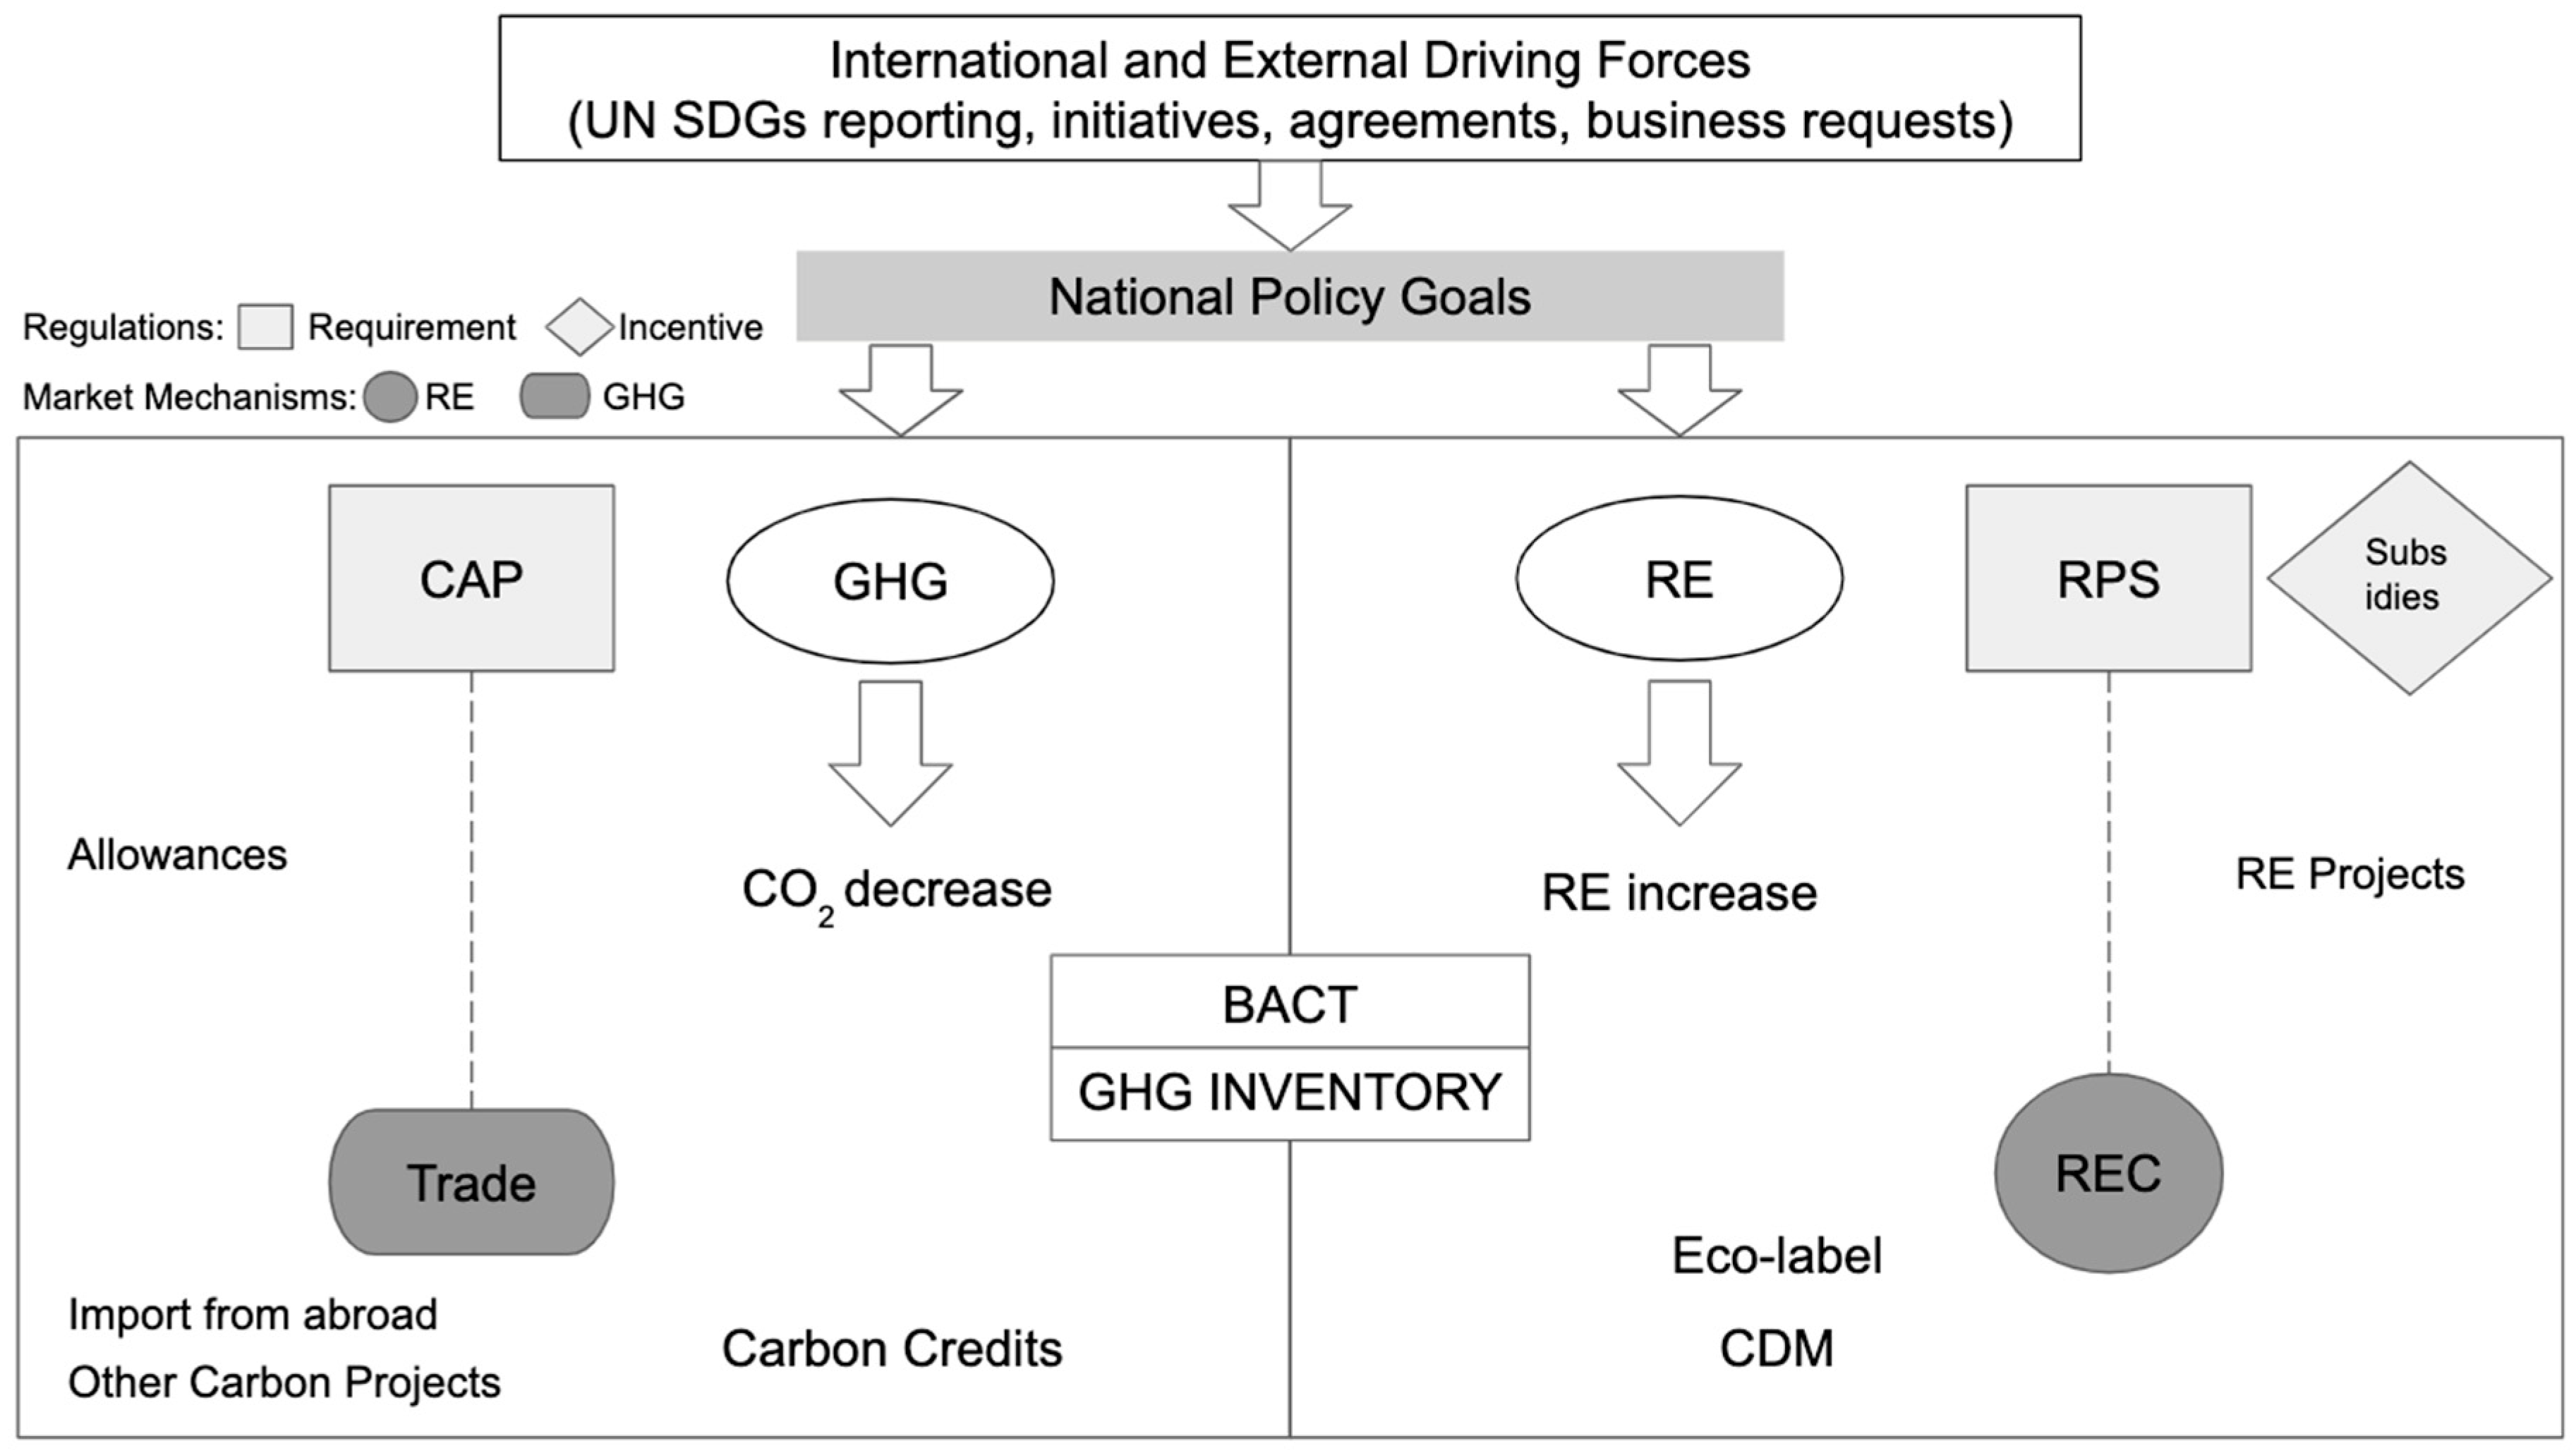
2.1. Synthesis of CCLIMMA Model

Figure 1 shows the fundamental components of CCLIMMA. In the aftermath of climate change events, international regulatory institutions and non-governmental organizations promote international cooperation in order to mitigate the adverse effects of these events. Accordingly, as governments abide by the former, they formulate their national contributions and make national plans appropriately backed up with regulations. Every country, depending on its resources, vulnerability to climate change events, reliance on fossil fuels, among other factors, formulates their own scheme to achieve their environmental, nationwide goals. In this regard, the CCLIMMA model presents a framework that exposes the connections and interactions between two of the most important policy goals: GHG emission reductions and renewable energy developments.
The left-hand side of the model framework represents the conventional cap-and-trade mechanism of carbon markets, whose primary goal is the reduction of GHG emissions. While caps are often imposed by state laws—mostly after national ratification of international protocols such as the Kyoto Protocol–domestic trading schemes (such as those implemented in China and South Korea) usually mimic the Kyoto Protocol’s Emissions Trading System (ETS). Thus, a well-developed policy regulation enables the creation of a market and allow the trading of carbon credits.
However, carbon trading schemes have a lower impact on emission reductions than originally expected since, like the European Union (EU) ETS, may be subject to market failures. Apart from government well-designed plans and regulations for these schemes, their combination with renewable energy development goals have the potential to bring about promising results. To achieve this, renewable energy projects can be allowed to provide for RECs and/or carbon credits. Together, the increasing demand will generate a volume of RE projects that can be used in GHG inventory or as best available control technology (BACT), helping achieve emissions reduction goals. Hence, both sides of the model (renewable energy and carbon markets) can be jointly capitalized on.
On the right-hand side of the model, the elements to achieve renewable energy developments as well as their interconnection, are presented. There are two main policy tools for renewable energy development, namely the RPS and subsidiary schemes most commonly represented by the FIT–a price-guarantee scheme offered by the government. It can be a fixed pricing schedule with periodical review or a top-up floating scheme referring to selected benchmarks (e.g., average fossil fuel generation costs) or market prices in liberalized markets. Experience gleaned from markets such as China reveals that price guarantees are not adequate to assure revenue streams for project developers, where curtailment is a severe issue. Other forms of subsidies also include investment tax credits and production tax credits, which are often seen in markets such as the United States.
RPS, on the other hand, empowers authorities to impose a minimum supply of green power onto end-users. This can be in the form of a requirement imposed on operators of fossil-fueled generators, utilities and suppliers (supply side), or major power users (demand side). While it is more common for the supply side to be subjected to such requirements (certain states in the US, China, Korea, major EU markets, Australia and India, for example), some elected to impose such a requirement on end-user demand as exemplified by the recently amended draft of Taiwan’s Renewable Energy Development Act (REDA) [19].
The effect of regulations and tax incentives is bestowed on the generation of renewable energy projects which, in turn, contribute to GHG reductions either by substituting the existing output of fossil-fuel power plants or by replacing the expansion of future fossil-fuel power plants, or a combination thereof. The former pathway is often presented in the form of a REC, whereas the latter is commonly termed as carbon credits under carbon schemes such as CDM. Additionally, carbon credits may be indigenous or imported from abroad.
In line with the goal of reducing emissions, the publication of the GHG Protocol’s Scope 2 Guidance [20], along with other guidelines from other major international NGOs (e.g., Carbon Disclosure Project, The Climate Group) interested in energy uses, galvanizes the global recognition of renewable energy as a form of “low carbon-emission” energy, hence their potential inclusion as low GHG-emission inventory. Furthermore, renewable energy projects can be used in conjunction with BACT to further maximize GHG emission reductions.
China, Japan, and Taiwan all have renewable energy generation, as well as emission reduction goals; thus, they all have policies that aim to meet these two objectives. Nevertheless, they differ in the tools used for the promotion of both: whether they have regulatory caps for emissions, whether they promote renewable energy development under RPS systems, how they issue carbon credits or RECs, and whether they allow the existence of these two simultaneously.

2.2. Regulatory Frameworks

Figure 2a combines current CO2 emissions with avoided emissions from generation of power from renewable sources, and showcases CO2 emissions reduction goals of each case studied. Accordingly, Figure 2b shows current proportion of electricity generated from renewable sources and targeted energy portfolios per each one case study. The development of regulatory frameworks in each of the cases leading to the current status are summarized in the following sub-sections.

2.2.1. China

In 1995, the Chinese government enacted the Electricity Law, signaling its intention to encourage and support the development of renewable energy. In 2005, China promulgated the Renewable Energy Law to restructure its renewable energy portfolio and projecting new goals, and to further address specific issues such as grid connectivity for electric power generation, formulation of technical aspects with product specifications, industry guidance and technical support, and electricity price management and cost apportionment. Moreover, the Renewable Energy Law requires grid operators to link renewable energy generating equipment to the grid. They are also required to purchase all renewable energy electricity that is generated.
In August 2007, the Chinese National Development and Reform Commission (NDRC) released the Medium and Long-Term Development Plan for Renewable Energy, which superseded the previous timetable and objectives of renewable energy development. The Plan empowered each governmental office and committee in the program to formulate an implementation project plan highlighting the developmental objectives. In addition, prices and cost-apportioning policies were also introduced, coupled with increasing financial investments, and tax incentives. As of 2016, data shows that the total renewable energy capacity installed in China amounted to 570 million kW, accounting for 34.6% of the nation’s total energy capacity. Generation capacity of electricity from renewable sources reached 1.45 trillion kWh, accounting for 24.1% of the sector’s total [33].
To meet the revised goal of reducing CO2 emissions per unit of GDP by 60–65% by 2030 using 2005’s level as a baseline, China’s Finance Ministry, in conjunction with the NDRC and the National Energy Administration (NEA), issued the “Interim Measures for the Management of Additional Subsidies for Renewable Energy Electricity Price” that enacted the implementation of an on-grid FIT subsidy policy. From 2012 until 2017, there has been a total of seven reported additional subsidies for renewable energy. In the structure of the policy, the NDRC determines the subsidy standards for renewable energy electricity generation projects and FIT volumes in relation to key factors such as renewable energy FIT electricity prices and desulfurized coal standard electricity pricing [36,37].
With the increasing financial pressure posed by electricity pricing subsidies, the NDRC has repeatedly lowered the FIT of renewable energy such as wind power and solar power. Currently, the renewable levies imposed on end users represent the only source of funding to subsidize renewable energy electricity generation projects in China. With the current subsidy system, the subsidy gap for renewable energy in China is projected to have surpassed CN¥ 300 billion by 2020. In order to mediate the widening subsidy gap, in January of 2017, three Chinese bureaus jointly issued the Notice for the Trial Implementation of the Renewable Energy Electricity Green Energy Certificate Approval and the Issuance Voluntary Subscription Trading System. The policy specifically highlights the “Two Parts” of electricity pricing; whereby “Electricity Pricing Subsidies” can be in the form of “Green Certificates,” thus making prices within the market more competitive. By the end of November 2017, about 8 million green certificates were issued, and about 21,000 certificates were effectively traded, accounting for less than 0.03% of the tradable volume. In terms of the green certificate prices, the average price of each green certificate ranged from CN¥ 157 to CN¥ 686, from October to November of 2017 [38]. This represents a significant underachievement when compared to other certificates circulating in the market, such as the International Renewable Energy Certificates (I-RECs).

2.2.2. Japan

Japan introduced the RPS in order to accelerate the development of renewable energy in early 2003. After the Fukushima Nuclear Power Plant incident in 2011, Japan made substantial changes to its energy policies and started to promote renewable energy industrial development. In July 2012, via the Renewable Energy Special Measures Act, Japan launched its version of the FIT scheme that requires the government to buy electricity from renewable sources for the next 20 years at a fixed rate. The Act also legalizes a tax to be levied on electricity to provide a source of funds to reallocate funds for purchasing electricity.
In April 2017, Japan implemented the Amendments to the Renewable Energy Special Measures Act, revising the FIT scheme in the following areas: (i) instituting a new system that verifies the operators’ ability to implement power generation activities; (ii) adopting new methodology to determine the price of the tariffs; (iii) building a system that ensures the long term stability of electric power generation, and (iv) revising the tax exemption system for large consumption users such as manufacturers. Besides, the FIT electricity procurement obligations were altered to transition the jurisdictional status of traditional retail operators to electricity transmission and distribution operators [39].
Up to late 2017, the total installed capacity of Japan’s renewable energy is 9.8 GW, which accounts for 3.6% of total installed generation capacity. The total output of renewable energy accounted for 14.5% in 2016 [40]. In light of the initiatives from climate change conferences, Japan imposed a national target for 2030 that would reduce GHG emission by 26% compared to the levels of 2013; that is a reduction of 25.4% compared to 2005. It is expected that, by 2030, the total generating capacity of renewable energy will have accounted for 22% to 24% of the total [28], and that nuclear energy will have accounted for 20–22% [28].
In November 2000, a private company, “Japan Natural Energy Company Limited”, proposed the establishment of a commercial green electricity certificate system. By 2008, the Green Energy Certification Center, Japan (GECCJ) was established as a branch for economic energy research; a separate entity independent from electricity companies, owners and buyers. Its main responsibilities are related to management, verification and developmental planning for Green Energy Certificates, Japan (GECJ). The GECCJ has issued more than 2.7 million MWh worth of GECJs, and more than 2.6 million MWh were traded from 2008 to 2017 [41].

2.2.3. Taiwan

Taiwan’s economy is particularly reliant on its industrial activities and best known for its information and communication technology (ICT) industry. With the growing energy demand for its economic development, Taiwan now faces steep challenges with its limited energy capacity and portfolio that has historically been heavily dependent on imported fossil-based feedstock [42]. Its effort to promote renewable energy started as early as 1992 when a succession of subsidy schemes for methane, solar-powered electricity, and wind-generated electricity was developed and implemented. Thereafter, the passage of the Articles for Renewable Energy Development in 2009 implemented a FIT system to ensure that renewable energy was being purchased [19]. This FIT scheme mandated Taipower Company, the sole energy provider in the monopolized energy market, to purchase renewable energy electricity at prices determined on a yearly basis by authorities who would factor in renewable energy equipment aspects such as technology, cost, and policies. The purchasing rates must be higher than the average cost of generated electricity from fossil fuels, thus ensuring the economic competitiveness of renewable energy.
Despite being politically absent from the Kyoto Protocol, Taiwan has been active in GHG reduction, out of the necessity for Taiwan-based businesses to remain competitive in the international trade market. In 2015, Taiwan formally committed to achieving a GHG reduction goal of 50% less than the emission levels in 2005 (baseline year) by 2050 as stipulated by the enactment of GHG Reduction and Management Act (GGRMA) [43], and an energy portfolio comprising of at least 20% renewable energy, less than 30% coal-fired capacity, and less than 50% gas-combustion capacity by 2025, all while phasing out nuclear power plants. This transition represents a significant change from the existing energy portfolio with about 75% of total installed capacity [44] (and 82% of the total electricity [45]) from thermal generation in 2016. Taiwan’s Executive Yuan also calls for a drastic increase in the total installed renewable energy capacity from 1.7 GW in 2017 to 20 GW by solar power plants and another 5.5 GW by offshore wind farm by 2025 [35]. Therefore, increasing installed capacity and transitioning from coal-based to renewable-based energy portfolio, have become the primary goals of reforming the Taiwanese energy structure [46].
The new legislative instruments, mainly the GGRMA in 2015 and the amendment to the Electricity Act in 2017, provide the necessary legal framework for Taiwan to enable the transformation of the energy market [43,47] and to accelerate the GHG reduction by the industrial sector. The change aims to transform a monopolized, vertically-integrated supplier model to a market-driven model, decoupling the market functionality into discrete sectors of power generation, transmission and distribution, and retailing. The liberation of energy market is seen as a necessary step to boost renewable energy capacity and incentivize major GHG emitters in Taiwan to reduce GHG by restructuring their power consumption strategies. As noted, the industrial sector was responsible for 47.8% (equivalent to 119.8 MtCO2e) of total CO2 emissions in 2016. Of these carbon emission sources, 66.7% was attributed to emissions from purchased electricity (79.9 MtCO2e). The data implies that energy-intensive industrial manufacturers in Taiwan, primarily consuming electricity, are the major GHG emitters in the Scope 2 category of GHG inventory.
When selecting market regulations to aid in the liberalization of the electricity industry, the Taiwanese government agency issued the Voluntary Green Power Pilot Program (VGPPP) in 2014 to set up voluntary green electricity application subscription channels that are accessible to the public. The green electricity revenue accumulated from this Program is then channeled back into a renewable energy development fund for FIT renewable energy expenditures and reward schemes. However, with “green” electricity and “traditional” electricity combining into a unified power grid, the end users who are legally required to purchase green electricity and connected to Taiwan’s power grid were unable to verify the amount of green electricity they had purchased to meet either business needs or regulatory demand. This loophole eventually led to the termination of the program after only three years of its implementation. In place of the VGPPP, the same agency adopted the international renewable energy certification (REC) system and rolled out its own version, called Taiwan REC (or T-REC) in 2017, with each certificate representing a value of 1000 kWh of renewable electricity. According to Taiwan’s Renewable Energy Certification Center, as of May 2018, a total of 29,339 T-RECs have been issued, while only 448 certificates have been traded [48].

3. Results

This section will present how the CCLIMA model enacts by examining the paths taken in each of the studied cases to achieve the GHG emission reduction goals, in relation to the operation of their carbon and renewable energy markets (Figure 3). To facilitate the discussion, Table 1 and Table 2 provide a summary of the key characteristics of these markets and the instruments adopted to sustain them, respectively.

3.1. China Case Study

Under the proclaimed policy goals of GHG reductions and renewable energy development, China launched its pilot domestic carbon scheme starting with 7 regional markets in 2013. Through the years up until today, China has developed into the largest renewable consuming country in the world, with the largest installed capacity and output on the back of the steepest growth rate by far.

3.1.1. A Stagnant Chinese Carbon Market

Under the cap-and-trade scheme, emitting installations receive allowances (represented in the incoming thick “Allowances” line in Figure 3a) at zero cost equal to the volume of total emissions in the previous year, after subtraction of the required reductions. Emitting installations are expected to reduce emissions either through facility upgrades, scale-down of manufacturing output, and purchase of allowances and reduction credits.
China does not allow credit imports (depicted with a dashed “Import from abroad” line in Figure 3a to represent the lack of thereof), partially owing to the collapse of the international carbon market. The Chinese Certified Emissions Reduction (CCER) pilot scheme, at the time of its implementation, was expected to replace the EU ETS and become the largest carbon market in the world. However, this has not yet happened and there is no clear sign of the way forward. The Chinese government announced its ambition to create a national carbon market from 2018. Experiences learnt from pilot regional markets give mixed signals and do not bode well for the Chinese carbon market.

3.1.2. [Renewable] Energy Market Facing Development Hurdles

The condition of renewable energy development in China is shown in the right-hand side of Figure 3a. China started its subsidies in the form of floating FIT (premium on top of fossil fuel generation costs as a benchmark) since late 2000’s. The development of modern renewable energy (mainly onshore wind, solar PV and recently offshore wind) under such monetary incentive scheme resulted in a record-breaking growth rate and a world-leading status in terms of total installed capacity (thick arrow from “FIT” to “RE Projects” denotes large volume quantity).
The inherent vulnerability of FIT is the financial burden of subsidies building up through time and the excessive length of commitment timeframes. Standard power purchase agreements (PPAs) with FIT range from 10 to > 20 years. The expanding and long-term financial burden of subsidies further pushed down the level of FITs, and disincentivized potential further development.
Along the progress of renewable development, the adjacency of generation and consumption started to face geographical segregations. Naturally, renewable energy resources are mostly likely located in remote regions away from densely populated metropolises. Consequently, electricity generated by renewable energy faces severe market barriers for wheeling and cross-region trading from incomplete and biased market conditions.
The Chinese government launched a pilot Green Electricity Certificate scheme in July of 2017 and a draft of RPS for public consultation in March of 2018. The goal is to launch RPS/REC to gradually replace FIT; in Figure 3a, the dotted line in RPS reflects that it has not been implemented yet. The shortfalls in subsidies will climb to US $30.2 billion by 2020.
Meanwhile, delays in receiving subsidies are also exceeding 12 months. This is the reason why the government launched the REC market mechanism in 2018, as represented with a medium-size arrow in the Figure 3a, in the hopes of diverting the financial burden to power users.
On the right-hand side of Figure 3a, the large FIT bubble shows that the scale of subsidies in the form of FITs is substantial. These have served as an effective policy tool to boost the growth of renewable energy installations, which were included in GHG Inventory; the thick arrows in the middle of Figure 3a show how RE Projects contribute to the achievement of the two national goals: increase proportion of RE and reduction of GHG emissions.
Regarding carbon markets in China, the pilot carbon markets learnt the experiences of market operations with cap and trade primarily on allowances. The cap has not been very aggressive, and the feasibilities of China’s pilot emission trading system are inconsistent throughout the years of its implementation. However, it has been fairly successful overall, in reducing GHGs, as represented by weak solid lines on the left-hand side of Figure 3a. It is worth noting that RE projects contribute with the issuance of large quantities of carbon credits (thick arrow), but few are traded domestically (thin arrow). Most of the Chinese carbon credits are exported through CDM projects.

3.2. Japan Case Study

3.2.1. Carbon Market: Weak with Mandatory Cap Missing

Since the ratification of the Kyoto Protocol in February of 2005, Japan has never implemented mandatory reduction measures domestically (represented by the dotted arrow between “CAP” and “Trade” in Figure 3b). It also has never transferred the commitment to the Kyoto Protocol to the private sector. The Japanese government purchases AAU (Assigned Allowance Units) to meet this goal, mainly from Eastern European countries (indicated by the thick “Import from abroad” incoming arrow for Carbon Credits in Figure 3b). These countries had substantial surpluses of AAUs due to the collapse of USSR and subsequent economic downturn. Japan was also one of the major CDM credit purchasing countries in the world. The large arrows for “Import from abroad”, “Carbon Credits” to “Trade”, and “Achievement” in Figure 3b represent that the measures taken by Japan eventually helped achieve its goals under the Kyoto Protocol.
With public and private resources dedicated to credit imports, Japan was on the track to meet its commitment by 2012. However, the unexpected turn of event with the Fukushima accident in 2011 jeopardized Japan’s reduction goal under the Kyoto Protocol. With the shutdown of all nuclear power plants in the ensuing months, Japan’s total emissions in 2011 rose by 6% compared to 2010. Japan was also one of the first nations to announce its withdrawal from the joining Kyoto Protocol after UNFCCC’s Conference of the Parties in Cancun Mexico in December 2010. Instead, Japan initiated several GHG reduction cooperation schemes domestically, regionally, and internationally with bilateral agreements with more than 20 countries. However to date, none of these efforts have been scaled up.
Under the Paris Agreement, Japan has a national determined contribution (NDC) of a 26% GHG reduction goal from 2013 to 2030. Japan is expected to meet this goal through its internal cooperation scheme (Joint Crediting Mechanism). Nevertheless, for a mature and developed economy like Japan, the reduction opportunities based solely on domestic soil will be technically and financial difficult. Furthermore, as Figure 3b suggests, it is also expected that the missing link between GHG emission reductions and cap will continue to be missing, while the reduction goal will have to largely rely on credit imports, either through international cooperation or direct purchase.

3.2.2. Renewable Energy Market: Regaining Momentum with FIT but Lacking a Market Mechanism

Japan launched a FIT scheme in 2012; it was one of the last OECD countries that adopted such policy while Germany already started to phase it out. Japan’s renewable energy installations, especially solar PV, tripled from 2013 to 2017 under a very solid FIT scheme. This is represented by the thick arrow from “FIT” to “RE Project” in Figure 3b.
Observing the issues such as the growing financial burden from accumulating the required budget for FIT through the lives of projects, Japan launched its “RPS+REC” scheme in May of 2018, aiming to ensure a market-oriented approach for sustainable renewable energy development. While it will be subjected to further examination (dashed lines in Figure 3b), such market approach sets Japan on track to include the private sector for financial support and aligns the interests of various industries.
Following the introduction of FIT schemes (in 2012), Japan started to witness a decrease in GHG emissions (medium-size achievement arrow on the left-hand side of Figure 3b), even though there was no domestic enforcement mechanism.
The case in Japan proved again that FIT schemes are an effective policy tool in boosting the development of renewable energy. In Figure 3b, the grey arrows in the middle indicate the achievement of renewable energy development into GHG reduction, measured through GHG inventory. The weak links between renewable markets and carbon markets also indicate the untapped market mechanisms that could be adopted for economic efficiencies.

3.3. Taiwan Case Study

With the enactments of laws and regulations on GHG reductions, renewable energy developments, and power sector liberalization, Taiwan is set to enter a new era of climate market mechanisms.
While related legislation is in place, implementations and integrations within and among related governmental agencies will still need substantial efforts. Each regulation is established through comprehensive consultations and debates inside and outside parliament; thus, it is unavoidable to see bias and emphasis on certain aspects. The long-term goal is to reach a regulatory framework, which will enforce synergy and ensure that no regulations are reinforced in a way that diminishes or undermines other policy goals.

3.3.1. Carbon Market: Imbalanced Supply and Demand, and Delayed Schedule

At the time when the GGRMA was enacted in 2015, there was almost no activity in the market and the review procedure for project registry was lengthy. Even after its enactment, the GGRMA has not been able to accelerate the timeline of achieving reduction targets, resulting in a very limited progress towards reaching GHG reduction goals by 2020. This stagnancy is reflected on the left-hand side of Figure 3c showing the proclaimed cap has not been able to contribute to GHG reductions. The dotted lines show the insignificant trading due to the limited supply of carbon projects. Clearly, there lacked a market mechanism to drive the trading for allowances as there have been in other carbon markets such as the EU and China.

3.3.2. Renewable Energy Market: Phasing Out FIT in Favor of Market Liberalization Enhanced by RPS

In the enactment of REDA, the economic and financial incentives available to renewable energy project developers have been limited to the FIT schemes, which has served the purpose of spurring the development of renewable power generation vastly in the past decade since mid-2000s (represented by the thick arrow on the right-hand side of Figure 3c).
After the amendment to the Electricity Act in 2017, the power evolution is set to take on a liberalization path and start with green power. Access requests for green power from international businesses contributed to not only the realization of the amendment but also demand for access to green power. The introduction of T-REC in 2017 was intended to meet such demand in line with international practices. T-REC was designed in a way that allows electricity with the underlying RECs to be traded simultaneously among the same parties, known as “bundled” transactions. Further, T-RECs cannot co-exist with FIT for the same unit of underlying green power; project developers must choose either T-REC or FIT.
Market liberalization has always been a challenging path, especially with the termination of subsidies and lifting market restrictions. Project developers tend to rely on subsidies for higher financial revenues, and oftentimes, better risk management in terms of prospective revenue streams. After more than a decade of subsidies and with the partial liberalization of the market, it is essential to end the government’s interventions in order to ensure a healthier market development, even though these interventions are of subsidiary nature rather than imposing limitations.
Taiwan should phase out FIT to ensure the liberalization of the green power market. Meanwhile, it is also important to monitor developments to ensure that the market evolves as intended by supporting policies so that public resources (budget and environment benefits of renewables) will not be distorted due to market malfunctions. The recent passing of the amendment to the REDA (as of May, 2019) that includes a clause to introduce the renewable portfolio standard, may provide the necessary instrument to maintain the market stability.
Such a design not only allows the government to keep a handle on the renewable energy and its future development in the long term, but also leaves a policy instrument for the government to fine-tune the market mechanism for optimal performance.
Figure 3c portrays the current status of the climate markets in Taiwan. It clearly points out the deficiencies discussed above. On the left-hand side, the model indicates that the cap goal is clearly defined in the long run but poorly executed (−2% by 2020), which will not contribute significantly to the building of the carbon market, nor will it induce self-driven reductions from emitting installations. The missing link between the cap and CO2 reduction goal represents this failure.
Taiwan is a very small market in terms of carbon market operations. Due to missing linkage with the international carbon market, the learning curve of the entire Taiwan market has turned out to be flat and expensive. All parties, from authorities to project proponents market players, including those in the certification and accreditation businesses, face the same challenge owing to a lack of scalabilities and efficiencies. The lack of economic scale has led to a slow and uneven carbon market development, and sufficiently explains the missing links and dotted lines on the entire carbon market on the left-hand side of Figure 3c necessary to sustain a carbon market.
The energy market, conversely, has been observing healthy development with the support of FIT. The immediate challenges that lies ahead is the next stage of market-oriented development: the replacement of subsidies by RPS. Particularly, the more liberalized the energy market becomes, the greater the extent of benefits it can produce concerning GHG reduction through GHG inventory (i.e., lower emissions from power generation and grid emission factor). This is important for developed economies like Taiwan, as the primary drivers of GHG reductions are unlikely to be technological advances and facility upgrades.
Strategically, this also implies that Taiwan needs to shift its GHG emission reduction effort towards the high add-value manufacturing (e.g., microelectronics, optoelectronics, precision machinery, biomedical manufacturing) to meet the GHG reductions goals, rather than on restructuring the direct-emitting industry (mostly heavy and energy-intensive industries).

4. Discussion

4.1. Predicament of FIT Schemes

The FIT systems implemented in China, Japan and Taiwan are all faced with the same problem regardless of the size of their economies: the lack of resources to sustain FIT subsidies, which in turn, creates huge economic and financial burdens for the respective governments.
Japan raises funds through the collection of additional electricity charges to the general public, thus apportioning some of the cost to users. With respect to the long-term energy supply and demand outlook, a clear objective highlighting a makeup of 45% of nuclear energy is to be realized by 2030. The Japanese government is attempting to restart nuclear energy plants in the aftermath of the Fukushima events. China’s source of funds is similar to Japan’s, relying on collections from additional charges levied upon renewable energy electricity to end-users for maintaining its FIT system operations.
Besides the capital-related predicaments, the FIT system also impedes liberalization of the electricity market. China has inherent laws, regulations and policies that do not synchronize with the environmental benefits associated with renewable-energy electricity generation. Moreover, the FIT system combines electric power and environmental benefits, when, in fact, they are substantially different and should not be maneuvered to compete in the same market. In the long run, a FIT system will be a hindrance to the liberalization of the electricity market.
The existing trading difficulty of green certificates in China is also indicative of the steep challenge to replace subsidies with green certificates in the immediate future. The high price of green certificates is the underlying reason for the poor market performance and the low incentives for the consideration of electricity consumers. Simultaneously, with reference to the Notice on the Trial Implementation of Issuance and Voluntary Subscription Trading of Green Energy Certificate for Renewable Energy Electricity, it clearly stipulates that green certificates are not allowed to be resold. Thus, green certificates are not able to convey the role or value associated with a commodity within the certificate market.
Taiwan’s funds for renewable energy electricity procurement are derived from a renewable energy development fund. In Taiwan, the VGPPP was similar to the current T-REC. However, due to the lack of strong economic incentives, neither VGPPP nor T-REC has produced the projected level of impact when they were designed and implemented.
Currently, T-REC limits applicants to either renewable energy electricity generation operators, or users with renewable energy equipment in the “self-consumed” confinement. However, renewable energy is rarely “self-consumed” and is entirely unable to meet the T-REC market supply and demand requirements. Moreover, most of the “self-consumed” users demand green electricity. Therefore, these users have little interest in offering up T-RECs to be traded on the market. Currently, both the supply volume (only about 29,000 certificates) and the trading volume (only 448 certificates) are very low. Hence, the certificate system is likely to face a dead-end in the absence of a mechanism to create a positive market driver.
If T-REC or Chinese green certificates persist as a voluntary subscription mechanism without the corresponding regulatory policies to enforce it within the market, such as introducing RPS of renewable energy regulations, the current predicament will continue worsening. However, China’s emerging carbon market gives hope that green certificates can be utilized as an alternative market instrument for energy savings and carbon reductions to mitigate existing adverse factors, such as the grave imbalance between renewable energy electricity generation regions and electricity consumption regions. A defective market adjustment mechanism, the shortage of transmission facilities, and the lack of flexibility within the electric power system have already contributed to the abandonment of wind power and solar power in the western regions of China.
Carbon trading systems, such as the EU ETS introduced in 2005, aim to strengthen efforts to tackle climate change. Besides achieving sizable emissions reductions, they aim to drive improvements in energy efficiency and storage, as well as in emission reduction technologies [52]. However, they may come with flaws. For example, the EU ETS was unable to sustain a high price on carbon allowances, caused high risk of carbon leakage, and most importantly, did not actually help to achieve significant emission reductions [53]. Therefore, carbon trading schemes alone do not suffice for achieving significant emission reductions and should instead be used in conjunction with other policy and market incentive tools to accelerate the growth of renewable energy.

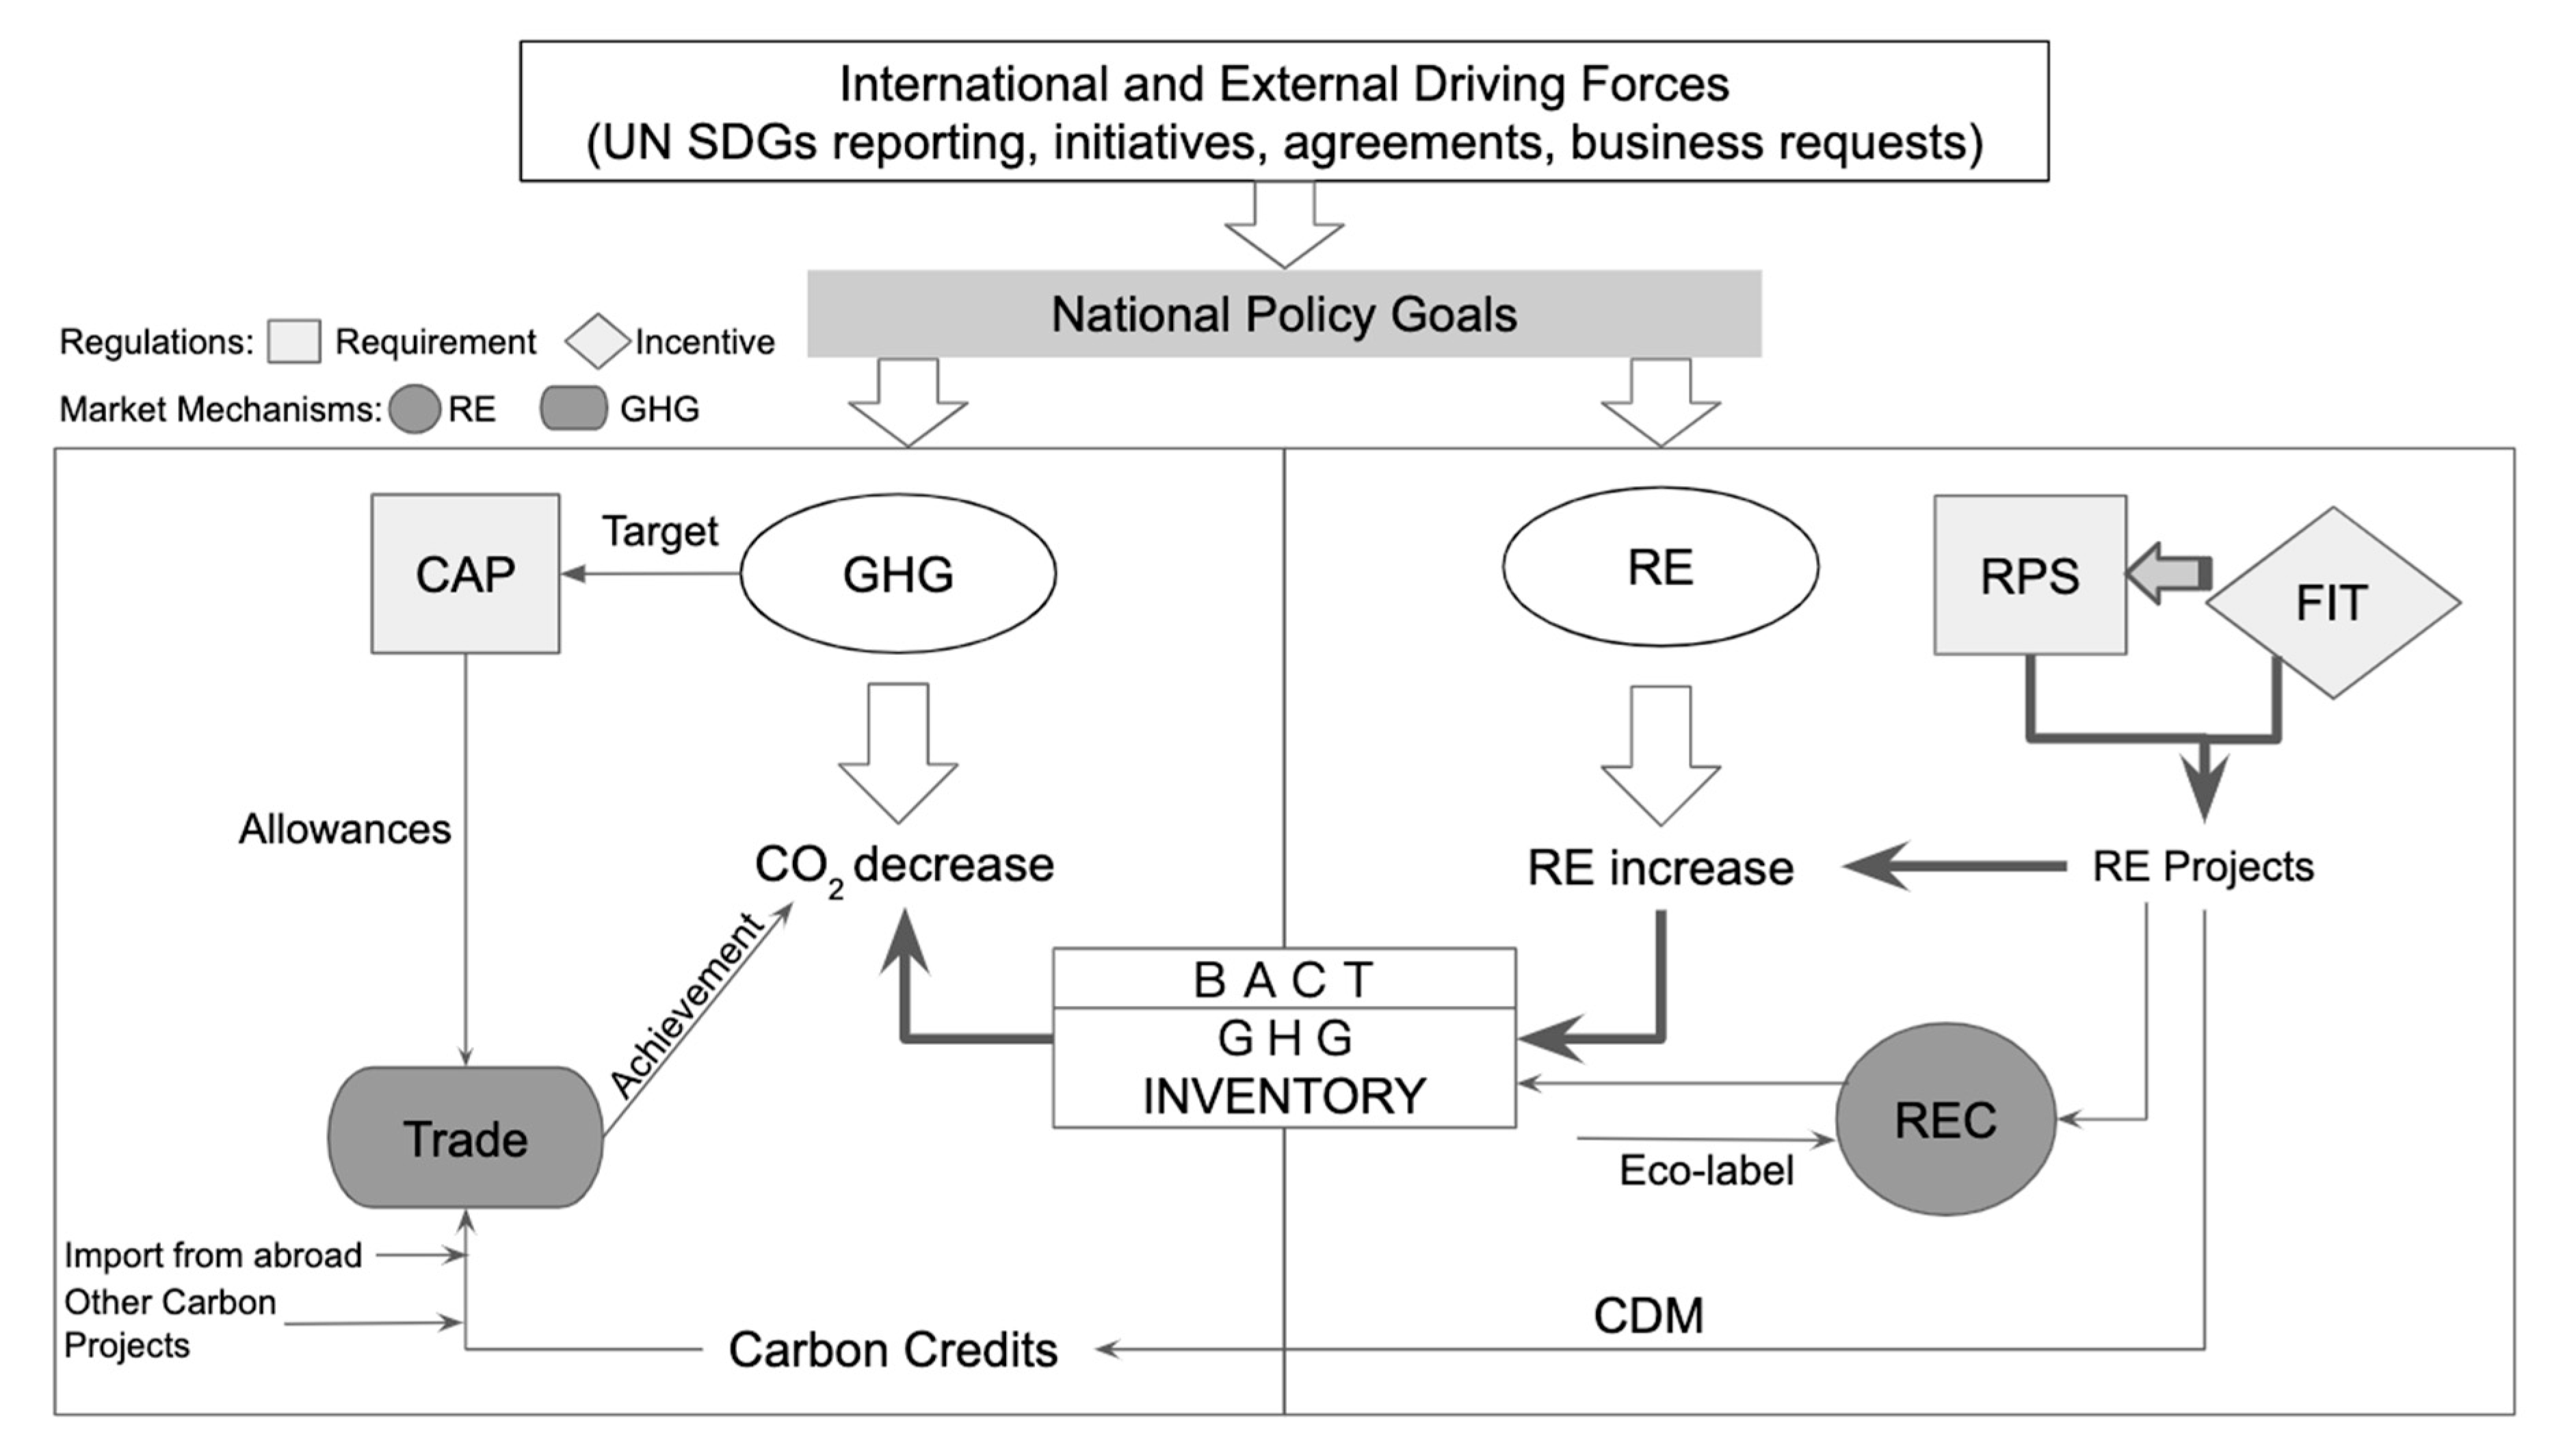
4.2. Description of an Improved Model

In order to meet the worldwide goal of GHG emission reductions, governments should aim to set domestic regulations regarding both renewable energy generation and CO2 emissions reduction. As evidenced in the aforementioned study cases, once the generation of renewable energy has been boosted through economic incentives (represented by FITs in Figure 4), effective growth of the renewable energy market will be achieved only if the government shifts towards setting national renewable energy generation goals (i.e., RPS). In this regard, competition among developers can be expected. The shift from an incentive-based through policy implementation to a market demand-based system is shown by an arrow in the upper right of Figure 4.
Thus, renewable energy developers are given certificates that objectively verify the source of electricity generated, as well as carbon credits that convey the zero-emission nature of renewable energy sources (represented as outcomes of “RE Projects” in Figure 4). Therefore, the creation of both a carbon credit and REC market is possible by allowing the trading of these elements. Furthermore, once the renewable energy market sufficiently matures, the differentiation and an increased economic value of RECs can be obtained through eco-labels. Finally, the increase in renewable energy will lead to a reduced GHG inventory. GHG inventories can be prepared at a national, regional, local, and organizational level. They encompass a detailed inclusion of anthropogenic GHG emissions by sources, as well as removals, accounting for specific time frames and space boundaries [54,55]. As such, they constitute a solid foundation upon which risk management strategies can be drawn, mitigation plans can be designed, policies and regulations can be improved, GHG reduction areas can be pin-pointed, and emissions reduction plans be designed and executed, which consequently will allow for cost reductions in other services [55,56]. Furthermore, detailed information about GHG emissions helps to stimulate awareness and prompt responsible behavior [57].
The ultimate goal of reduced CO2 emissions can be further accomplished if governments promote the use of BACT. Different industries within a country may be required to, or voluntarily choose to, adopt BACT. These are defined as methods, techniques or systems that help achieve the maximum amount of emissions reduction whilst considering environmental, energy, and economic costs [58].
On the other hand, carbon credits can also be imported from abroad, or be obtained through other carbon projects that are different from renewable power generation. As CO2 emissions reduction is sought by the government by the establishment of a cap to national emissions, entities that operate within a country are given free allowances. At the same time, these entities can obtain extra carbon credits and be allowed to trade them. An effective carbon credit market, then, will contribute to the achievement of national GHG emissions reduction goals in the long term. Therefore, the links between renewable markets and carbon markets not only are necessary for the achievement of national goals, but also serve their role for the attainment of economic efficiencies.
To further provide context to the improved model (Figure 4), we examined the potentiality of each studied market moving toward the direction stipulated in the model by assessing the individual components, as shown in Table 3. The four successive “phases” and the scored components are depicted as follows:
RE measures: The first phase starts by examining the components on the top right quadrant. RE development is boosted thanks to the government’s introduction of FITs (“FIT mission accomplishment”). Once RE reaches a certain growth, it is ready to be marketed and the government starts to replace FITs with RPS (“market readiness”). Then, market instruments are introduced (e.g., RECs) to gentrify the market (“introduction of market instruments”). Policies and other market rules will determine their effectiveness (“effectiveness of market instruments”).
GHG measures: Governments set mandatory emissions caps after they have compiled GHG inventories from different industry sectors and analyzed their future growth (“cap formulation readiness”). Based on that, they distribute market instruments such as allowances, carbon rights, offsets, and carbon credits that can be traded (“introduction of market instruments”). Whether this market is effective or not depends on an array of factors comprising policies, government support, control mechanisms, etc. (“effectiveness of market instruments”).
RE and GHG policy synergies: The component “existence of interactions between RE & GHG market instruments” is based on whether the RE and emissions markets are domestically connected and allowed to interact/complement each other. “Connectivity of international markets” refers to import of credits from abroad and CDM projects.
Overall effectiveness: This is an overall look at the current situations of RE and emissions markets in the three studied cases.
It is noteworthy to mention that a fairly positive (or negative) score on factors (phases I through III) does not necessarily determine the overall effectiveness of the market. This observation suggests that promotion of RE and a cap on emissions alone are not enough to achieve significant GHG emissions reductions. Impacts of regulations in different industries, international business, labor, growth and development trends, among other factors, should also be taken into consideration. Nevertheless, the connection and complementarity of RE and emissions should still be prioritized to move toward the ambitious national goals set by these countries.

Author Contributions

Conceptualization, J.C. and H.-L.L.; methodology, J.C. and H.-L.L.; formal analysis, J.C. and H.-L.L.; writing—original draft preparation, J.C.; investigation, A.K.R.; writing—review and editing, A.K.R. and W.D.; data curation, P.-H.L.; supervision, W.D.; project administration, W.D.; validation, W.D.

Funding

This research received no external funding.

Acknowledgments

The authors are grateful of the reviewers who provided constructive comments and insightful viewpoints to help improve the quality of the paper.

Conflicts of Interest

The authors declare no conflict of interest.

References

  1. Roland, F.; Molina, M. Ozone Depletion-20 Years After the Alarm. Chem. Eng. News 1994, 72, 8–13. [Google Scholar]
  2. Velders, G.J.; Andersen, S.O.; Daniel, J.S.; Fahey, D.W.; McFarland, M. The importance of the Montreal Protocol in protecting climate. Proc. Natl. Acad. Sci. USA 2007, 104, 4814–4819. [Google Scholar] [CrossRef]
  3. Shin, S. Developing country’s perspective on COP3 development (Kyoto Protocol). Energy Policy 1998, 26, 519–526. [Google Scholar] [CrossRef]
  4. Iwata, H.; Okada, K. Greenhouse gas emissions and the role of the Kyoto Protocol. Environ. Econ. Policy Stud. 2014, 16, 325–342. [Google Scholar] [CrossRef]
  5. Lashof, D.A.; Ahuja, D.R. Relative contributions of greenhouse gas emissions to global warming. Nature 1990, 344, 529. [Google Scholar] [CrossRef]
  6. Price, L. Voluntary Agreements for Energy Efficiency or Ghg Emissions Reduction in Industry: An Assessment of Programs Around the World; Sage Publications: Thousand Oaks, CA, USA, 2005. [Google Scholar]
  7. Lau, L.C.; Lee, K.T.; Mohamed, A.R. Global warming mitigation and renewable energy policy development from the Kyoto Protocol to the Copenhagen Accord—A comment. Renew. Sustain. Energy Rev. 2012, 16, 5280–5284. [Google Scholar] [CrossRef]
  8. Teeter, P.; Sandberg, J. Constraining or enabling green capability development? How policy uncertainty affects organizational responses to flexible environmental regulations. Br. J. Manag. 2017, 28, 649–665. [Google Scholar] [CrossRef]
  9. Ecofys. Mapping Carbon Pricing Initiatives Developments and Prospects 2013; World Bank: Washington DC, USA, 2013; p. 94. [Google Scholar]
  10. Nejat, P.; Jomehzadeh, F.; Taheri, M.M.; Gohari, M.; Majid, M.Z.A. A global review of energy consumption, CO2 emissions and policy in the residential sector (with an overview of the top ten CO2 emitting countries). Renew. Sustain. Energy Rev. 2015, 43, 843–862. [Google Scholar] [CrossRef]
  11. Sorrell, S. Reducing energy demand: A review of issues, challenges and approaches. Renew. Sustain. Energy Rev. 2015, 47, 74–82. [Google Scholar] [CrossRef]
  12. Jacobson, M.Z.; Delucchi, M.A.; Cameron, M.A.; Frew, B.A. Low-cost solution to the grid reliability problem with 100% penetration of intermittent wind, water, and solar for all purposes. Proc. Natl. Acad. Sci. USA 2015, 112, 15060–15065. [Google Scholar] [CrossRef]
  13. Johnstone, N.; Haščič, I.; Popp, D. Renewable energy policies and technological innovation: Evidence based on patent counts. Environ. Resour. Econ. 2010, 45, 133–155. [Google Scholar] [CrossRef]
  14. Falconett, I.; Nagasaka, K. Comparative analysis of support mechanisms for renewable energy technologies using probability distributions. Renew. Energy 2010, 35, 1135–1144. [Google Scholar] [CrossRef]
  15. Cox, S.; Esterly, S. Renewable Electricity Standards: Good Practices and Design Considerations; National Renewable Energy Lab (NREL): Golden, CO, USA, 2016.
  16. Yan, Q.; Zhang, Q.; Yang, L.; Wang, X. Overall review of feed-in tariff and renewable portfolio standard policy: A perspective of China. In Proceedings of the IOP Conference Series: Earth and Environmental Science, Banda Aceh, Indonesia, 21–22 August 2019. [Google Scholar]
  17. Fang, D.; Zhao, C.; Yu, Q. Government regulation of renewable energy generation and transmission in China’s electricity market. Renew. Sustain. Energy Rev. 2018, 93, 775–793. [Google Scholar] [CrossRef]
  18. China Steps Up Its Push Into Clean Energy. Available online: https://www.bloombergquint.com/china/china-sets-out-new-clean-energy-goals-penalties-in-revised-plan (accessed on 24 November 2018).
  19. Renewable Energy Development Act. Available online: https://law.moj.gov.tw/ENG/LawClass/LawAll.aspx?pcode=J0130032 (accessed on 24 November 2018).
  20. Sotos, M. GHG Protocol Scope 2 Guidance. An Amendment to the GHG Protocol Corporate Standard; World Resources Institute (WRI), in association with the World Business Council for Sustainable Development (WBCSD): Washington DC, USA, 2015; p. 120. Available online: https://ghgprotocol.org/sites/default/files/standards/Scope%202%20Guidance_Final_Sept26.pdf (accessed on 14 November 2019).
  21. Myllyvirta, L. Guest Post: Why China’s CO2 Emissions Grew 4% during First Half of 2019. Available online: https://www.carbonbrief.org/guest-post-why-chinas-co2-emissions-grew-4-during-first-half-of-2019 (accessed on 23 October 2019).
  22. Yang, X.J.; Hu, H.; Tan, T.; Li, J. China’s renewable energy goals by 2050. Environ. Dev. 2016, 20, 83–90. [Google Scholar] [CrossRef]
  23. Vaughan, A. China is on Track to Meet Its Climate Change Goals Nine Years Early. Available online: https://www.newscientist.com/article/2211366-china-is-on-track-to-meet-its-climate-change-goals-nine-years-early/ (accessed on 23 October 2019).
  24. China Country Summary. Available online: https://climateactiontracker.org/countries/china/ (accessed on 23 October 2019).
  25. China 14th FY Development Plan for Renewable Energy. Available online: http://www.cresp.org.cn/index.php?m=content&c=index&a=show&catid=20&id=380 (accessed on 28 September 2019).
  26. Progress of China‘s Power Industry Carbon Emissions Trading Market—China’s Power Industry‘s 2018 Emission Reduction Officially Released. Available online: http://www.tanjiaoyi.com/article-26959-1.html (accessed on 23 October 2019).
  27. Japan‘s Energy 2018, 10 Questions for Understanding the Current Energy Situation. Available online: https://www.enecho.meti.go.jp/en/category/brochures/pdf/japan_energy_2018.pdf (accessed on 15 September 2019).
  28. Japan‘s Energy Plan 2015. Available online: https://www.enecho.meti.go.jp/en/category/brochures/pdf/energy_plan_2015.pdf (accessed on 14 September 2019).
  29. 2018 Taiwan National Greenhouse Gas Emissions Inventory Report. Available online: http://unfccc.saveoursky.org.tw/2018nir/uploads/00_nir_full.pdf (accessed on 23 October 2019).
  30. Greenhouse Gas Phase Control Target. Available online: https://ghgrule.epa.gov.tw/greenhouse_control/greenhouse_control (accessed on 26 October 2019).
  31. Power Generation Report (By Year). Available online: https://www.moeaboe.gov.tw/ECW/populace/web_book/WebReports.aspx?book=M_CH&menu_id=142 (accessed on 25 September 2019).
  32. 2018 Electricity Emission Factor. Available online: https://www.moeaboe.gov.tw/ecw/populace/content/ContentDesc.aspx?menu_id=6989 (accessed on 23 September 2019).
  33. Data List of 2016 National Electric Industry. Available online: http://www.cec.org.cn/guihuayutongji/tongjxinxi/niandushuju/2018-03-21/178791.html (accessed on 23 September 2019).
  34. China 13th Renewable Energy Development Five Year Plan (2016–2020). Available online: https://www.iea.org/policiesandmeasures/pams/china/name-161254-en.php? (accessed on 26 September 2019).
  35. Energy Policy Plan Report. Available online: https://www.ey.gov.tw/File/FA89BE915504DBD8/311ed920-9788-499d-87ff-7d665b870a77?A=C (accessed on 23 September 2019).
  36. Medium and Long-Term Development Plan for Renewable Energy. Available online: http://www.martinot.info/China_RE_Plan_to_2020_Sep-2007.pdf (accessed on 10 September 2018).
  37. Ming, Z.; Ximei, L.; Na, L.; Song, X. Overall review of renewable energy tariff policy in China: Evolution, implementation, problems and countermeasures. Renew. Sustain. Energy Rev. 2013, 25, 260–271. [Google Scholar] [CrossRef]
  38. Ng, E. Why China’s Costly Green Energy Certificate Has Not Helped Cash-Strapped Renewable Energy Firms. South China Morning. Available online: https://www.scmp.com/business/commodities/article/2116131/why-chinas-costly-green-energy-certificate-has-not-helped-cash (accessed on 10 September 2018).
  39. Umeda, S. Japan: Renewable Energy Special Measures Act Amended. Available online: https://www.loc.gov/search/?in=PartOf%3Alaw+library+of+congress&q=Japan+renewable+energy (accessed on 14 November 2019).
  40. Japan’s Energy, 20 Questions to Understand the Current Energy Situation (2017 Edition). Available online: https://www.enecho.meti.go.jp/en/category/brochures/pdf/japan_energy_2017.pdf (accessed on 23 October 2019).
  41. Ito, Y. A Brief History of Measures to Support Renewable Energy; The Institute of Energy Economics: Tokyo, Japan, 2015. [Google Scholar]
  42. Chan, D.Y.-L.; Yang, K.-H.; Hsu, C.-H.; Chien, M.-H.; Hong, G.-B. Current situation of energy conservation in high energy-consuming industries in Taiwan. Energy Policy 2007, 35, 202–209. [Google Scholar] [CrossRef]
  43. Greenhouse Gas Reduction and Management Act. Available online: https://law.moj.gov.tw/ENG/LawClass/LawAll.aspx?pcode=O0020098 (accessed on 3 October 2019).
  44. Installed Capacity. Available online: https://www.moeaboe.gov.tw/ECW/english/content/ContentLink.aspx?menu_id=1540 (accessed on 26 October 2019).
  45. Power Generation. Available online: https://www.moeaboe.gov.tw/ECW/english/content/ContentLink.aspx?menu_id=1540 (accessed on 26 October 2019).
  46. Chang, C.-T.; Lee, H.-C. Taiwan‘s renewable energy strategy and energy-intensive industrial policy. Renew. Sustain. Energy Rev. 2016, 64, 456–465. [Google Scholar] [CrossRef]
  47. The Electricity Act. Available online: https://law.moj.gov.tw/ENG/LawClass/LawAll.aspx?pcode=J0030011 (accessed on 26 October 2019).
  48. T-REC E-paper, September 2019. Available online: https://www.trec.org.tw/epaper/download/2019-09 (accessed on 26 October 2019).
  49. Chinese NDRC and BOE Jointly Issued a Renewable Energy Power Consumption Guarantee Mechanism! Tibet Was Not Assessed! Individual Provinces have Defined Renewable Energy Consumption Obligations! Available online: https://www.in-en.com/article/html/energy-2279877.shtml (accessed on 22 October 2019).
  50. Non-Fossil Value Trading Market. Available online: https://www.renewable-ei.org/pdfdownload/activities/4-2_ManabuNabeshima_JP.pdf (accessed on 22 October 2019).
  51. Yin, Y.-H. Big Power Users Subject to Renewable Energy Regulations. Taiwan’s 500 Large Power Users Should Use 10% of Renewable Energy in the Next 5 Years. Available online: https://www.storm.mg/article/1794785 (accessed on 22 October 2019).
  52. D’Adamo, I. The profitability of residential photovoltaic systems. A new scheme of subsidies based on the price of CO2 in a developed PV market. Soc. Sci. 2018, 7, 148. [Google Scholar] [CrossRef]
  53. Gerbeti, A. Mercati Ambientali. Available online: http://www.treccani.it/enciclopedia/mercati-ambientali_%28Enciclopedia-Italiana%29/ (accessed on 17 September 2019).
  54. Revised 1996 IPCC Guidelines for National Greenhouse Gas Inventories. Available online: https://www.ipcc-nggip.iges.or.jp/public/gl/invs4.html (accessed on 3 October 2019).
  55. Li, Y.; Du, W.; Huisingh, D. Challenges in developing an inventory of greenhouse gas emissions of Chinese cities: A case study of Beijing. J. Clean. Prod. 2017, 161, 1051–1063. [Google Scholar] [CrossRef]
  56. D’Avignon, A.; Carloni, F.A.; La Rovere, E.L.; Dubeux, C.B.S. Emission inventory: An urban public policy instrument and benchmark. Energy Policy 2010, 38, 4838–4847. [Google Scholar] [CrossRef]
  57. Marchi, M.; Pulselli, F.M.; Mangiavacchi, S.; Menghetti, F.; Marchettini, N.; Bastianoni, S. The greenhouse gas inventory as a tool for planning integrated waste management systems: A case study in central Italy. J. Clean. Prod. 2017, 142, 351–359. [Google Scholar] [CrossRef]
  58. Leonard, R.L. Best Available Control Technology. In Air Quality Permitting; Routledge: Abingdon, UK, 2018; pp. 65–80. [Google Scholar]
Figure 1. Consolidated climate markets mechanism analysis (CCLIMMA). Abbreviations: CAP, regulatory cap on emissions; GHG, greenhouse gas emissions; RE, renewable energy; RPS, Renewable Portfolio Standard; BACT, Best Available Control Technology; REC, renewable energy certificate; CDM, Clean Development Mechanism.
Sustainability 11 06478 g001
Figure 2. Potential of renewable energy for emissions reductions (a) and share of renewable-sourced electricity in current and targeted energy portfolios (b). Notes: 1 China: total emissions in 2016 accounted for 9,899 MtCO2 [21]. Total emissions for 2030 were based on China’s GHG reduction goal (reduce CO2 emissions per unit of GDP by 60–65% by 2030, [22]), and estimated from [23,24]. Avoided emissions from renewable energy generation were calculated by multiplying renewable energy generation in 2016 [25] by coal CO2 emission factor [26]. 2 Japan: total emissions in 2017 accounted for 1292 MtCO2 [27]. Japan plans to reduce emissions by 26% based on 2013 levels by FY 2030 [28]. Avoided emissions from renewable energy generation: renewable-sourced electricity (2017) [27] times coal CO2 emission factor from [28]. 3 Taiwan: total emissions in 2016 accounted for 293 MtCO2e [29]. Taiwan aims to reduce CO2 emissions by 10% by 2025 based on 2005 levels [30]. Avoided emissions from renewable energy generation: renewable-sourced electricity (2016) [31] times electricity emission factor for the same year [32]. 4 Avoided emissions from renewable energy generation for 2030 were not included to avoid double-counting of emissions. 5 China: electricity from renewable sources accounted for 24.1% of the sector’s total in 2016 [33]. China aims to source 20% of non-fossil energy in total primary energy consumption by 2030 [22,34]. 6 Japan: electricity from renewable sources accounted for 16% of the sector’s total in 2017 [27]. Japan aims to generate 22–24% of electricity from renewable sources by 2030 [28]. 7 Taiwan: in 2016, 4% of electricity was generated from renewable sources [31]. Taiwan aims to generate 20% of electricity from renewable sources by 2025 [35].
Sustainability 11 06478 g002
Figure 3. CCLIMMA model of (a) China, (b) Japan, (c) Taiwan, as of June 2018. Abbreviations: FIT, feed-in tariff; CDM, Clean Development Mechanism.
Sustainability 11 06478 g003
Figure 4. Improved CCLIMMA model based on the success and failure experienced in the cases illustrated in Figure 3.
Sustainability 11 06478 g004
Table 1. Comparison of the carbon markets and renewable energy markets in the studied cases.
Study CasesCarbon MarketRenewable Energy Market
China
  • Emission allowances are distributed to emitting installations.
  • Credit imports are not allowed.
  • Ambitions to create a national carbon market.
  • Non-ambitious cap.
  • System was successful in reducing GHG emissions
  • Although RE projects generate considerable amount of carbon credits, few are domestically traded.
  • Massive growth of RE installed capacity driven by FITs.
  • Slowed RE development due to decreasing FIT amounts.
  • FITs to be replaced by RPS/REC system.
  • RE projects help achieve emission reduction targets in China.
Japan
  • No domestic reduction measures (absence of cap and trade mechanism).
  • Internal and international cooperation (credit imports) as means to achieve reduction goals.
  • Solid FIT scheme pushed RE projects development.
  • RPS+REC scheme launched to open up power market to the private sector.
  • RE projects helped achieve GHG emission reductions through their inclusion in GHG inventory.
Taiwan
  • Although a cap was set, it did not drive GHG reductions nor did it contribute to the creation of a carbon market.
  • Limited trade of credits due to lack of carbon projects.
  • Lack of market mechanism.
  • In addition to the small market size of Taiwan, the absence of international connection led to a lack of scalabilities and efficiencies for all market players.
  • RE development possible through FIT scheme.
  • Legal framework for power market liberalization introduced.
  • REC system coexists with FITs yet project developers can only choose one.
  • RPS introduced.
  • RE development can be tapped on in order to achieve further GHG emission reductions.
Table 2. Summary of REC system implemented, and the RPS and BACT guidelines practiced in the cases studied.
Cases.RECRPSBACT
Certificate SystemType of Projects
ChinaChinese Green Electricity Certificate, C-GECOnshore wind and solar PV
  • Power grid companies are subject to different provincial RPS. Examples:
    -
    In Beijing, grid companies must provide 10.5%, 13.5%, and 15% of renewable-sourced electricity in 2018, 2019, and 2020, respectively.
    -
    In Chinghai, grid companies must provide 19%, 23%, and 25% of renewable-sourced electricity in 2018, 2019, and 2020, respectively [49].
Individual specifications for BACT in thermal power generation, pulp and paper, steel, cement, textile, pharmaceutical, leather tanning, fertilizers, petrochemical, and coking industries, are available in guidelines. These guidelines provide details about technical and management requirements for compliance based on emission standards.
International Renewable Energy Certificate, I-RECOnshore wind, solar PV, hydro
JapanJapanese Green Electricity Certificate, J-GECSolar, wind, hydro, geothermal, and biomass
-
44% of electricity commercialized by power retailers should be from non-fossil sources. This regulation is to be implemented from 2030 and it is targeted to power retailers whose commercialized power volume exceeds 500 GWh [50].
In Japan, BAT specifications are available for key industries such as iron and steel, chemical, pulp and paper, cement, energy generation, oil, gas, among others.
J-CreditsProjects that reduce or increase absorption of GHG emissions
Non-fossil Value Certificates, NFCsRenewable energy projects receiving and not receiving FITs
TaiwanTaiwan Renewable Energy Certificate, T-RECWind, solar, and biomass
  • Power users whose power consumption exceeds 5000 kW should procure 10% of electricity from renewable sources *
* According to BOE, this regulation will be officially announced in late 2019 [51].
The BACT stipulated in the Air Pollution Prevention Law includes the following:
-
Use of less polluting raw materials and fuels
-
Implementation of low-pollution processes
-
Installation of air pollution, emission control devices
-
Installation/use of other pollution reduction technologies as stipulated by other government agencies.
I-RECHydro
Table 3. Three studied cases assessed against variables to measure their potentiality for (or against) the improved CCLIMMA model scenario (Figure 4). The number of “+” signifies the intensity of force driving toward the stipulated objective, whereas the number of “-“ indicates the intensity of force pulling from reaching the objective.
FactorsChinaJapanTaiwan
I. RE measures
1. FIT mission accomplishment+++++
2. Market readiness+++
3. Introduction of market instruments+++++
4. Effectiveness of market instruments---+---
II. GHG measures
5. Cap formulation readiness+++++++++
6. Introduction of market instruments+++++---
7. Effectiveness of market instruments++-----
III. RE & GHG policy synergies
8. Existence of interactions between RE & GHG market instruments---+---
9. Connectivity to international markets++---
Overall effectiveness
10. Effective markets++--+

