Article

Effects of Soil Properties and Illumination Intensities on Matric Suction of Vegetated Soil

1
Key Laboratory of Geological Hazards on Three Gorges Reservoir Area (China Three Gorges University), Ministry of Education, Yichang 443002, China
2
Key Laboratory of Mountain Hazards and Earth Surface Process, Institute of Mountain Hazards and Environment, CAS, Chengdu 610041, China
3
CAS Center for Excellence in Tibetan Plateau Earth Sciences, Chinese Academy of Sciences, Beijing 100101, China
4
China-Pakistan Joint Research Center on Earth Sciences, Islamabad 45320, Pakistan
5
University of Chinese Academy of Sciences, Beijing 100049, China
*
Authors to whom correspondence should be addressed.
Sustainability 2019, 11(22), 6475; https://doi.org/10.3390/su11226475
Submission received: 27 September 2019 / Revised: 14 November 2019 / Accepted: 15 November 2019 / Published: 18 November 2019
(This article belongs to the Special Issue Water Resources and Green Growth)

Abstract

:
Matric suction induced by evapotranspiration is an important parameter for determining the hydraulic mechanisms of vegetation on slope stability. Despite evapotranspiration closely associated with atmospheric parameters and soil conditions, the influence of soil properties and illumination intensities on matric suction of vegetated soil has so far received the least research attention. In this paper, three kinds of soil, namely, fine sandy loam, sandy silt, and silty clay, were selected as experimental soils, and Indigofera amblyantha was chosen as the test plant. The test conditions were controlled, such as the use of homogeneous soil and uniform plant growth conditions. Each specimen was exposed to identical atmospheric conditions controlled in a laboratory for monitoring matric suction responses over 10 days. The results showed that illumination intensities play an important role in evapotranspiration, and the thermal energy from lighting had a direct impact on plant transpiration, whereas the lighting only affected plant photosynthesis. Plant roots in vegetated soil can effectively improve the air intake value of soil, and matric suction induced by plant transpiration in vegetated soil was 1.5–2.0 times that of un-evapotranspirated soil. There is a correlation between matric suction and the silt and clay contents, and the matric suction of silty clay was sensitive to changes in the soil moisture content. Compared to fine sandy loam, the water retention of sandy silt and silty clay was high, and a high level of matric suction was maintained in the corresponding time. The results for predicting soil water evapotranspiration based on matric suction have theoretical and practical significance for preventing soil erosion and shallow landslides. In addition, these results have great guiding significance for agricultural production, such as irrigation.

1. Introduction

Matric suction is one independent variable that controls the stress-strain characteristics of unsaturated soil [1,2], variations of which change soil properties, such as permeability and shear strength [3,4,5]. Vegetation, as a natural bioengineering method for preventing soil erosion and shallow landslides, has been used widely throughout the world [6,7]. In particular, for shallow slopes with depths of 1–2 m, vegetation is an effective way to enhance slope stability via roots mechanical reinforcement and hydraulics reinforcement [3,8,9,10,11,12]. The analysis of hydrological and mechanical factors influencing vegetated slope stability based on numerical simulation shows that hydraulic reinforcement is prior to that of mechanical effects [13].
Plant transpiration could dramatically affect the temporal-spatial water content distribution in superficially vegetated soil [14,15,16,17]. During the root-water uptaking process, plant roots also absorb water through photosynthesis and respiration and, as a result, induce soil matric suction [18]. Matric suction induced by plant transpiration (hydraulic reinforcement) in vegetated soil can reduce soil permeability [19,20] and increase soil shear strength [4,19,21]. It has been recognized that plant transpiration induces matric suction and is an important mechanism in the stability analysis of soil slopes and riverbanks covered with vegetation [9,16,17,22,23,24,25]. Additionally, plant roots also can change soil hydraulic properties, arguably by altering the soil structure due to root occupancy of the soil pore-spaces [15,17].
Recent studies have revealed that matric suction induced by plant transpiration can be maintained in vegetated soils during and after rainfall [16,24,26,27], whereas the hysteresis of rainfall infiltration appears to have important implications for slope stability [28,29]. For cohesive slopes, vegetated soil can maintain the matric suction within 5–20 kPa in the root zone under one 10-year return period rainfall [24,30] and the matric suction of more than 9 kPa under one 100-year return period rainfall [24,26]. Thus, it is important to quantify matric suction accurately in vegetated soils.
At present, several researches have been performed to study the factors affecting plant growth and soil matric suction. The influence of visible light on plant physiological processes is noticeable [31] and better plant quality was obtained with luminescence lamps [32]. The differences in heat generated by visible light and those of ambient temperature could affect plant growth, and the variations in air temperature are accompanied by the high relative humidity generated by plants [33].
On the other hand, matric suction in vegetated clay soil increases more rapidly under a given evapotranspiration level compared with vegetated sandy soil [34,35]. Slopes with soil types varying from sandy soil to clay soil present different stability results for the same rainfall of uniform intensity [36], and the rate of evolution of matric suction is lower in clay soils than in sandy soils [34,37]. Ultimately, a numerical model was also established based on soil conditions, as well as evapotranspiration and root characteristics, to predict the matric suction distribution in vegetated soil [26,38,39]. In conclusion, plant transpiration may be affected by atmospheric parameters (e.g., relative humidity, air temperature, and radiant energy), soil conditions (e.g., hydraulic conductivity, moisture gradient, and soil particle composition), and vegetation types.
Understanding the influence of soil properties and illumination intensities on soil matric suction during the evapotranspiration process is important to scientifically quantify the hydraulics mechanism of soil reinforcement and slope protection via vegetation. Based on this, the objectives of this study are to (i) measure and compare the response of matric suction to plant transpiration and soil evaporation in vegetated soil; (ii) explore and quantify matric suction variations upon plant transpiration in relation to illumination intensities; and (iii) investigate the matric suction variability by replicates with different soil properties under identical atmospheric conditions.

2. Materials and Test Methods

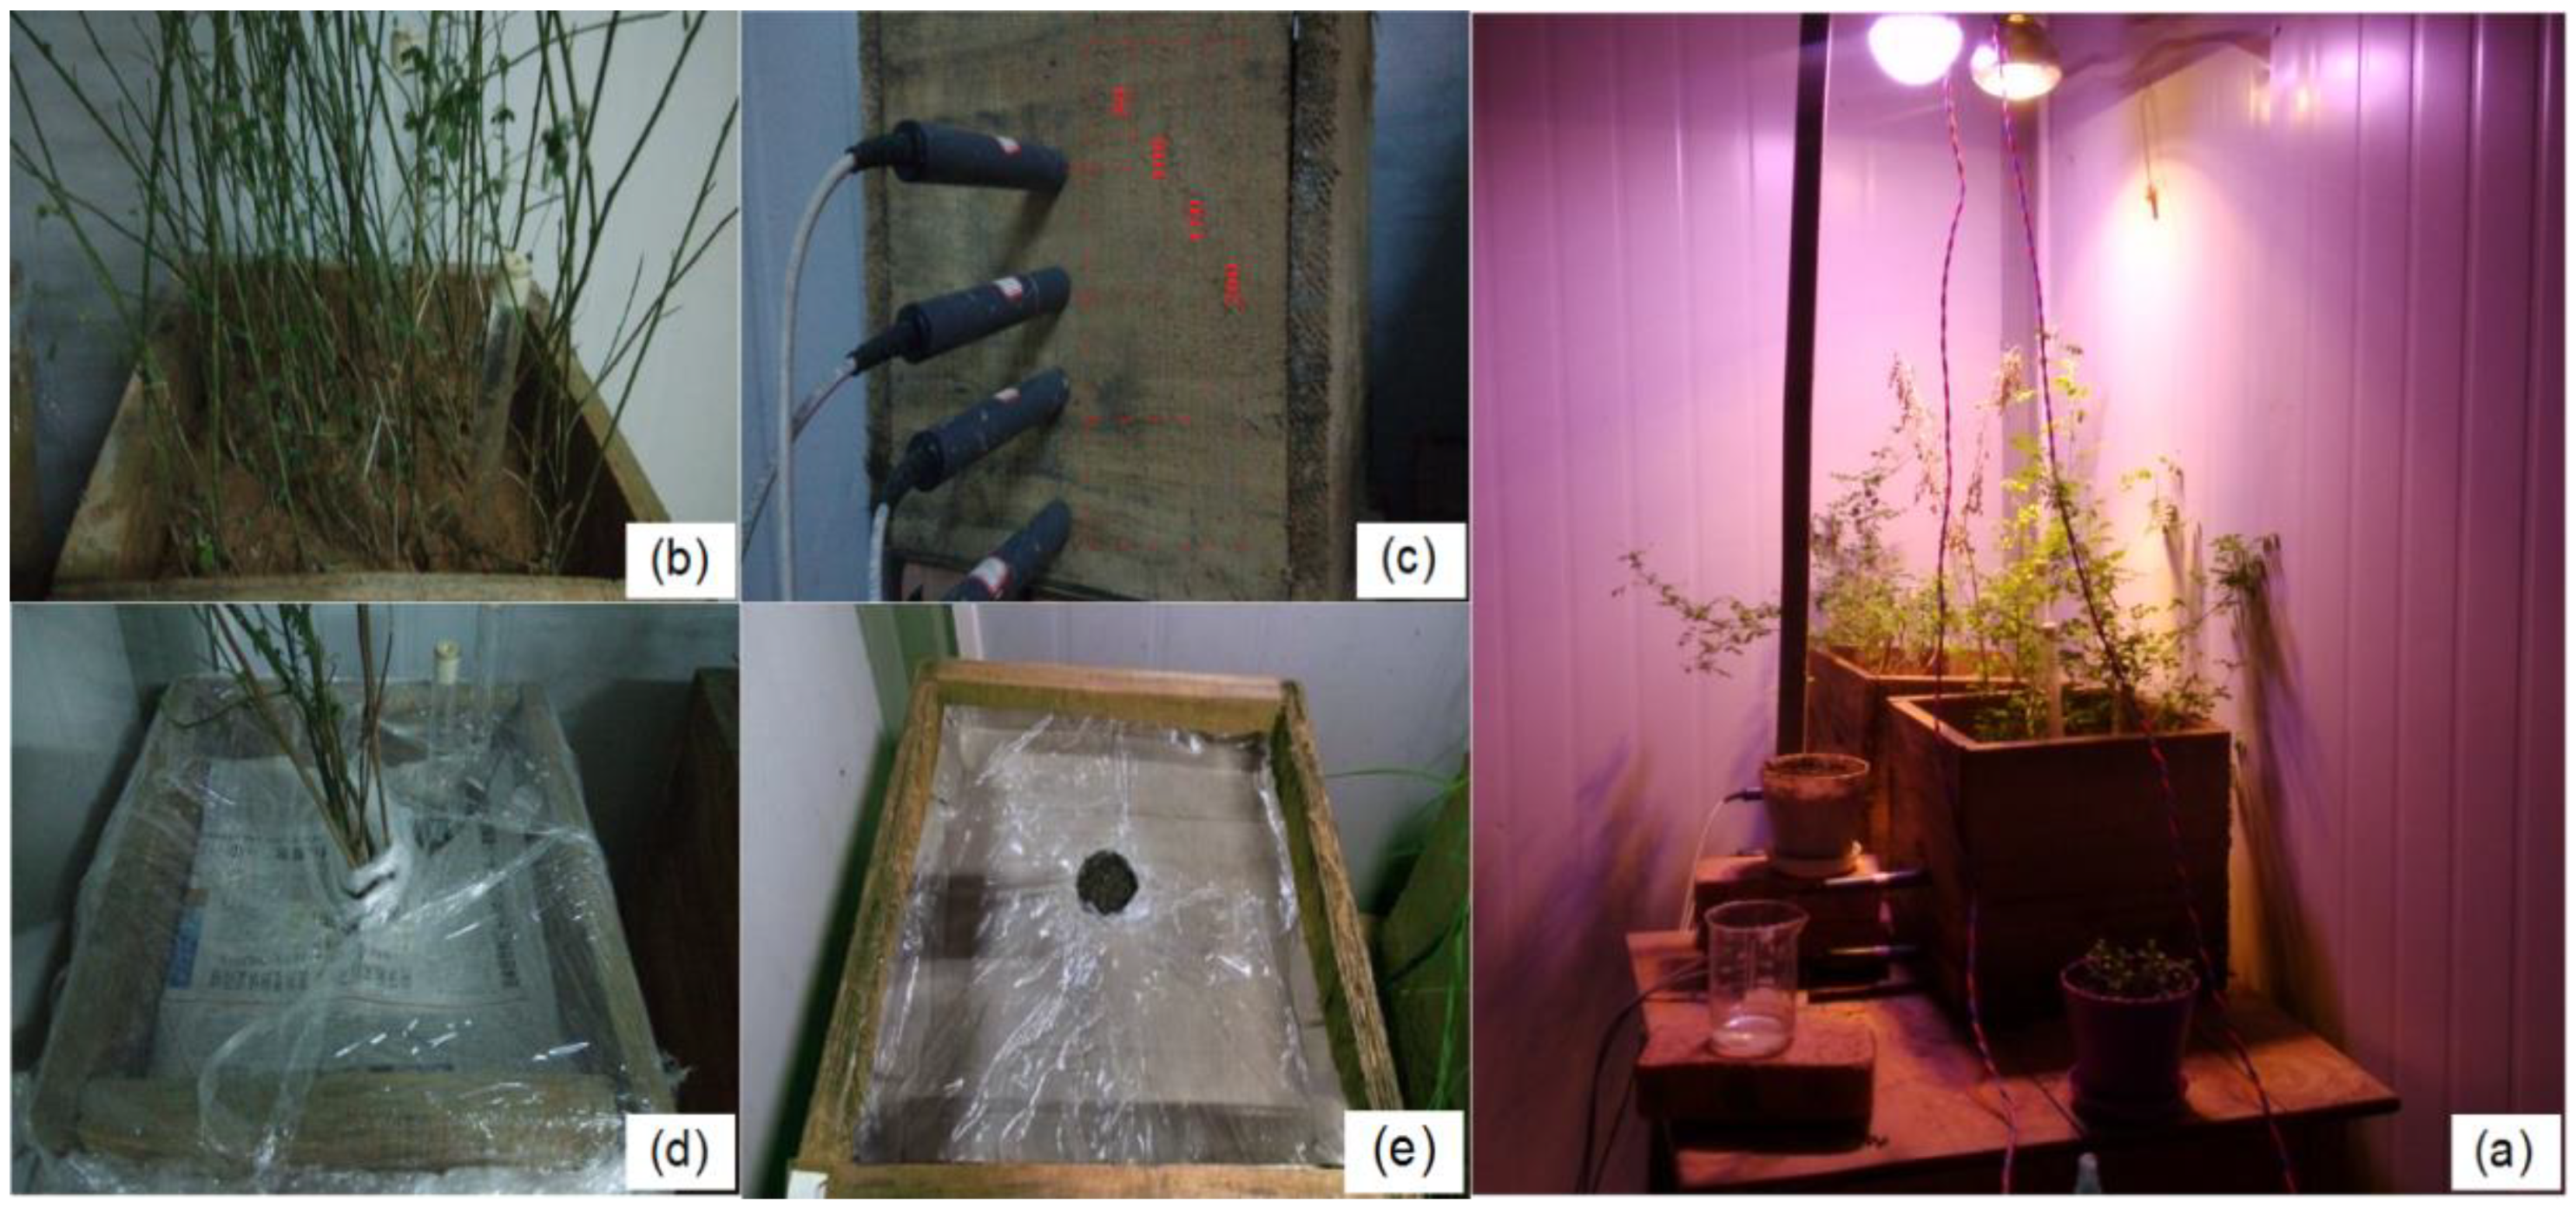
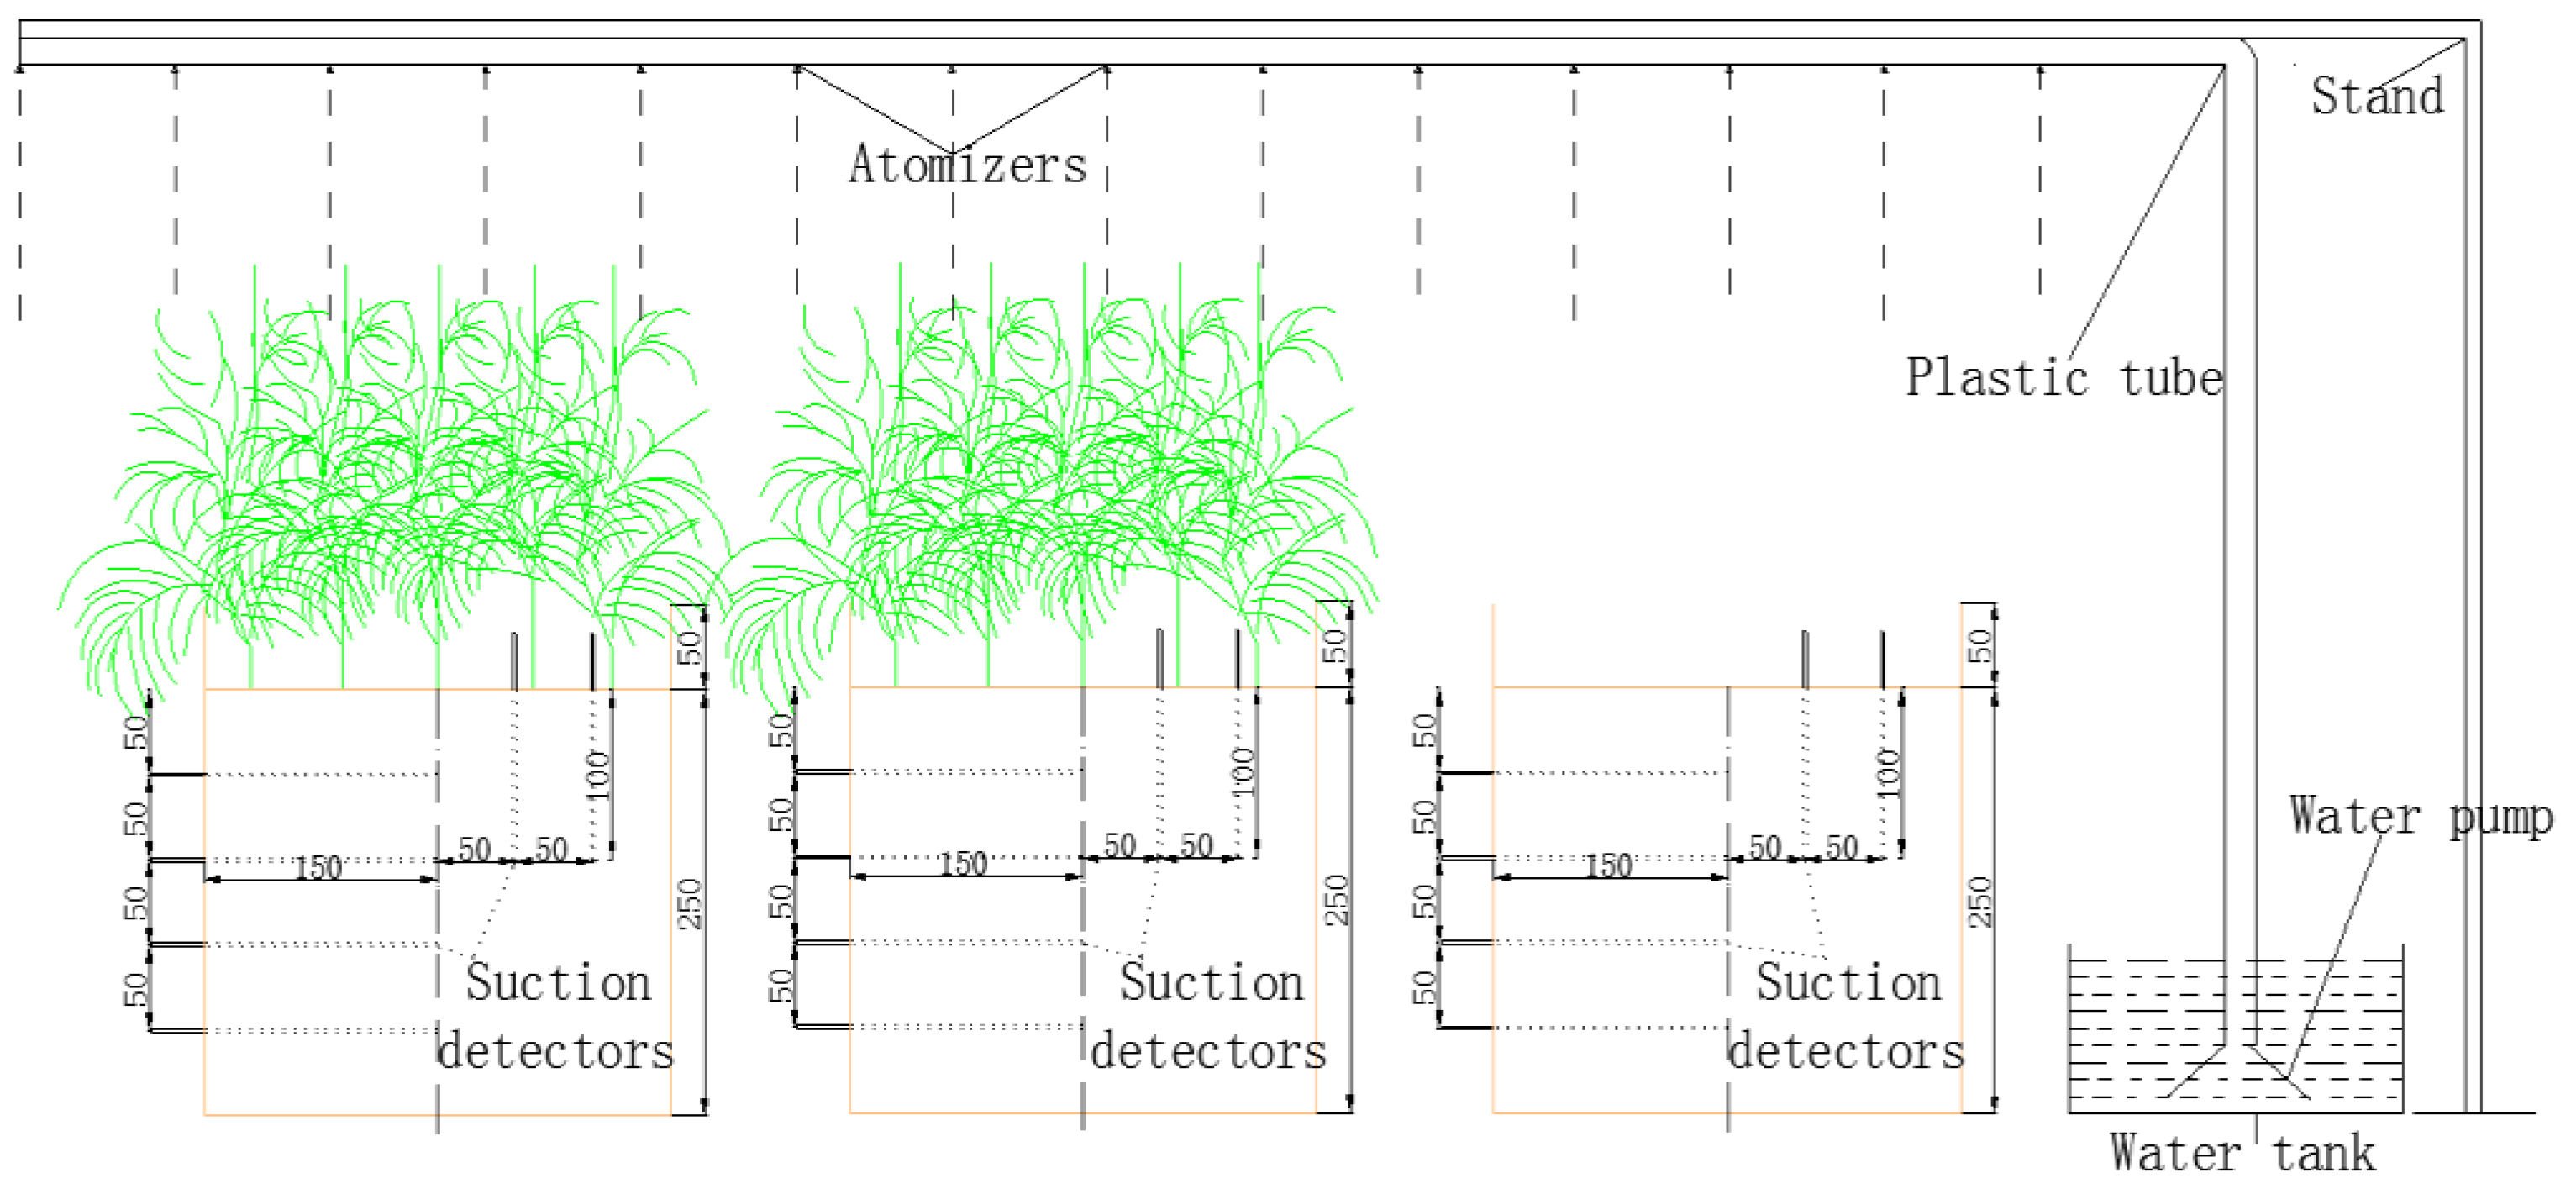
2.1. Materials and Apparatus

The tested soils were taken from a cutting slope on the first phase urban expressway in Xiazhou Avenue in Yichang, China. Tested soils were chosen below the slope surface of 0.3 m, and impurities in the soil were eliminated. The soils were air-dried, crushed, and sieved through a 2.0 mm sieve. After that, the soil particle size distribution was measured by using the wet separation method (Figure 1), and several basic physical properties were tested, such as specific gravity, optimum water content, pH value, plastic limit, and liquid limit (Table 1). According to the Unified Soil Classification System [40], the tested soils can be classified as fine sandy loam, sandy silt, and silty clay, respectively.
Experimental soils were placed in a special plexiglass centrifuge tube, and saturated moisture content was measured. CR21G high-speed centrifuge was used to centrifuge the tested soils, and volumetric moisture content was recorded under various matric suctions at equilibrium state. A total of 15 groups of soil matric suction and volumetric water content data of each soil type were measured, and the Van Genuchten model [41] was used to fit the test data, as shown in Figure 2. In addition, Figure 2 shows that, starting from the near saturation state of the experimental soils, the water content is W s a t . During the process of matric suction gradually increasing to the maximum values, the volumetric water content gradually decreases to W r , that is, residual volumetric water content was obtained when the soil water characteristic curves towards to level, and the fitting parameters are demonstrated in Table 2.
Indigofera amblyantha, the most common soil–water conservation plant in tropical and subtropical regions, was selected as the test plant [42,43]. Indigofera amblyantha is a perennial deciduous shrub with a growing period of approximately six months, and it possesses excellent ability for drought resistance and barren resistance [42].
A SoilTron automatic weighing lysimeter (produced by Beijing EcoTech Ecological technology Co., Ltd. in China) was used in the test, which consists of the multi-layer profile detector and the data collector. The multi-layer profile detector includes soil temperature probes (with a measurement range of −15 °C–50 °C and the error of ±0.3 °C soil moisture probes (with a measurement range of 0–100% and the error of ±1%) and soil matric suction probes (tensiometers for measuring matric suction up to 100 kPa with an error of 1 kPa), all with a diameter of 3 mm and a length of 11 cm. Moreover, the data collector could regularly and automatically collect and record the data from each probe.
The SY-S06 leaf temperature meter, produced by Campbell Scientific Instrument Co., Ltd. (San Jose) in USA is based on the high-precision thermocouple temperature sensor to realize real-time and accurate measurement of temperature difference between leaf and air, with a measurement range of 0 °C–60 °C and the error of ±0.5 °C.
A root scanner (WinRHIZO) (produced by Beijing Ecotech Ecological Technology Co., Ltd., China) was utilized in this test, which consists of an image-capture system and root analysis system. Some root parameters, such as root length, root diameter, root surface area, root volume, and root tip count could be obtained by the image-capture system, and the root analysis system can analyze the morphology, gradation extension, and the entire structure of the root system.

2.2. Test Design and Methods

2.2.1. Test Design

The size of the cubic wooden box used is 300 mm × 300 mm × 300 mm (the diameter of a standard planting barrel of the SoilTron lysimeter is 300 mm in the laboratory). Test soil was placed in the box, and soil height and compactness were 250 mm and 90%, respectively [17,24]. The plants were cultivated in the cubic wooden boxes.
Sandy silt formed by weathered mudstone widely distributes in the Three Gorges Area, for the sandy silt, four specimens of vegetated soil, and two replicates of bare soil were set. Therein, two specimens of vegetated soil in which Indigofera amblyantha grew only in a circle of 100 mm diameter in the center of the box. For both fine sandy loam and silty clay, three specimens were set, one for bare soil (control) and two for vegetated soil. In the planting experiment, there were a total of 12 specimens, and the seeding density of Indigofera amblyantha was 80–100 plants per square meter [24].
The planting experiment was conducted in an open field behind a laboratory at China Three Gorges University. Each specimen was exposed to identical natural conditions of rainfall, temperature, and lighting. The planting period was two years, until the plants reached a stable and mature stage, where the mean height and stem diameter of plants were found to be 93.51 cm and 0.62 cm, respectively.
The vegetated specimens were then moved to an atmosphere-controlled laboratory at China Three Gorges University. The laboratory had a temperature 20 °C ± 2 °C, humidity 50%–60%, illumination height 1m, and illumination intensities of 36 W/m2 and 275 W/m2 were set at those which are the most commonly used in greenhouses for plant growing and heating [12,24]. Energy is required for both plant transpiration and soil evaporation [18,22,23], and illumination was the only energy source used for the soil-vegetation-atmosphere system discussed in this study (Figure 3a).
Four holes of 5 mm diameter and 10 cm depth were created from top to bottom at every 50 mm on the front surface of each planting specimen. A small amount of mud was poured into the bottom of the holes, and then four tensiometers of the lysimeter were inserted into the holes. To ensure the tensiometer is intimately contacted with the surrounding soil, the tensiometers were rotated and some fine soil was filled. The tensiometer is a fluid filled plastic tube with a porous ceramic tip on one end and a vacuum gauge on the other end. When the saturated porous ceramic tip comes into contact with unsaturated soil, a water migration occurs until the balance of water potential between them is reached. And, the negative pressure in vacuum gauge is the matric suction of unsaturated soil. Before installation, the tensiometers were immersed in distilled water for 12 h. After their porous ceramic tip soaked completely, the plastic tubes of the tensiometers were filled with water until the water overflowed, and no bubbles were presented. The tensiometers were replenished with water at 7:00 p.m. every day, and the rubber plugs were then tightened. At the bottom of each test box, there were five drainage holes with a diameter of 5 mm each for free drainage throughout the test. The specimens were uniformly watered before conducting tests until water accumulation occurred on the surfaces of the specimens. Subsequently, and the variations in matric suction at the 5 cm, 10 cm, 15 cm, and 20 cm depths were monitored automatically once every 10 m by the lysimeter under the lighting condition set.

2.2.2. Test Methods

In this study, three series of tests were conducted. The objective of the first test series was intended to compare the contributions of plant transpiration and soil evaporation on soil matric suction, which can be utilized for agricultural production, such as irrigation [10,12]. In this series, three sandy silt specimens (two vegetated soils and one bare soil) were subjected to an identical water evapotranspiration process under the illumination condition of 275 W/m2 in the laboratory (Figure 3b,c). In addition, a soil temperature probe and a soil moisture probe of the SoilTron automatic weighing lysimeter were used to measure the surface temperature and moisture of the specimens within 2 mm depth during the test and the monitoring period was 10 days. The second series of test was to explore the influence mechanism of solely illumination intensities on soil matric suction in vegetated soil. Three sandy silt specimens (two vegetated soils and one bare soil) were exposed to different illumination intensities of 36 W/m2 and 275 W/m2 in the laboratory. For both vegetated soil and bare soil, only a diameter of 100 mm in the center of test boxes was subjected to lighting, and the monitoring period was 10 days (Figure 3d,e).
Soil characteristics (e.g., plastic limit, liquid limit, clay, and silt content) have an important impact on the distribution of soil matric suction and soil–water retention [35,36,37]. The third series of tests was the repetition of the first series, but with the different soil properties as shown in Table 1 and Figure 1, namely, fine sandy loam, sandy silt, and silty clay, and the monitoring period was 10 days. After each specimen was dried in the laboratory, the same initial matric suction was controlled in all specimens, and then the rainfall test was implemented. To simulate rainfall with set intensities and durations artificially, a rainfall simulator was developed. The system consists of a four horizontal plastic tubes (each 8 mm in diameter) connected to a water pump at a water tank. In each tube, there are several atomizers for water over the entire surface of each test box. During the rainfall test, there is a continuous supply of water to the water pump, by adjusting and fixing the atomizers, rainfall intensity can be maintained constant throughout the rainfall test. Before using the rainfall simulator for testing, the uniformity of rain drop distribution over the same cross-sectional area of the test box (300 mm × 300 mm) and the same rain drop height (1000 mm) were examined (Figure 4). Rainfall intensity was set at 80 mm/h according to the average rainfall in the Three Gorges Area, and the duration of rainfall was 100 m. During the rainfall process, the tensiometers of the lysimeter were used to monitor the variation in matric suction.
Plant biomass can significantly affect the soil–water retention curve of vegetated soils and the mechanical reinforcement of plant roots [17,35]. After the above tests, the planting box was disassembled and whole plants were collected. The plants were split into roots, stems, and leaves. Several characteristic parameters of the plants were tested by a root scanner (WinRHIZO, Beijing Ecotech Ecological Technology Co., Ltd., Beijing, China), such as root surface area, root volume, and leaf area. Various plant parts were then oven-dried at a temperature of 60 °C until the dry weights were constant to obtain the plant biomass [25].
Leaf area index (LAI) is defined as the ratio of the total leaf area to the projected area of canopy of plants on the soil surface in horizontal plane. Images of plant leaves were captured by a high-resolution camera and then converted to binary images, and leaf area index was determined by image analysis using an open source software called ImageJ. Root area index (RAI) is defined as the ratio of total root surface area for a given depth range to the circular cross-sectional area of soil in the horizontal plane. The diameter of the circular cross-sectional area of soil is defined by the maximum lateral spread of the root system within a given depth range. The root surface area refers to the total external surface area of all roots within a given soil volume that is captured by the root scanner (WinRHIZO). Root volume ratio (RVR) is defined as the volume of plant roots per unit volume of soil, and root volume is measured by the root scanner (WinRHIZO).

3. Results and Discussion

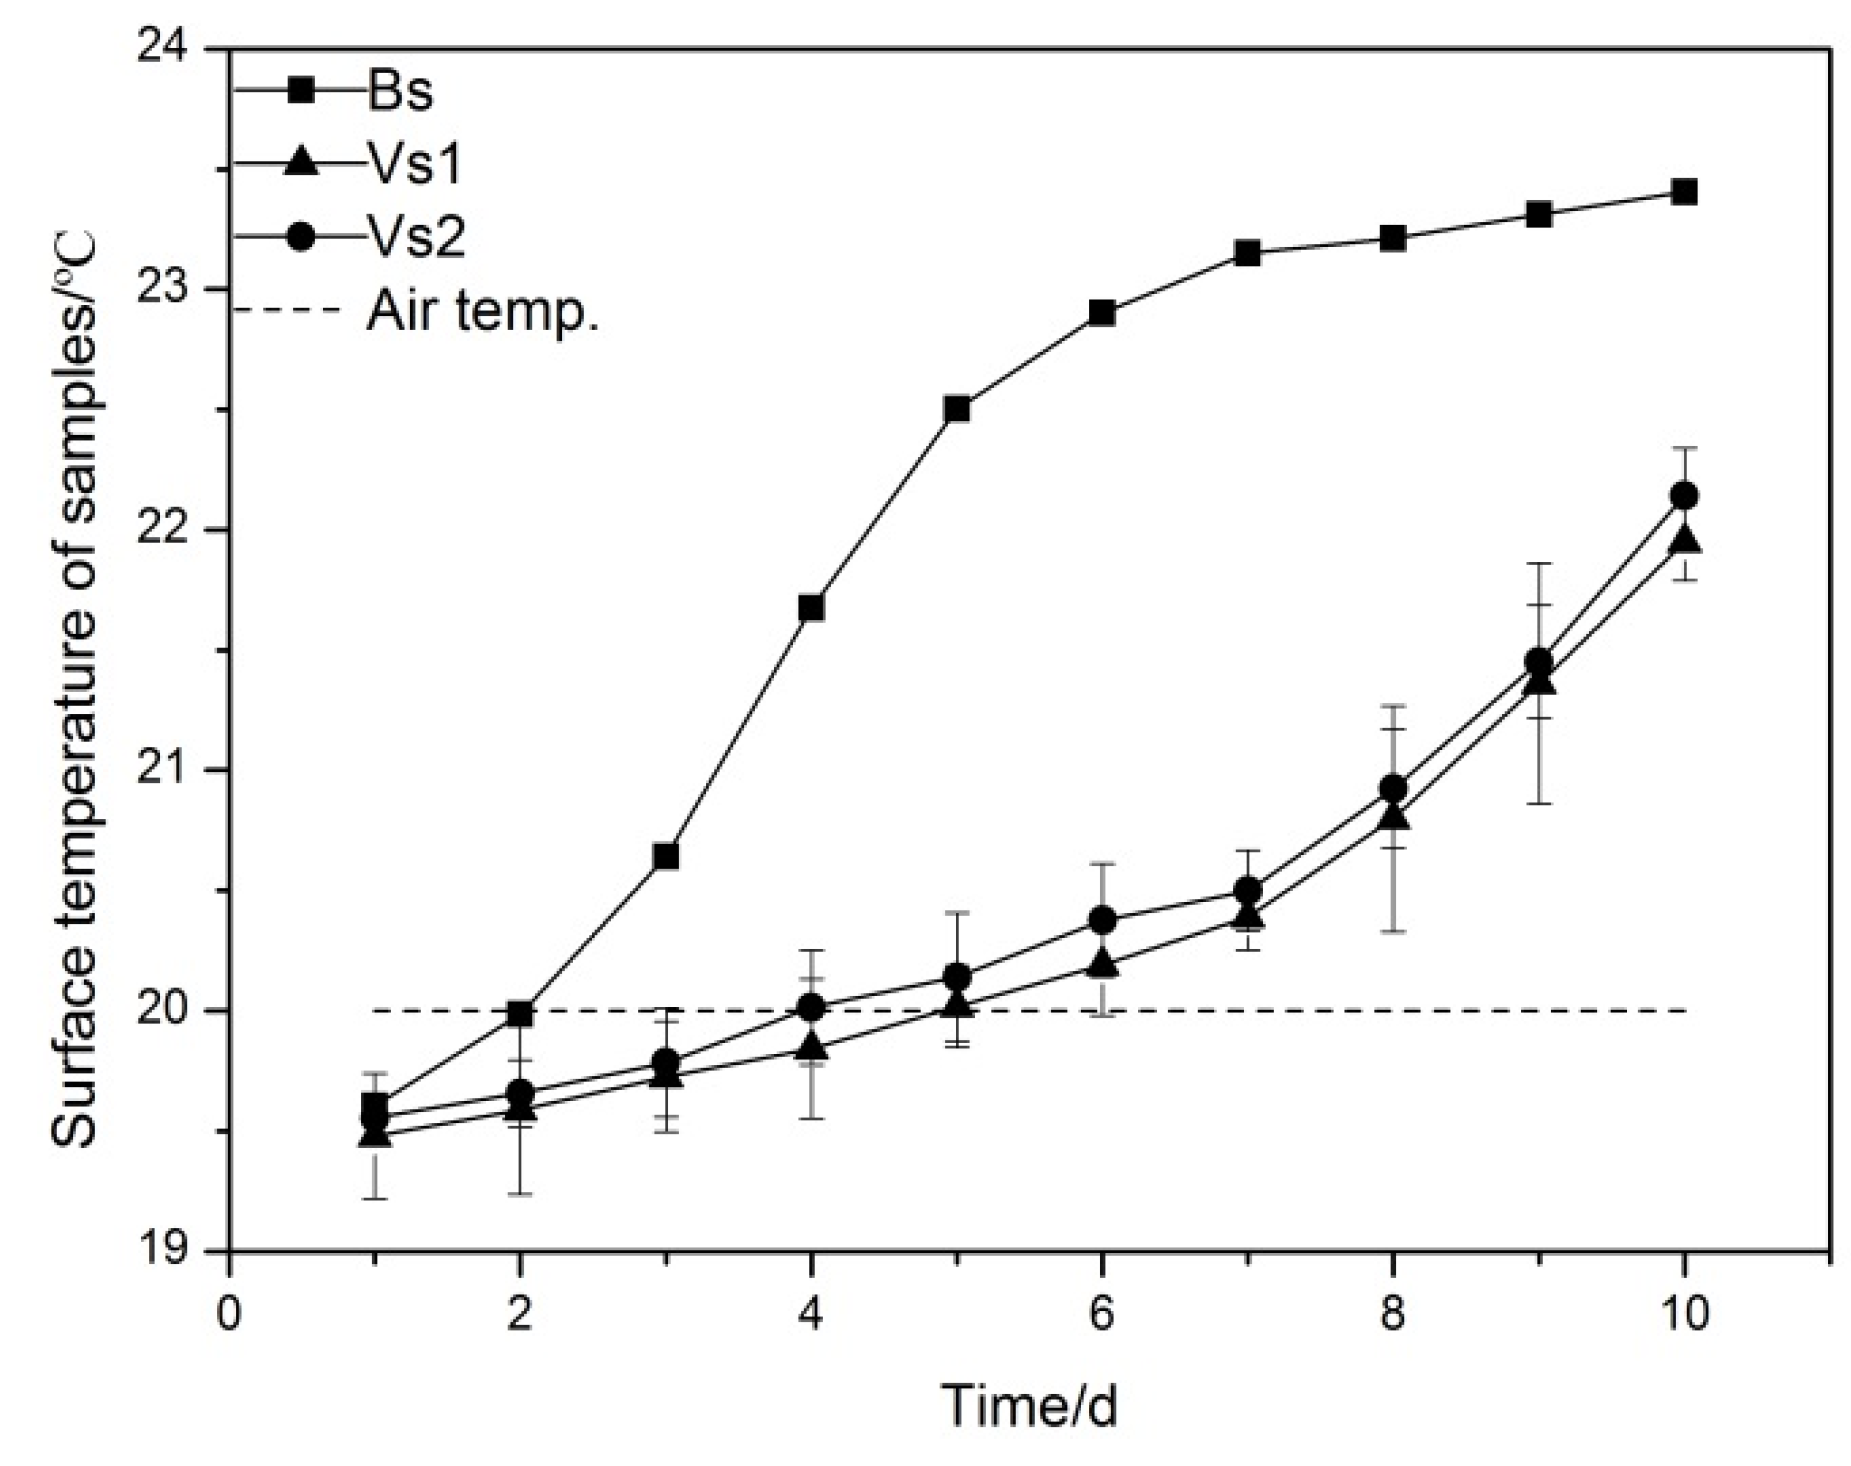
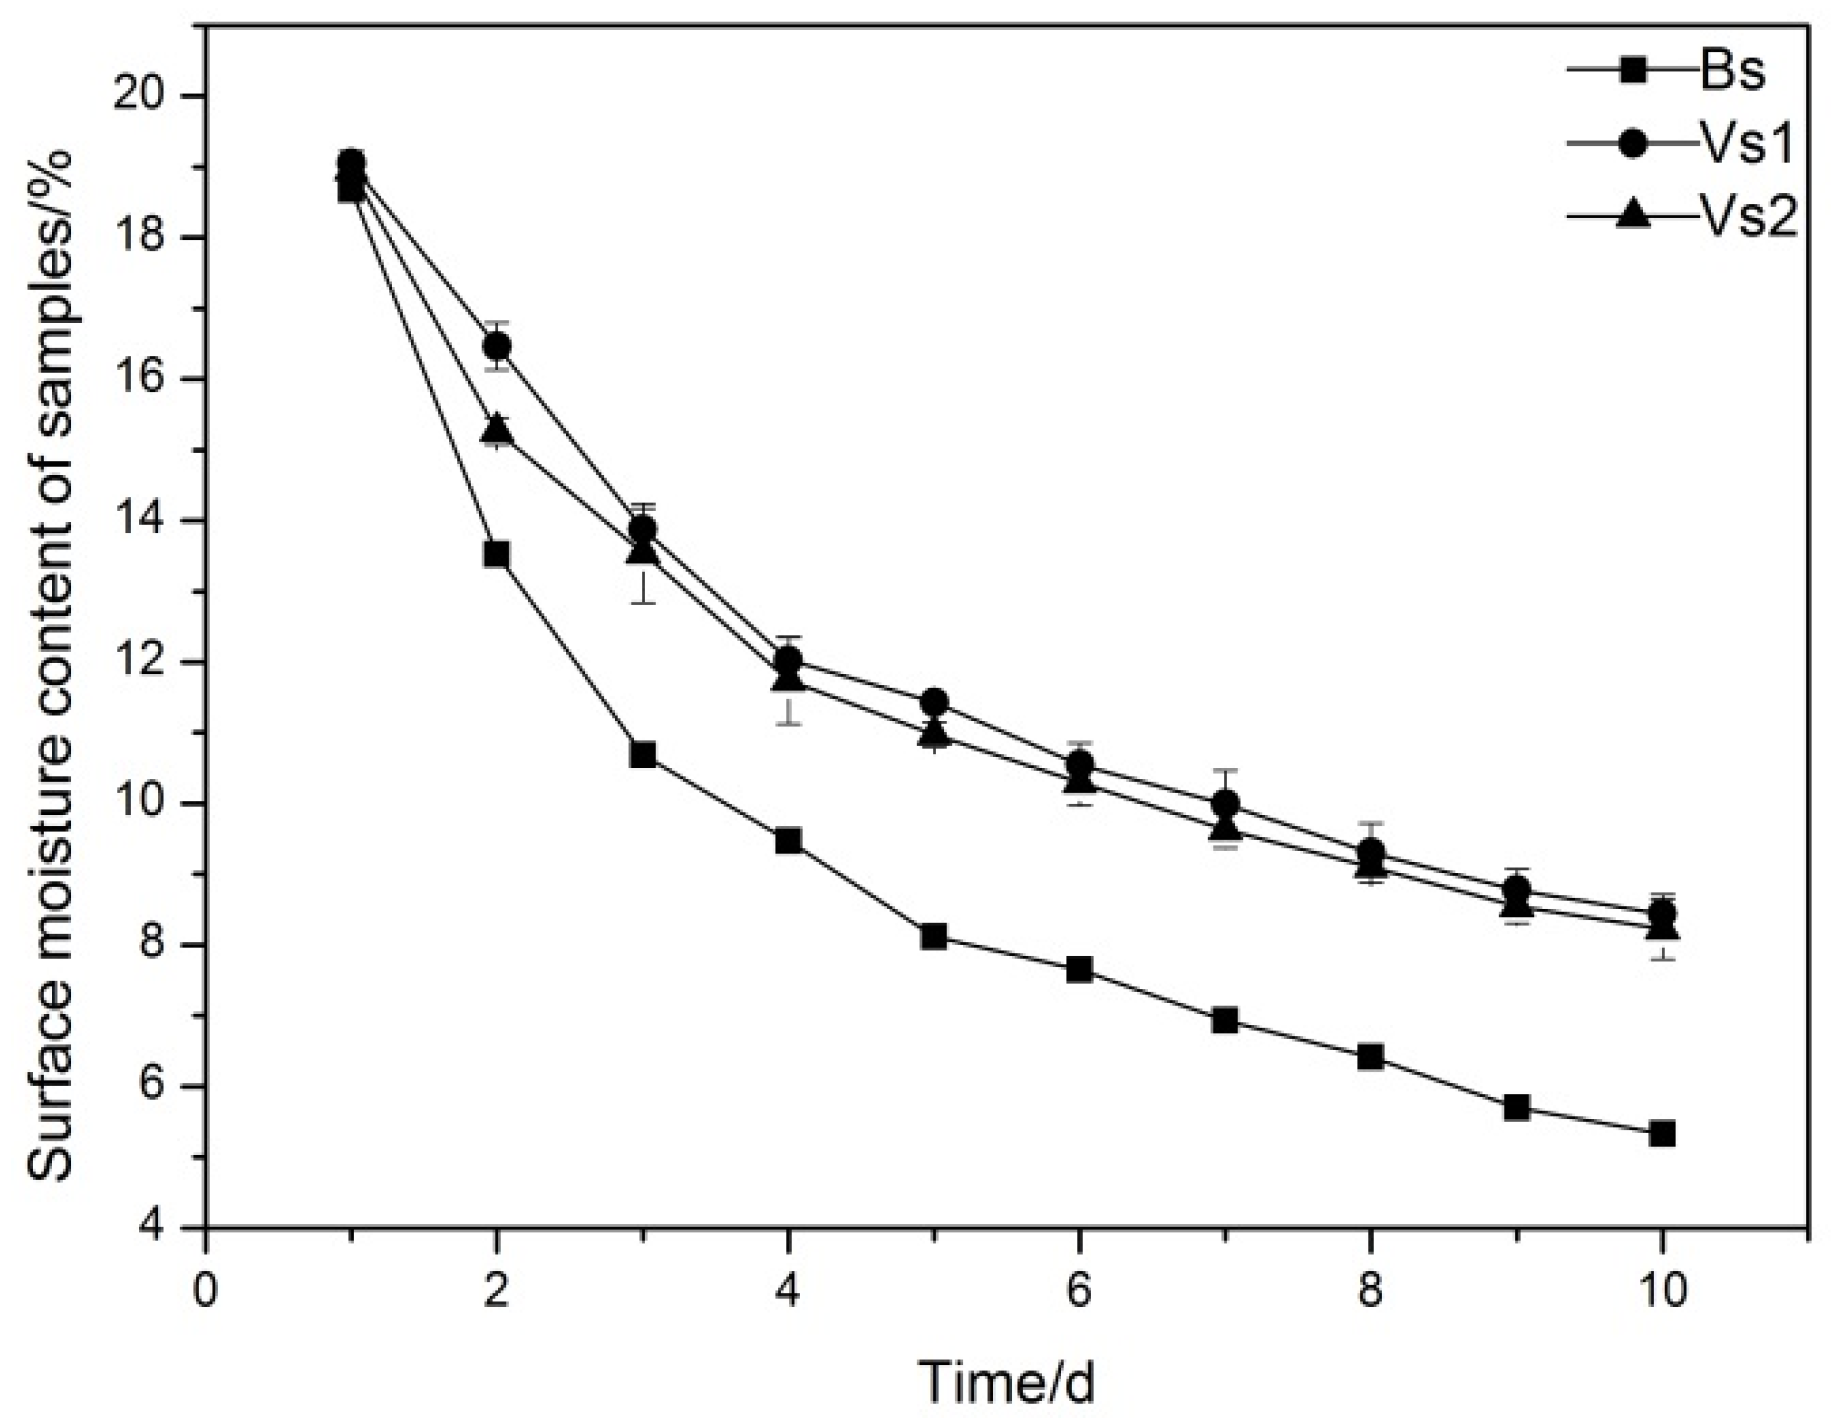
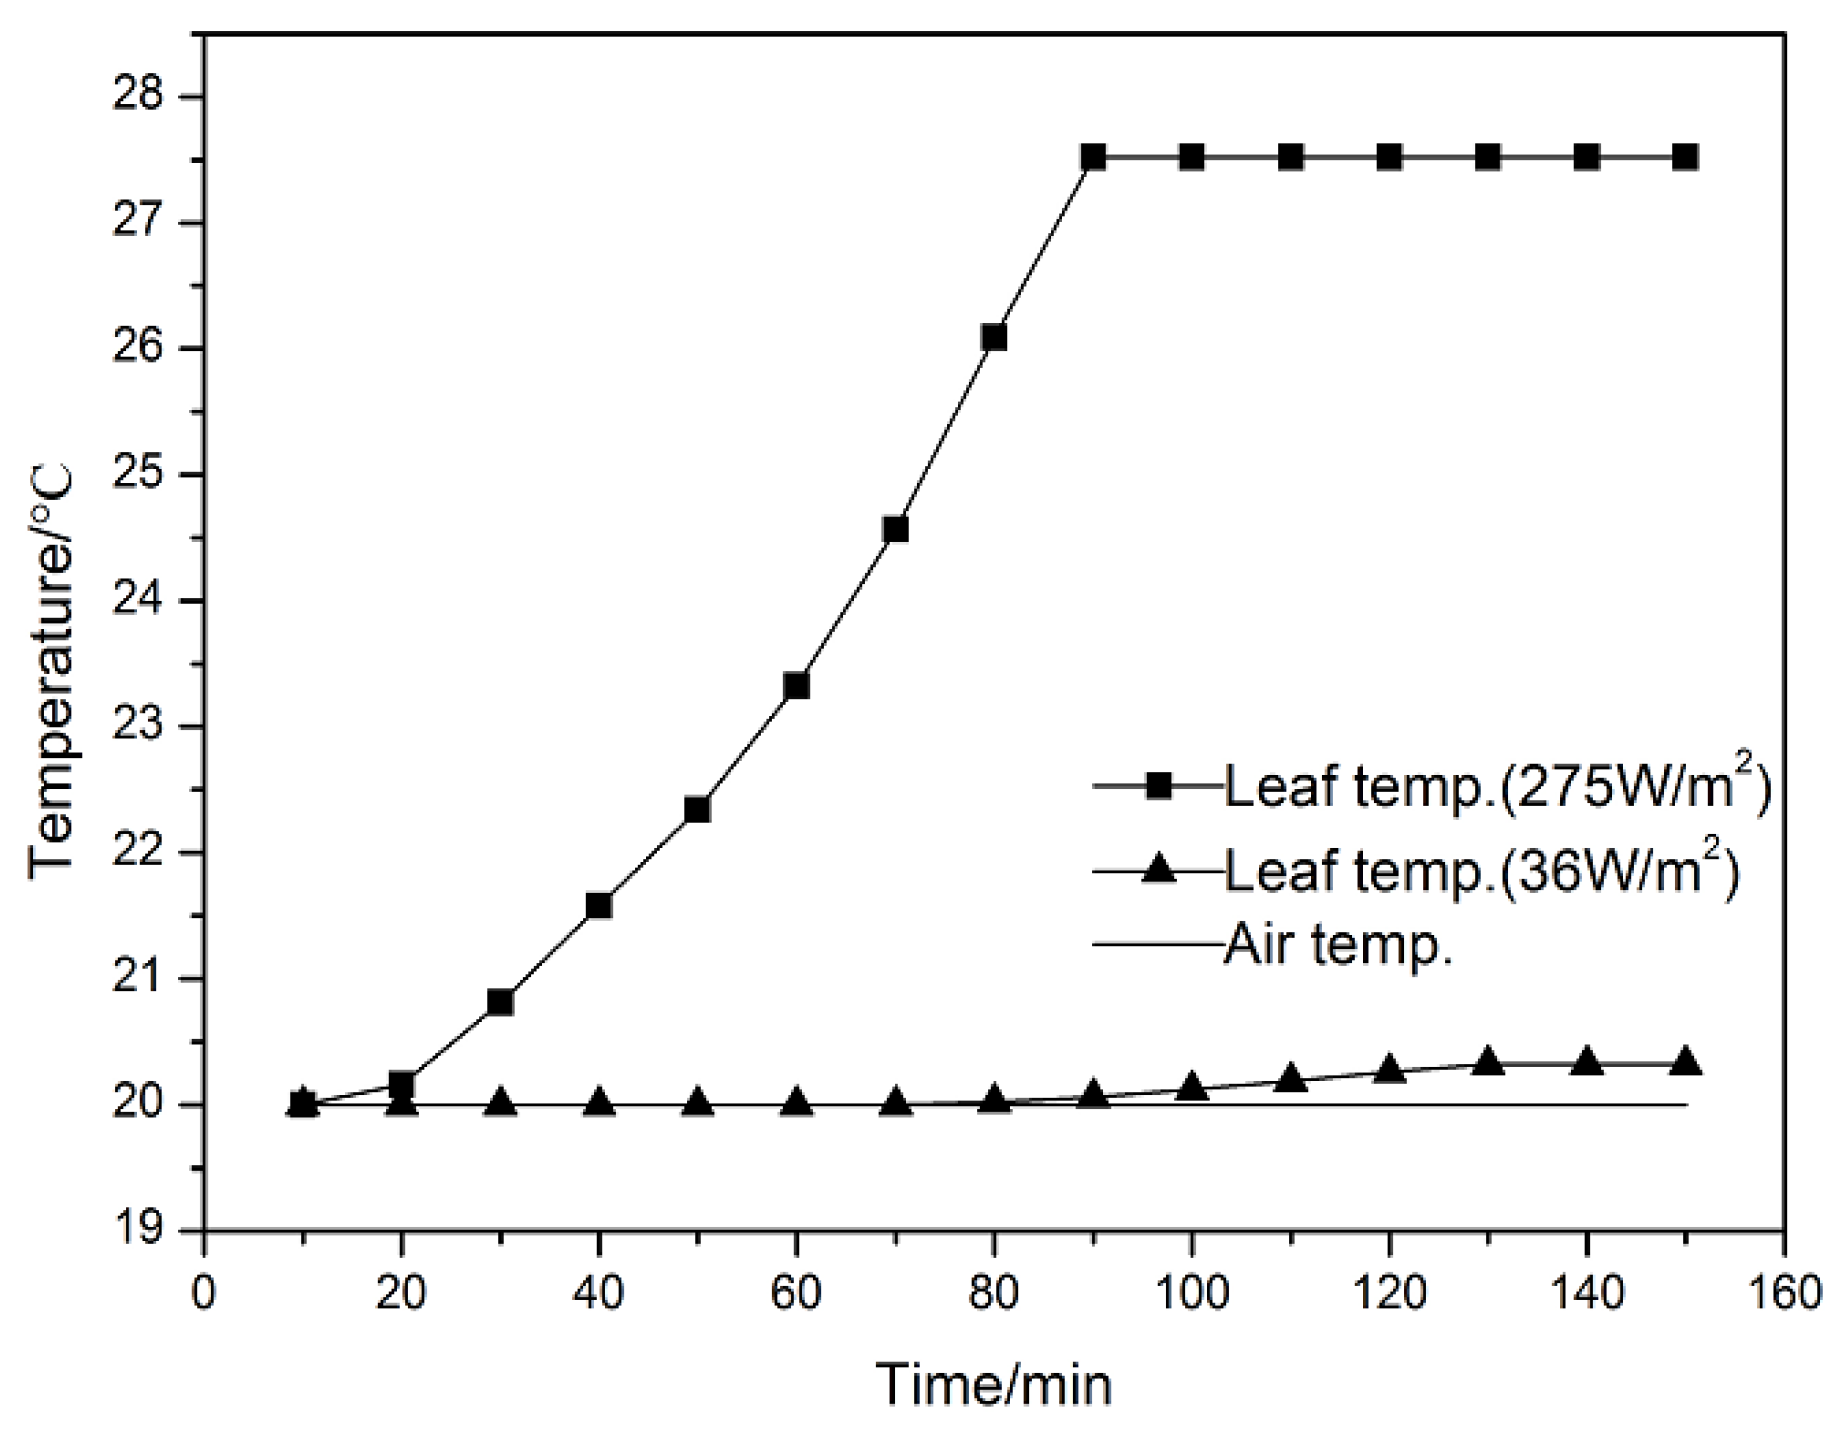
3.1. Comparison of Plant Transpiration and Soil Evaporation

In this test, based on the viewpoint that plant roots occupy soil particle gaps and reduce soil porosity, the void ratio of vegetated soil was deduced via the three-phase diagram of soil [25]. A numerical model regarding soil saturation and matric suction was established, so as to simulate the effect that plant roots reduce soil porosity and increase soil–water retention capacity [44]:
S r = [ 1 + [ s e m 4 m 3 ] m 2 ] m 1 ,
where S r is soil saturation; s is soil matric suction; m 1 , m 2 , and m 4 are dimensionless parameters; m 1 and m 2 control the basic shape of soil–water characteristic curve; and m 3 and m 4 are related to the intake value of bare soil.
Computed conclusions showed that the average void ratio ( e 0 ) of bare soil is 0.558, whereas that of vegetated soil (Indigofera amblyantha) is 0.536. A total of 15 groups of mean matric suction and volumetric water content data of vegetated soil were measured, and the Gallipoli model [44] was used to fit the test data as shown in Figure 5, fitting parameters ( R 2 > 0.943 ) were demonstrated in Table 3, therein, the data of bare soil were referred to Figure 2. Figure 5 showed that the water retention capacity of vegetated soil is higher than that of bare soil, which represents that plant roots in vegetated soil can effectively increase the air intake value of soil.
Soil particles arranged in a definite direction and order under gravity stress, and a certain pore structure was formed in plant growth process [16,45,46]. Gas entered initially the pores with a large size and drained the pore water in soil pores in the process of soil drying. This part of pore water accounts for a large proportion of the total pore water. As soil matric suction increase, the water in soil pores decrease gradually, non-pore water is drained slowly and soil presented a high water retention capacity. Plant roots in the vegetated soil can effectively fill the pores among soil particles, and soil porosity is lowered. It is difficult for gas to enter the gaps of soil particles in the process of vegetated soil drying; thus, air intake value of the vegetated soil is higher than that of the bare soil.
Vs1, Vs2, and Bs are three sandy silt specimens (two vegetated soils and one bare soil) based on the condition of identical homogeneous soil and uniform plant growth conditions in Figure 6. The aerial biomass and root biomass of two vegetated soils are different at the stable and mature stage of plants (Table 4), which affect directly the temporal and spatial matric suction distribution in superficial vegetated soil. As shown in Figure 6, the surface temperatures of three specimens presented an increasing trend, and the surface temperatures (22.04 ± 1.46 °C (mean value ± standard error)) of bare soil were higher than those of vegetated soil (20.45 ± 0.83 °C). During the test period, the maximum surface temperatures of the specimens were 3.4 °C higher than the air temperature. Figure 7 shows the changes in surface moisture content of the three specimens. With the progression of water evapotranspiration, the surface moisture contents of the three specimens gradually decreased. The surface moisture content of bare soil decreased by 71.49%, while that of vegetated soil decreased by approximately 55.70%.
Table 4 shows that the surface temperatures of the specimens had a significant negative correlation with surface moisture content (P < −0.936). Compared with bare soil, the surface moisture contents of vegetated soil with an increment of 15%–20%, whereas the maximum difference in surface temperatures between bare soil and vegetated soils was 1.4 °C, which was not significant.
These results may be explained by the intensity of the light applied to the surface of vegetated soil was obstructed by plant leaves (aerial biomass), resulting in the phenomenon that the surface temperature of vegetated soil is lower than that of bare soil and with a high surface moisture content. Therefore, it could be concluded that soil temperature, instead of radiant light energy, has a significant effect on soil evaporation, with the assumption that the other atmospheric and soil conditions are identical.
Table 5 shows that the mean matric suction increment at the 5 cm depth of bare soil was 23.45 kPa, and that at the 10 cm depth was 17.71 kPa during the tests. The mean matric suction increment at the 5 cm depth of vegetated soil was 23.82 ± 0.11 kPa, whereas the mean matric suction increment was 20.77 ± 0.98 kPa at the 10 cm depth. The increment of matric suction induced by evapotranspiration can effectively increase the shear strength of soil and reduce soil infiltration rate, and furthermore, the hydraulic erosion of surface soil is moderated [6,7].
Compared with the water evapotranspiration of bare soil (only soil evaporation), and that of vegetated soil including both soil evaporation and plant transpiration, the amplification of the matric suction in vegetated soil was greater than that of bare soil. For the case of vegetated soil (No. 1), the mean matric suction increment at the 15 cm depth was 14.97 kPa, which was 5.74 kPa greater than that of bare soil. This indicates plant transpiration can improve soil matric suction.
The variations in matric suction were closely related to plant biomass in vegetated soil, and a Pearson coefficient of 0.995 was obtained at the depths of 10 cm and 15 cm (Table 5). The reason is that the aerial biomass and root biomass of two vegetated soils are different at the stable and mature stage of plants, which affect directly the matric suction distribution in superficial vegetated soil. The increase in aerial biomass (mainly leaves) of plants increases the leaf area that exchanges materials with the atmosphere via light radiation, accelerating the photosynthesis and transpiration of the plants [18]. Based on the mechanism of plant transpiration [25], water vaporizes into the atmosphere through the leaf stomas of plant leaves, resulting in a great reduction in water pressure at the plant tops. A large hydraulic gradient is produced between the plant leaves and the plant roots, and the capacity of roots for water uptake is augmented. On the other hand, high root biomass is beneficial for smooth uptake of water by the plant roots from the soil for transport it up through the plant stems, and there is a high level of soil matric suction.
The soil matric suction induced by plant transpiration-like is defined in Figure 8, which is obtained by subtracting the matric suction of bare soil from that induced by water evapotranspiration of vegetated soil.
During the water evapotranspiration process, the matric suction induced by plant transpiration-like was characterized by a rapid increase followed by a low decline over soil depth, and presented negative values at 5 cm depth. The reason may be that soil evaporation has priority over plant transpiration, and soil evaporation has a great impact on the matric suction distribution in shallow soils (<10 cm), while plant transpiration via leaf stoma vaporization and root water uptake can affect the variations in matric suction for relatively deep soils (>10 cm).
However, the matric suction increment was a negative value at the depth of 5 cm, namely, the matric suction of vegetated soil was lower than that of bare soil. This might lead to the conclusion that plants not only induce soil matric suction by absorbing water, but also maintain matric suction in vegetated soil during drying process. Owing to the presence of plants, the surface temperature of vegetated soil is effectively reduced, which reduces vegetated soil evaporation to a certain extent, whereas the results may be presumably influenced by altering the soil structure due to root occupancy of the soil pore-spaces, which impedes the process of water loss from the soil pores.
Pore water is a hydrophilic medium and air is a hydrophobic in unsaturated soil, so water can only flow through the space occupied by pore water. When matric suction augmented, soil moisture content is decreased, and furtherly, soil permeability coefficient reduced correspondingly. The increase in soil pore air pressure impeded the paths of water flow, which reduced the permeability of vegetated soil. Vegetated soil can effectively reduce soil infiltration rate, so that soil can maintain a low pore water pressure (high matric suction), which is a great significance to enhance the stability of shallow slope.

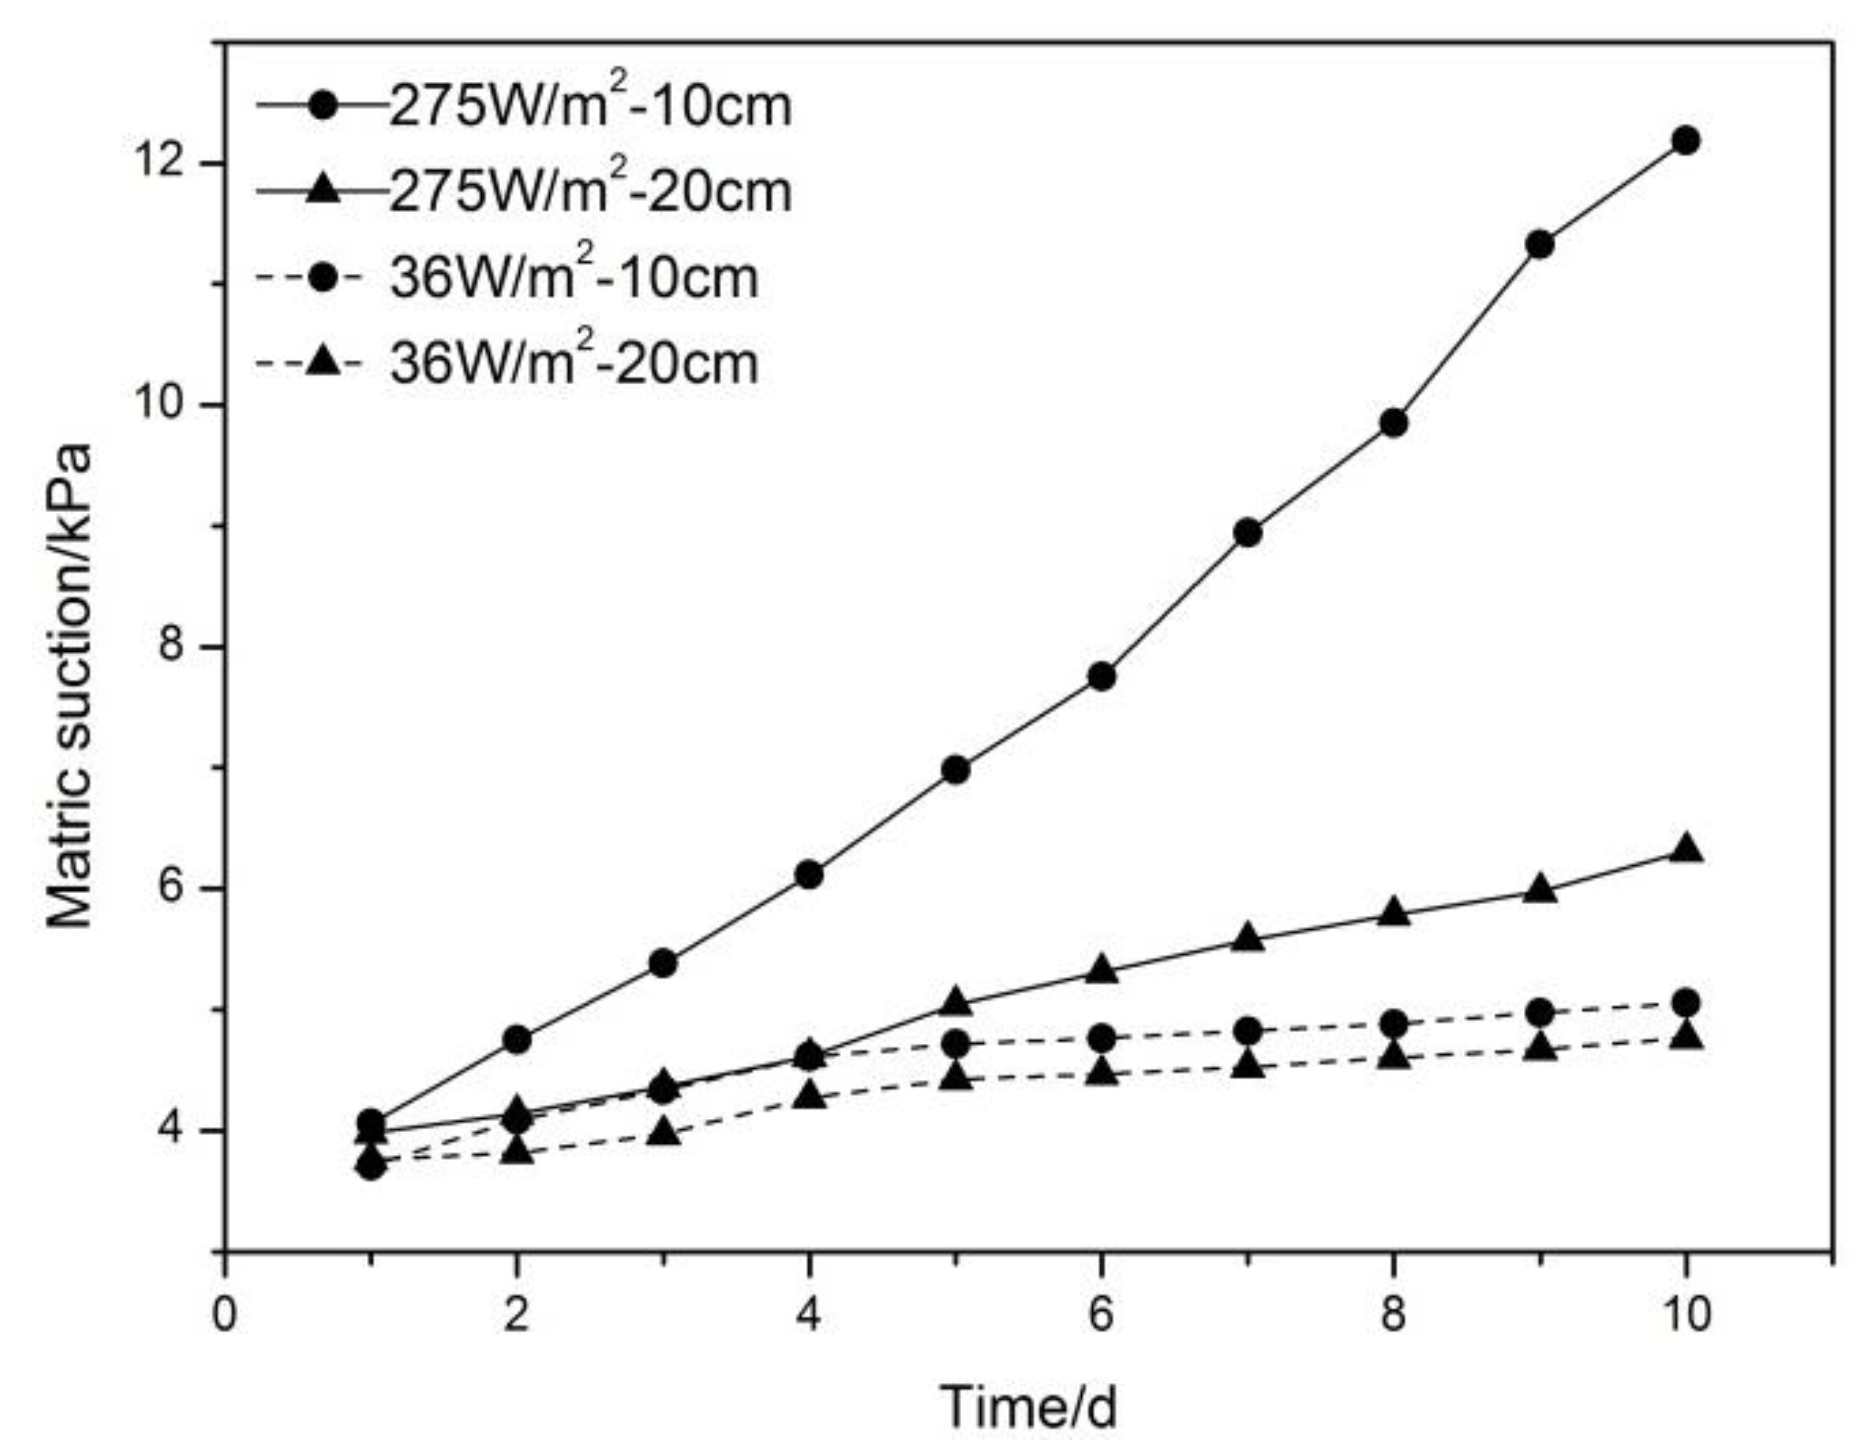
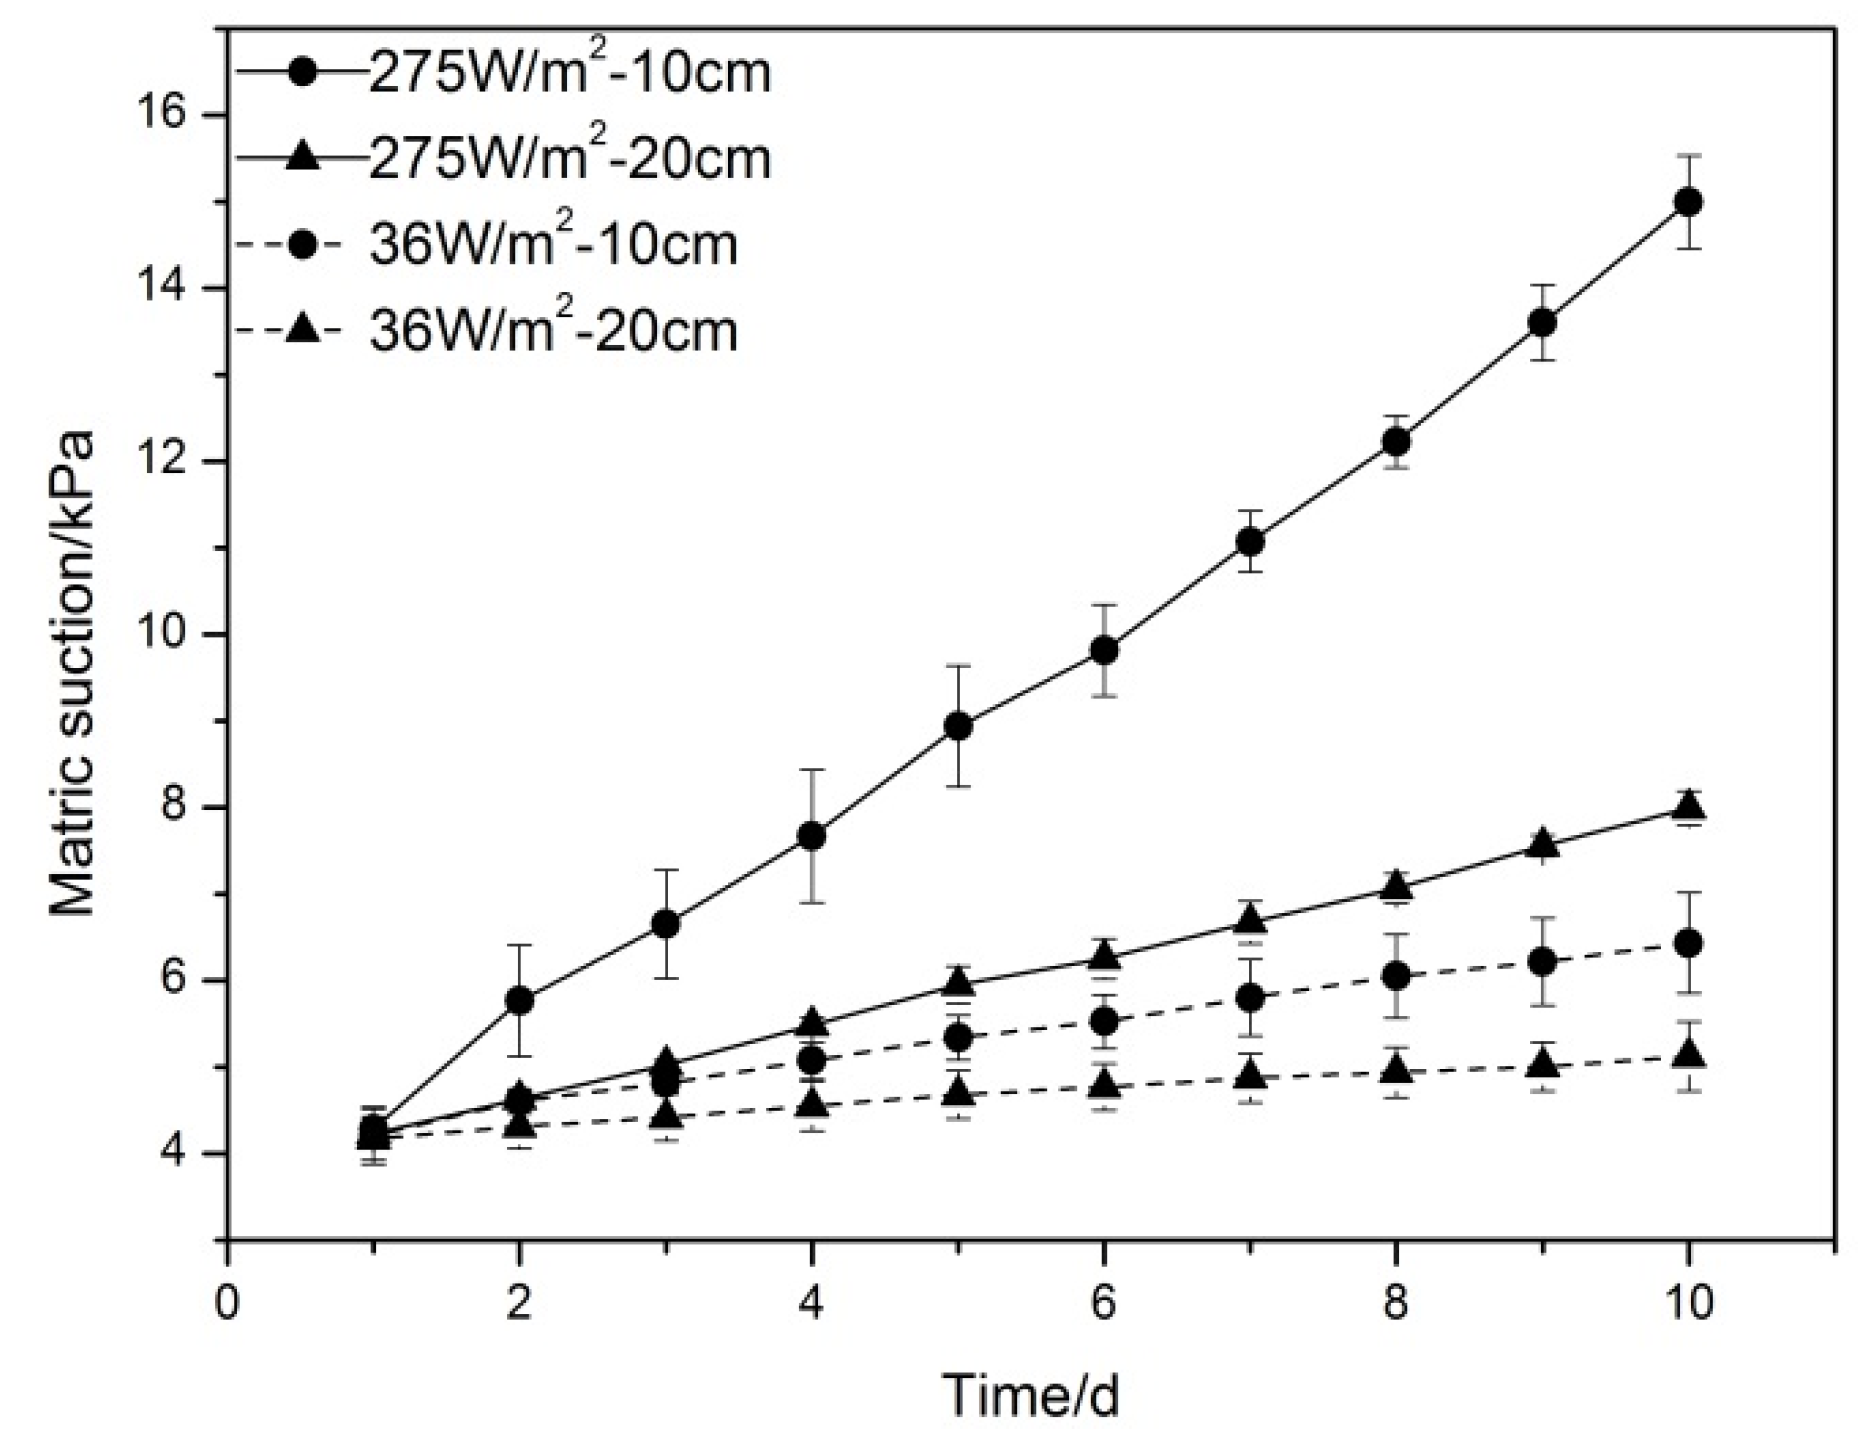
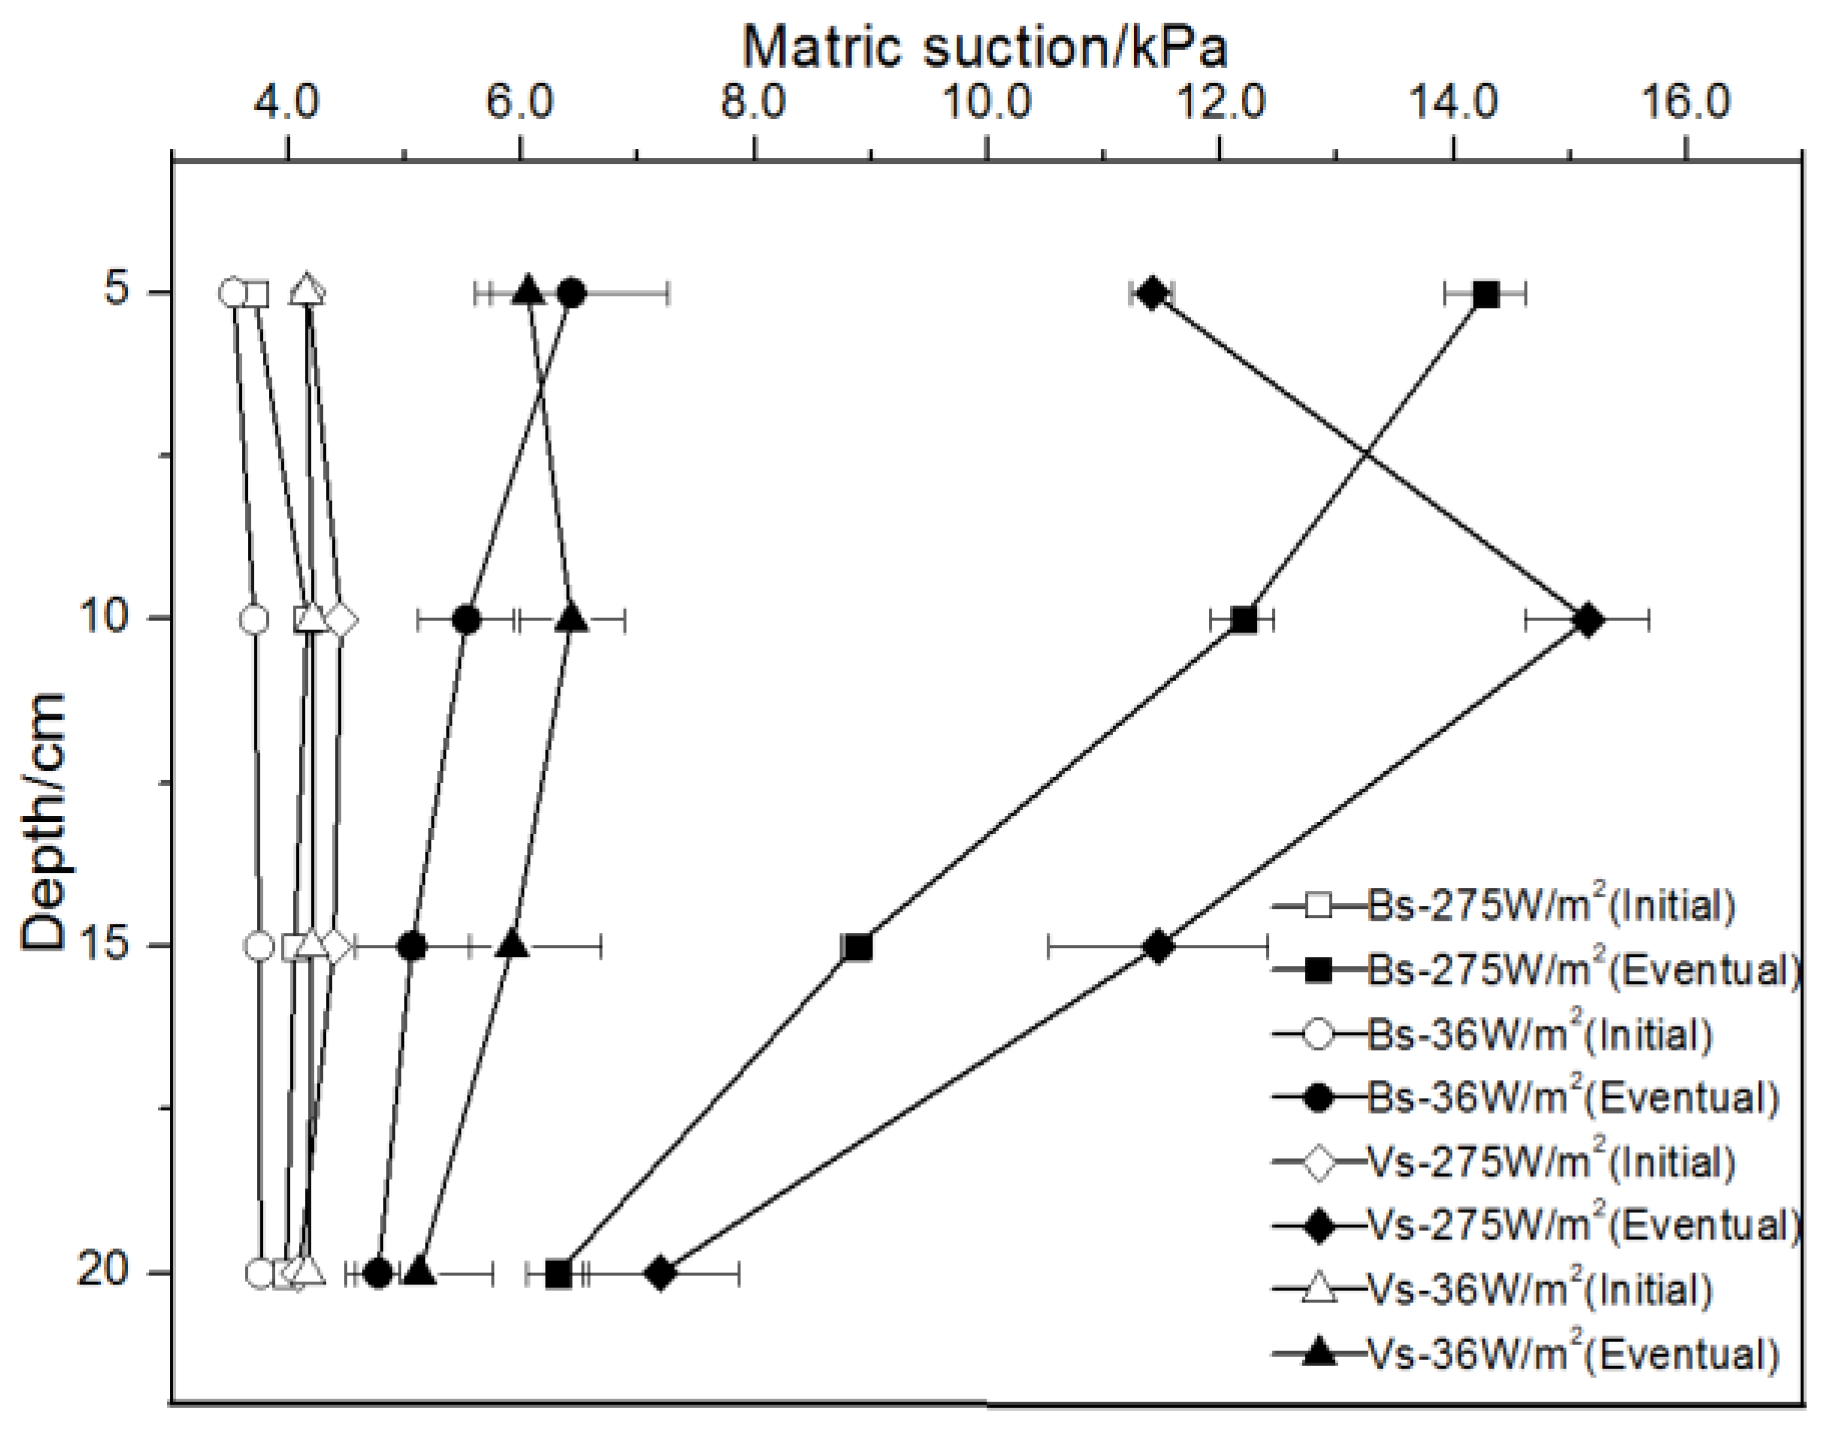
3.2. Effects of Illumination Intensities on the Matric Suction of Vegetated Soil

Figure 9 compares the measured vertical distributions of matric suction induced by the vegetated soils and bare soils after 10 days of monitoring. The initial distributions of matric suction in vegetated soil and bare soil were fairly close (<1 kPa). After drying for 10 days, there were marginal increases in matric suction in the conditions of 36 W/m2, and the distribution of matric suction in bare soil was fairly uniform. In contrast, the peak matric suction induced by soil evaporation at 5 cm depth under the illumination intensity of 275 W/m2 was more than three higher than that under 36 W/m2. For the vegetated soils, the distribution of matric suction was distinctively different from that of bare soil, and the peak matric suction occurred at 5 cm depth due to plant transpiration. On the other hand, the matric suction induced by plant transpiration under 275 W/m2 at 10 cm depth was higher than that under a 36 W/m2 by 135.61%.
As shown in Figure 10, the variations of matric suction in bare soil were small under conditions of 36 W/m2. The matric suction increment at the 10 cm depth was 1.34 kPa, and that at the 20 cm depth was 1.01 kPa. The variations in matric suction at the 10 cm depth mainly depending on surface soil with a diameter of 10 cm that directly contacted the atmosphere, and shallow surface soil exchanges heat radiation with the atmosphere, causing small amounts of water evaporation in soil. However, the change in matric suction at the 20 cm depth may be explained by the redistribution of soil moisture within the soil due to gravity, resulting in a redistribution of matric suction in a local extent. Under conditions of 275 W/m2, the matric suction increments of bare soil at the 10 cm and 20 cm depths were 8.13 kPa and 2.33 kPa, respectively. Based on the fact that soil evaporation at the soil-air interface is mainly affected by the lighting temperature, large matric suction values were generated in the surface layer of bare soil.
Figure 11 shows that, under the conditions of 36 W/m2, the matric suction increment at the 10 cm depth of vegetated soil was 2.23 ± 0.25 kPa, and which of the 20 cm depth was 0.95 ± 0.15 kPa. Based on the conditions of 275 W/m2, the matric suction increment at the 10 cm depth of vegetated soil was 10.72 ± 0.31 kPa, and that at the 20 cm depth was 3.77 ± 0.12 kPa. These values are significantly higher than the matric suctions of vegetated soil subjected to illumination intensity of 36 W/m2.
Lighting not only increases the atmospheric temperature around the leaves, but also increases the leaf temperatures. As revealed in Figure 12, leaf temperatures increase to 23.32 °C and 27.52 °C on the conditions of 36 W/m2 and 275 W/m2 in the initial stages of illumination, the temperatures of plant leaves were about 0.32 °C and 7.52 °C higher than the air temperature (20 °C) were maintained throughout the test. The increase in atmospheric temperature accelerates the rate of water evapotranspiration, which increases the vapor pressure difference between the inside and outside of the plant leaves. This increase in vapor pressure difference is beneficial for the escape of water from the leaves, and then the rate of plant transpiration is enhanced [47,48]. The results prove that plant transpiration is mainly controlled by the thermal energy from lighting.
Compared to the matric suction induced by soil evaporation in bare soil (8.13 kPa), the plant transpiration-induced matric suction increments at 10 cm depth were found to be 37.39% and 25.95% higher after 10 days of monitoring, depending on the characteristic parameters of the individual specimens (Table 6). As leaf area index increased from 2.151 to 2.397, the amplification of plant transpiration-induced matric suction increased significantly because of the increased percentage of radiant energy intercepted by the plant leaves. This result is consistent with the conclusion of Pollen-Bankhead [9] that the matric suction induced by plant transpiration in vegetated soil can be twice as high as that of the un-evapotranspirated soils in field tests, whereas the contribution of plant transpiration to the amplification of matric suction is augmented substantially when individual specimens have a higher leaf area index and root area index.
Furthermore, the larger plant biomass (aerial biomass and root biomass) of vegetated soil, causes greater matric suction to be induced in soil, thus generating a large additional shear strength, which is important for controlling surface soil erosion and shallow soil stability.

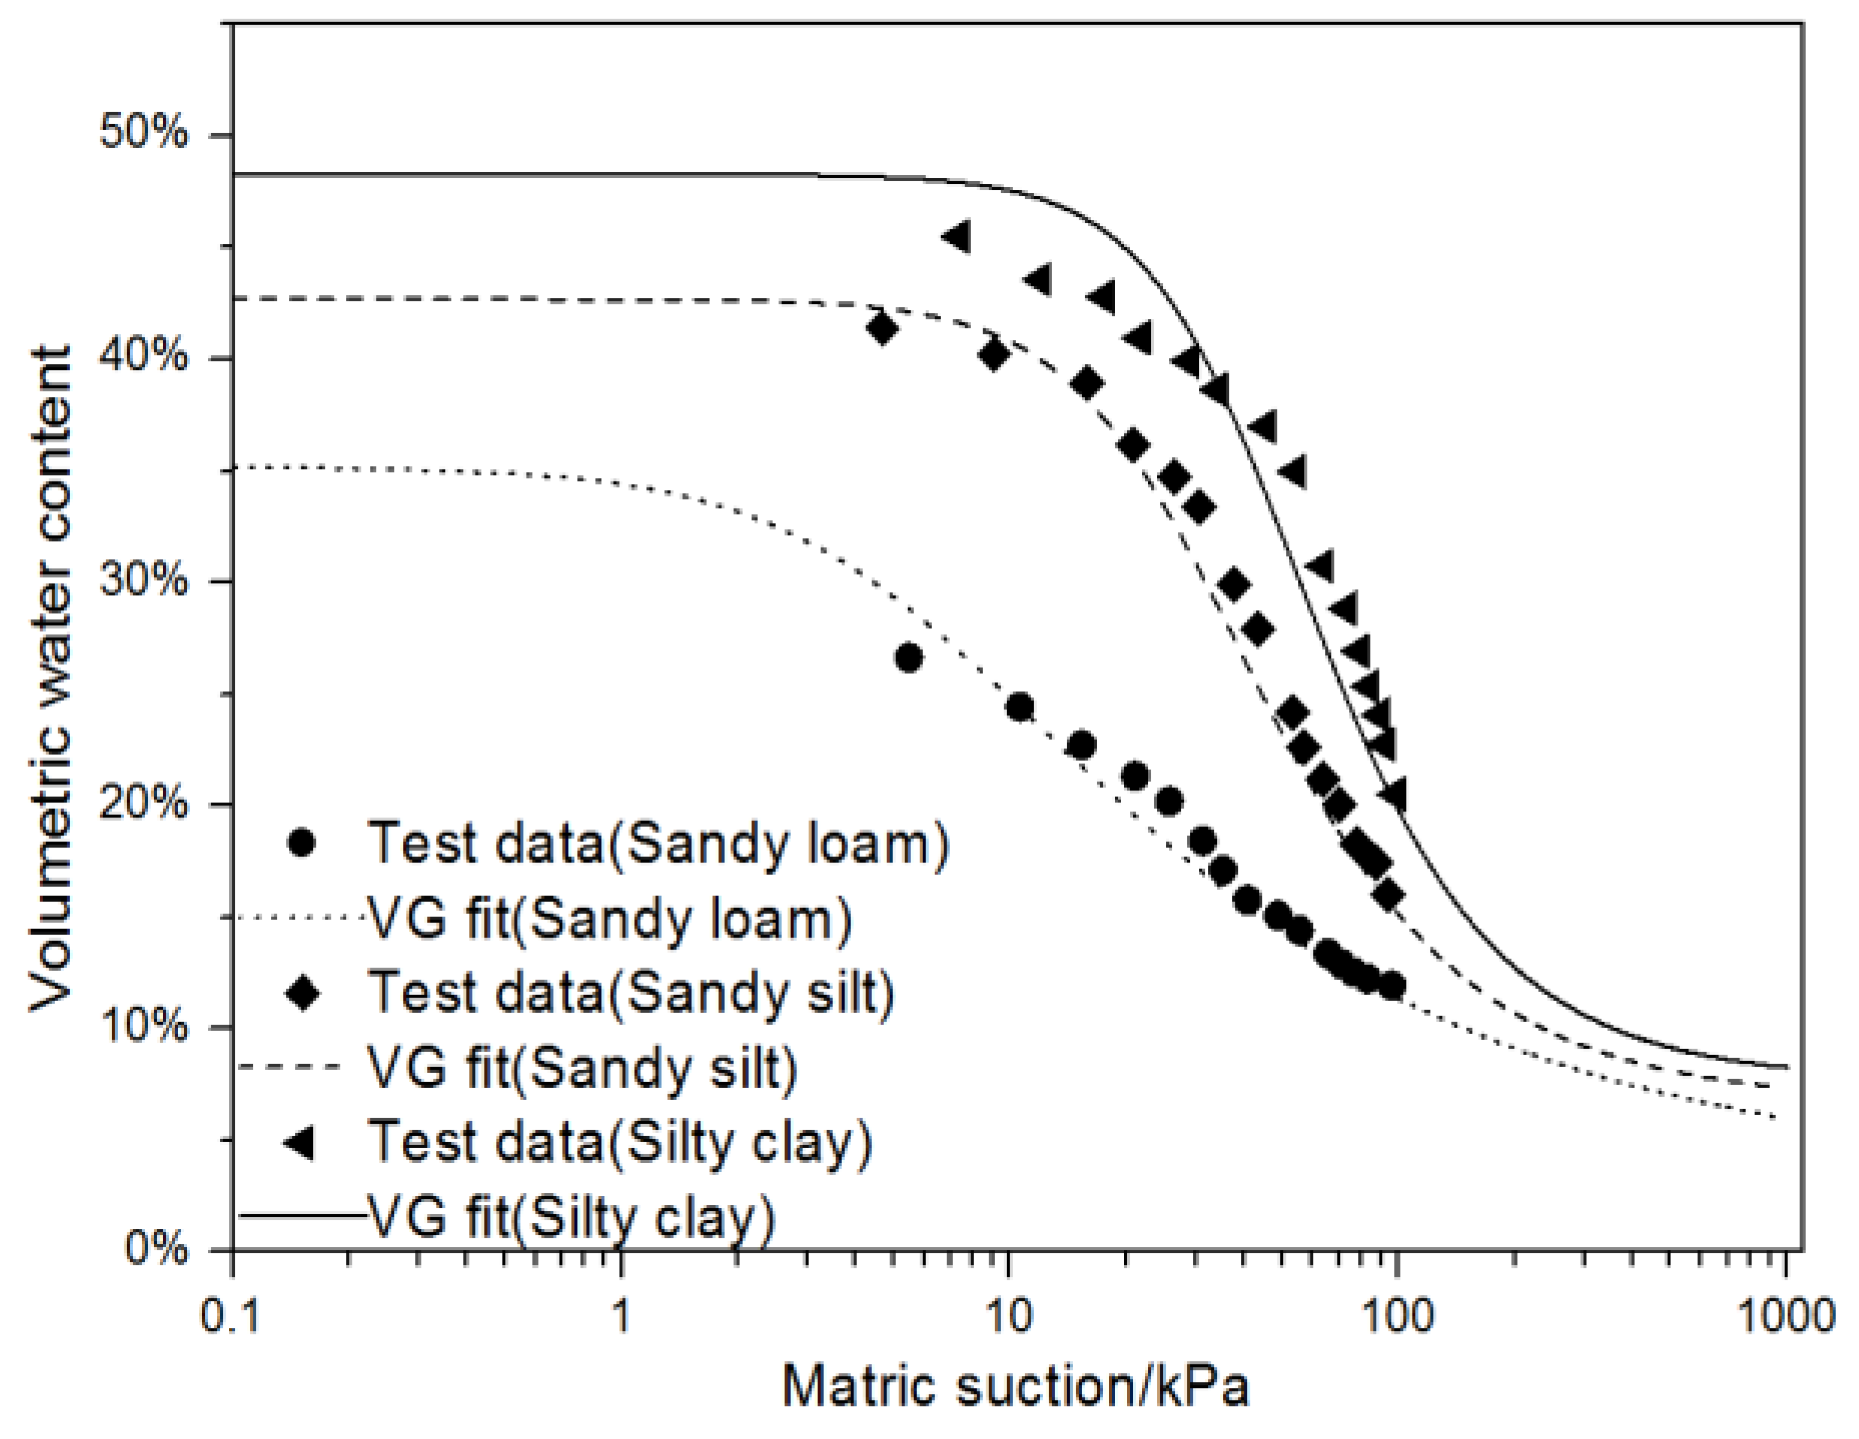
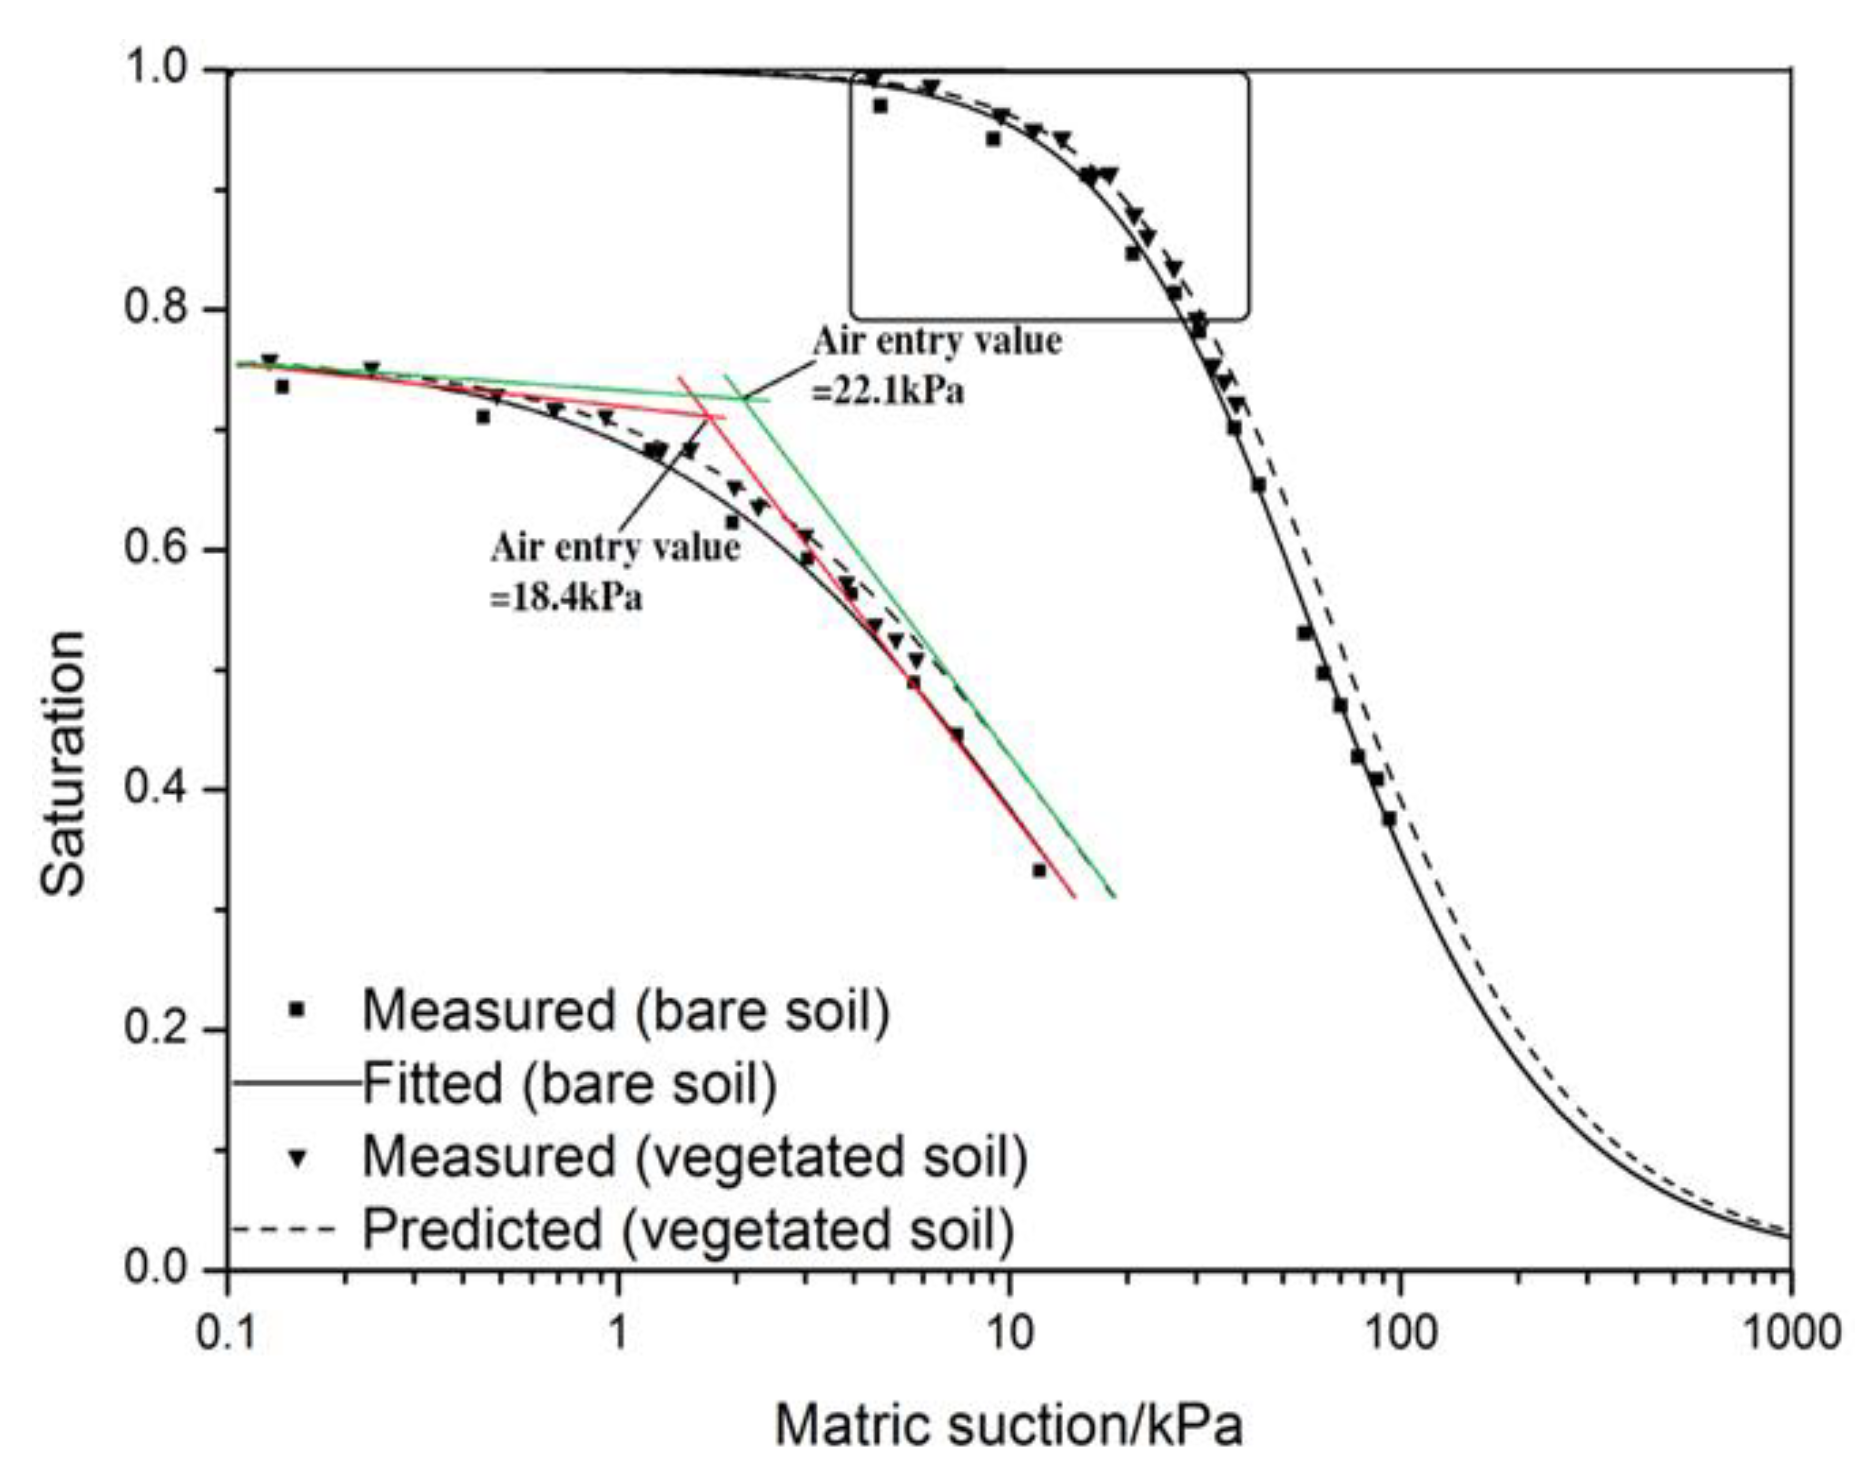
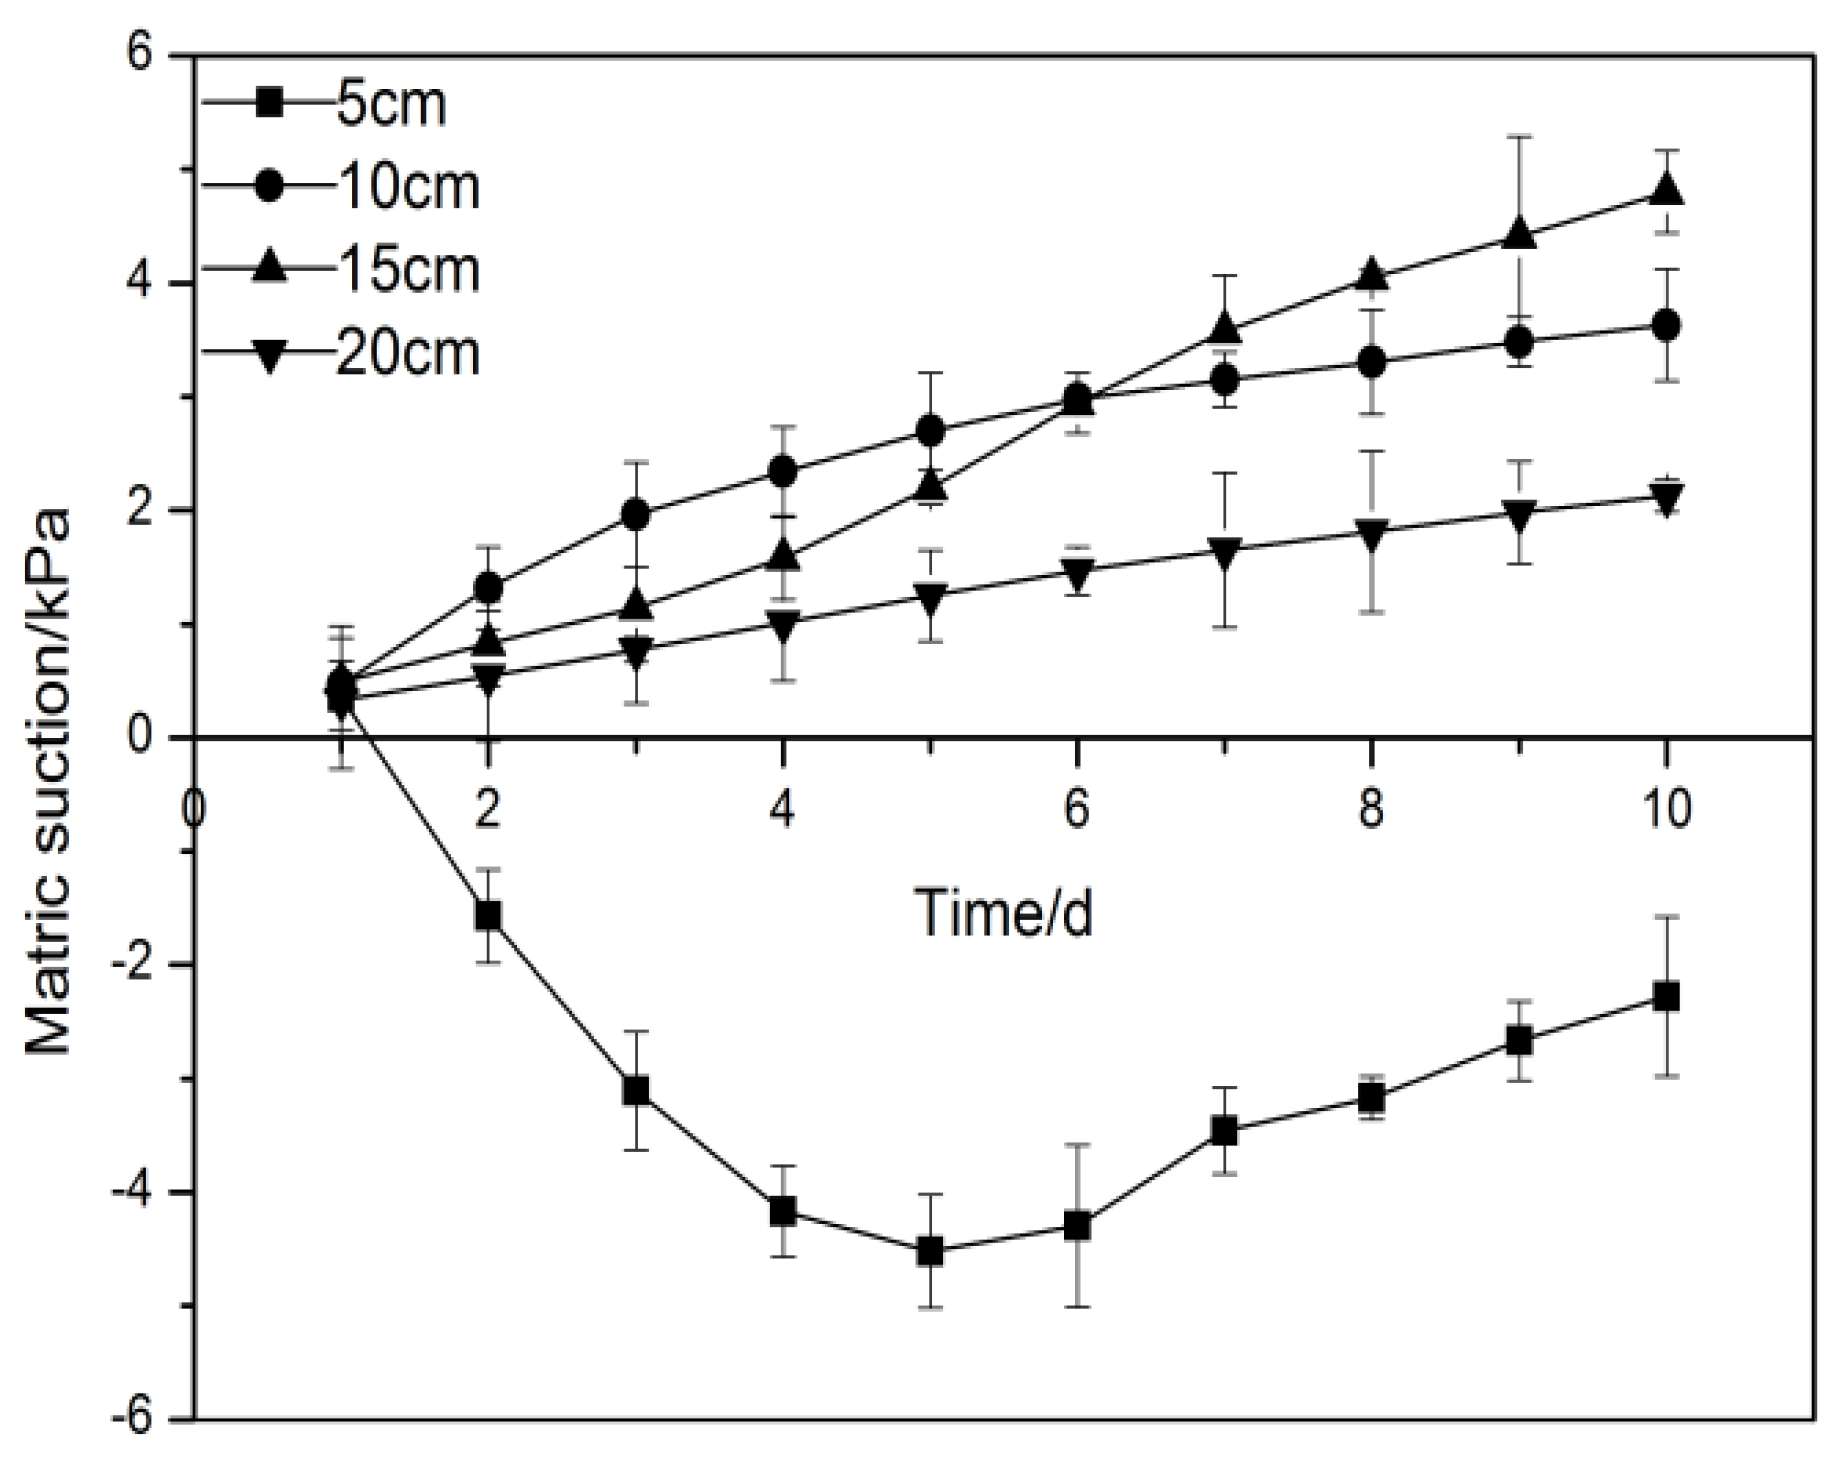
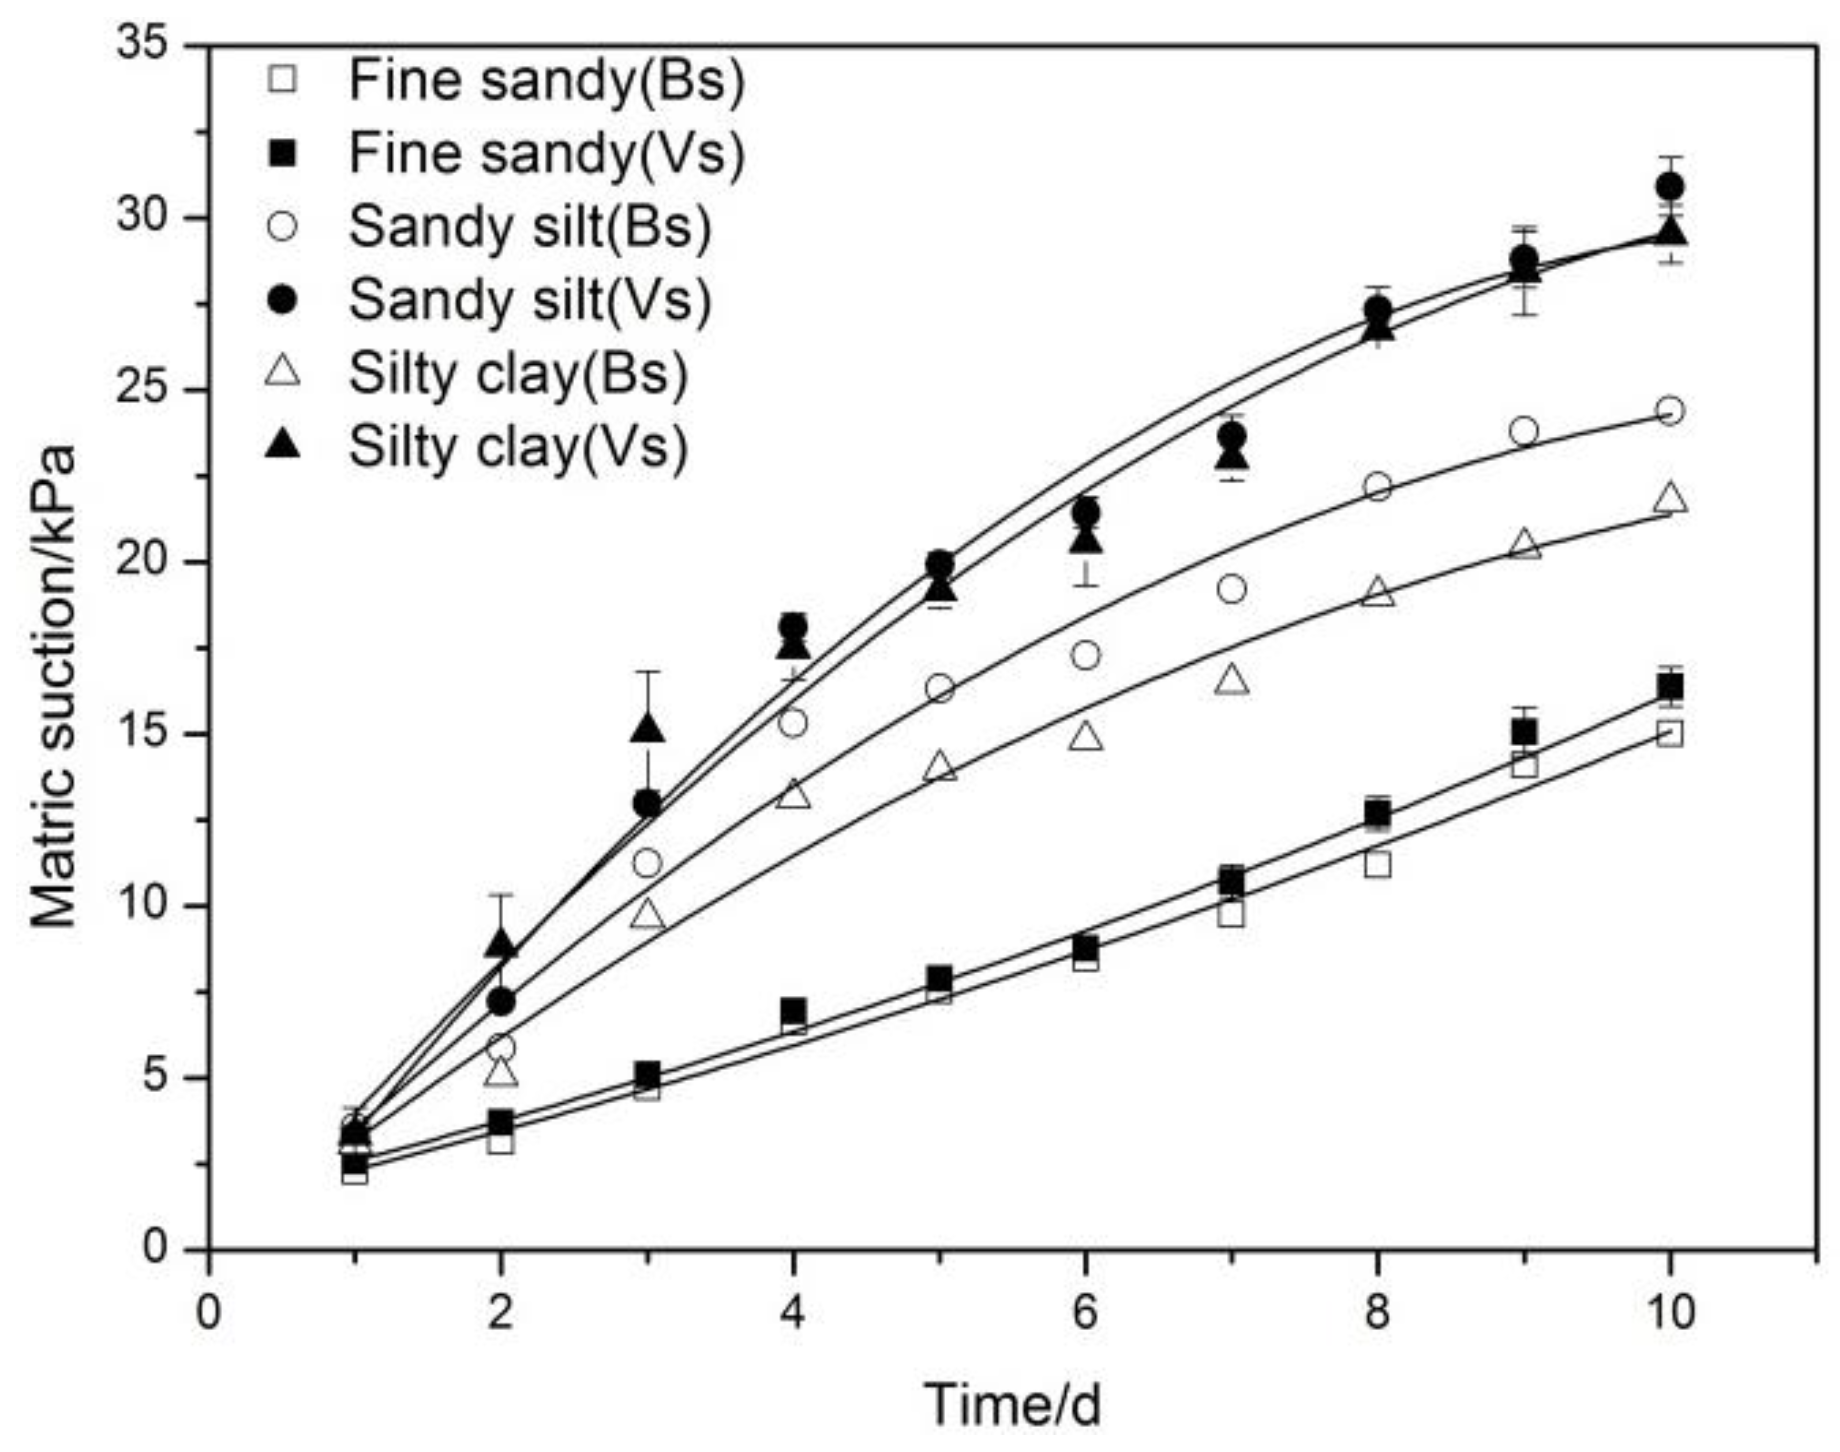
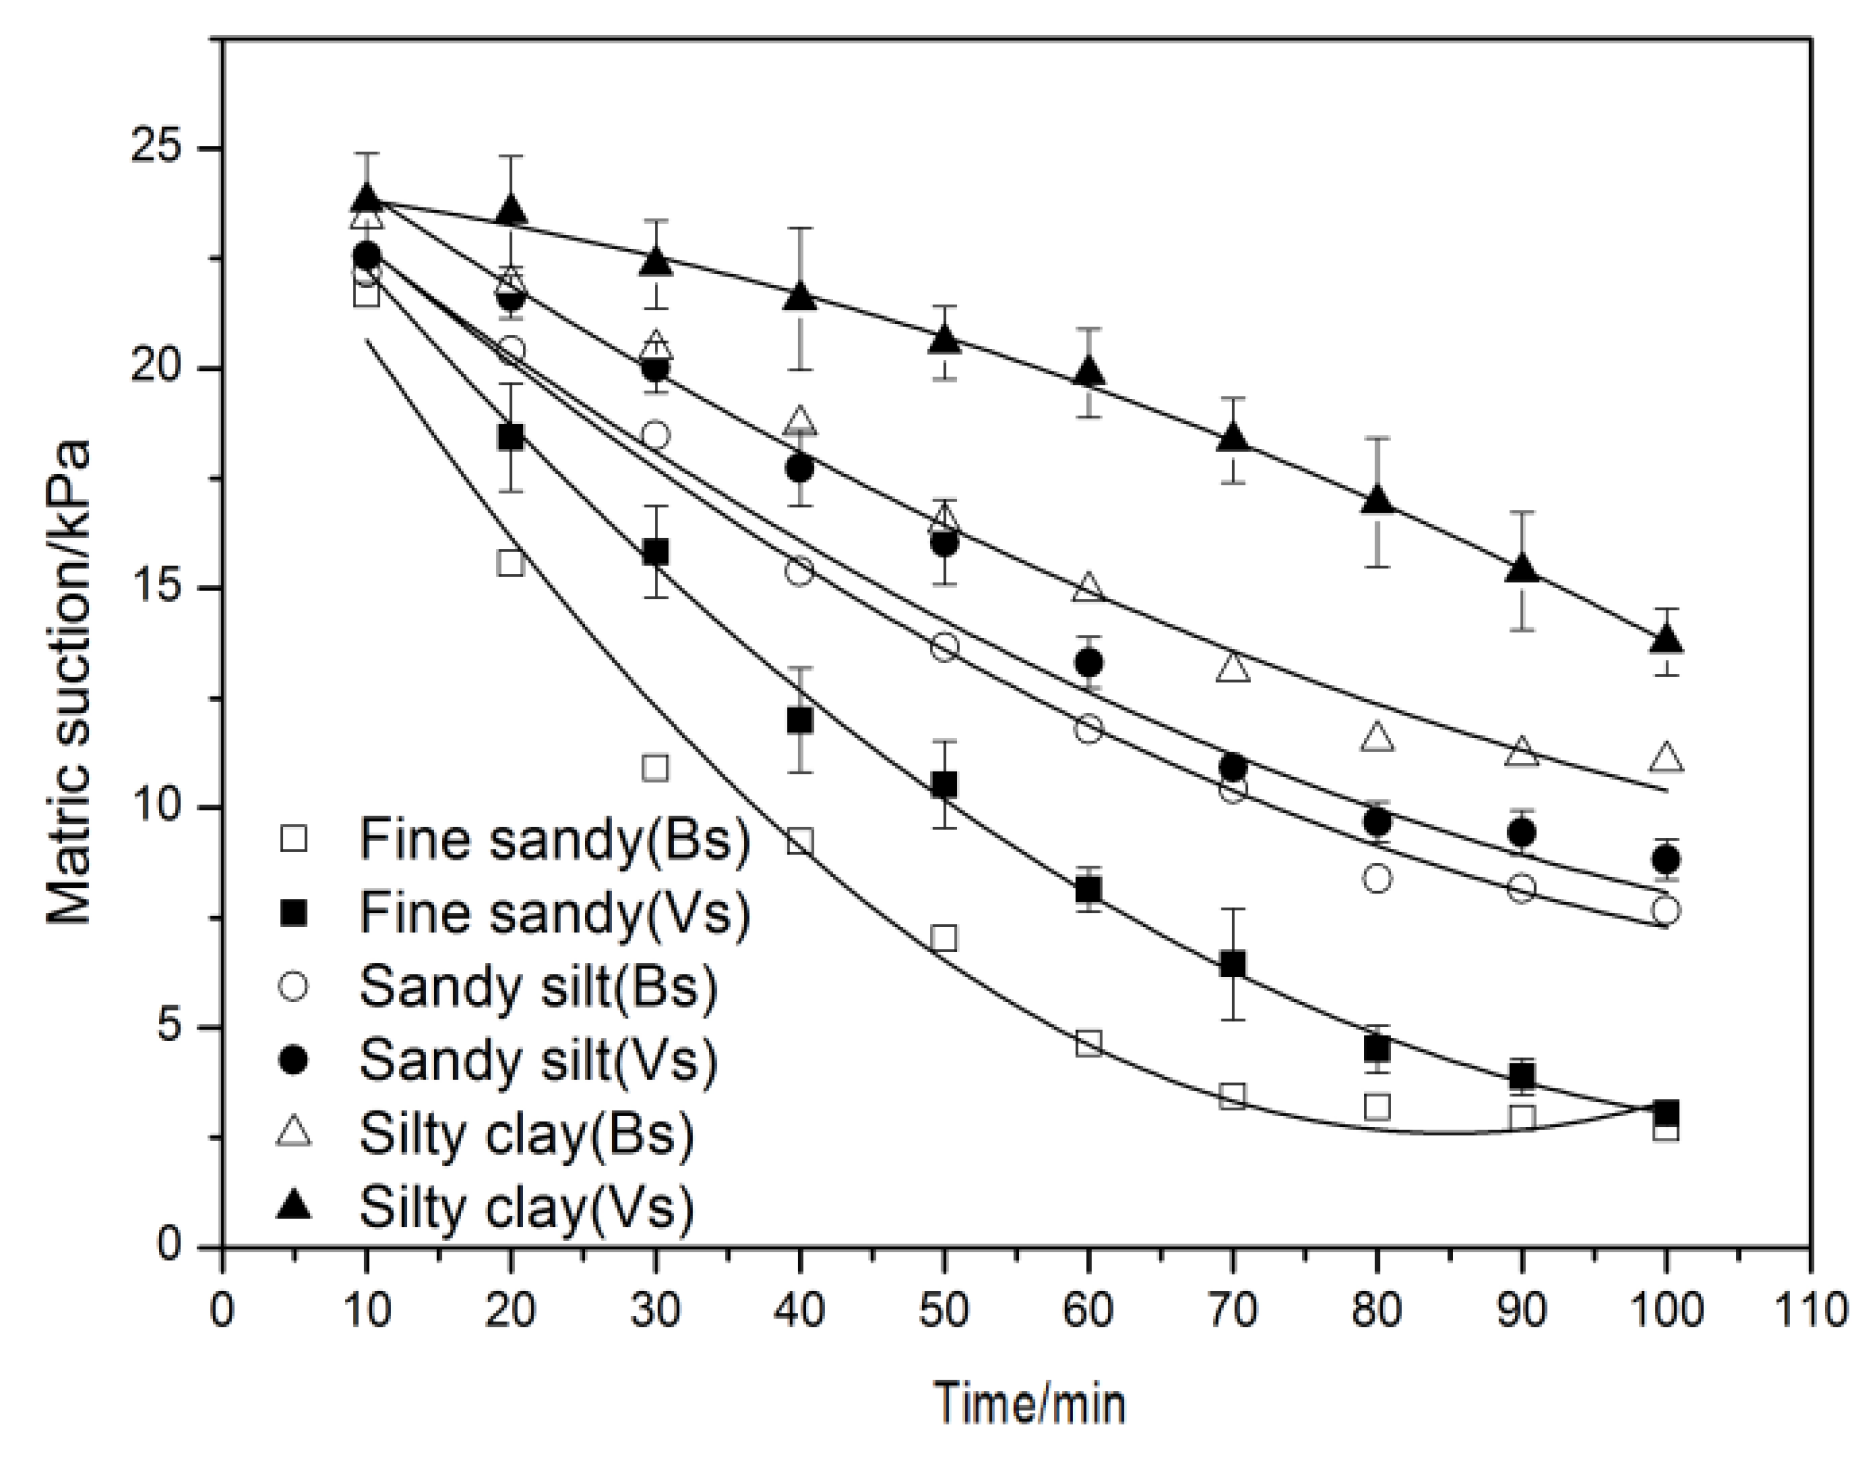
3.3. Effects of Soil Properties on the Matric Suction of Vegetated Soil

Figure 13 shows the variation of matric suction profiles with time in three test soils. The measured initial matric suction at four depths for both vegetated soils and bare soil were about 3 kPa. After 10 days of drying, matric suctions in measured depths of all test soils increase, as expected. Matric suction measured in vegetated soil was notably higher than that in bare soil, except for fine sandy loam. And the peak matric suctions were observed at 10 cm depth in sandy silt and silty clay (vegetated soil), rather than 5 cm depth in fine sandy loam. The matric suction profile is consistent with the observations of the previous studies (Section 3.2), this suggests that, as compared to evaporation, it was likely that plant transpiration was a more dominant process in the relatively deep soil (>5 cm), as the responses of matric suction are found to be more dependent upon the root morphology.
Figure 14 shows that, for bare soil, the matric suction at the 10 cm depth of fine sandy loam gradually increased, and the increment was 12.73 kPa, while the rate of variation in matric suction was relatively stable (slope k = 1.466). The matric suction of the sandy silt and silty clay increased logarithmically (R2 > 0.972). Therein, matric suction induced by water evapotranspiration in silty clay (18.71 kPa) was greater than that of fine sandy loam (12.73 kPa) and was lower than that of sandy silt (20.84 kPa). For vegetated soil, the mean matric suction increment in fine sandy loam was 13.80 kPa and the change rate (slope k = 1.535) was slightly higher than that of the bare soil. The variation trend of the mean matric suction in sandy silt was similar to that of bare soil, and the increment was 27.60 kPa. The mean matric suction in silty clay increases rapidly by 26.18 kPa (Table 7).
Based on the above results, it is straightforward to conclude that the variation trend of matric suction is related to the content of silt and clay in the soil, and also related to the pore size of soil particles. For fine sandy loam and sandy silt, the clay content is lower and the gaps between soil particles are relatively large [49,50]. Due to the action of the evaporation pressure difference, the water in the superficial soil is easily diffused into the atmosphere through the gaps between the soil particles; thus, soil evaporation is the principal part for the change in vegetated soil matric suction. Silty clay has high water retention ability [34,35], which means a high resistance to water loss during soil evaporation, so the impact of plant transpiration is prominent in relatively deep silty clay.
Matric suction in the sandy silt was higher than that of the silty clay, and this result may be explained by the pore structure between silt particles being more conducive to the capillarity of unsaturated soil, while the interaction of clay particles and water produces bound water with a strong viscosity [49,51]. Meanwhile, the small granularity of silty clay limits water transport in the capillary channels of the soil, and the capillarity is relatively weak [34,37]. In addition, the matric suction of silty clay increased rapidly in the initial stages of the test evidenced that when the content of clay particles and fine particles is high, the soil matric suction is sensitive to the change in soil moisture content, which mainly depend on the difficulty of draining or uptaking water from the soil [19,37,52].
Figure 15 shows that during the wetting process, the matric suction of each specimen gradually decreased over time. For bare soil, the matric suction of fine sandy loam rapidly decreased, while the sandy silt and silty clay responded slowly to rainfall. The water retention capacities of silty clay and sandy silt are high, resulting in a low permeability coefficient of these soils [26,52].
Compared with bare soil, the water retention of vegetated soil significantly improved. Plant roots can alter soil structure due to root occupancy of the soil pore spaces, and the reduction in soil porosity and capillary radius enhances the soil–water retention [2,16]. This phenomenon is particularly evident in silty clay. For a given decrement of matric suction, the response time of vegetated soil was high; in other words, the matric suction can be maintained during the corresponding period, which is a great significance to enhance the stability of shallow slope. The hysteresis of water retention in vegetated soil appears to affect the stress-strain behavior of soil during the transient process of rainfall infiltration [28,29,53].
The infiltration rate of bare soil was greater than that of vegetated soil at the initial stages of rainfall, whereas the subtle infiltration rate resulted in a slower variation in matric suction in vegetated soil. With the advance of rainfall tests, the matric suction of vegetated soil gradually decreased until a matric suction value consistent with that of bare soil was reached. However, for silty clay, the difference in the ultimate matric suction between vegetated soil and bare soil was large.
For the fine sandy loam, the matric suction of vegetated soil and bare soil should eventually drop to zero [50], but the mean matric suction in the tests did not drop below 2.5 kPa. It may be caused by the fact that the planting box was incompletely sealed, resulting in incomplete infiltration of the rainfall into the soil.

4. Conclusions

In this paper, the effects of illumination intensities and soil properties on the matric suction of vegetated soil were investigated by drying and rainfall tests. The main results showed that:
(1) The water retention capacity of vegetated soil is higher than that of bare soil, and plant roots can effectively increase the air intake value of vegetated soil. Illumination intensities affect plant transpiration by changing leaf temperature and atmospheric temperature around the leaves. Thermal energy from lighting has a significant effect on plant transpiration. The matric suction induced by plant transpiration in vegetated soil is 1.5–2.0 times that of un-evapotranspirated soil.
(2) A correlation is observed between soil matric suction and the clay and silt content, and the matric suction of silty clay is sensitive to changes in the soil moisture content. During the rainfall process, high matric suction is maintained in vegetated soil and thereby to great soil shear strength in the response period, which is a great significance to enhance the stability of shallow slope.
(3) The matric suction of plant transpiration obtained by subtracting the matric suction induced by soil evaporation from that of water evapotranspiration has not been exactly expressed. Thus, due to the interactions of plant transpiration and soil evaporation (such as matric suction induced by soil evaporation, resulting in an increase in the difficulty of plant root water uptake and thereby reducing the rate of plant transpiration), the coupling relationship between these effects needs to be studied further.
This study of the properties of unsaturated vegetated soil based on matric suction can help to further the development of the hydraulic mechanism of slope protection via vegetation and will have important theoretical and practical significance for controlling soil erosion and shallow landslides. In addition, these results have great guiding significance for agricultural production, such as irrigation.

Author Contributions

Q.L. carried out experiments and wrote the manuscript; Z.X. and H.X. designed experiments; D.L. analyzed experimental results; L.S. and W.X. participated in the discussion and gave unique insights on the results.

Funding

This study was financially supported by the National Key Research & Development Plan of China (Grant No. 2017YFC0504902-01), the National Natural Science Foundation of China (Grant No. 41790432; 41761144077; 41807068) and the open fund of Key Laboratory of Geological Hazards on Three Gorges Reservoir Area, Ministry of Education (China Three Gorges University) (2017KDZ10; 2018KDZ06). Great appreciation also goes to the editorial board and the reviewers of this paper.

Conflicts of Interest

No conflict of interest exits in the submission of this manuscript, and manuscript is approved by all authors for publication. I would like to declare on behalf of my co-authors that the work described was original research that has not been published previously, and not under consideration for publication elsewhere, in whole or in part. All the authors listed have approved the manuscript that is enclosed.

References

  1. Ho, K.M.Y.; Ng, C.W.W.; Ho, K.K.S.; Tang, W.H. State-dependent soil-water characteristic curves of weathered soils. In Unsaturated Soils 2006; American Society of Civil Engineers: Reston, VA, USA, 2006; Volume 2, pp. 1302–1313. [Google Scholar]
  2. Huat, B.B.K.; Ali, F.H.J.; Low, T.H. Water infiltration characteristics of unsaturated soil slope and its effect on suction and stability. Geotech. Geol. Eng. 2006, 24, 1293–1306. [Google Scholar] [CrossRef]
  3. Lim, T.T.; Rahardjo, H.; Chang, M.F.; Fredlund, D.G. Effect of rainfall on matric suctions in a residual soil slope. Can. Geotech. J. 1996, 33, 618–628. [Google Scholar] [CrossRef]
  4. Ng, C.W.W.; Menzies, B. Advanced Unsaturated Soil Mechanics and Engineering; Taylor and Francis Press: London, UK, 2007. [Google Scholar]
  5. Zhan, T.L.T.; Ng, C.W.W.; Fredlund, D.G. Field study of wetting infiltration into a grassed unsaturated expansive soil slope. Can. Geotech. J. 2007, 44, 392–408. [Google Scholar] [CrossRef]
  6. Watson, A.; Phillips, C.; Marden, M. Root strength, growth, and rates of decay: Root reinforcement changes of two tree species and their contribution to slope stability. Plant Soil 1999, 217, 39–47. [Google Scholar] [CrossRef]
  7. Genet, M.; Stokes, A.; Fourcaud, T. The influence of plant diversity on slope stability in a moist evergreen deciduous forest. Ecol. Eng. 2010, 36, 265–275. [Google Scholar] [CrossRef]
  8. Simon, A.; Collison, A.J.C. Quantifying the mechanical and hydrologic effects of riparian vegetation on streambank stability. Earth Surf. Process. Landf. 2002, 27, 527–546. [Google Scholar] [CrossRef]
  9. Pollen-Bankhead, N.; Simon, A. Hydrologic and hydraulic effects of riparian root networks on streambank stability: Is mechanical root-reinforcement the whole story? Geomorphology 2010, 116, 353–362. [Google Scholar] [CrossRef]
  10. Leung, A.K.; Ng, C.W.W. Analyses of groundwater flow and plant evapotranspiration in a vegetated soil slope. Can. Geotech. J. 2013, 50, 1204–1218. [Google Scholar] [CrossRef]
  11. Smethurst, J.A.; Briggs, K.M.; Powrie, W.; Ridley, A.; Butcher, D.J.E. Mechanical and hydrological impacts of tree removal on a clay fill railway embankment. Géotechnique 2015, 65, 869–882. [Google Scholar] [CrossRef]
  12. Garg, A.; Leung, A.K.; Ng, C.W.W. Comparisons of soil suction induced by evapotranspiration and transpiration of S. heptaphylla. Can. Geotech. J. 2015, 52, 2149–2155. [Google Scholar] [CrossRef]
  13. Ali, N.; Farshhi, I.; Rees, S.W. Soil-root interaction and effects on slope stability analysis. Electron. J. Geotech. Eng. 2012, 17, 319–328. [Google Scholar]
  14. Carminati, A.; Vetterlein, D. Plasticity of rhizosphere hydraulic properties as a key for efficient utilization of scarce resources. Ann. Bot. 2012, 112, 277–290. [Google Scholar] [CrossRef] [PubMed]
  15. Scholl, P.; Leitner, D.; Kammerer, G.; Loiskandl, W.; Kaul, H.P.; Bodner, G. Root induced changes of effective 1D hydraulic properties in a soil column. Plant Soil 2014, 381, 193–213. [Google Scholar] [CrossRef] [PubMed]
  16. Leung, A.K.; Garg, A.; Ng, C.W.W. Effects of plant roots on soil-water retention and induced suction in vegetated soil. Eng. Geol. 2015, 193, 183–197. [Google Scholar] [CrossRef]
  17. Ng, C.W.W.; Ni, J.J.; Leung, A.K.; Zhou, C.; Wang, Z.J. Effects of planting density on tree growth and induced soil suction. Géotechnique 2016, 66, 711–724. [Google Scholar] [CrossRef]
  18. Kirschbaum, M.U.F. Direct and indirect climate change effects on photosynthesis and transpiration. Plant Biol. 2004, 6, 242–253. [Google Scholar] [CrossRef]
  19. Ng, C.W.W.; Leung, A.K. Measurements of drying and wetting permeability functions using a new stress-controllable soil column. J. Geotech. Geoenviron. Eng. 2012, 138, 58–68. [Google Scholar] [CrossRef]
  20. Jotisankasa, A.; Sirirattanachat, T. Effects of grass roots on soil-water retention curve and permeability function. Can. Geotech. J. 2017, 54, 1612–1622. [Google Scholar] [CrossRef]
  21. Veylon, G.; Ghestem, M.; Stokes, A.; Bernard, A. Quantification of mechanical and hydric components of soil reinforcement by plant roots. Can. Geotech. J. 2015, 52, 1839–1849. [Google Scholar] [CrossRef]
  22. Blight, G.E. The vadose-zone soil-water balance and transpiration rates of vegetation. Géotechnique 2003, 53, 55–64. [Google Scholar] [CrossRef]
  23. Hemmati, S.; Gatmiri, B.; Cui, Y.J.; Vincent, M. Thermo-hydro-mechanical modelling of soil settlements induced by soil-vegetation-atmosphere interactions. Eng. Geol. 2012, 139, 1–16. [Google Scholar] [CrossRef]
  24. Ng, C.W.W.; Leung, A.K.; Garg, A.; Woon, K.X.; Chu, L.M.; Hau, B.C.H. Soil suction induced by grass and tree in an atmospheric-controlled plant room. In Proceedings of the 18th International Conference on Soil Mechanics and Geotechnical Engineering, Paris, France, 2–6 September 2013; pp. 1167–1170. [Google Scholar]
  25. Ng, C.W.W. Atmosphere-plant-soil interactions: Theories and mechanisms. Chin. J. Geotech. Eng. 2017, 39, 1–47. [Google Scholar]
  26. Ng, C.W.W.; Leung, A.K.; Woon, K.X. Effects of soil density on grass-induced suction distributions in compacted soil subjected to rainfall. Can. Geotech. J. 2014, 51, 311–321. [Google Scholar] [CrossRef]
  27. Rahardjo, H.; Satyanaga, A.; Leong, E.C.; Santoso, V.A.; Ng, Y.S. Performance of an instrumented slope covered with shrubs and deep-rooted grass. Soils Found 2014, 54, 417–425. [Google Scholar] [CrossRef]
  28. Kim, J.; Hwang, W.; Kim, Y. Effects of hysteresis on hydro-mechanical behavior of unsaturated soil. Eng. Geol. 2018, 245, 1–9. [Google Scholar] [CrossRef]
  29. Jeong, S.; Kim, Y.; Park, H.; Kim, J. Effects of rainfall infiltration and hysteresis on the settlement of shallow foundations in unsaturated soil. Environ. Earth Sci. 2018, 77, 494. [Google Scholar] [CrossRef]
  30. Macneil, D.J.; Steele, D.P.; McMahon, W.; Carder, D.R. Vegetation for Slope Stability-Prepared for Quality Services, Civil Engineering, Highways Agency; TRL Report Press: Berkshire, UK, 2001. [Google Scholar]
  31. Lin, K.H.; Huang, M.Y.; Huang, W.D.; Hsu, M.H.; Yang, Z.W.; Yang, C.M. The effects of red, blue, and white light-emitting diodes on the growth, development, and edible quality of hydroponically grown lettuce (Lactuca sativa L. var. capitata). Sci. Hortic. 2013, 150, 86–91. [Google Scholar] [CrossRef]
  32. Sergejeva, D.; Alsina, I.; Duma, M.; Dubova, L.; Augspole, I.; Erdberga, I.; Berzina, K. Evaluation of different lighting sources on the growth and chemical composition of lettuce. Agron. Res. 2018, 16, 892–899. [Google Scholar]
  33. Foster, S.M. Effect of Aquaponic vs. Hydroponic Nutrient Solution, LED Light Intensity and Photoperiod on Indoor Plant Growth of Butterhead, Romaine and Kale (L. sativa, B. oleracea). Master’s Thesis, California Polytechnic State University, San Luis Obispo, CA, USA, 2018. [Google Scholar]
  34. Song, W.K.; Cui, Y.J.; Tang, A.M.; Ding, W.Q.; Wang, Q. Experimental study on water evaporation from compacted clay using environmental chamber. Can. Geotech. J. 2016, 53, 1293–1304. [Google Scholar] [CrossRef]
  35. Ni, J.J.; Ng, C.W.W.; Guo, H.W. Effects of plant characteristics and soil type on transpiration reduction. In Proceedings of the 7th International Conference on Unsaturated Soils, Hongkong, China, 3–5 August 2018. [Google Scholar]
  36. Mahmood, K.; Kim, J.M.; Ashraf, M. The effect of soil type on matric suction and stability of unsaturated slope under uniform rainfall. KSCE J. Civ. Eng. 2016, 20, 1294–1299. [Google Scholar] [CrossRef]
  37. Hassan, M.A.; Ismail, M.A.M. Effect of soil types on the development of matric suction and volumetric water content for dike embankment during over topping tests. Civ. Eng. J. 2018, 4, 668–688. [Google Scholar] [CrossRef]
  38. Indraratna, B.; Fatahi, B.; Khabbaz, H. Numerical analysis of matric suction effects of tree roots. Geotech. Eng. 2006, 159, 77–90. [Google Scholar] [CrossRef]
  39. Priya, M.I.; Garg, A.; Sreedeep, S.; Sarmah, A.; Daud, N.N.N. Prediction of vegetation-induced soil suction using numerical modelling and AI. In The International Congress on Environmental Geotechnics; Springer: Berlin/Heidelberg, Germany, 2018; pp. 351–358. [Google Scholar]
  40. ASTM. Standard Practice for Classification of Soils for Engineering Purposes (Unified Soil Classification System); ASTM standard D2487; American Society for Testing and Materials: West Conshohocken, PA, USA, 2010. [Google Scholar]
  41. Van Genuchten, M. A closed-form equation for predicting the hydraulic conductivity of unsaturated soils. Soil Sci. Soc. Am. J. 1980, 44, 892–898. [Google Scholar] [CrossRef]
  42. Xu, W.N.; Xia, D.; Zhao, B.Q.; Xia, Z.Y.; Liu, D.X.; Zhou, M.T. Technical Research of Vegetation Restoration in Disturbance Area of Hydropower Project; Science Press: Beijing, China, 2017. [Google Scholar]
  43. Xia, Z.Y.; Liu, Q.; Xu, W.X.; Rao, Y.K.; Zhang, H. Characteristics of interface friction between Indigofera amblyantha root system and soil. J. Soil Water Conserv. 2018, 32, 128–134. [Google Scholar]
  44. Gallipoli, D.; Wheeler, S.J.; Karstunen, M. Modelling the variation of degree of saturation in a deformable unsaturated soil. Géotechnique 2003, 53, 105–112. [Google Scholar] [CrossRef]
  45. Bengough, A.G.; Mullins, C.E. Mechanical impedance to root growth: A review of experimental techniques and root growth responses. Soil Sci. 1990, 41, 341–358. [Google Scholar] [CrossRef]
  46. Lipiec, J.; Hakansson, I. Influences of degree of compactness and matric water tension on some important plant growth factors. Soil Tillage Res. 2000, 53, 87–94. [Google Scholar] [CrossRef]
  47. Hu, Y.J. Studies of the Balcony Greening Forms Effects on the Air Temperature and Relative Humidity of Indoor; Donghua University: Shanghai, China, 2010. [Google Scholar]
  48. Gao, L.J. Study on Water Use Strategy of Populus Euphratica under the Different Moisture Gradient; Xinjiang University: Urumchi, China, 2013. [Google Scholar]
  49. Gabrm, A.; Akran, M.; Taylor, H.M. Effect of simulated roots on the permeability of silty soil. Geotech. Test. J. 1995, 18, 112–115. [Google Scholar]
  50. Kong, L.W.; Li, X.M.; Tian, H.N. Effect of fines content on permeability coefficient of sand and its correlation with state parameters. Rock Soil Mech. 2011, 32, 21–26. [Google Scholar]
  51. Aravena, J.E.; Berli, M.; Ghezzehei, T.A.; Tyler, S.W. Effects of root-induced compaction on rhizosphere hydraulic properties-X-ray microtomography imaging and numerical simulations. Environ. Sci. Technol. 2011, 45, 425–431. [Google Scholar] [CrossRef]
  52. Romero, E.; Gens, A.; Lloret, A. Water permeability, water retention and microstructure of unsaturated compacted boom clay. Eng. Geol. 1999, 54, 117–127. [Google Scholar] [CrossRef]
  53. Nuth, M.; Laloui, L. Advances in modelling hysteretic water retention curve in deformable soils. Comput. Geotech. 2008, 35, 835–844. [Google Scholar] [CrossRef]
Figure 1. Particles grading curves of experimental soils.
Sustainability 11 06475 g001
Figure 2. Soil water characteristic curves of experimental soils.
Sustainability 11 06475 g002
Figure 3. (a) Overview of water evapotranspiration tests; (b,c) surface conditions and instrumentation setup for the first and third test series; and (d,e) surface conditions for the second test series.
Sustainability 11 06475 g003
Figure 4. Schematic diagram showing test setup and rainfall simulator for simulating constant rainfall intensity during rainfall testing.
Sustainability 11 06475 g004
Figure 5. Soil water characteristic curves of bare and vegetated Sandy silt.
Sustainability 11 06475 g005
Figure 6. Surface temperatures of specimens.
Sustainability 11 06475 g006
Figure 7. Surface moisture contents of specimens.
Sustainability 11 06475 g007
Figure 8. Variations of matric suction induced by plant transpiration-like.
Sustainability 11 06475 g008
Figure 9. Variations of matric suction with depth on conditions of 36 W/m2 and 275 W/m2.
Sustainability 11 06475 g009
Figure 10. Variations of matric suction in bare soil on conditions of 36 W/m2 and 275 W/m2.
Sustainability 11 06475 g010
Figure 11. Variations of matric suction in vegetated soils on conditions of 36 W/m2 and 275 W/m2.
Sustainability 11 06475 g011
Figure 12. Variations of leaf temperature on conditions of 36 W/m2 and 275 W/m2.
Sustainability 11 06475 g012
Figure 13. Variations of matric suction with depth in different soils.
Sustainability 11 06475 g013
Figure 14. Variations of matric suction at 10 cm depth with time for different soils during water evapotranspiration test.
Sustainability 11 06475 g014
Figure 15. Variations of matric suction at 10 cm depth with time for different soils during rainfall test.
Sustainability 11 06475 g015
Table 1. The basic physical properties of experimental soils.
Soil TypesSpecific GravityOptimum Moisture Content/%Maximum Dry Density/%pH ValueLiquid Limit/%Plastic Limit/%Saturated Permeability Coefficient/m·s−1
Fine sandy loam2.5814.31.386.2--3.23 × 10⁻⁵
Sandy silt2.6918.61.616.527.522.55.75 × 10−6
Silty clay2.7319.21.706.730.118.72.67 × 10−7
Table 2. List of soil water characteristic curve fitting parameters.
Soil Types W r   W s a t   anm R 2
Fine sandy loam0.0320.3525.471.4690.3190.935
Sandy silt0.0650.42728.42.1250.5290.924
Silty clay0.0770.48343.12.3520.5750.874
In the table, W r and W s a t are residual and saturated volumetric water content, respectively. a is a parameter that depends approximately on the air-entry value, n and m are parameters that describe the shape of the curve, m = 1 − 1/n.
Table 3. Summary of parameters for Gallipoli model.
Soil TypeeParameters for Equation
Sandy silt0.558 m 1 m 2 m 3 /kPa m 4 e 1
0.6891.7077.2153.2180.536
Table 4. Surface indexes and analysis of specimens.
Specimen TypesAerial Biomass/gRoot Biomass/gSurface Indexes1d2d3d4d5d6d7d8d9d10dP
Bare soil--MC (%)18.6813.5210.689.478.127.646.946.425.705.33−0.946
Temp. (℃)19.620.020.621.722.522.923.123.223.323.4
Vegetated soil 110.806 + 28.3518.110MC (%)19.0416.4713.8812.0311.4310.559.999.308.778.44−0.937
Temp. (℃)19.519.619.719.820.020.220.420.821.422.0
Vegetated soil 28.649 + 26.0656.678MC (%)18.9615.2713.5411.7510.9710.299.629.108.558.22−0.936
Temp. (℃)19.619.719.820.020.120.420.520.921.522.1
In the column of aerial biomass in the table, the former is the dry weight of leaves, the latter is the dry weight of stems. MC is moisture content and Temp. is surface temperature in the column of surface indexes.
Table 5. Mean matric suction of specimens under water evapotranspiration.
Specimen Types.Aerial Biomass/gRoot Biomass/gSoil Depth/cmMean Matric Suction/kPa
1d2d3d4d5d6d7d8d9d10d
Bare soil--53.878.4111.7115.4218.4621.3723.5725.2526.4827.32
103.825.216.508.2910.8513.9016.5018.4219.9221.53
153.844.425.035.756.577.518.549.7111.0313.07
203.894.094.384.725.115.556.056.617.248.31
Vegetated soil 110.806 + 28.3518.11054.267.749.7612.7115.8119.2922.8225.1226.9828.19
104.536.839.1811.8014.7118.0320.8022.8724.5426.29
154.336.287.248.439.9511.6913.4315.1116.8319.30
204.224.635.155.726.367.027.708.429.2210.45
Vegetated soil 28.649 + 26.0656.67854.197.109.4512.7515.8119.3422.4524.4926.4227.89
104.235.727.279.1812.1615.1018.1520.5323.0424.02
154.334.956.386.707.518.9210.5811.5814.4116.43
204.234.764.545.465.806.117.308.038.499.42
In the column of aerial biomass in the table, the former is the dry weight of leaves, and the latter is the dry weight of stems.
Table 6. Characteristic parameters of plants.
Specimen TypesSoil Depth/cmAerial Biomass/gLeaf Area IndexRoot Biomass/gRoot Area IndexRoot Volume RatioSuction 1/kPaSuction 2/kPa
Bare soil0–10-----8.131.34
10–20---2.331.01
Vegetated soil 10–102.263 + 9.7062.3975.1863.5430.0312911.172.47
10–202.9243.1280.029343.831.17
Vegetated soil 20–102.182 + 9.1642.1514.0893.0230.0328910.241.95
10–202.5892.9740.031323.640.69
In the column of aerial biomass in the table, the former is the dry weight of leaves, the latter is the dry weight of stems. Suction 1 and suction 2 are the matric suction increments under the conditions of 275 W/m2 and 36 W/m2, respectively.
Table 7. Mean matric suction of different soils at 10 cm depth under water evapotranspiration.
Soil Types.Specimen TypesAerial Biomass/gRoot Biomass/gMean Matric Suction/kPa
1d2d3d4d5d6d7d8d9d10d
Fine sandy loamBare soil
Vegetated soil
--2.293.154.736.627.538.489.7411.1714.0815.02
10.278 + 28.8898.8612.573.705.096.947.898.7610.7112.6815.0616.37
Sandy siltBare soil
Vegetated soil
--3.555.8711.2415.3116.3317.2819.2122.1823.8024.39
8.649 + 26.0656.6783.316.2212.9818.1019.9221.4323.6627.3228.7930.91
Silty clayBare soil
Vegetated soil
--3.085.079.6713.1613.9614.8416.5019.0420.4321.79
8.128 + 24.3116.7363.358.8315.0717.4919.1820.5823.0126.7528.4529.53
In the column of aerial biomass in the table, the former is the dry weight of leaves, and the latter is the dry weight of stems.

