Sympatric Bat Species Prey Opportunistically on a Major Moth Pest of Pecans


Abstract
1. Introduction
2. Materials and Methods
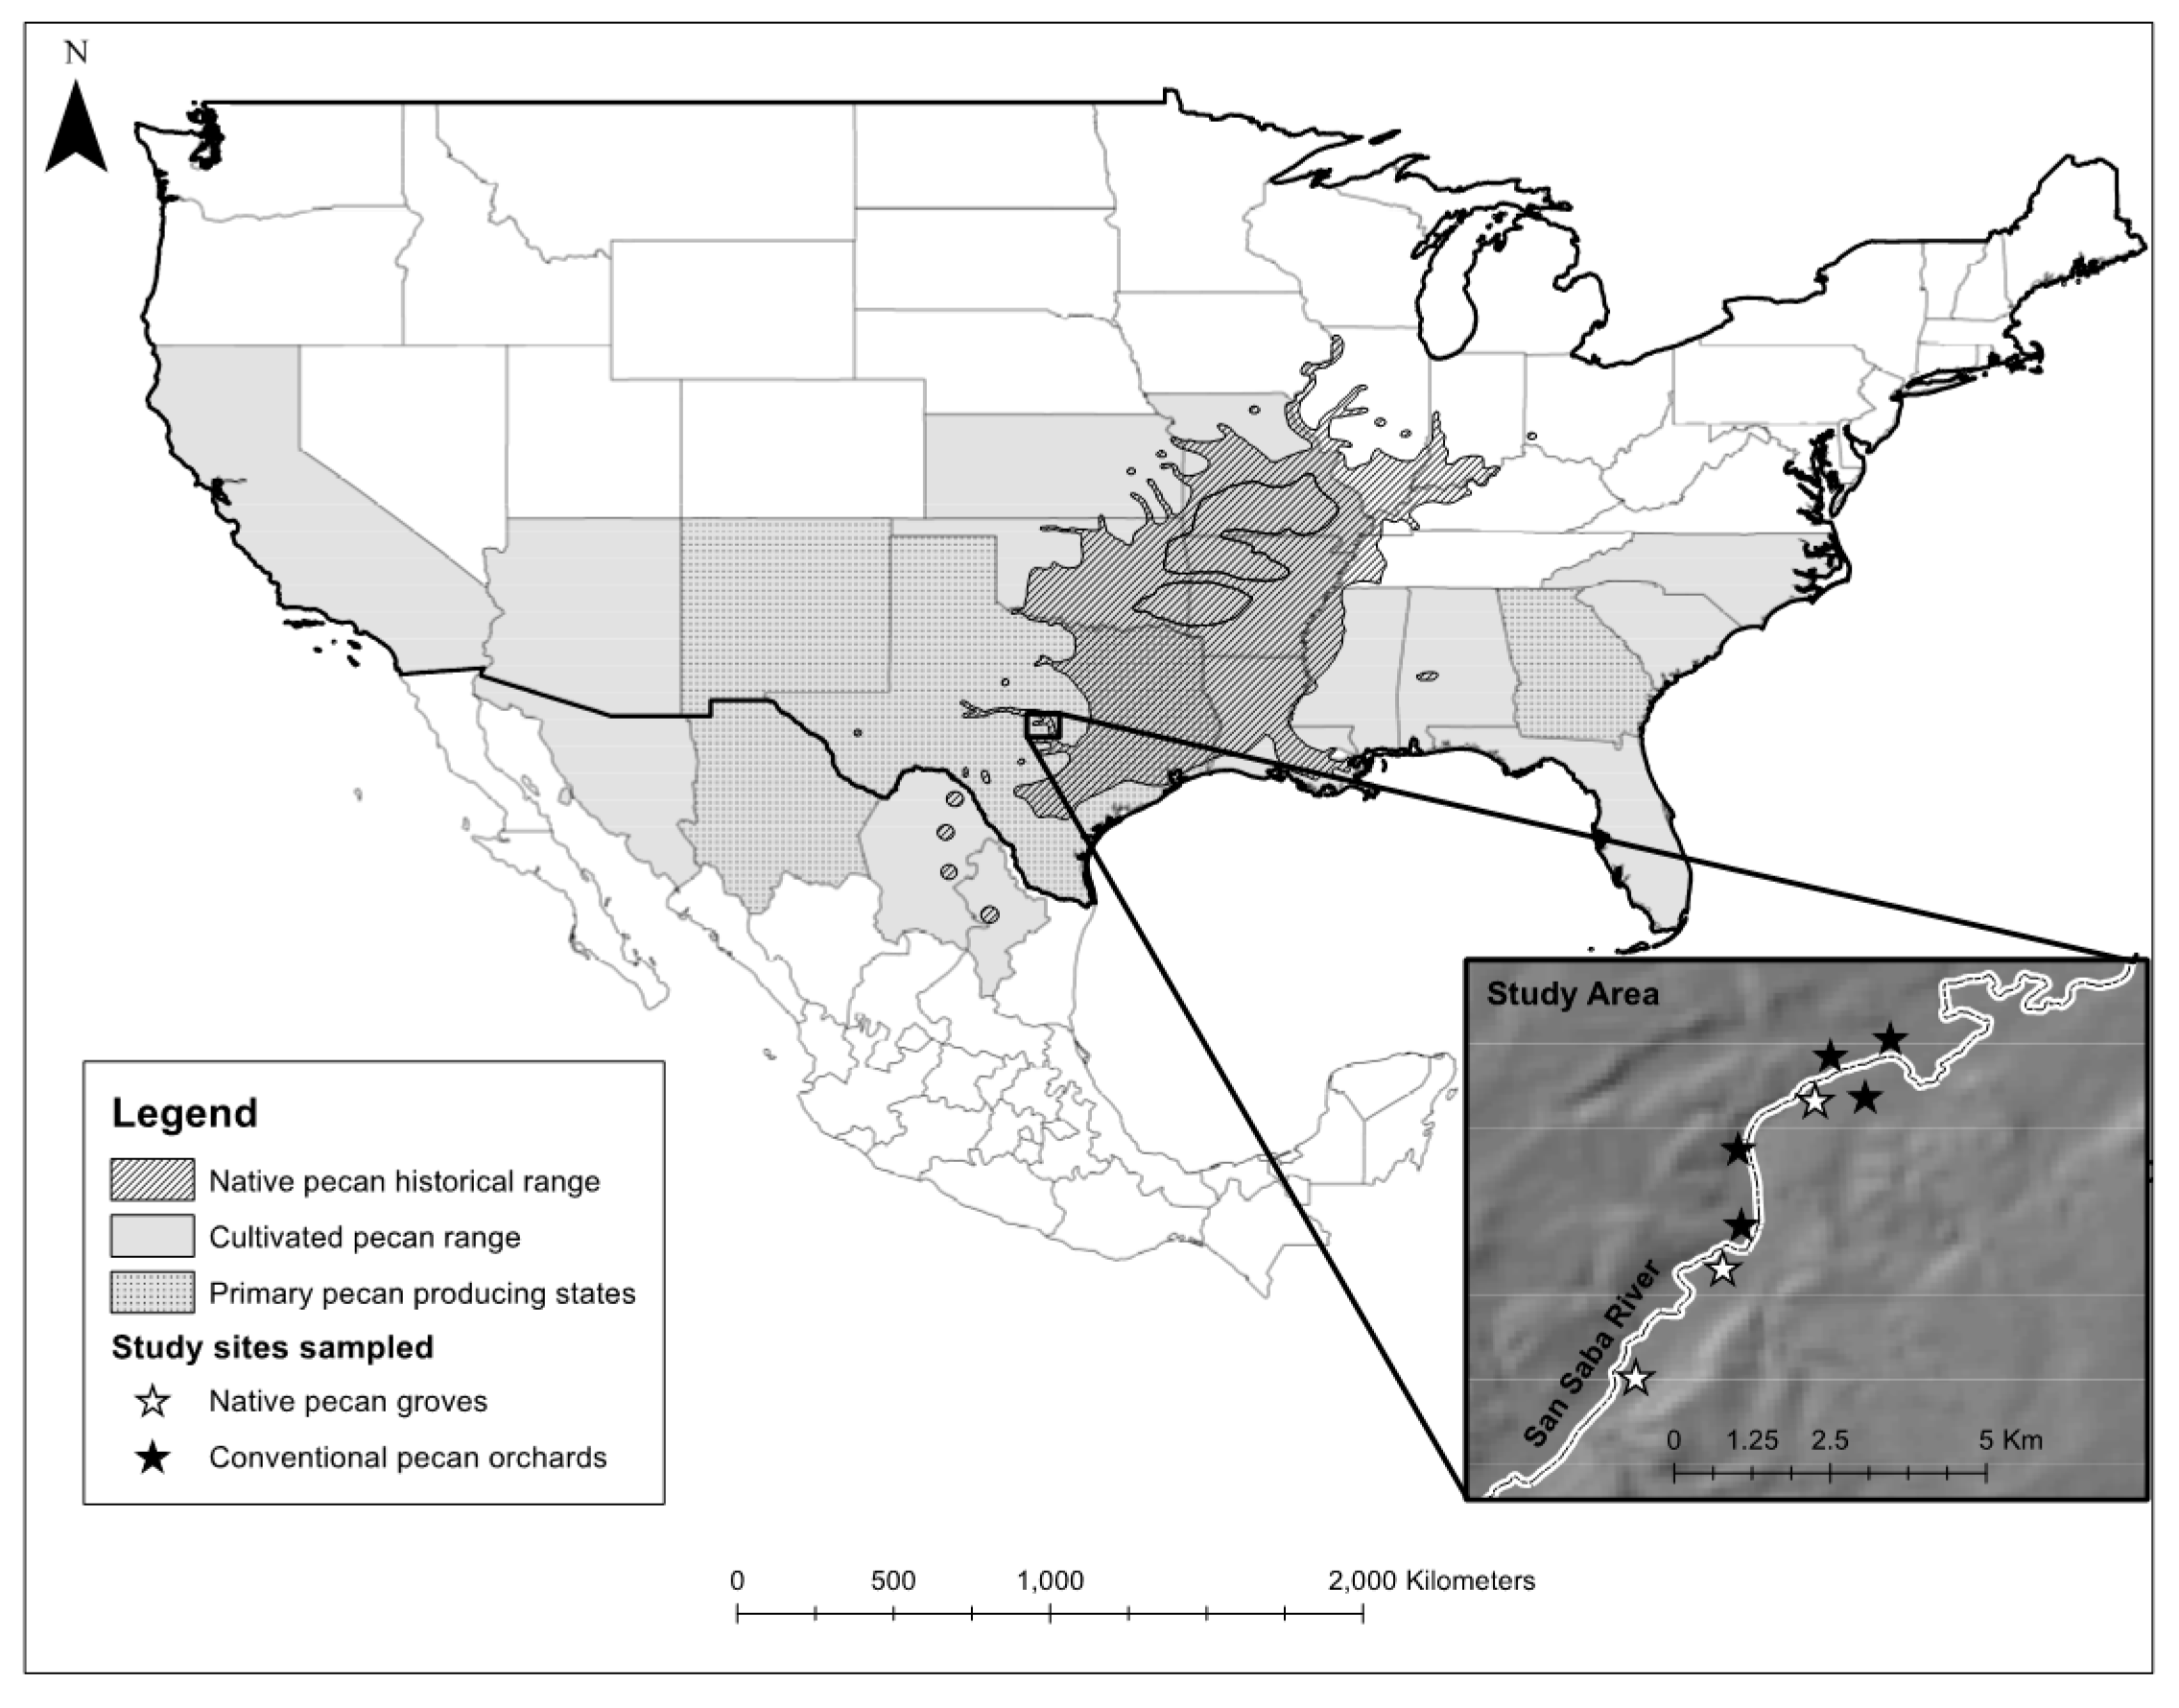
2.1. Study Area
2.2. Sample Collection
2.2.1. Collection of Feces
2.2.2. PNC Availability – Pheromone Traps
2.2.3. PNC Availability–Black Light Traps
2.3. Fecal Analysis
2.3.1. DNA Extraction
2.3.2. qPCR Analysis
2.3.3. Control for False Negatives
2.4. Statistical Analyses
3. Results
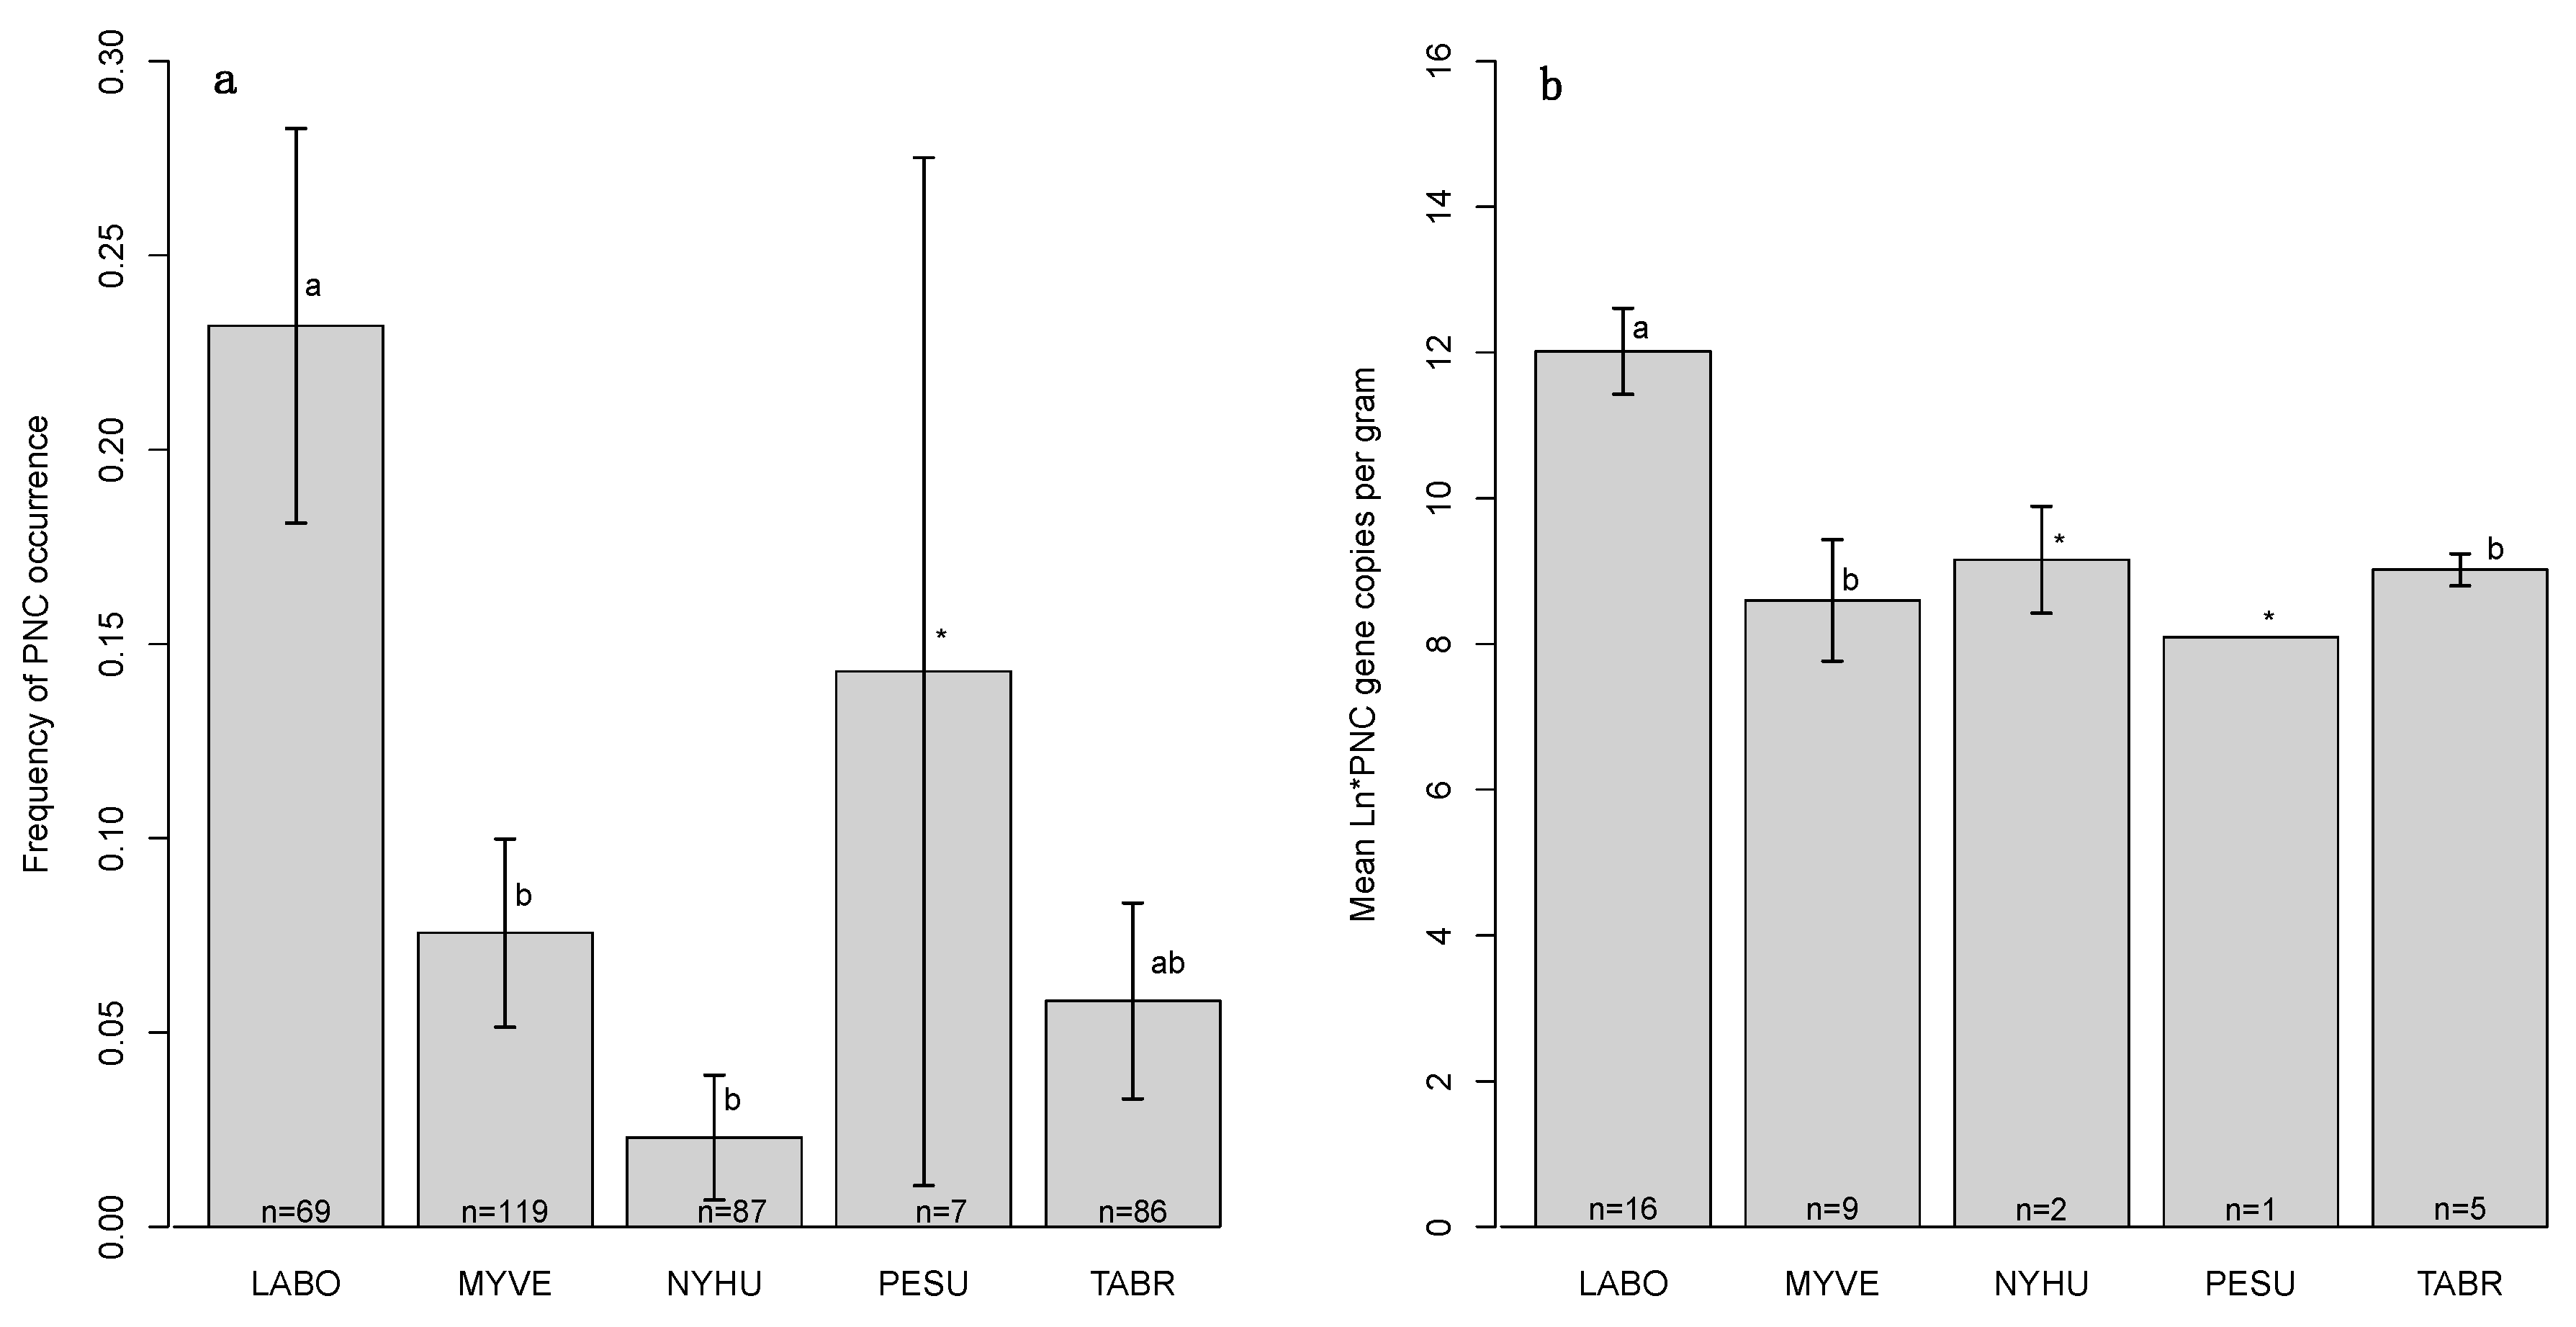
3.1. PNC Detection
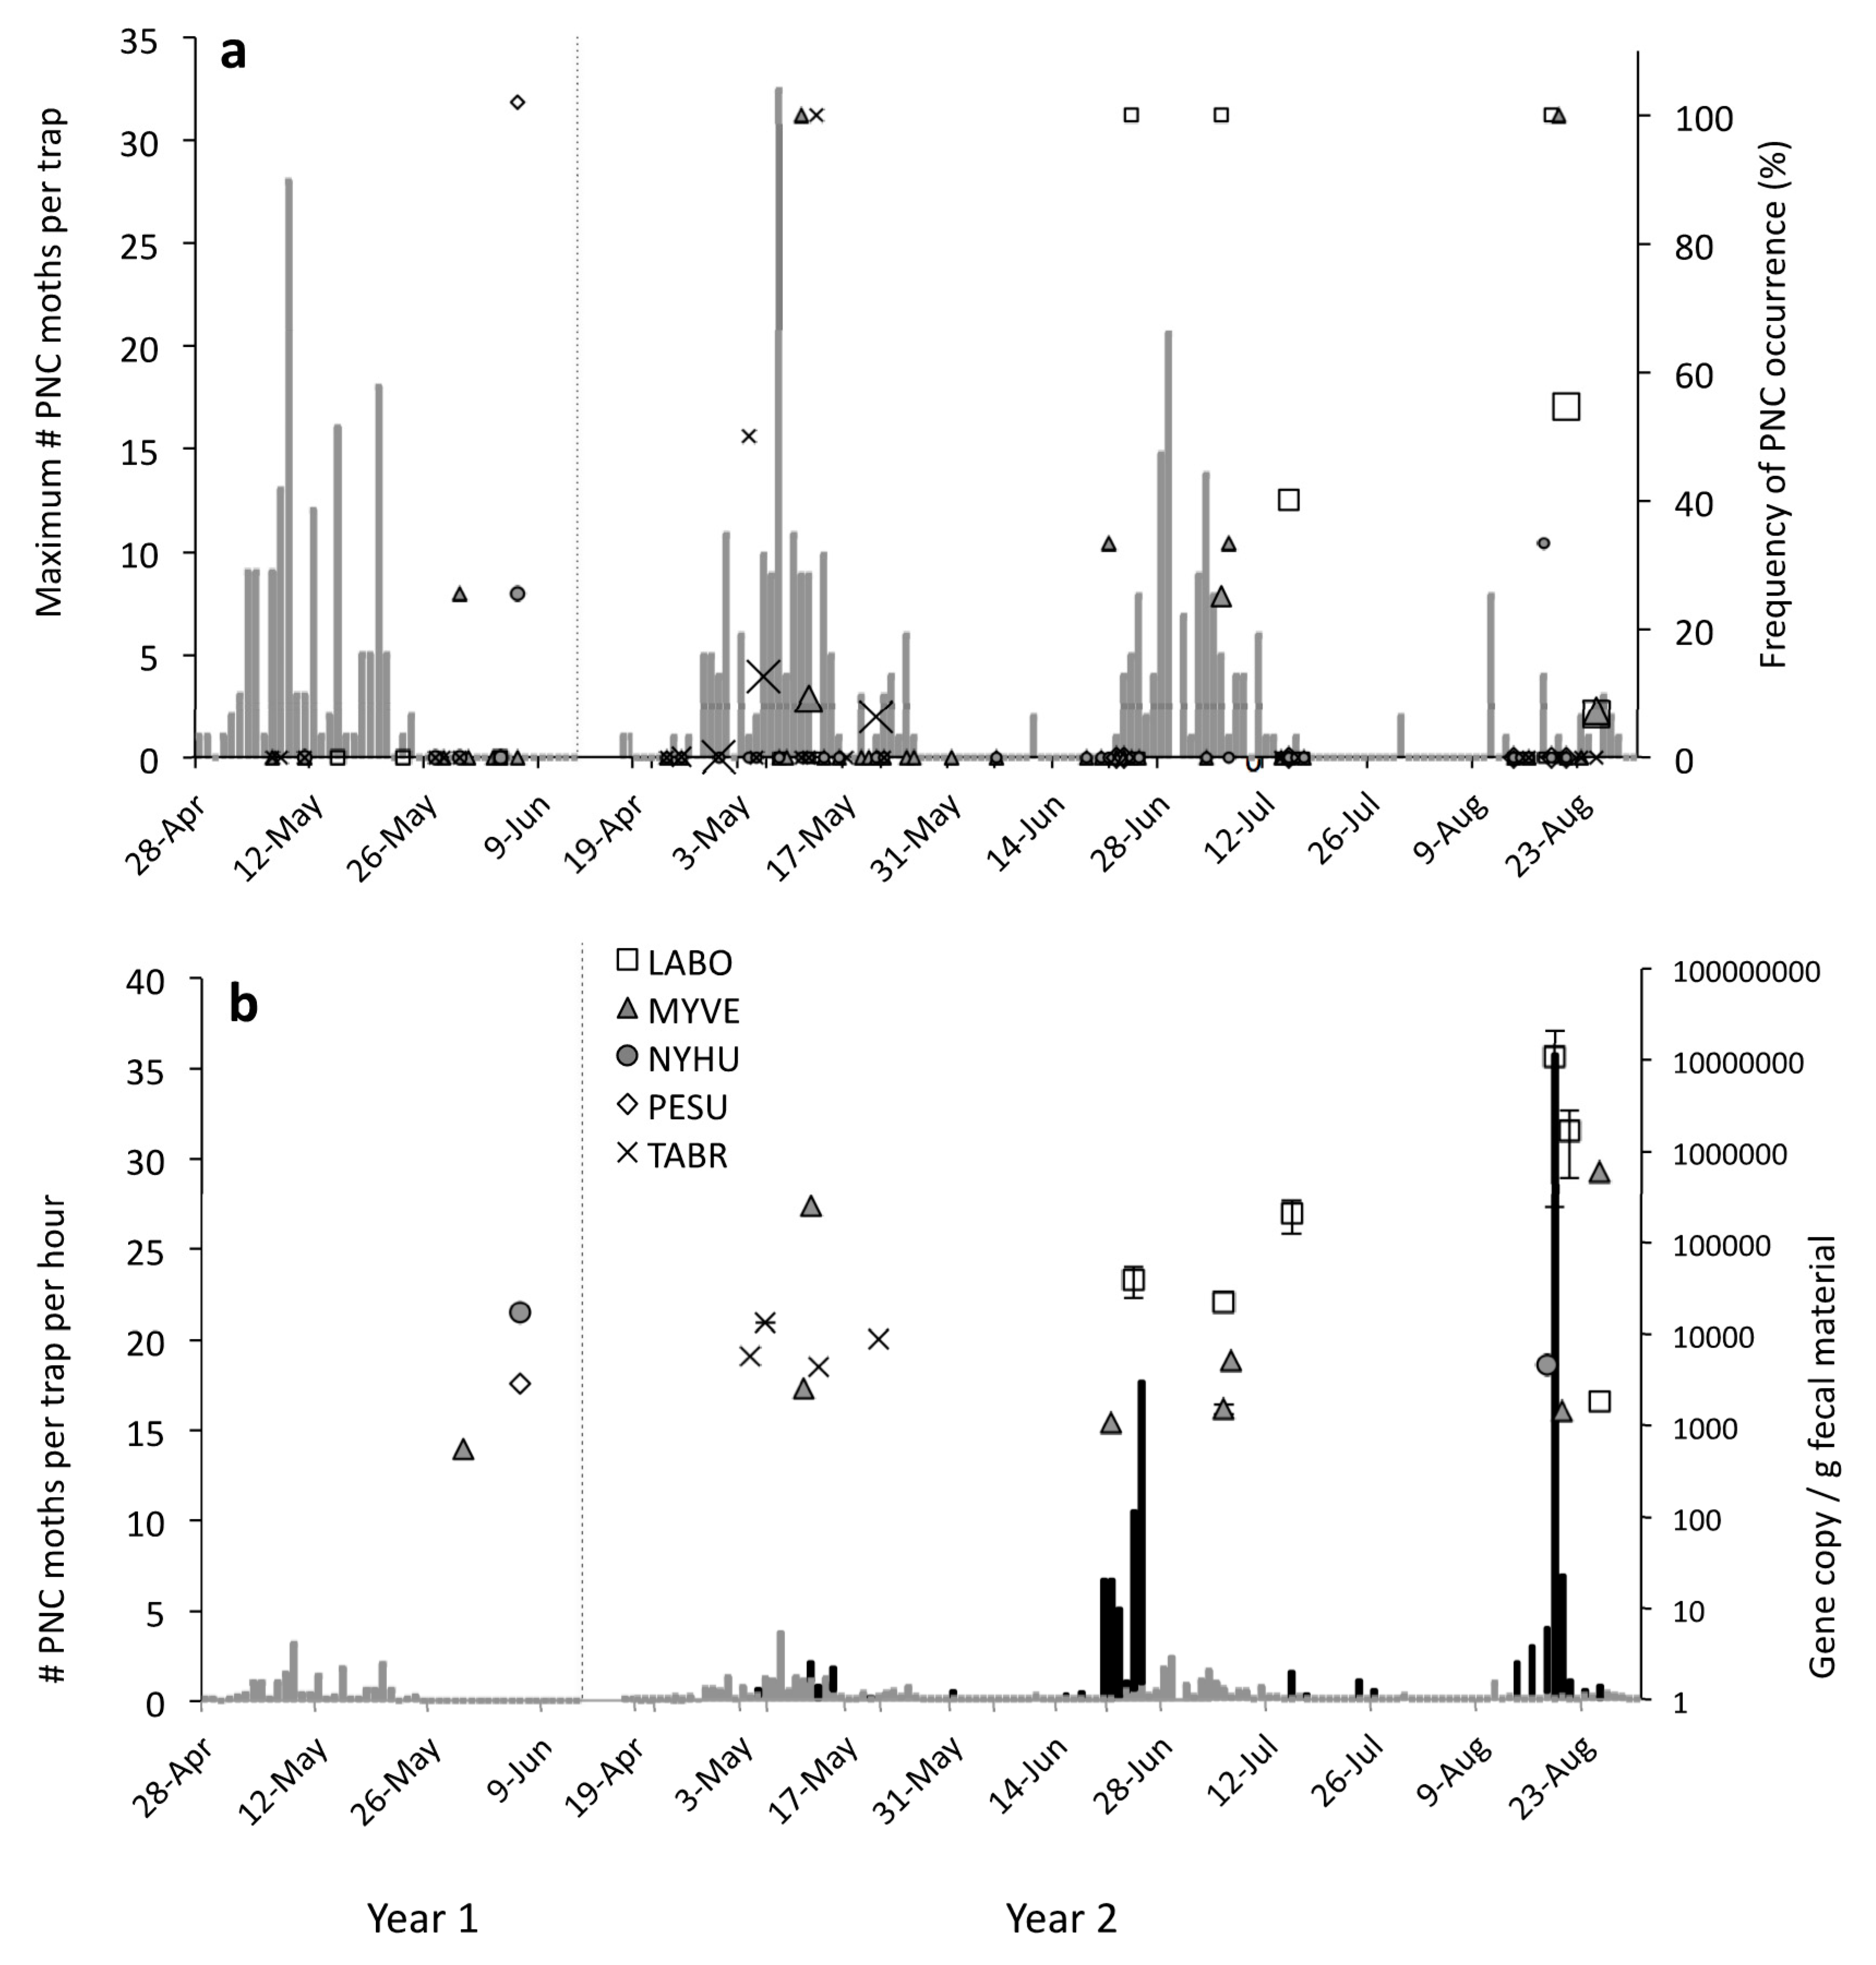
3.2. Temporal Predator-Prey Patterns
3.2.1. Pheromone Traps
3.2.2. Black-Light Traps
4. Discussion
Temporal Predator-Prey Patterns
5. Conclusions: Conservation and Management Implications
Supplementary Materials
Author Contributions
Funding
Acknowledgments
Conflicts of Interest
Appendix A

| Explanatory Variable | Type | Description | Sample Size | |
|---|---|---|---|---|
| Bats | Nights | |||
| Study Year | Factor | Year one (2008) | 47 | 10 |
| Year two (2009) | 321 | 41 | ||
| Agroecosystem type | Factor | Native pecan groves | 246 | 38 |
| Conventional pecan orchards | 122 | 13 | ||
| Bat Species | Factor | Eastern red bat, Lasiurus borealis | 69 | 19 |
| Cave myotis, Myotis velifer | 119 | 38 | ||
| Evening bat, Nycticeius humeralis | 87 | 33 | ||
| Tri-colored bat, Perimyotis subflavus | 7 | 6 | ||
| Brazilian free-tailed bat, Tadarida brasiliensis | 86 | 19 | ||
| Individuals Bat Characteristics | ||||
| Age | Factor | Juvenile | 116 | 22 |
| Adult | 250 | 50 | ||
| Sex | Factor | Male | 170 | 41 |
| Female | 196 | 48 | ||
| Body Condition Index (BCI) | Continuous | Mass (g) / Forearm length (mm) | 362 | 50 |
| Time of Capture | Factor | Evening (2000–0100 h) | 192 | 44 |
| Morning (0101–0600 h) | 176 | 35 | ||
| PNC Availability (PNC moth counts from pheromone traps) | ||||
| Mean PNC | Continuous | Mean nightly moth counts per trap | 347 | 44 |
| Mean PNC-1 | Continuous | Mean nightly moth counts per trap from night prior to night of bat capture | 347 | 44 |
| Maximum PNC | Integer | Maximum nightly moth count recorded for any trap in study area | 347 | 44 |
| PNC Generation | Factor | PNC generation one, two or three | 368 | 51 |
| PNC Availability (PNC moth counts and biomass from black light traps) | ||||
| Total PNC Abundance | Continuous | PNC abundance per trap hour | 177 | 22 |
| Total PNC Biomass | Continuous | PNC biomass per trap hour | 177 | 22 |
| Proportional abundance of PNC-sized moths | Proportion | No. PNC / PNC-sized moths (5-20mm) | 177 | 22 |
| Proportional Biomass of PNC-sized moths | Proportion | PNC biomass / all PNC sized moths (5-20mm) | 177 | 22 |
| Proportional Abundance of prey-sized moths | Proportion | No. PNC / all prey sized moths (5-30mm) | 177 | 22 |
| Proportional Biomass of prey-sized moths | Proportion | PNC biomass / all prey sized moths (5-30mm) | 177 | 22 |
| Proportional Abundance of total prey-sized insects | Proportion | No. PNC / all prey sized insects (5-30mm) | 177 | 22 |
| Proportional Biomass of total prey-sized insects | Proportion | PNC biomass / prey-sized insects (5-30mm) | 177 | 22 |
| Proportional Abundance of total insects | Proportion | No. PNC / all insects (all sizes) | 177 | 22 |
| Proportional Biomass of total insects | Proportion | PNC biomass / all insects (all sizes) | 177 | 22 |
References
- Costamagna, A.C.; Landis, D.A. Predators exert top-down control of soybean aphid across a gradient of agricultural management systems. Ecol. Appl. Publ. Ecol. Soc. Am. 2006, 16, 1619–1628. [Google Scholar] [CrossRef]
- Naylor, R.L.; Ehrlich, P.R. Natural pest control services and agriculture. In Nature’s Services; Daily, G.C., Ed.; Island Press: Washington, DC, USA, 1997; pp. 151–176. [Google Scholar]
- Symondson, W.O.C.; Sunderland, K.D.; Greenstone, M.H. Can generalist predators be effective biocontrol agents? Annu. Rev. Entomol. 2002, 47, 561–594. [Google Scholar] [CrossRef] [PubMed]
- Hawkins, B.A.; Mills, N.J.; Jervis, M.A.; Price, P.W. Is the biological control of insects a natural phenomenon? Oikos 1999, 86, 493–506. [Google Scholar] [CrossRef]
- Landis, D.A.; van der Werf, W. Early season predation impacts the establishment of aphids and spread of beet yellows virus in sugar beet. Entomophaga 1997, 42, 499–516. [Google Scholar] [CrossRef]
- Wiedenmann, R.N.; Smith, J.W. Attributes of natural enemies in ephemeral crop habitats. Biol. Control 1997, 10, 16–22. [Google Scholar] [CrossRef]
- Cook, S.P.; Smith, H.R.; Hain, F.P.; Hastings, F.L. Predation of gypsy moth (Lepidoptera: Lymantriidae) pupae by invertebrates at low small mammal population densities. Environ. Entomol. 1995, 24, 1234–1238. [Google Scholar] [CrossRef]
- Ehler, L.E. Invasion biology and biological control. Biol. Control 1998, 13, 127–133. [Google Scholar] [CrossRef]
- Federico, P.; Hallam, T.G.; McCracken, G.F.; Purucker, S.T.; Grant, W.E.; Correa-Sandoval, A.N.; Westbrook, J.K.; Medellin, R.A.; Cleveland, C.J.; Sansone, C.G.; et al. Brazilian free-tailed bats as insect pest regulators in transgenic and conventional cotton crops. Ecol. Appl. 2008, 18, 826–837. [Google Scholar] [CrossRef]
- Dainese, M.; Schneider, G.; Krauss, J.; Steffan-Dewenter, I. Complementarity among natural enemies enhances pest suppression. Sci. Rep. 2017, 7, 8172. [Google Scholar] [CrossRef]
- Kunz, T.H.; Braun de Torrez, E.C.; Bauer, D.M.; Lobova, T.; Fleming, T.H. Ecosystem services provided by bats. Ann. N. Y. Acad. Sci. 2011, 1223, 1–38. [Google Scholar] [CrossRef]
- Ghanem, S.J.; Voigt, C.C. Increasing Awareness of Ecosystem Services Provided by Bats. Adv. Stud. Behav. 2012, 44, 279–302. [Google Scholar]
- Maine, J.J.; Boyles, J.G. Bats initiate vital agroecological interactions in corn. Proc. Natl. Acad. Sci. USA 2015, 112, 12438–12443. [Google Scholar] [CrossRef] [PubMed]
- Russo, D.; Bosso, L.; Ancillotto, L. Novel perspectives on bat insectivory highlight the value of this ecosystem service in farmland_ Research frontiers and management implications. Agric. Ecosyst. Environ. 2018, 266, 31–38. [Google Scholar] [CrossRef]
- Aizpurua, O.; Budinski, I.; Georgiakakis, P.; Gopalakrishnan, S.; Ibañez, C.; Mata, V.; Rebelo, H.; Russo, D.; Szodoray-Parádi, F.; Zhelyazkova, V.; et al. Agriculture shapes the trophic niche of a bat preying on multiple pest arthropods across Europe: Evidence from DNA metabarcoding. Mol. Ecol. 2018, 27, 815–825. [Google Scholar] [CrossRef] [PubMed]
- Krauel, J.J.; Brown, V.A.; Westbrook, J.K.; McCracken, G.F. Predator–prey interaction reveals local effects of high-altitude insect migration. Oecologia 2018, 186, 49–58. [Google Scholar] [CrossRef]
- Clare, E.L. Molecular detection of trophic interactions: Emerging trends, distinct advantages, significant considerations and conservation applications. Evol. Appl. 2014, 7, 1144–1157. [Google Scholar] [CrossRef]
- Vesterinen, E.J.; Ruokolainen, L.; Wahlberg, N.; Peña, C.; Roslin, T.; Laine, V.N.; Vasko, V.; Sääksjärvi, I.E.; Norrdahl, K.; Lilley, T.M. What you need is what you eat? Prey selection by the bat Myotis daubentonii. Mol. Ecol. 2016, 25, 1581–1594. [Google Scholar] [CrossRef]
- Maas, B.; Clough, Y.; Tscharntke, T. Bats and birds increase crop yield in tropical agroforestry landscapes. Ecol. Lett. 2013, 16, 1480–1487. [Google Scholar] [CrossRef]
- McCracken, G.F.; Westbrook, J.K.; Brown, V.A.; Eldridge, M.; Federico, P.; Kunz, T.H. Bats Track and Exploit Changes in Insect Pest Populations. PLoS ONE 2012, 7, e43839. [Google Scholar] [CrossRef]
- Brown, V.A.; Braun de Torrez, E.C.; McCracken, G.F. Crop pests eaten by bats in organic pecan orchards. Crop Prot. 2015, 67, 66–71. [Google Scholar] [CrossRef]
- Kremen, C.; Williams, N.; Aizen, M.; Gemmill-Herren, B.; LeBuhn, G.; Minckley, R.; Packer, L.; Potts, S.; Roulston, T.; Steffan-Dewenter, I. Pollination and other ecosystem services produced by mobile organisms: A conceptual framework for the effects of land-use change. Ecol. Lett. 2007, 10, 299–314. [Google Scholar] [CrossRef] [PubMed]
- Maas, B.; Karp, D.S.; Bumrungsri, S.; Kevin Darras, D.G.; Huang, J.C.C.; Lindell, C.A.; Maine, J.J.; Mestre, L.; Michel, N.L.; Morrison, E.B.; et al. Bird and bat predation services in tropical forests and agroforestry landscapes. Biol. Rev. 2016, 91, 1081–1101. [Google Scholar] [CrossRef] [PubMed]
- Harris, M.K. Integrated pest management of pecans. Annu. Rev. Entomol. 1983, 28, 291–318. [Google Scholar] [CrossRef]
- Stevenson, D.E.; Harris, M.K. Determining circadian response of adult male Acrobasis nuxvorella (Lepidoptera: Pyralidae) to synthetic sex attractant pheromone through time-segregated trapping with a new clockwork timing trap. Environ. Entomol. 2009, 38, 1690–1696. [Google Scholar] [CrossRef]
- Hartfield, E.A.; Harris, M.K.; Medina, R.F. Population structure of the pecan nut casebearer Acrobasis nuxvorella throughout its geographical distribution. Agric. For. Entomol. 2011, 14, 119–125. [Google Scholar] [CrossRef]
- Bilsing, S.W. The life history and control of the pecan nut casebearer (Acrobasis caryae). Tex. Agric. Exp. Stn. Bull. 1926, 328, 1–77. [Google Scholar]
- Harris, M.K.; Millar, J.G.; Knutson, A.E. Pecan Nut Casebearer (Lepidoptera: Pyralidae) sex pheromone used to monitor phenology and estimate effective range of traps. J. Econ. Entomol. 1997, 90, 983–987. [Google Scholar] [CrossRef]
- Bilsing, S.W. Studies on the biology of the pecan nut casebearer, (Acrobasis caryae). Tex. Agric. Exp. Stn. Bull. 1927, 347, 1–71. [Google Scholar]
- Aguirre, L.A.; Tucuch, M.; Harris, M.K. Oviposition and nut entry behavior of the pecan nut casebearer Acrobasis nuxvorella nuenzig. Southwest. Entomol. 1995, 20, 447–451. [Google Scholar]
- Neunzig, H.H. Taxonomy of Acrobasis larvae in eastern North America (Lepidoptera: Pyralidae). USDA Tech. Bull. 1972, 1457, 1–158. [Google Scholar]
- Ring, D.R.; Harris, M.K. Nut entry by first summer generation pecan nut casebearer. Southwest. Entomol. 1984, 9, 13–21. [Google Scholar]
- Ring, D.R.; Harris, M.K.; Payne, J.A. Sequential sampling plan for integrated pest management of pecan nut casebearer (Lepidoptera: Pyralidae). J. Econ. Entomol. 1989, 82, 906–909. [Google Scholar] [CrossRef]
- McCracken, G.F.; Safi, K.; Kunz, T.H.; Dechmann, D.K.N.; Swartz, S.M.; Wikelski, M. Airplane tracking documents the fastest flight speeds recorded for bats. R. Soc. Open Sci. 2016, 3, 160398. [Google Scholar] [CrossRef] [PubMed]
- McCracken, G.F.; Gillam, E.H.; Westbrook, J.K.; Lee, Y.-F.; Jensen, M.L.; Balsley, B.B. Brazilian free-tailed bats (Tadarida brasiliensis: Molossidae, Chiroptera) at high altitude: Links to migratory insect populations. Integr. Comp. Biol. 2008, 48, 107–118. [Google Scholar] [CrossRef] [PubMed]
- Braun de Torrez, E.C. Bats, Insects and Pecans: Habitat Use and Ecosystem Services of Insectivorous Bats in a Pecan Agroecosystem in Central Texas. Ph.D. Thesis, Boston University, Boston, MA, USA, 2014. [Google Scholar]
- Ammerman, L.K.; Hice, C.L.; Schmidly, D.J. Bats of Texas; Texas A&M University Press: College Station, TX, USA, 2012; p. 305. [Google Scholar]
- Hayward, B.J. The natural history of the cave bat Myotis velifer. West. N. M. Univ. Res. Sci. 1970, 1, 1–74. [Google Scholar]
- Cravens, Z.M.; Brown, V.A.; Divoll, T.J.; Boyles, J.G. Illuminating prey selection in an insectivorous bat community exposed to artificial light at night. J. Appl. Ecol. 2017, 55, 705–713. [Google Scholar] [CrossRef]
- Carter, T.C.; Menzel, M.A.; Chapman, B.R.; Miller, K.V. Partitioning of food resources by syntopic eastern red (Lasiurus borealis), Seminole (L. seminolus) and evening (Nycticeius humeralis) bats. Am. Midl. Nat. 2004, 151, 186–191. [Google Scholar] [CrossRef]
- Clare, E.L.; Fraser, E.E.; Braid, H.E.; Fenton, M.B.; Hebert, P.D.N. Species on the menu of a generalist predator, the eastern red bat (Lasiurus borealis): Using a molecular approach to detect arthropod prey. Mol. Ecol. 2009, 18, 2532–2542. [Google Scholar] [CrossRef]
- Griffith, E.G.; Bryce, A.S.; Omernik, M.J.; Comstock, A.J.; Rogers, C.A.; Harrison, B.; Hatch, L.S.; Bezanson, D. Ecoregions of Texas (color poster with map, descriptive text, and photographs); U.S. Geological Survey: Reston, VA, USA, 2004.
- United States Department of Agriculture [USDA]. 2007 Census of Agriculture National Agricultural Statistics Service; Summary and State Data: Washington, DC, USA, 2009; Volume 1, Part 51.
- United States Department of Agriculture [USDA]. 2012 Census of Agriculture National Agricultural Statistics Service; Summary and State Data: Washington, DC, USA, 2014; Volume 1, Part 51.
- Kunz, T.H. Feeding ecology of a temperate insectivorous bat (Myotis velifer). Ecology 1974, 55, 693–711. [Google Scholar] [CrossRef]
- Ross, A. Ecological aspects of the food habits of insectivorous bats. Proc. West. Found. Vertebr. Zool. 1967, 1, 205–264. [Google Scholar]
- Ross, A. Notes on food habits of bats. J. Mammal. 1961, 42, 66–71. [Google Scholar] [CrossRef]
- King, R.A.; Read, D.S.; Traugott, M.; Symondson, W.O.C. Molecular analysis of predation: A review of best practice for DNA-based approaches. Mol. Ecol. 2008, 17, 947–963. [Google Scholar] [CrossRef] [PubMed]
- Deagle, B.E.; Tollit, D.J. Quantitative analysis of prey DNA in pinniped faeces: Potential to estimate diet composition? Conserv. Genet 2006, 8, 743–747. [Google Scholar] [CrossRef]
- Deagle, B.E.; Thomas, A.C.; Shaffer, A.K.; Trites, A.W.; Jarman, S.N. Quantifying sequence proportions in a DNA-based diet study using Ion Torrent amplicon sequencing: Which counts count? Mol. Ecol. Resour. 2013, 13, 620–633. [Google Scholar] [CrossRef]
- Folmer, O.; Black, M.; Hoeh, W.; Lutz, R.; Vrjenhoeck, R. DNA primers for amplification of mitochondrial cytochrome c oxidase subunit I from diverse metazoan invertebrates. Mol. Mar. Biol. Biotechnol. 1994, 3, 294–299. [Google Scholar]
- R Core Team. R: A Language and Environment for Statistical Computing; R Foundation for Statistical Computing: Vienna, Austria, 2013. [Google Scholar]
- Bates, D.; Maechler, M.; Bolker, B. lme4: Linear mixed-effects models using S4 classes, R package version 0.999999-0. 2012. Available online: http://CRAN.R-project.org/package=lme4 (accessed on 9 November 2019).
- Pinheiro, J.; Bates, D.; DebRoy, S.; Sarkar, D.; R Development Core Team. nlme: Linear and Nonlinear Mixed Effects Models, R package version 3.1-105: 2012. Available online: https://CRAN.R-project.org/package=nlme (accessed on 11 November 2019).
- Babyak, M.A. What you see may not be what you get: A brief, nontechnical introduction to overfitting in regression-type models. Psychosom. Med. 2004, 66, 411–421. [Google Scholar]
- Burnham, K.P.; Anderson, D.R. Model Selection and Multimodel Inference: An Information-Theoretic Approach; Springer Science: New York, NY, USA, 2002. [Google Scholar]
- Hothorn, T.; Bretz, F.; Westfall, P. Simultaneous inference in general parametric models. Biom. J. 2008, 50, 346–363. [Google Scholar] [CrossRef]
- Booth, G.; Niccolucci, M.; Schuster, E. Identifying Proxy Sets in Multiple Linear Regression: An Aid to Better Coefficient Interpretation; Research paper INT-470; United States Department of Agriculture, Forest Service: Ogden, UT, USA, 1994.
- Zuur, A.F.; Leno, E.N.; Walker, N.J.; Savaliev, A.A.; Smith, G.M. Mixed Effects Models and Extensions in Ecology with R; Springer Science+Business Media: New York, NY, USA, 2009. [Google Scholar]
- Boyles, J.G.; Sole, C.L.; Cryan, P.M.; McCracken, G.F. On Estimating the Economic Value of Insectivorous Bats: Prospects and Priorities for Biologists. In Bat Evolution, Ecology, and Conservation; Adams, R.A.P.S.C., Ed.; Springer: New York, NY, USA, 2013; pp. 501–515. [Google Scholar]
- Cleveland, C.J.; Betke, M.; Federico, P.; Frank, J.D.; Hallam, T.G.; Horn, J.; Lopez, J.D.; McCracken, G.F.; Medellin, R.A.; Moreno-Valdez, A.; et al. Economic value of the pest control service provided by Brazilian free-tailed bats in south-central Texas. Front. Ecol. Environ. 2006, 4, 238–243. [Google Scholar] [CrossRef]
- Kalka, M.B.; Smith, A.R.; Kalko, E.K.V. Bats limit arthropods and herbivory in a tropical forest. Science 2008, 320, 71. [Google Scholar] [CrossRef]
- Williams-Guillen, K.; Perfecto, I.; Vandermeer, J. Bats limit insects in a neotropical agroforestry system. Science 2008, 320, 70. [Google Scholar] [CrossRef]
- Perry, R.W.; Thill, R.E.; Carter, S.A. Sex-specific roost selection by adult red bats in a diverse forested landscape. For. Ecol. Manag. 2007, 253, 48–55. [Google Scholar] [CrossRef]
- Limpert, D.L.; Birch, D.L.; Scott, M.S.; Andre, M.; Gillam, E. Tree selection and landscape analysis of eastern red bat day roosts. J. Wildl. Manag. 2007, 71, 478–486. [Google Scholar] [CrossRef]
- Barbour, R.W.; Davis, W.H. Bats of America; University Press of Kentucky: Lexington, KY, USA, 1969. [Google Scholar]
- Menzel, J.M.; Menzel, M.A.; Kilgo, J.C.; Ford, W.M.; Edwards, J.W.; McCracken, G.F. Effect of habitat and foraging height on bat activity in the coastal plain of South Carolina. J. Wildl. Manag. 2005, 69, 235–245. [Google Scholar] [CrossRef]
- Thomas, H.H.; Moosman, P.R.; Veilleux, J.P.; Holt, J. Foods of bats (family Vespertilionidae) at five locations in New Hampshire and Massachusetts. Can. Field-Nat. 2012, 126, 117–124. [Google Scholar] [CrossRef]
- Farney, J.; Fleharty, E.D. Aspect Ratio, Loading, Wing Span, and Membrane Areas of Bats. J. Mammal. 1969, 50, 362–367. [Google Scholar] [CrossRef]
- Fitch, J.H.; Shump, K.A., Jr.; Shump, A.U. Myotis velifer. Mamm. Species 1981, 149, 1–5. [Google Scholar] [CrossRef]
- Lee, Y.F.; McCracken, G.F. Dietary variation of Brazilian free-tailed bats links to migratory populations of pest insects. J. Mammal. 2005, 86, 67–76. [Google Scholar] [CrossRef]
- Clem, P.D. Foraging patterns and the use of temporary roosts in female evening bats, Nycticeius humeralis, in an Indiana maternity colony. Proc. Indiana Acad. Sci. 1993, 102, 201–206. [Google Scholar]
- Wilkinson, G. Communal nursing in the evening bats. Nycticeius humeralis. Behav. Ecol. Sociobiol. 1992, 31, 225–235. [Google Scholar]
- Feldhammer, G.A.; Whitaker, J.O., Jr.; Krejca, J.K.; Taylor, S.J. Food of the evening bat (Nycticeius humeralis) and red bat (Lasiurus borealis) from southern Illinois. Trans. Ill. Acad. Sci. 1995, 88, 139–143. [Google Scholar]
- Millar, J.G.; Knudson, A.E.; McElfresh, J.S.; Gries, R.; Gries, G.; Davis, J.H. Sex attractant pheromone of the pecan nut casebearer (Lepidoptera: Pyralidae). Bioorganic Med. Chem. 1996, 4, 331–339. [Google Scholar] [CrossRef]
- Calcote, V.R.; Smith, J.S.; Hyder, D.E. Pecan nut casebearer (Lepidoptera: Pyralidae): Seasonal activity and mating frequency in central Texas. Environ. Entomol. 1984, 13, 196–201. [Google Scholar] [CrossRef]
- Elkinton, J.S.; Cardé, R.T. Effect of wild and laboratory-reared female Gypsy moths, Lymantria dispar L. (Lepidoptera: Lymantriidae), on the capture of males in pheromone-baited traps. Environ. Entomol. 1984, 13, 1377–1385. [Google Scholar] [CrossRef]
- Knight, A.L.; Croft, B.A. Temporal patterns of competition between a pheromone trap and caged female moths for males of Argyrotaenia citrana (Lepidoptera: Tortricidae) in a semienclosed courtyard. Environ. Entomol. 1987, 16, 1185–1192. [Google Scholar] [CrossRef]
- Kondo, A.; Tanaka, F. Effect of wild virgin females on pheromone trap efficiency in two annual generations of the rice stem borer moth, Chilo suppressalis (Walker) (Lepidoptera: Pyralidae). Appl. Entomol. Zool. 1994, 29, 279–281. [Google Scholar] [CrossRef][Green Version]
- Lacki, M.J.; Hayes, J.P.; Kurta, A. (Eds.) Bats in Forests: Conservation and Management; The Johns Hopkins University Press: Baltimore, MD, USA, 2007. [Google Scholar]
- Braun de Torrez, E.C.; Samoray, S.T.; Silas, K.A.; Wallrichs, M.A.; Gumbert, M.W.; Ober, H.K.; McCleery, R.A. Acoustic lure allows for capture of a high-flying, endangered bat. Wildl. Soc. Bull. 2017, 41, 322–328. [Google Scholar] [CrossRef]
- O’Shea, T.J.; Cryan, P.M.; Hayman, D.T.S.; Plowright, R.K.; Streicker, D.G. Multiple mortality events in bats: A global review. Mammal Rev. 2016, 46, 175–190. [Google Scholar] [CrossRef]
- Clark, D.R., Jr.; Shore, R.F. Chiroptera. In Ecotoxicology of Wild Mammals; Shore, R., Rattner, B., Eds.; John Wiley & Sons: Chichester, West Sussex, UK, 2001; pp. 159–214. [Google Scholar]


| Suite of Models | Response Variables | Model Error | Explanatory Variables | K | Δi | ωi | ER |
|---|---|---|---|---|---|---|---|
| Bat assemblage | Presence/ Absence PNC | Binomial | Bat species+BCI | 6 | 0 | 0.23 | 1.53 |
| Bat species | 5 | 0.83 | 0.15 | ||||
| Bat species+BCI+Sex | 7 | 1.30 | 0.12 | ||||
| Bat species+PNC generation | 6 | 1.66 | 0.11 | ||||
| Bat species+Time of capture | 6 | 1.92 | 0.10 | ||||
| Bat species+Age | 6 | 1.92 | 0.09 | ||||
| Null (intercept only) | 2 | 12.10 | 0.00 | ||||
| Gene Copies/ g feces | Gaussian* | ||||||
| Bat species | 5 | 0.00 | 0.18 | 1.13 | |||
| Time of capture | 4 | 0.28 | 0.16 | ||||
| Bat species+Time of capture | 6 | 0.84 | 0.12 | ||||
| Bat species+PNC generation | 6 | 1.12 | 0.10 | ||||
| Time of capture+PNC generation | 5 | 1.20 | 0.10 | ||||
| PNC generation | 4 | 1.60 | 0.08 | ||||
| Null (intercept only) | 2 | 3.20 | 0.04 | ||||
| PNC moths (pheromone traps) | Presence/ Absence PNC | Binomial | Bat species | 5 | 0 | 0.39 | 1.77 |
| Bat species+Mean PNC | 6 | 1.10 | 0.22 | ||||
| Bat species+Maximum PNC | 6 | 1.32 | 0.20 | ||||
| Bat species+Mean PNC -1 | 6 | 1.45 | 0.19 | ||||
| Null (intercept only) | 2 | 11.16 | 0.00 | ||||
| Gene Copies/ g feces | Gaussian* | Bat species | 5 | 0 | 0.64 | 4.92 | |
| Bat species+Mean PNC | 6 | 3.12 | 0.13 | ||||
| Null (intercept only) | 2 | 5.87 | 0.03 | ||||
| PNC moths (black light traps) | Presence/ Absence PNC | Binomial | Bat species+Proportion PNC to prey-sized insects** | 6 | 0 | 0.12 | 2.00 |
| Bat species | 5 | 1.41 | 0.06 | ||||
| Null (intercept only) | 7.43 | 0.01 | |||||
| Gene Copies/ g feces | Gaussian* | Null (intercept only) | 3 | 0.00 | 0.17 | 1.55 | |
| Proportion PNC to total insects** | 4 | 0.36 | 0.11 | ||||
| Bat species | 4 | 6.00 | 0.01 |
© 2019 by the authors. Licensee MDPI, Basel, Switzerland. This article is an open access article distributed under the terms and conditions of the Creative Commons Attribution (CC BY) license (http://creativecommons.org/licenses/by/4.0/).
Share and Cite
Braun de Torrez, E.C.; Brown, V.A.; McCracken, G.F.; Kunz, T.H. Sympatric Bat Species Prey Opportunistically on a Major Moth Pest of Pecans. Sustainability 2019, 11, 6365. https://doi.org/10.3390/su11226365
Braun de Torrez EC, Brown VA, McCracken GF, Kunz TH. Sympatric Bat Species Prey Opportunistically on a Major Moth Pest of Pecans. Sustainability. 2019; 11(22):6365. https://doi.org/10.3390/su11226365
Chicago/Turabian StyleBraun de Torrez, Elizabeth C., Veronica A. Brown, Gary F. McCracken, and Thomas H. Kunz. 2019. "Sympatric Bat Species Prey Opportunistically on a Major Moth Pest of Pecans" Sustainability 11, no. 22: 6365. https://doi.org/10.3390/su11226365
APA StyleBraun de Torrez, E. C., Brown, V. A., McCracken, G. F., & Kunz, T. H. (2019). Sympatric Bat Species Prey Opportunistically on a Major Moth Pest of Pecans. Sustainability, 11(22), 6365. https://doi.org/10.3390/su11226365