Article

Coopetition in Maritime Tourism: Assessing the Effect of Previous Islands’ Choice and Experience in Tourist Satisfaction

by
Yen E. Lam-González
,
Carmelo J. León
and
Javier de León
*
Tides, Instituto de Turismo y Desarrollo Económico Sostenible, Universidad de Las Palmas de Gran Canaria, Gran Canaria, C.P. 35017 Gran Canaria, Spain
*
Author to whom correspondence should be addressed.
Sustainability 2019, 11(22), 6334; https://doi.org/10.3390/su11226334
Submission received: 25 September 2019 / Revised: 1 November 2019 / Accepted: 6 November 2019 / Published: 12 November 2019

Abstract

:
Maritime tourism has become a competitive opportunity for many island destinations in search of sustainable development. This article aims to analyze the hypothesis that tourist satisfaction with nautical destinations depends on the experience of previous visits to competing destinations. This hypothesis is relevant in order to ascertain the extent of potential coopetition between tourist destinations from the point of view of the consumers. This may ask for the need of cooperation within the competitive environment in which tourist destinations manage sustainability. The evidence is obtained from the case of Cape Verde, an archipelago strongly committed to the development of the nautical sector. Survey data from nautical tourists’ satisfaction visiting Cape Verde is modeled utilizing an ordinal logistic approach. Results show that tourist satisfaction with Cape Verde increases with the authenticity of the cultural experience offered by the destination, the diversity and quality of the nautical offer and the security perceived. Moreover, tourists declaring a satisfactory travel experience in other recently visited islands have higher levels of satisfaction with the nautical destination of Cape Verde. This suggests that proper strategies for nautical tourism development in these islands should not only allow tourists to discover the best cultural and local values of the destination, but also enhance their awareness of the quality of the experience provided by island competitors and, therefore establishing a benchmark for the common benefit of all island destinations becomes of interest. In this regard, coopetition strategies among islands with common interests of specialization may allow them to gain better positioning in the international nautical tourism market, and contribute to tourism development and the sustainability of the industry.

1. Introduction

Maritime tourism involves recreation and leisure at sea and all activities that tourists carry out in the coastal areas of tourist destinations including nautical activities [1,2]. This sector is considered an economic catalyst for coastal destinations, due to its high multiplier effect on employment, ease of integration into the traditional tourist offer, and the boosts it gives to the qualification of the coastlines and to innovation. This is also reinforced by its attraction to market segments with high socio-economic levels and purchasing power [3]. Therefore, it offers an opportunity for several islands to formulate renovation strategies based on diversification [4,5,6].
Tourist destinations in general, and more specifically nautical destinations, operate in a high competitive environment searching for tourists to be attracted by the features of the destination. Among these, those that are related with the sustainable management of the destination are crucial for generating a sound image and satisfaction for potential visitors [7]. The undertaking of cooperation strategies within this competitive environment i.e., coopetition, may raise opportunities to work towards sustainable development by focusing on those attributes that are more capable of raising tourist satisfaction in the longer term, such as those related with the enhancement of social, environmental and economic conditions of the destination [8,9,10].
The measuring and understanding of the key determinants of satisfaction in nautical tourism demand can make an important contribution to the design of successful destination marketing and positioning strategies [11]. This is because tourist satisfaction is directly linked to destination choice, spending, repurchase and the future intentions of tourists [12,13]. It is also important to understand how past tourism experiences affect the behavior of tourists in the next destination and how their subjective opinions can be modified, which is relevant to explaining satisfaction [14,15].
Although there is a considerable amount of academic research measuring and exploring the causes and effects of tourist satisfaction, the results do not allow us to build a theory in the context of maritime tourism, or to extend the conclusions to all typologies of destinations, due to the particularities of each region, and the discretionary nature of human preferences [16]. This article investigates the determinants of tourist satisfaction with nautical destinations, and measures the effect of subjective evaluation of previous experiences in other competing destinations.
In this sense, the research area of this article is concerned with the impact that earlier consumers’ experiences of competing tourist destinations have on the satisfaction of the visiting destination, i.e., to what extent there can be scope for interlinks between nautical tourist destinations from the point of view of the tourist [17,18]. These relationships between competing destinations can be framed within a coopetitive network for the enhancement of tourist satisfaction, thereby leading to higher levels of sustainability. By working together in areas such as promotion and attribute management, destinations may be able to raise tourist satisfaction and increase competitiveness [19,20].
The evidence is obtained from the case of Cape Verde, an archipelago off the Western Coast of Africa, which focuses on the development of nautical tourism and provides an opportunity for them to diversify [6,21,22]. Its strategic position in the mid-Atlantic region and the natural conditions of the archipelago enhance its attractiveness for nautical tourism specialization [5]. Thus, this study provides evidence of factors determining nautical tourists’ satisfaction in Cape Verde in the context of other island destinations that may be visited by nautical tourists. This can be useful in tourism planning, especially the development of islands and coastal destinations seeking to make nautical tourism a key driver for competitiveness, resilience and positioning improvement.

2. Literature Review

This section summarized the review of literature on the study of maritime tourism and tourist satisfaction, with special attention to empirical studies, which have been undertaken in coastal regions and islands—with reference to Cape Verde—as well as to the role of destination attributes and image, and past tourist experiences that may be relevant in explaining the behavioral responses of nautical tourists.

2.1. Maritime Tourism

Maritime tourism is considered a multifunctional tourism activity, as it covers a wide and growing number of nautical activities [23]. Maritime and nautical tourism are accepted as synonyms by various authors [2,24,25]. The multifaceted approach of the nautical activity makes it difficult to agree on a single definition [26,27,28]. The most employed concept defines maritime tourism as the group of tourist activities undertaken in marine and coastal environments, where leisure and recreation at sea are the main travel motivations of the tourists [1,29]. However, a nautical tourist may carry out other tourism activities such as enjoying nature, the beach, the cultural offer of the destination, etc., as well as having other travel motivations.
Thus, a nautical tourist can be defined as a traveller whose main motivation is recreational sailing and/or sports recreation at sea [1]. The main activities of the segment take place on beaches, coasts and in marinas and even in rivers and lakes, and involve some physical effort, without the need of professional training. Following this approach, cruise tourism, whale watching, training activities, regattas or other nautical competitions were not the object of this study.
Diversity when designing the offer of nautical products and services is an essential element that affects the tourist experience and the future motivations of the nautical tourist [30], as well as the safety of facilities, ports and marinas [31,32]. Other studies suggest that combining moorings with specialized tourism and leisure facilities at the destination (gastronomy, commerce, culture, etc.) raises the potential for success of nautical destinations [30,33].
The climate, culture and nature are the most influential elements when choosing a destination for nautical tourism, while the idea of nautical tourists travelling to other enclaves at the destination is related to cultural diversity, exoticism, quality of services and distance [16,34,35,36]. According to [37], for any nautical tourist, life inland is less authentic and exciting than at sea, and for this reason they look for innovative and genuine experiences at destinations. This is a segment of tourists with high technological knowledge that searches specialized websites, groups or specific social networks to support their decision processes regarding the choice of destinations and the duration of the stay [38].
It has been proven that a dominant constraining factor for not choosing a specific nautical destination is the social environment where tourists are involved and the opinion of other nautical tourists [39]. For this reason, it has been argued that nautical tourists are loyal to the best nautical experience and not to a destination, and that the previous experience at other destinations has a direct influence on the decision to embark on another nautical tourist experience [40]. These tourists value good environmental practices, which encourage beach preservation, and they are also sensitive to the weather conditions that enable and enhance the pursuance of maritime sports.
Preferences and assessments of destinations can vary among nautical tourists according to the type of activity performed, nautical skills and accumulated experience [41], which differ from tourists in the “sun, sea and sand” (3S) segment. This is an important aspect to understand past trips, length of trips, willingness to travel in the future and destination choice in the nautical segment [42]. Thus, a hypothesis that was studied in the present paper was to what extent the previous experience with other nautical tourism destinations has on the influence on the satisfaction with the destination being visited by the tourist, i.e., which is an under investigated research area.
H1: The satisfaction of the tourist with the nautical destination rises with a previous positive experience in other competing nautical destinations.

2.2. Tourism, Islands Networking and Coopetition

Islands are characterized by being integrated in a complex system of geophysical interactions, both between themselves and with their mainland areas, which become more complex in the case of tourism [43]. Given the importance of islands in terms of global tourism flows and income, the academic attention on island tourism has increased over the last decades [44]. However, literature has been dominated by ‘land-sea’ and ‘island-mainland’ approaches, paying less attention to island–island relationships [45]. That is, there are very few studies that explore whether they can be complementary [46] prevailing the approach that, as in many aspects of life, one’s neighbor may not be one’s best friend [47].
The development of complementary relationships between islands produces synergies that benefit those who properly manage such cooperative linkages, as shown in empirical studies on islands that belong to the same archipelago [46]. The benefits can be extended to the tourism image if islands cooperate in brand architecture management, as shown in the study of [45]. However, there is no evidence on how the tourist experience provided by one island can affect the behavior and socio-psychological response of tourists at the next island visited, which was investigated in the present paper.
The development of island networking structures is a process that can bring greater competitiveness for island destinations [48,49,50]. Tourism competitiveness involves a high level of achievement in a number of attributes at a destination, including infrastructure, cultural assets, natural environments, governance and promotion. Competitiveness is directly linked to tourist satisfaction, since the attributes of a destination that increase competitiveness also contribute to the satisfaction of the tourist [51,52]. However, competitiveness can be further improved by collaboration and with what has been defined as coopetition, i.e., a mixture of collaboration and competition within an industrial networking framework. Whereas in competition the focus is on the formulation of strategies for value appropriation, in coopetition the focus is on the pursuit of strategies for value creation [53,54].
In the case of tourism, coopetition has proved to be a successful strategy for improving the performance of tourist firms and destination management organizations [7,18,55]. That is, coopetition opportunities among tourist destinations may emerge from the evidence that consumers regard cooperation strategies as providing more enhancing experiences than those based on competition and exclusivity [56]. Therefore, collaboration between tourist destinations in providing a network of nautical services can be put forward as a successful management strategy for raising the satisfaction of nautical tourists [57]. This may apply to the management of those resources that may lead to higher satisfaction levels of nautical tourists, such as the quality of the cultural offer or the safety of the destination. Thus, collaboration between island destinations can be invoked if the satisfaction of nautical tourists is positively influenced by the nautical experience at the previously visited island destinations, i.e., hypothesis H1 of this study was proven.

2.3. Satisfaction, Image and Nautical Tourist Behaviour

For more than three decades, researchers have shown an increasing interest in developing empirical and conceptual studies on tourist satisfaction. These studies have made a significant contribution to the tourism sector, especially in the development of marketing strategies and positioning for destinations [11]. They also have provided useful knowledge to the tourism, travel, transport and hospitality sectors in general, contributing to their sustainability in an increasingly competitive environment [12,13,58,59].
The importance of studying satisfaction with destinations and companies is attributed to its influence in the decision-making process [60,61], spending, loyalty [62] and the future intentions of the tourist [14]. Understanding the reasons underlying tourists’ travelling choices, and the factors influencing their decision-making processes [63] are crucial aspects in predicting a tourist’s future behavior [64]. Thus a direct relationship between the dissatisfaction and the willingness of tourists to choose different destinations in future trips, as well as to make negative recommendations has been proved [65].
In tourism, consumer satisfaction is influenced by the image that tourists have of the destination and its attributes [14], the perceived quality of the products and services that companies offer [65,66], the tourists’ loyalty [13] and the tourists’ travel motivations [59]. From this group of variables, the image of the attributes has the greatest potential for explaining the variance in global satisfaction with the destination [58]. Considering the nature and importance of the attributes and since holiday motivations vary according to the characteristics of destinations and market segments [67], satisfaction studies should be constantly updated [12,13]. Regarding nautical tourism, research on tourist satisfaction is scarce [28]. Literature has not yet been able to explain to what extent the fundamental theoretical determinants of tourism satisfaction can be applied to this segment [68].
Regarding tourism image, there is a widespread agreement in considering the image of a destination as the result of three closely interrelated components: i) perceptual/cognitive, which is related to the evaluation of individuals on the destination attributes; ii) emotional/affective, which refers to emotional response or the feelings that individuals express about the place; and iii) global, which corresponds to the overall positive or negative impression of the place [69].
For a nautical tourist, whose main motivation for travel is leisure and recreation at sea [1], climate is a fundamental attribute to explain tourist satisfaction, since it conditions the performance of the planned activities during the visit [70], and therefore the quality of the tourist experience. However, not only the climate and weather conditions, but also the variety of nautical activities on offer at the destination is an important antecedent of a satisfactory nautical tourism experience. The quality of the nautical infrastructure and the cultural experience provided by the destination (gastronomic offer; cultural activities; entertainment; traditions and customs) has also been found with direct relation to the nautical tourist’s satisfaction [28,66,71].
There are various studies that mention that the combination between the nautical offer, the recreational offer (especially underwater activities and fishing, training in sailing and scuba diving) and the tourist offer (i.e., celebration of events) are successful trends for many nautical destinations [30]. Moreover, safety as well as environmental management are revealed to have a direct influence on the satisfaction of a nautical tourist [31,32]. [28] on the other side suggests that satisfaction, in the case of a marine user, is very sensitive to the perceived quality of the services provided by infrastructures, especially in high-standard marine areas [2].
In this regard, nautical tourism literature is fragmented as previous studies have focused on analyzing the interrelation between satisfaction and a single typology of attributes of image [2,28,39,68] and lacks of a holistic approach in explaining satisfaction conformation of this segment. Despite its significance, very scarce research has been conducted to determine the likely influences of emotional associations of nautical tourists to the places they visit (affective image) on their satisfaction and future behavior [72]. In response, this paper proposed and validated a more universal model for better prediction of the nautical tourist satisfaction.

3. Methodology

The research instrument involved field work focusing on obtaining survey data on tourists’ satisfaction levels and other variables explaining these levels. The level of satisfaction with the visit to the destination was measured based on a question utilizing a qualitative five points Likert scale. These data were collected in order to fit a model focusing on the determinants of the overall satisfaction of nautical tourists with the Cape Verde destination (SAT) when the purpose of their trip was mainly to carry out nautical sports or activities. Thus, the dependent variable SAT was an order response category variable in the proposed model that was estimated utilizing an ordinal logistic regression approach [73]. Table 1 presents the description of the variables in the model.
As formulated earlier based on the literature review, it could be expected that tourism satisfaction with past visited nautical destinations (SAT-PAST) do influence their overall satisfaction with the actual destination. The model also included other variables that were considered fundamental attributes influencing tourist satisfaction (e.g., cognitive (ATRIB), affective image (AFF) and the evaluation of the tour experience (ASS-EXP)), in order to assess if they also impacted the satisfaction of the segment of nautical tourism. The availability and diversity of the nautical offer and the perceived quality of nautical services (NAUT) were also explanatory variables of the model. Other variables such as the travel group composition (PARTY) and information channels (CHANNEL) for which there was not much evidence of their impact on tourist satisfaction in the nautical segment were also included.

3.1. Study Site

Cape Verde is a country located in the Atlantic Ocean, which is formed by ten islands (nine inhabited and one uninhabited). All together, they contain a total surface area of 4033 km² and a total population of around 500,000 persons [74]. As the majority of Small Island Developing States (SIDS), the tourism activity constitutes the main component of the economic structure of Cape Verde, representing 49% of all exports of goods and services [5]. The natural potentialities, the social stability and the practical absence of extreme weather, place it as a safe and attractive destination [75]. These conditions have contributed to sustained growth and a very low seasonality of tourism in the last decade. In addition, due to the significant progress of its socio-economic model, Cape Verde stands out from the rest of sub-Saharan countries as a success story and as an example of democracy, political stability, social inclusion, security and progress [21,76,77,78].
The Cape Verdean tourist economy has been focused on the sun and beach product, which presents both positive and negative aspects, conditioned by its insularity and the increase of global tourism competition [5,75]. The National Statistics Institute (INE) of Cape Verde reported a number of 348,600 international tourists in 2017, which represents an increase of 7.9% with respect to 2016. In the last two decades, the country has registered a strong tourism growth, corresponding to an average annual growth rate over 11%; however, it is just in recent times that the economy has observed less growth in the tourist sector [79].
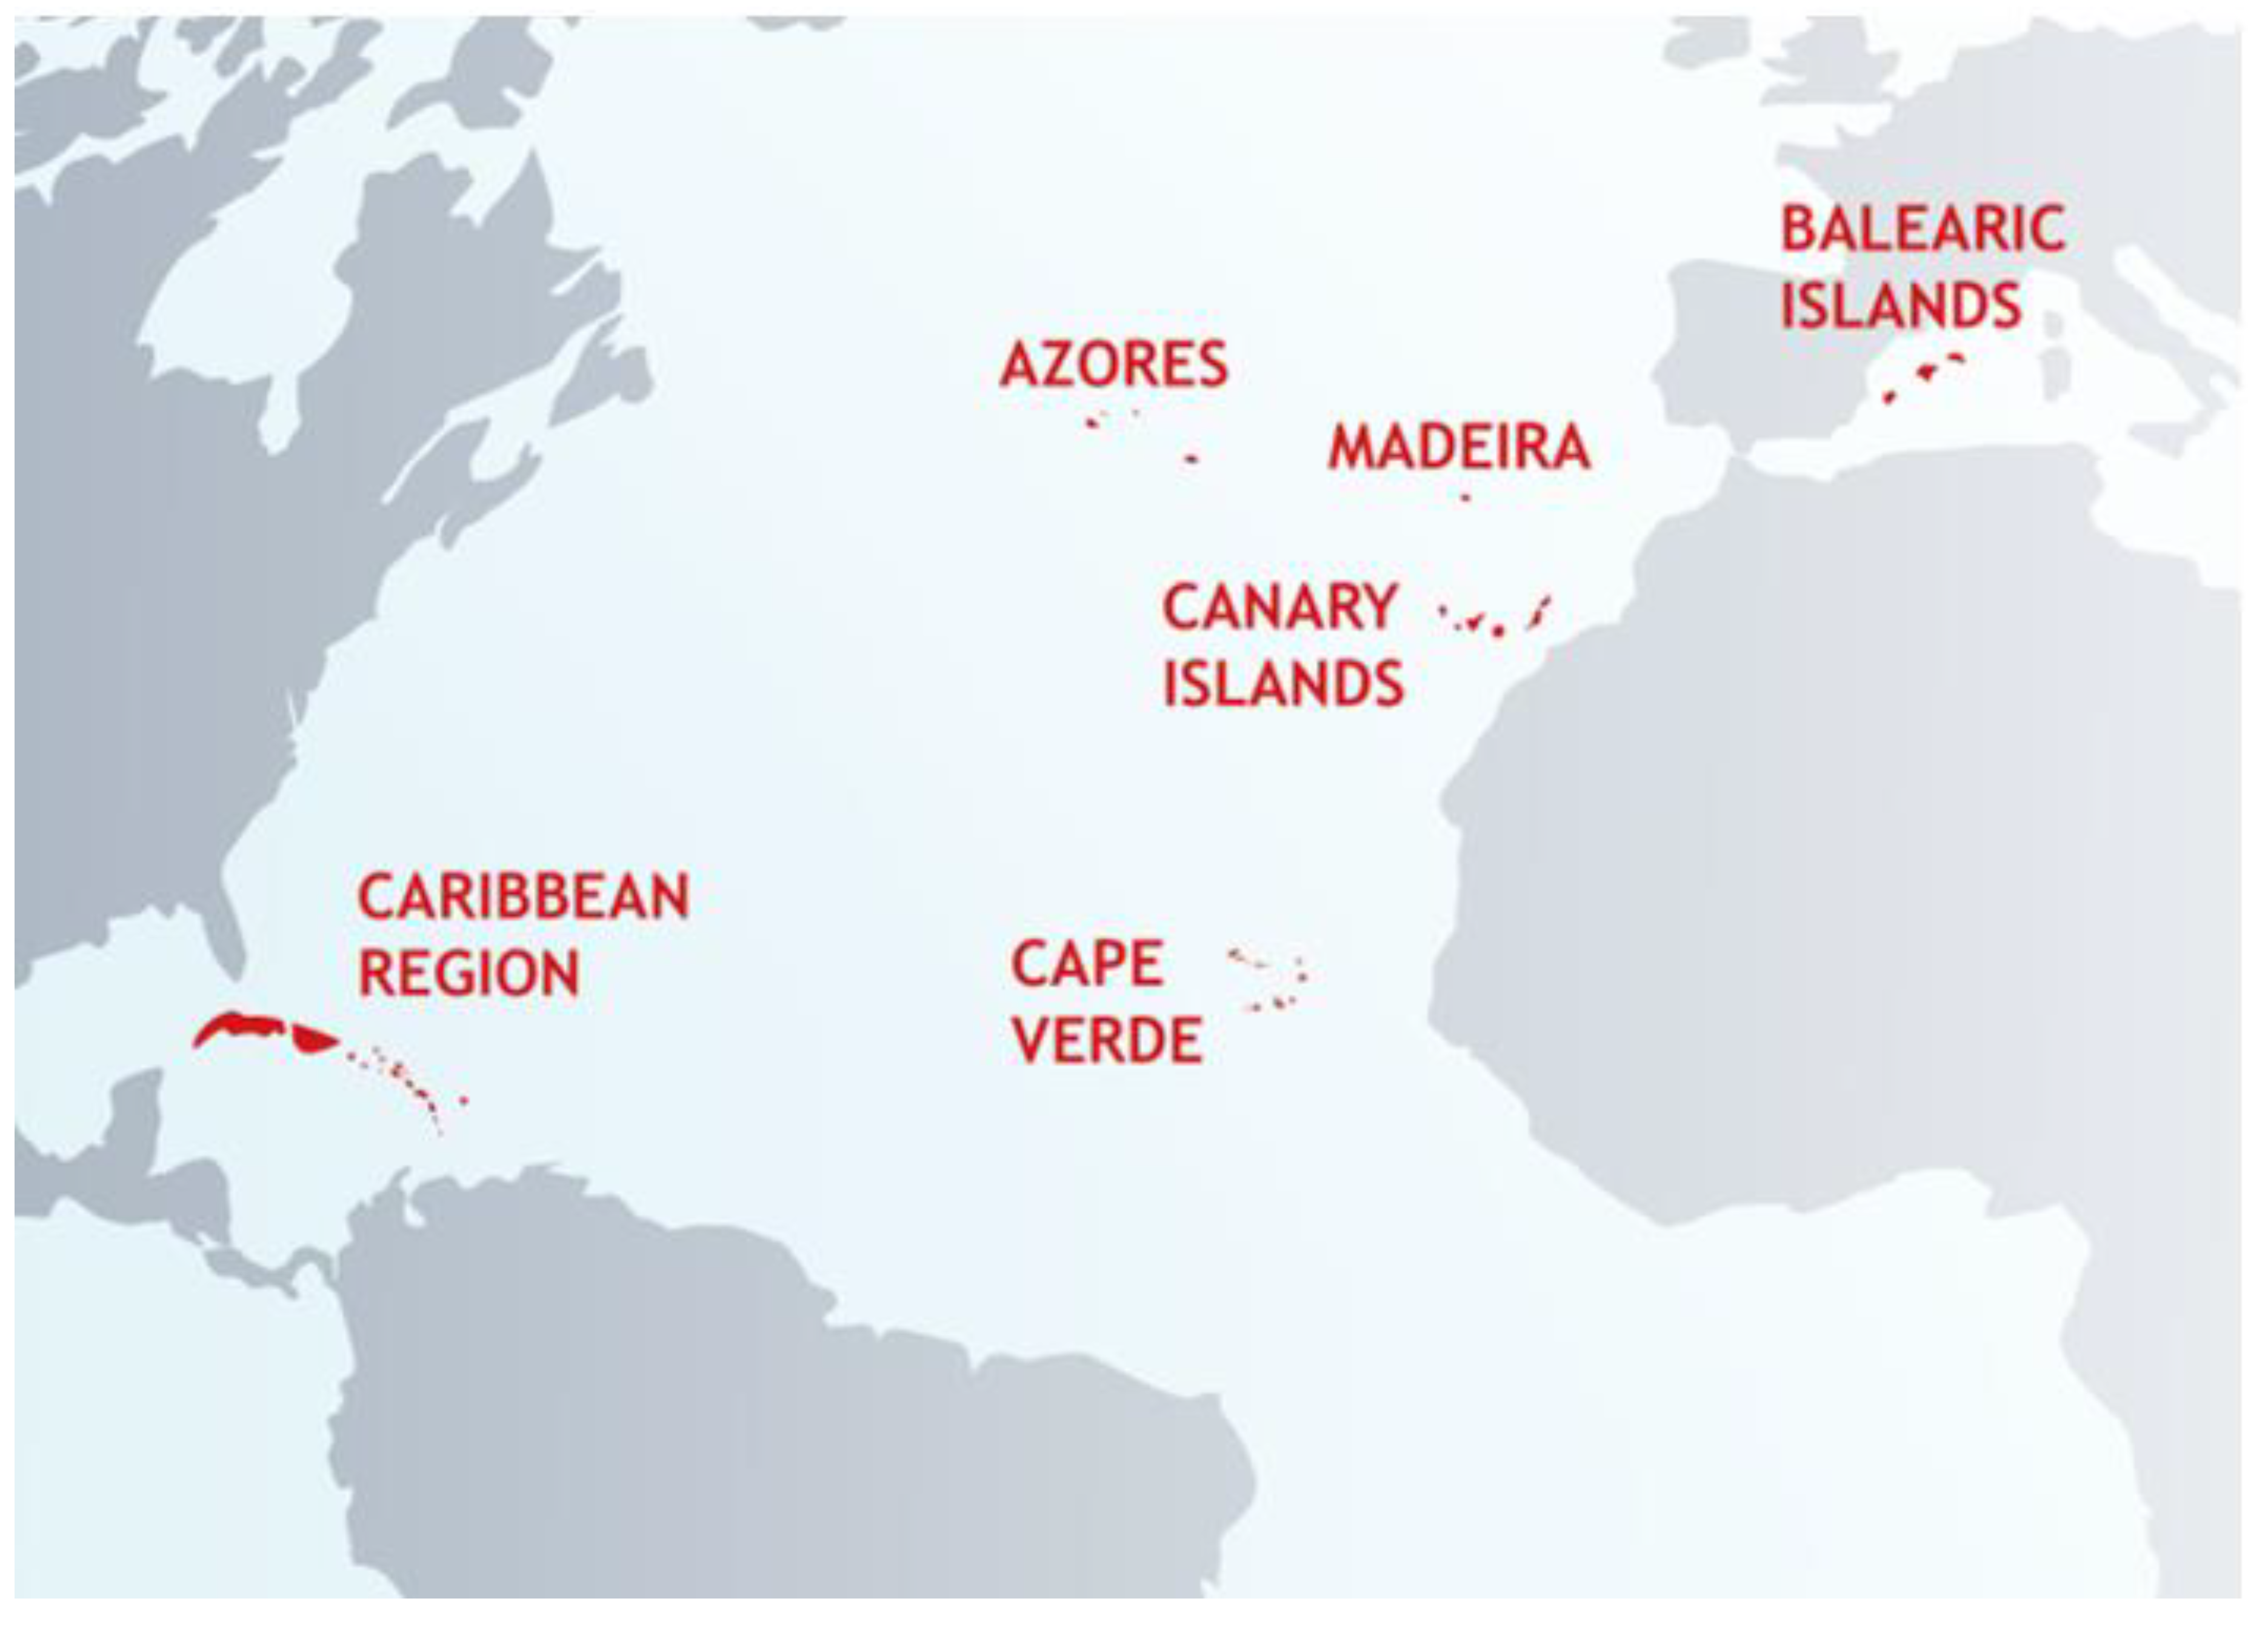
For this reason, there has been debate about the need of renewal of the main tourism product based on a further diversification towards nautical tourism. This has also become a priority within their tourism policy as it is seen as an agent to increasing the islands’ resilience in maintaining their position in the increasing competitive tourism industry ([4,6] as well as helping them adapt to global socioeconomic challenges [80]. This opportunity is enhanced because of the relevance of factors such as the weather, sun and sea in the tourists’ preferences [21]. In addition, its strategic location in the Atlantic, its excellent conditions for nautical activities [81] and its enclave at a hub between the European and American continents, constitute remarkable advantages for the archipelago, especially for the development of intercontinental navigation (see Figure 1).

3.2. Fieldwork

The target population was defined as tourists visiting Cape Verde Islands motivated by doing nautical recreational activities (excluding professional purposes, sport events and cruise passengers). A questionnaire was applied to this target population and translated to four languages after the realization of a focus group and pre-test. That is, questions were assessed for their efficacy and appropriateness for the objectives of the research by intensive work with focus groups discussions and pre-testing. The focus group was carried out with ten nautical tourists of nationalities from the five main outbound markets of Cape Verde. It aimed to ensure that the questions were going to be clearly understood by the respondents, and allowed us to make the necessary corrections to the items that raised comprehension difficulties. In this phase, in-depth interviews were utilized to fill-in the questionnaire. The second pre-test was conducted with fifty tourists and allowed researchers to validate the questionnaire based on ascertaining a full understanding of the potential respondents.
The final implementation of the questionnaire was carried out by professional interviewers belonging to a specialized survey company, who received training sessions prior to the fieldwork in order to ascertain that communication with respondents was clear and accurate. The questionnaire was structured in four sections: (a) socio-economic and demographic variables; (b) travel planning variables, past-visited destinations and evaluation; (c) evaluation of the destination’s attributes, the nautical offer and experience and (d) affective image and overall satisfaction with the destination.
A random sample of 525 nautical tourists was obtained. The percentage of tourists approached that did not agree to participate was 12%. The sample was taken randomly from the general population of tourists after screening for the participation in nautical activities. This may have caused some element of convenience in the sampling process although efforts were taken for guaranteeing the randomness of the recruitments of potential respondents. With this in mind, interviewers followed a random number generator for approaching the contacted tourists at the surveying areas. The fieldwork was carried out in yachting and sailing clubs, sports centers, beaches and the main sales and rental points of nautical equipment on the islands of Sal and Mindelo (San Vicente island), which are the geographical centers of nautical tourism in the country.
Participants in the survey were screened by the purpose of the visit in order to identify those travelling only for nautical tourism. In addition, a second filter was implemented aimed at subjects who had already enjoyed and experienced the destination, i.e., had already stayed for at least eighty percent of their stay. Finally, tourists were briefly informed on the structure of the survey and the purpose of the study. The field work was carried out between early September 2016 and late December 2017.

3.3. Data Analysis

The previous visits to other islands of the Mediterranean–Atlantic Arc and Caribbean Region in the last three years for nautical purposes allowed us to determine if tourists had had previous similar nautical experiences before the visit to Cape Verde. Through multi choice questions, tourists were asked if they had visited five specific destinations (Canary Islands, Balearic Islands, Madeira and the Caribbean). Data extracted allowed the utilization of the dummy variable—DEST—of the model (as shown in Table 1).
On the other hand, the destination’s perceived image was measured by requiring respondents to evaluate several attributes of the destination. All of them were posed as positive statements where travellers indicated their agreement utilizing a five point Likert scale [14,28,82,83]. In order to measure the affective image, a five-point bipolar scale and three-items were used: exciting/gloomy destination, genuine/synthetic destination and sustainable/unsustainable destination [82,84]. The attributes were chosen in order to achieve greater consistency with the nature-based element of this type of tourism.
After coding the information, the database was processed with the SPSS program (version 24.0). A t-test was employed to assess the differences between early November and late December respondents. Former ones represented more than 70% of the total sample. The results showed non-significant differences at the 0.05 level [85]. Normality tests were also computed for all the variables of the model showing that none fail the null hypothesis. Frequency analysis was utilized to characterize the general profile of the respondents, and the characteristics of the trip to Cape Verde. Two exploratory factor analyses (EFA) were undertaken in order to reduce the number of variables in the model. Before running the logistic model, we also examined correlation and multicollinearity between predictors.

4. Results

This section is structured in three subsections. The first one corresponds to the characterization of the general profile of the respondents and their trip to Cape Verde, the second shows the results of the factor analysis and the definition of the constructs in the model and the third presents the final results of the regression model.

4.1. Characteristics of the Sample

Table 2 shows the sociodemographic profile of the respondents and the characteristics of the trip to Cape Verde. The sample consisted mainly of male individuals with university studies, married or with a partner, which represented more than 60% of the total. The most frequent age was about 30 years old, and the main nationalities were Portuguese, French and British, with a significantly greater proportion of the former compared to the rest.
These results were consistent with research conducted by [5,74,86], which reported that tourists visiting Cape Verde were mostly European men, with a high educational level on average. According to our survey, the average age of tourists was lower than that found by [5] i.e., above 40, but some specific forms of tourism could slightly differ from the average international tourist in the destination, especially if we conducted segmented studies, as shown in [87] who referred to all-inclusive tourists in Cape Verde. Regarding the travel planning, it can be observed that agencies and Internet were the most popular channels used to choose the destination.

4.2. Results of Factor Analyses

Two exploratory factor analyses (EFA) were applied with the aim of reducing the number of variables in the model, on the one hand to the scales utilized for the evaluations of the destination attributes to derive the ATRIB_j (j=1, …, 4) constructs defined in Table 1; and on the other hand, to the items evaluating the tour experience, the nautical offer, and the perceived affective image, which led to the ASS-EXP, NAUT and AFF constructs respectively. The results of both EFA are shown in Table 3 and Table 4.
The reliability of the scales was analyzed by means of the Cronbach’s alpha coefficient, the Bartlett’s test of sphericity (with values of 888.01 p < 0.001, and 455.70 p < 0.000 respectively) and the Kaiser–Meyer–Olkin statistics (with values 0.806 and 0.845 respectively). These results clearly indicate that data was suitable for factor analysis. Principal component and Varimax rotation procedures with Kaiser normalization were employed. Variables with loadings equal to or greater than 0.53 were included in a given factor to decrease the probability of misclassification.
Thus, a total of 15 destination attributes resulted in four factor groups or constructs (ATRIB_) with total explained variance of 67.3%. Constructs were defined as follows:
  • ATRIB_1 = Great cultural value, sporting offer and nightlife;
  • ATRIB_2 = Natural scenery, hospitality and tourism facilities;
  • ATRIB_3 = Safety and accessible destination;
  • ATRIB_4 = Fashionable destination with good ICT systems.
In addition, a total of eight items resulted in three factor groups (AFF, ASS-EXP and NAUT as shown in Table 4), which explained 72.5% of variance. The fits of both analyses were adequate according to Chi2 parameter (X2). Most of the factor loadings were greater than 0.70, indicating a good correlation of the items inside the constructs [88]. A Cronbach’s alpha test was used to determine the internal consistency of the scales. These coefficients ranged from 0.70 to 0.92 indicating an adequate consistency [89]. In addition, a confirmatory factor analysis model proved the validity and reliability of the constructs derived from EFA.

4.3. Logistic Model Results

Before running the model, a correlation analysis of predictor variables was carried out (see Appendix A). It can be seen that all the predictors were positively connected with the overall satisfaction (SAT) at the level of 0.01 or 0.05 of significance. Moreover, as suggested [71], the absence of highly correlated predictor variables (above 0.80) ensured the pertinence of the logistic regression model employed. However, examining the correlation matrix may be helpful but not sufficient to detect collinearity [71]. In line with this, a multicollinearity diagnosis was carried, confirming the absence of multicollinearity (see Appendix B).
Table 5 presents the results of the ordinal logistic regression model for the variable of nautical tourism satisfaction (SAT). This model was appropriate for the ordinal nature of the data obtained from the responses to the Likert scale employed to assess tourists’ satisfaction. The model accounted for more than 41% of explained variance according to the McFadden’s adjusted pseudo R2, which implies a high reliability of the measure of the factors explaining the variance of the SAT variable.
The satisfaction of the nautical tourist in Cape Verde was higher when travelling alone as oppose to within a group (PARTY), as it was when the channel providing information before the trip was either a travel agency or tour operator, i.e., tourism intermediary firms (CHANNEL). In addition, there were a number of factors related to the image of the destination, both cognitive and affective, and to the quality and experience provided by the nautical supply, which led to higher levels of satisfaction of nautical tourists in Cape Verde.
It can be seen that ATRIB1 and ATRIB3 had direct and positive relationships with SAT, which means that the cultural and sports offer, and the safety and accessibility, were factors that influence the satisfaction of nautical tourists in Cape Verde. The level of satisfaction was also enhanced by the quality of the nautical supply (NAUT), and by the nautical experience provided by the destination (ASS-EXP). The affective image (AFF) was also significant and positive i.e., the affective feelings created by the destination favor nautical tourist satisfaction with the destination.
The nautical tourists’ satisfaction also increased with the satisfaction obtained with the nautical experience at other competing destinations, as shown by the significance level and positive sign of the variable SAT-PAST. The role of previous experiences had not been thoroughly evidenced in previous studies of tourism satisfaction, and led to the consideration of a potential interaction between destinations in the context of nautical tourism when it came to the objective of raising tourist satisfaction.
The importance of previous experiences for the evaluation of the current nautical experience indicates that nautical tourism satisfaction with a destination might be influenced by the management of nautical experiences in other competing destinations. This might be the case because nautical tourism could be conceived a niche segment of specialized tourists that search for specific experiences at sea, and therefore were looking for geographical enclaves characterized by the opportunity to fully enjoy nautical activities. Geographical regions like islands provide nautical tourists with specific features that can be recognized at other nautical destinations of a similar region, leading to the enhancement of satisfaction and therefore potentially improving competitiveness and resilience.
Regarding the destination dummy variables included in the model (DEST_), it can be seen that only two competing destinations were significant and with a positive sign. These were the Canary Islands and Madeira. This means that the level of satisfaction of nautical tourists with Cape Verde was higher for those tourists that had visited those two destinations than for those tourists who had visited the Balearics earlier for nautical purposes. Thus, not all previously visited destinations had the same impacts on the level of satisfaction of the nautical tourists in Cape Verde. The results show that those closer to Cape Verde led to the higher impacts on the satisfaction of nautical tourists in Cape Verde.

5. Discussion and Concluding Remarks

Island tourist destinations are specially endowed for maritime specialization because of the advantages provided by being surrounded by water and their access to an abundance of coastal and beach resources. In addition, tourism islands cannot be isolated from the rest of destinations, since tourists have increasing experience in travelling across alternative tourist products around the world [53]. Thus, the specialization in nautical tourism in the context of regional areas of island destinations offers an opportunity for evaluating the cooperation and resilience of destinations subject as a mean to increasing threats to the traditionally predominant sun and sea product from the global competition of the tourism market.
At the same time, sustainable development of nautical tourism involves the management of those attributes that lead to tourist satisfaction in the long term, thereby enhancing the sound management of social, environmental and economic conditions [32]. Since tourist satisfaction depends critically on those attributes that define the image of destinations, the enhancement of these factors not only improves satisfaction but also leads to a higher sustainability of tourist destinations [90,91].
Therefore, in order to study the potential for coopetition among nautical tourist destinations coming from the potential enhancement of visitors’ satisfaction, this article has empirically investigated the case of Cape Verde islands, which is a destination focusing on this tourism segment as a strategy for competitiveness and diversification towards sustainability. The results of the analysis have shown that the nautical tourists’ satisfaction can be explained by the positive evaluation of certain attributes, the affective feelings towards the destination and the satisfaction with past experience at other island destinations.
The satisfaction model developed in this paper i) provides a better and wider understanding of the behavior of islands’ nautical tourists, ii) identifies destination attributes and affective feelings that are crucial in predicting tourism satisfaction when the purpose of the trip is nautical recreation and iii) shows the important role that tourists’ past experiences in competing island destinations have in relation to the satisfaction with the next island destination, highlighting the challenges that this represents for a competitive nautical tourism island destination from the perspective of coopetition.
From a theoretical point of view this research validated a universal model that explains the causes of tourist satisfaction in the context of maritime tourism, including factors at different dimensions, in line with previous research on nautical destination attributes [31,71], on the one hand, and incorporating other under-investigated variables of socio-psychological nature, on the other hand. In this sense, the inclusion of the subjective opinions of tourists regarding actual and past visited island destinations (AFF and SAT-PAST variables) joint to other variables related to travel planning (PARTY, CHANNEL), allowed us to obtain a higher reliability of the measure to explain the variance in the satisfaction model, if compared with previous research [28,66].
Along these lines, this paper provided empirical evidence on the impact of past travel experiences in islands in the evaluation that nautical tourists provide to the next visited island. This relationship had not been verified for the nautical segment, as this is the case of the studies of [15,69]. This finding also provided sound knowledge on island–island relationships within the tourism literature, which has been dominated by ‘land–sea’ and ‘island–mainland’ approaches [46].
From a managerial and policy perspectives, this finding is of great usefulness for tourism managers, which can take advantage of this knowledge to better predict which tourists have more predisposition to provide positive evaluations to their destinations. Thus, island destinations seeking for positioning improvement need to re-adapt their marketing plans with a new segmentation approach based on past destination choice and experiences. At the same time, it opens a new perspective for the development of island-based nautical destinations networking structures and coopetition.
In this sense, the present study brought out the fact that islands coopetition strategies can be extended beyond the brand management [45], being this collaboration also relevant for the management of other resources that lead to higher satisfaction [57] of the nautical tourism segment. For example, the creation of a network of nautical products and services (i.e., transnational or multi-destination tour packages) and multicultural nautical experiences (i.e., cultural excursions across destinations in the Atlantic and other thematic adventure challenges), can be seen as successful initiatives for raising the satisfaction of nautical tourists. Thus, coopetition can be justified in the context of nautical tourism to promote satisfaction, value co-creation, and consequently greater competitiveness for the destinations and regions involved.
In addition, those attributes that conform to a sustainable image of the tourist destination such as the conservation of the environment, safety and accessibility together with the availability of high quality nautical offer do provide higher tourist satisfaction. In this sense, a network of islands cooperating for the development of clean and green technologies and solutions (i.e., eco-berths) is necessary in order to ensure higher satisfaction levels of the demand in nautical island destinations. This is noteworthy conclusion considering that the nautical sector is believed to generate important environmental risks for destinations (i.e., marinas exert pressure on coastlines, and intervene in the fragmentation of marine habitats).
Summarizing, islands seeking to develop nautical tourism as a form of sustainable tourism should be more attentive to their relationships with island competitors, paying attention to those attributes that impact the tourist experience and lead to higher tourist satisfaction. This implies to work in two main directions: (i) to guarantee a qualified and varied offer of nautical activities, in combination with the authenticity, customs and traditions of the population of each tourist area, and (ii) generate specialized services, capable of guiding the tourist at the appropriate time to those areas, including other competing destinations, where nautical activities can be carried out in the best environmental and safety conditions, leading to the lowest impact in the local situation. Thus, there is scope for destinations to cooperate in order to take advantages of the opportunities coming from sharing information, resources and experiences within the same. These cooperation opportunities can be framed within an environment of coopetition between competing islands destinations, in which management organizations get involved in a networking approach to their promotion and market positioning, as well as to the organization of resources towards sustainability.

6. Limitations of this Study

Even though this study pointed out the relevance of coopetition for enhancing sustainability of island tourist destinations focusing of nautical tourism, it faced various limitations that challenge the generalization of the conclusions for all tourist and island destinations. Firstly, since it was based on one specific case study, results could not be applied to all nautical tourist destinations. Further evidence on other regional nautical island destinations should complement the results put forward in this paper. Secondly, more evidence on internationalization and specialization strategies based on nautical tourism is needed in order to conclude that this strategy is a successful starting point for destinations in the context of increasing global competition in the tourism market. Thirdly, the opportunities for sustainable development following from coopetition between island tourist destinations based on the consumers’ perception should be further conceptualized both from theoretical and empirical perspectives.

Author Contributions

Each author contributed to this study. Y.E.L.-G. and C.J.L. were responsible for the introduction and conclusions. Each author provided critical analysis, interpretation of results and methodology. Y.E.L.-G. and J.d.L. were responsible for data collection and final revision of the manuscript.

Funding

This research was funded by European Regional Development Fund, Interreg: Proyecto NAUTICOM, mac/2.3D/158

Conflicts of Interest

The authors declare no conflict of interest

Appendix A

Table A1. Correlation analysis of the variables in the model.
PARTY CHANNEL ATRIB1 ATRIB 2 ATRIB 3 ATRIB 4 ASS-EXPAFF NAUTDESTSAT-PASTSAT
PARTY1.000
CHANNE 0.273 *1.000
ATRIB10.1080.1581.000
ATRIB 20.0920.0520.0121.000
ATRIB 30.270 *0.0790.020*0.1941.000
ATRIB 40.204 *0.1000.0380.250 *0.301 *1.000
ASS -EXP0.339 **0.367 **0.178 *0.369*0.074−0.0661.000
AFF0.327 **0.1000.0910.1470.230 *0.1120.489 **1.000
NAUT0.388 **0.1360.168 *−0.1700.140−0.1040.312 **0.490 **1.000
DEST0.210 *0.410 **0.481 **0.500 **0.0580.311 *0.257 *0.712 **0.347 **1.000
SAT-PAST0.333 *0.240*0.250 *0.420 **0.0730.0520.369 **0.654 **0.571 **0.220 *1.000
SAT−0.768 **0.813 **0.732 **0.689 **0.682 **0.810 **0.711 **0.831 **0.742 *0.820 **0.852 **1.000
*< 0.05 ** < 0.01.

Appendix B

Table A2. Multicollinearity diagnostics.
VIFTolerance
ATRIB1 (Great cultural value, sporting offer and nightlife)
Availability of interesting historical and cultural heritage1.020.97
Interesting traditions and customs 1.080.95
Attractive hinterland1.010.98
Diversity of sport activities 1.090.94
Availability of nightlife and entertainment1.110.90
ATRIB 2 (Natural scenery, hospitality and good tourism facilities)
Nice weather1.130.87
Beautiful beaches1.080.95
Hospitality and kindness of the local population1.120.89
Good accommodation facilities1.160.79
ATRIB 3 (Safety and accessible destination)
Political and social stability1.400.71
Adapted to people with disabilities1.320.79
High safety destination1.010.99
Adapted to families and children1.000.99
ATRIB 4 (Fashionable destination with good ICT systems)
Good ICT infrastructure (telephone, internet,…)1.030.98
Fashionable destination1.190.92
ASS-EXP (Satisfaction with the tour experience)
I am satisfied with my decision 1.070.95
I am satisfied with the experience during my visit1.090.94
The visit has met my expectations1.110.90
AFF (Affective image)
Unsustainable - Sustainable destination1.700.60
Synthetic - Genuine destination1.530.68
Gloomy- Exciting destination1.400.71
NAUT (Nautical offer’s evaluation)
Satisfaction with destination’s nautical activities1.020.98
Perceived image of destination’s nautical activities1.170.91
PARTY1.250.84
CHANNEL1.560.66
DEST1.470.70
SAT-PAST1.000.99
Note. VIF = variance inflation factor.

References

  1. Luković, T. (Ed.) Nautical Tourism; CABI: Wallingford, UK, 2013. [Google Scholar]
  2. Sari, F.O.; Bulut, C.; Pirnar, I. Adaptation of hospitality service quality scales for marina services. Int. J. Hosp. Manag. 2016, 54, 95–103. [Google Scholar] [CrossRef]
  3. Hall, C.M. Trends in ocean and coastal tourism: The end of the last frontier? Ocean Coast. Manag. 2001, 44, 601–618. [Google Scholar] [CrossRef]
  4. Craigwell, R. Tourism Competitiveness in Small Island Developing States; research paper No 2007/19; World Institute for Development Economics Research: Helsinki, Finland, 2007. [Google Scholar]
  5. López-Guzmán, T.; Borges, O.; Hernández-Merino, M.; Cerezo, J.M. Tourism in Cape Verde: An analysis from the perspective of demand. Tour. Econ. 2013, 19, 675–688. [Google Scholar] [CrossRef]
  6. Neves, J.D.R.O. O papel dos eventos no reforço da atratividade turística de Cabo Verde: O caso da cidade da Praia; Doctoral dissertation, Escola Superior de Hotelaria e Turismo do Estoril: Estoril, Portugal, 2012. [Google Scholar]
  7. Della Corte, V.; Aria, M. Coopetition and sustainable competitive advantage. The case of tourist destinations. Tour. Manag. 2016, 54, 524–540. [Google Scholar] [CrossRef]
  8. Volschenk, J.; Ungerer, M.; Smit, E. Creation and appropriation of socio-environmental value in coopetition. Ind. Mark. Manag. 2016, 57, 109–118. [Google Scholar] [CrossRef]
  9. Schnitzer, M.; Seidl, M.; Schlemmer, P.; Peters, M. Analyzing the Coopetition between Tourism and Leisure Suppliers—A Case Study of the Leisure Card Tirol. Sustainability 2018, 10, 1447. [Google Scholar] [CrossRef]
  10. Fong, V.H.I.; Wong, I.A.; Hong, J.F.L. Developing institutional logics in the tourism industry through coopetition. Tour. Manag. 2018, 66, 244–262. [Google Scholar] [CrossRef]
  11. Juan, E.M.T.; Zamora, M.Á.; Mendoza, V.E.M.; Barvié, B.C.; Cardona, J.R. Marketing in nautical tourism: The Recreational Charter in Ibiza. Int. J. Sci. Manag. Tour. 2018, 4, 521–537. [Google Scholar]
  12. Kozak, M.; Rimmington, M. Tourist satisfaction with Mallorca, Spain, as an off-season holiday destination. J. Travel Res. 2000, 38, 260–269. [Google Scholar] [CrossRef]
  13. Yoon, Y.; Uysal, M. An Examination of the Effects of Motivation and Satisfaction on Destination Loyalty: A Structural Model. Tour. Manag. 2005, 26, 45–56. [Google Scholar] [CrossRef]
  14. Bigné, E.; Sanchez, M.I.; Sanchez, J. Tourism Image, Evaluation Variables and after Purchase Behaviour: Interrelationship. Tour. Manag. 2001, 22, 607–616. [Google Scholar] [CrossRef]
  15. Palacio, A.B.; Santana, J.D.M.; Nazzareno, P.A. Factors that explain the change in the image of a tourist destination before and after a visit. Cuadernos de Turismo 2017, 40, 649–652. [Google Scholar]
  16. Li, H.; Song, H.; Li, L. A Dynamic Panel Data Analysis of Climate and Tourism Demand: Additional Evidence. J. Travel Res. 2016, 56, 158–171. [Google Scholar] [CrossRef]
  17. Tyrrell, T.J.; Johnston, R.J. Tourism sustainability, resiliency and dynamics: Towards a more comprehensive perspective. Tour. Hosp. Res. 2008, 1, 14–24. [Google Scholar] [CrossRef]
  18. Wang, Y.; Krakover, S. Destination marketing: Competition, cooperation or coopetition? Int. J. Contemp. Hosp. Manag. 2008, 20, 126–141. [Google Scholar] [CrossRef]
  19. Pan, B.; Xiang, Z.; Law, R.; Fesenmaier, D.R. The dynamics of search engine marketing for tourist destinations. J. Travel Res. 2011, 4, 365–377. [Google Scholar]
  20. Rusko, R. The Redefined Role of Consumer as a Prosumer: Value Co-Creation, Coopetition, and Crowdsourcing of Information Goods. In Production and Manufacturing System Management: Coordination Approaches and Multi-Site Planning; IGI Global: Hershey, PA, USA, 2013; pp. 162–174. [Google Scholar]
  21. McElroy, J.L.; Hamma, P.E. SITEs revisited: Socioeconomic and demographic countours of small island tourist economies. Asia Pac. Viewp. 2010, 51, 36–46. [Google Scholar] [CrossRef]
  22. Williams, S.; Lew, A.A. Tourism Geography: Critical Understandings of Place, Space and Experience; Routledge: Abingdon, UK, 2014. [Google Scholar]
  23. Orams, M.B. Tourists getting close to whales, is it what whale-watching is all about? Tour. Manag. 2000, 21, 561–569. [Google Scholar] [CrossRef]
  24. Amaral, H.; Antunes, J.; Almeida, C. The importance of nautical tourism in the island of Faial-Azores. Int. J. Multidiscip. Bus. Sci. 2018, 4, 127–133. [Google Scholar]
  25. Moreno, M.J.; Otamendi, F.J. Fostering Nautical Tourism in the Balearic Islands. Sustainability 2017, 9, 2215. [Google Scholar] [CrossRef]
  26. Barbieri, C.; Sotomayor, S. Surf travel behaviour and destination preferences: An application of the Serious Leisure Inventory and Measure. Tour. Manag. 2013, 35, 111–121. [Google Scholar] [CrossRef]
  27. Chan, S.; Aprilia, C.; Zainul, Z.R. Indonesian Marine Tourism: Developing a Favorable Tourism Destination to Attract International Sailors. Proc. AICS-Soc. Sci. 2018, 8, 7–13. [Google Scholar]
  28. Mikulić, J.; Krešić, D.; Kožić, I. Critical Factors of the Maritime Yachting Tourism Experience: An Impact-Asymmetry Analysis of Principal Components. J. Travel Tour. Mark. 2015, 32, S30–S41. [Google Scholar] [CrossRef]
  29. EC. A European Strategy for more Growth and Jobs in Coastal and Maritime Tourism; EC-European Commission: Brussels, Belgium, 2014. [Google Scholar]
  30. Pereira, E.; Mascarenhas, M.; Flores, A.; Pires, G. Nautical sports events portfolio as a driver to innovative dynamics. J. Marit. Res. 2014, 11, 17–23. [Google Scholar]
  31. Horak, S. Demand for Nautical tourism in Europe-Case Study Croatia; CABI: Wallingford, UK, 2013; pp. 159–185. [Google Scholar]
  32. Jugović, A.; Kovačić, M.; Hadžić, A. Sustainable development model for nautical tourism ports. Tour. Hosp. Manag. 2011, 17, 175–186. [Google Scholar]
  33. De Sousa, J.F.; Fernandes, A.; Carpinteiro, A. Developing nautical recreational activities as a territorial strategy: A perspective on the tagus estuary. J. Coast. Res. 2009, 56, 1154–1158. [Google Scholar]
  34. Rosselló, J.; Waqas, A. The Influence of Weather on Interest in a “Sun, Sea, and Sand” Tourist Destination: The Case of Majorca. Weather Clim. Soc. 2016, 8, 193–203. [Google Scholar] [CrossRef]
  35. Rutty, M.; Scott, D. Will the Mediterranean become “too hot” for tourism? A reassessment. Tour. Hosp. Plann. Dev. 2010, 7, 267–281. [Google Scholar] [CrossRef]
  36. Parmawati, R.; Leksono, A.S.; Yanuwiadi, B.; Kurnianto, A.S. Exploration of marine tourism in Watulimo, Trenggalek Regency: Challenges, potentials, and development strategies. J. Indones. Tour. Dev. Stud. 2017, 5, 175–184. [Google Scholar] [CrossRef] [Green Version]
  37. Ramallal, G.; Eduardoii, M.; Rodríguez, M.; Rosaiii, J.; Turégano, S.; Ángeliv, M. Sport and Tourism: A potentially conflictual relationship. The case of Marinas in Tenerife. PASOS. Revista de Turismo y Patrimonio Cultural 2010, 8, 265–276. [Google Scholar] [CrossRef]
  38. Gjesdal, O.; Sulebak, J.R.; Boge, M. Market Research in the Boat Tourism Segment; Springer-Verlag: Wien, Austria, 2002; pp. 339–345. [Google Scholar]
  39. Jovanovic, T.; Dragin, A.; Armenski, T.; Pavic, D.; Davidovic, N. What demotivates the tourist? Constraining factors of nautical tourism. J. Travel Tour. Mark. 2013, 30, 858–872. [Google Scholar] [CrossRef]
  40. Dolnicar, S.; Fluker, M. Behavioural market segments among surf tourists investigating past destination choice. J. Sport Tour. 2003, 8, 186–196. [Google Scholar] [CrossRef]
  41. De Freitas, C.R.; Scott, D.; McBoyle, G. A second generation climate index for tourism (CIT): Specification and verification. Int. J. Biometeorol. 2008, 52, 399–407. [Google Scholar] [CrossRef] [PubMed]
  42. Portugal, A.C.; Ramos, A.; Campo, F.; Melo, R. Surf tourism: Understanding the relation between serious leisure characteristics and surf travel behaviour. In Sport Tourism: New Challenges in a Globalized World, Sport Tourism Conference STC 14; Coimbra College of Education: Coimbra, Portugal, 2015; pp. 67–72. [Google Scholar]
  43. Carlsen, J. A systems approach to island tourism destination management. Syst. Res. Behav. Sci. 1999, 16, 321–327. [Google Scholar] [CrossRef]
  44. Baldacchino, G. Archipelago Tourism: Policies and Practices; Routledge: Abingdon, UK, 2016. [Google Scholar]
  45. Almeida-Santana, A.; Moreno-Gil, S. Effective island brand architecture: Promoting island tourism in the Canary Islands and other archipelagos. Isl. Stud. J. 2018, 13, 71–92. [Google Scholar] [CrossRef]
  46. Cannas, R.; Giudici, E. Tourism Relationships between Sardinia and its Islands: Collaborative or Conflicting. In G. Baldacchino, Archipelago tourism: Policies and practices; Routledge: Abingdon, UK, 2016; pp. 67–81. [Google Scholar]
  47. Butler, R.W. Archipelago Tourism: Some Thoughts and Reactions. In G. Baldacchino, Archipelago Tourism: Policies and Practices; Routledge: Abingdon, UK, 2016; pp. 67–81. [Google Scholar]
  48. Crouch, G.I.; Ritchie, J.B. Tourism, competitiveness, and societal prosperity. J. Bus. Res. 1999, 44, 137–152. [Google Scholar] [CrossRef]
  49. Gračan, D.; Zadel, Z.; Pavlović, D. The Stakeholders of Nautical Tourism Process in Destination Network: Topological Positions and Management Participation. NAŠE MORE: Znanstveno-stručni časopis za more i pomorstvo 2018, 65, 151–156. [Google Scholar] [CrossRef]
  50. Knežević Cvelbar, L.; Dwyer, L.; Koman, M.; Mihalič, T. Drivers of destination competitiveness in tourism: A global investigation. J. Travel Res. 2016, 55, 1041–1050. [Google Scholar] [CrossRef]
  51. Chen, C.M.; Chen, S.H.; Lee, H.T. The destination competitiveness of Kinmen’s tourism industry: Exploring the interrelationships between tourist perceptions, service performance, customer satisfaction and sustainable tourism. J. Sustain. Tour. 2011, 19, 247–264. [Google Scholar] [CrossRef]
  52. Chen, C.M.; Chen, S.H.; Lee, H.T.; Tsai, T.H. Exploring destination resources and competitiveness–A comparative analysis of tourists’ perceptions and satisfaction toward an island of Taiwan. Ocean Coast. Manag. 2016, 119, 58–67. [Google Scholar] [CrossRef]
  53. Chim-Miki, A.F.; Batista-Canino, R.M. The coopetition perspective applied to tourism destinations: A literature review. Anatolia 2017, 28, 381–393. [Google Scholar] [CrossRef]
  54. Gnyawali, D.R.; He, J.; Madhavan, R. Impact of co-opetition on firm competitive behavior: An empirical examination. J. Manag. 2006, 32, 507–530. [Google Scholar] [CrossRef]
  55. Kylanen, M.; Mariani, M.M. Unpacking the temporal dimension of coopetition in tourism destinations: Evidence from Finnish and Italian theme parks. Anatolia 2012, 23, 61–74. [Google Scholar] [CrossRef]
  56. Hsieh, Y.-H.; Lin, Y.-T.; Yuan, S.T. Expectation-based coopetition approach to service experience design. Simul. Model. Pract. Theory 2013, 34, 64–85. [Google Scholar] [CrossRef]
  57. Lorgnier, N.; Su, C.J. Considering coopetition strategies in sport tourism networks: A look at the nonprofit nautical sports clubs on the northern coast of France. Eur. Sport Manag. Q. 2014, 14, 87–109. [Google Scholar] [CrossRef]
  58. Eusébio, C.; Vieira, A.L. Destination attributes’ evaluation, satisfaction and behavioural intentions: A structural modelling approach. Int. J. Tour. Res. 2013, 15, 66–80. [Google Scholar] [CrossRef]
  59. Meng, F.; Tepanon, Y.; Uysal, M. Measuring tourist satisfaction by attribute and motivation: The case of a nature-based resort. J. Vacat. Mark. 2008, 14, 41–56. [Google Scholar] [CrossRef]
  60. Beeho, A.J.; Prentice, R.C. Conceptualizing the experiences of heritage tourists: A case study of New Lanark World Heritage Village. Tour. Manag. 1997, 18, 75–87. [Google Scholar] [CrossRef]
  61. Chen, C.F.; Tsai, D. How destination image and evaluative factors affect behavioral intentions? Tour. Manag. 2007, 28, 1115–1122. [Google Scholar] [CrossRef]
  62. Han, H.; Hyun, S.S. Customer retention in the medical tourism industry: Impact of quality, satisfaction, trust, and price reasonableness. Tour. Manag. 2015, 46, 20–29. [Google Scholar] [CrossRef]
  63. Clawson, M. Land and Water for Recreation-Opportunities, Problems, and Policies; Rand McNally: Chicago, IL, USA, 1963. [Google Scholar]
  64. Juan, P.-J.; Chen, H.-M. Taiwanese Cruise Tourist Behaviour during Different Phases of Experience. Int. J. Tour. Res. 2012, 14, 485–494. [Google Scholar] [CrossRef]
  65. Pizam, A.; Milman, A. Predicting Satisfaction among First-Time Visitors to a Destination by Using the Expectancy Disconfirmation Theory. Int. J. Hosp. Manag. 1993, 12, 197–209. [Google Scholar] [CrossRef]
  66. Chan, A.; Hsu, C.H.; Baum, T. The impact of tour service performance on tourist satisfaction and behavioral intentions: A study of Chinese tourists in Hong Kong. J. Travel Tour. Mark. 2015, 32, 18–33. [Google Scholar] [CrossRef] [Green Version]
  67. Alegre, J.; Garau, J. Tourist satisfaction and dissatisfaction. Ann. Tour. Res. 2010, 37, 52–73. [Google Scholar] [CrossRef]
  68. Znidar, K. The role of loyalty and satisfaction in consumer behaviour of nautical tourists in Croatia: Preliminary results of the empirical research. Int. J. Manag. Cases 2010, 12, 233–239. [Google Scholar] [CrossRef]
  69. Martín-Santana, J.D.; Beerli-Palacio, A.; Nazzareno, P.A. Antecedents and consequences of destination image gap. Ann. Tour. Res. 2017, 62, 13–25. [Google Scholar] [CrossRef]
  70. Martín, B.G.; López, X.A.; Ibarra, E.M. La información climático-meteorológica proporcionada al turista. Explorando el caso español. Anales de Geografía de la Universidad Complutense 2014, 2, 97–117. [Google Scholar]
  71. Paker, N.; Vural, C.A. Customer segmentation for marinas: Evaluating marinas as destinations. Tour. Manag. 2016, 56, 156–171. [Google Scholar] [CrossRef]
  72. Yuksel, A.; Yuksel, F.; Bilim, Y. Destination attachment: Effects on customer satisfaction and cognitive, affective and conative loyalty. Tour. Manag. 2010, 2, 274–284. [Google Scholar] [CrossRef]
  73. Midi, H.; Sarkar, S.K.; Rana, S. Collinearity diagnostics of binary logistic regression model. J. Interd. Mathem. 2010, 3, 253–267. [Google Scholar]
  74. Del Río, J.A.J.; Gálvez, J.C.P.; Agüera, F.O.; Romero, V.N.; López-Guzmán, T. Satisfaction and loyalty in the all-inclusive system in Cape Verde. Tour. Manag. Stud. 2018, 14, 53–62. [Google Scholar] [CrossRef]
  75. Twining-Ward, L. Cape Verde’s Transformation: Tourism as a Driver of Growth; Working paper; World Bank: Washington, DC, USA, 2010. [Google Scholar]
  76. Correia, A.; Butler, R.; Oliveira, N. First-time and repeat visitors to Cape Verde. The overall image. Tour. Econ. 2008, 14, 185–204. [Google Scholar] [CrossRef]
  77. Macedo, J.B.; Pereira, L.B. Cape Verde and Mozambique as Development Successes in West and Southern Africa; NBER Working: New York, NY, USA, 2010; p. 16552. [Google Scholar]
  78. Mitchell, J. Tourist Development in Cape Verde: The Policy Challenge of Coping with Success; Overseas Development Institute: London, UK, 2008. [Google Scholar]
  79. Eusébio, C.; Lopes, A.; Carneiro, M.J. Diverse Expenditure Patterns of International Tourists on Santiago Island—Cape Verde. Tour. Plan. Dev. 2017, 14, 389–410. [Google Scholar] [CrossRef]
  80. Cheer, J.M. Tourism, Resilience and Sustainability: Adapting to Social, Political and Economic Change; Routledge: Abingdon, UK, 2017. [Google Scholar]
  81. Nunkoo, R.; Ramkissoon, H. Small island urban tourism: A residents’ perspective. Curr. Issues Tour. 2010, 13, 37–60. [Google Scholar] [CrossRef]
  82. Baloglu, S.; McCleary, K.W. A Model of Destination Image Formation. Ann. Tour. Res. 1999, 26, 868–897. [Google Scholar] [CrossRef]
  83. Kneesel, E.; Baloglu, S.; Millar, M. Gaming Destination Images: Implications for Branding. J. Travel Res. 2010, 49, 68–78. [Google Scholar] [CrossRef]
  84. Hosany, S.; Ekinci, Y.; Uysal, M. Destination image and destination personality. Int. J. Cult. Tour. Hosp. Res. 2007, 1, 62–81. [Google Scholar] [CrossRef] [Green Version]
  85. Armstrong, J.S.; Overton, T.S. Estimating nonresponse bias in mail surveys. J. Mark. Res. 1977, 14, 396–402. [Google Scholar] [CrossRef] [Green Version]
  86. Ribeiro, M.A.; Valle, P.O.; Silva, J.A. Residents’ attitudes towards tourism development in Cape Verde Islands. Tour. Geogr. 2013, 14, 654–679. [Google Scholar] [CrossRef]
  87. López-Guzmán, T.; Orgaz-Agüera, F.; Martín, J.A.M.; Ribeiro, M.A. The all-inclusive tourism system in Cape Verde islands: The tourists’ perspective. J. Hosp. Tour. Manag. 2016, 29, 9–16. [Google Scholar] [CrossRef]
  88. Osborne, J.W.; Costello, A.B. Best practices in exploratory factor analysis: Four recommendations for getting the most from your analysis. Pan-Pac. Manag. Rev. 2009, 12, 131–146. [Google Scholar]
  89. Gefen, D.; Straub, D.; Boudreau, M.C. Structural equation modeling and regression: Guidelines for research practice. Commun. Assoc. Inf. Syst. 2000, 4, 1–70. [Google Scholar] [CrossRef] [Green Version]
  90. Rodríguez, M.D.; Espino, T.F. Determining the Sustainability Factors and Performance of a Tourism Destination from the Stakeholders’ Perspective. Sustainability 2016, 8, 951. [Google Scholar] [CrossRef] [Green Version]
  91. Asmelash, A.G.; Kumar, S. The structural relationship between tourist satisfaction and sustainable heritage tourism development in Tigrai, Ethiopia. Heliyon 2019, 5, e01335. [Google Scholar] [CrossRef] [PubMed] [Green Version]
Figure 1. Cape Verde destination and other island competitors in the Atlantic crossing.
Sustainability 11 06334 g001
Table 1. Description of the variables of the model.
VariableDescription
PARTYDummy variable that takes value 0 if tourists were travelling in a group (family, friends), and 1 if alone
CHANNELDummy variable that takes the value 1 if the tourist has received information of Cape Verde through specialized travel agents or tour operators, and zero otherwise.
ATRIB_j (j = 1, …, 4)Constructs measuring destination image, through several attributes (security, accessibility, climate, social environment, etc.) and products and services on offer (accommodation, commerce, cultural), etc. for nautical tourism (1 = totally disagree; 5 = totally agree).
DEST_Dummy variables that take the value of 1 if tourists had visited other islands competitors in the past 3 years for nautical purposes, and zero otherwise.
SAT - PAST1 to 5 level of satisfaction of the tourist with the previous nautical experience in other island destinations.
AFFConstruct measuring the affective image of the destination from a set of 1 to 5 bipolar scales of items describing emotions towards the destination.
ASS-EXPConstruct of the level of assessment of the nautical experience provided by the destination.
NAUTConstruct of the level of the satisfaction with the quality of the nautical supply infrastructure offered by the destination.
SAT (dependent variable)1 to 5 level of the overall satisfaction with the destination visited; 1 = not satisfied; 5 = very satisfied.
Table 2. Socio demographic profile and travel description.
VariablesCategories%
SexMale60.8
Female39.2
Age25–34 years38.6
35–44 years21.6
45–54 years15.0
Marital statussingle32.0
married38.6
couple24.2
Educational levelsecondary/bachelor30.1
university62.7
NationalityPortuguese37.3
French15.0
Britain15.0
German13.0
Travel partygroup (family/friends, etc.)38.6
alone61.4
Information channelInternet12.2
Travel Agents/TTOO27.7
Friends/Family25.7
Table 3. Factor analysis for the cognitive image of destination attributes.
FactorsFactor Loading Eigen ValueExplained VarianceMean ScoreCronbach’s Alpha
ATRIB_1 (Great cultural value, sporting offer and nightlife)9.81133.83%3.790.794
Availability of interesting historical and cultural heritage0.762
Interesting traditions and customs 0.736
Attractive hinterland0.736
Diversity of sport activities 0.624
Availability of nightlife and entertainment0.570
ATRIB_2 (Natural scenery, hospitality and tourism facilities)2.1837.53%4.210.705
Nice weather0.873
Beautiful beaches0.830
Hospitality and kindness of the local population0.652
Good accommodation facilities0.567
ATRIB 3_ (Safety and accessible destination) 1.5825.45%3.570.746
Political and a social stability0.720
Adapted to people with disabilities0.705
Highly safety destination0.637
Adapted to families and children0.565
ATRIB_4 (Fashionable destination with good ICT systems)1.2494.30%4.130.738
Good ICT infrastructure (telephone, internet,…)0.630
Fashionable destination0.504
Cronbach’s alpha of the total scale = 0.905. Total variance explained at 67.3%. Kaiser–Meyer–Olkin measure of sampling adequacy = 0.806. Bartlett’s test of sphericity: X2 = 888.01; p = 0.000.
Table 4. Factor analysis for the tourist experience, nautical supply and affective image.
FactorsFactor Loading Eigen ValueExplained VarianceMean ScoreCronbach’s Alpha
ASS –EXP (Satisfaction with the tour experience)3.85148.14%4.340.920
I am satisfied with my decision 0.844
I am satisfied with the nautical experience 0.838
The visit has met my expectations0.798
AFF (Affective image) 1.11213.904.080.893
Unsustainable—Sustainable destination0.857
Synthetic—Genuine destination0.716
Gloomy—Exciting destination0.593
NAUT (Nautical offer’s evaluation) 0.83110.39%4.010.805
Satisfaction with destination’s nautical activities0.836
Perceived image of destination’s nautical activities0.560
Cronbach’s alpha of the total scale = 0.919. Total variance explained at 72.5%. Kaiser–Meyer–Olkin measure of sampling adequacy = 0.845. Bartlett’s test of sphericity: X2 = 455.70; p = 0.000.
Table 5. Ordinal logit model estimation results for overall destination satisfaction.
VariableParameterWald St.Sig.
PARTY (alone)0.531 *3.3280.035
CHANNEL (agency/ttoo)0.333 *3.9500.047
ATRIB_10.214 *2.2830.050
ATRIB_2−0.2010.6010.438
ATRIB_30.244 *2.3050.025
ATRIB_4−0.2991.6340.201
ASS- EXP0.545 **6.7670.000
AFF0.874 **9.7090.000
NAUT0.535 *4.4060.036
SAT - PAST0.548 **2.6620.010
DEST (Canary Islands)0.867 *2.4100.050
DEST (Balearic Islands)−0.3110.3320.564
DEST (Madeira)1.019 *2.7390.047
DEST (Caribbean)0.4370.6000.439
Log likelihood X2 = 146.68; Sig. = 0.000. * p < 0.05, ** p < 0.01. Pseudo R2 Cox and Snell = 0.629, Nagelkerke = 0.699 and Mc Fadden = 0.431.

