Article

Empirical Insights into the Long-Run Linkage between Households Energy Consumption and Economic Growth: Macro-Level Empirical Evidence from Pakistan

by
Abbas Ali Chandio
1,
Yuansheng Jiang
1,*,
Jam Ghulam Murtaza Sahito
2 and
Fayyaz Ahmad
3
1
College of Economics, Sichuan Agricultural University, Chengdu 611130, China
2
Department of Agricultural Economics, Sindh Agriculture University, TandoJam 70060, Pakistan
3
School of Economics, Lanzhou University, Lanzhou 730000, China
*
Author to whom correspondence should be addressed.
Sustainability 2019, 11(22), 6291; https://doi.org/10.3390/su11226291
Submission received: 4 October 2019 / Revised: 1 November 2019 / Accepted: 6 November 2019 / Published: 8 November 2019

Abstract

:
This study is a maiden empirical attempt to examine the long-run linkage between households’ usage of energy and economic progression in Pakistan from the period of 1972–2017. The Autoregressive Distributive Lag (ARDL) bounds testing method to co-integrate is employed to expose the causality dynamics between the variables such as households’ electricity consumption, households’ gas consumption, population growth, and per capita Gross Domestic Product (GDP) in Pakistan. The study adopted three renowned unit root approaches through the use of the Augmented Dickey-Fuller (ADF), the Phillips-Perron (P-P), and Zivot-Andrews (Z&A) tests to check the stationarity of the variables, while the Johansen cointegration technique is also employed to assess the robustness of the long-run association. The validity of outcomes is also checked with casualty and variance decomposition. The estimated results reveal that, in both the short and long run, households’ electricity and gas usage positively affect economic growth, while population growth in the long-run has a negative impact, but the short-run analysis has a positive impact on economic growth in Pakistan. Additionally, the Granger causality and variance decomposition confirm the robustness of outcomes and suggesting a long run association among the variables, and a unidirectional causal link running from three variables to economic growth of Pakistan in the short run.

1. Introduction

With rapid urbanization and modernization of the economy, in developing countries like Pakistan, the consumption of modern electrical appliances has multiplied. According to the report, the Economic Survey of Pakistan [1] stated that the share of households in electricity consumption comprises 50%, which is the highest among other users, such as 10% of the agriculture, 26% of the industry, and 8% of the commercial sector, respectively. Sustainability and economic prosperity can be achieved with ample power supply in the country. In Pakistan, the demand for electricity is increasing exponentially. This increase is due to household demand and the industry sector [2,3,4]. Energy is the key ingredient and accelerating factor of production. Economic progress also refers to an increase in production, which is, ultimately, the symbol of progress [5]. Dynamic relations of energy and economic progress have widely attracted the researchers and vast literature is available in this regard. Understanding the economic progression in the context of energy has drawn the attention of the scholars to estimate, analyze, and determine the short-run and long-run associations along with causality [6,7]. There are contradictory views or conclusions of the literature available on energy-growth relationships. Positive, negative, and neutral views have been identified in the literature.
Available literature can be further bifurcated to four different categories on the basis of the methodology used. The first category of methodologies used traditional Vector Autoregressive (VAR) models [8] and Granger’s causality approach with the assumptions that the data series were stationary [8,9,10]. The second category of research studies emphasized that co-integration is the applicable approach to inspect the energy-growth associations, by keeping in view the non-stationarity of the variables in use. Hence, the focus was on the basis of Granger [11] two-stage procedure, tested pairs of variables for co-integrating connections, and error correction models (ECM) to test for Granger causality [12,13,14]. In the third-category literature, researchers used multivariate analysis [15], in which restricted estimations on co-integrating associations can be checked and information on the short-run as well as an adjustment may be identified. The multivariate procedure allows for estimation of two and more than two variables in the co-integration links [6,7,16,17,18,19,20,21,22]. Then comes the fourth and recent category, in which studies use the panel co-integration and panel-based VECM to analyze the short-run and long-run associations. These tests are more powerful tests than time-series approaches [23,24]. Based on the available literature, it can be established that a connection among energy usage and economic growth exists, but it is still contradictory whether energy usage is a result of, or a prerequisite for, economic growth. Causality has also been controversial in terms of positive, negative, and neutral interactions between using energy and economic growth, based on the methodology used, the country, and the time span studied. This study is another attempt in light of the above discussion to establish a clear picture of the growth-energy nexus in Pakistan.
This empirical study offers a five-fold contribution to existing literature in the following ways: (1) we apply several unit root tests such as the augmented Dickey-Fuller (ADF), the Phillip-Perron (PP), and the Zivot and Andrews (Z&A) to check the order of the integration of the study variables, (2) we use annual time series data over the period from 1972–2017, (3) we employ the ARDL bounds testing approach to cointegrate and to inspect the long-run association between the variables, (4) we apply the ARDL-ECM procedure to investigate the short-run and long-run impacts of household energy consumption (electricity and gas), and population growth on economic development, and, (5) in order to check the robustness, we apply the Johansen cointegration technique, the VECM-specified Granger causality test, and the variance decomposition (VDM) method.
The organization of the remaining parts is as follows: Section 2 presents the electricity scenario of Pakistan and Section 3 states the literature review. Section 4 describes data and methods. The results are discussed in Section 5, and Section 6 offers concluding remarks.

2. Electricity Scenario of Pakistan

Pakistan has been generating electricity from different energy sources such as hydropower, thermal, and nuclear power plants. More than 30% of electricity is generated from hydroelectric systems, 64% is generated from thermal systems, and the remaining 6% is produced through nuclear power in the country [25]. The total population of Pakistan is 207.77 million. Out of this total, 75.58 million people live in urban areas while 132.18 million people live in rural areas.
According to the World Bank [26] report, 80% of Pakistan’s population has access to electricity whereas 20% of the population is still lacking electricity access. Currently, the demand of electricity in the country is 25,000 MW and is projected to increase to 40,000 MW by 2030 [27,28,
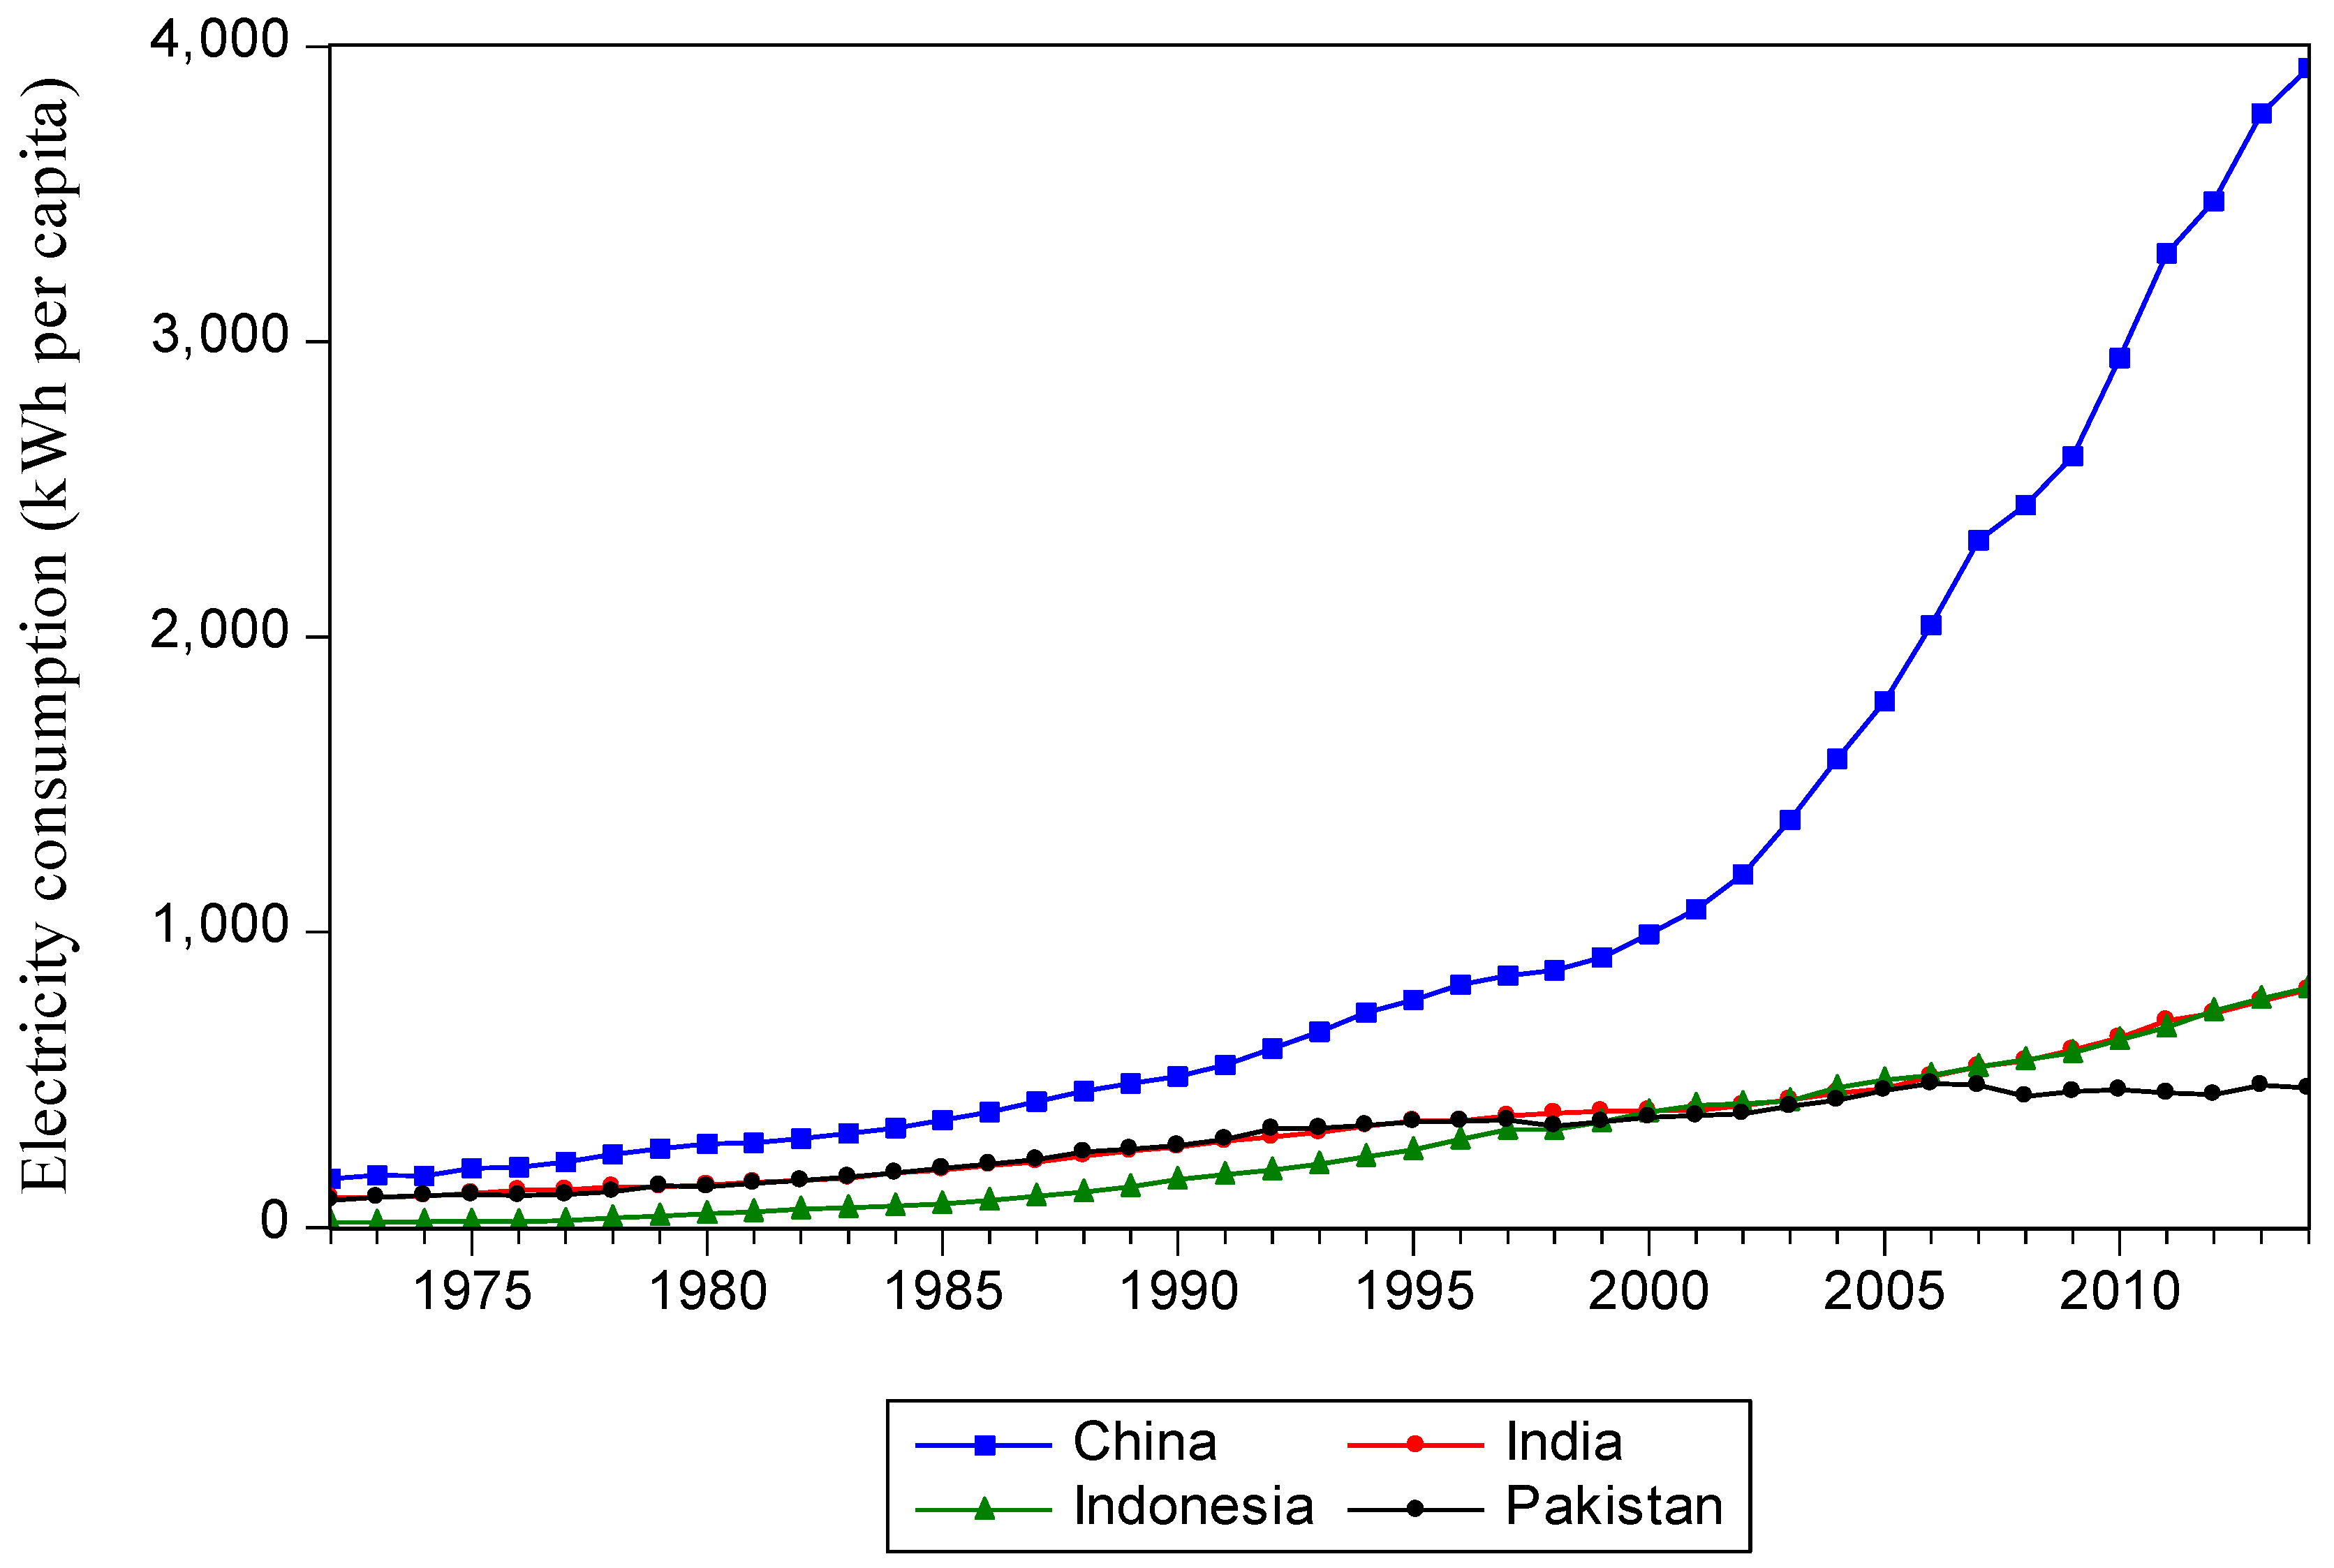
29]. Pakistan’s energy infrastructure is under developed and insufficient. For most of the economic activities, electricity is the most widely demanded and used form of energy and Pakistan is the lowest per capita electricity-consuming country in Asia (i.e., Figure 1).
The Economic Survey of Pakistan [25] reported that the installed power generation capacity was 25,878 MW in 2015 and 2016.The demand of electricity has significantly increased in the country during the past few years. The reason for this increased demand is the progress of economic activities with changes in trade and investment policies. Therefore, the installed capacity and maximum power generation increased significantly from 17,498 (MW), 68,117 (GW/h) to 26,188 (MW), 117,326 (GW/h) [25] from 2000–2001 to 2016–2017. However, the country has been struggling to meet the demand of electricity for its population.

3. Literature Review

Electricity is a major source of energy and it is a prime policy issue for sustainable expansion. The accessibility of electricity helps meet household and domestic needs, stimulates export potentials of the country to create employment, reduces poverty, and, ultimately, improves socio-economic development [4,30,31,32]. Electricity, therefore, plays a key role for the economic progression of a country, which brings much more assistance to all dynamic sectors of an economy [2,33]. Due to these facts, empirical research has been previously conducted to inspect the impact of electricity usage on economic development in developing and developed countries.
Kraft and Kraft [9], in their pioneering research work, examined the relationship among consumption of electricity and economic progression. Other researchers examined this in several other countries. Several researchers [34,35,36,37,38,39,40,41,42,43,44,45,46] have worked in several parts of the world on the effects of electricity usage and economic progression and provided mixed outcomes. Zhang [47] aimed to identify the association between the use of energy and economic development in Russia by using time-varying methodology. The empirical findings revealed that the use of energy causes economic progression and resulting economic progression leads to energy consumption.
Damette and Seghir [48] used panel cointegration and causality approaches to inspect the connection among energy use and economic progress in oil-exporting countries such as Brazil, Canada, Mexico, Norway, and Russia, respectively. Findings showed that economic progress has a positive influence on energy consumption. Das et al. [49] empirically studied the relationship among use of electricity and economic progress in 45 developing countries. The study used data from the time period of 1971–2009 and applied a generalized method of the moments approach. Das et al. [49] documented that consumption of electricity has a positive relationship with economic progression in a full panel. Further results show a positive growth electricity connection for Asia, the Pacific, and for the sub-Saharan African region. Using the ARDL model [50], the long term link between growth and electricity consumption in Malaysia was investigated. The results confirm the long-run association of both variables, and the negative impact of energy consumption on the environment.
An investigation conducted by Narayan and Smyth [51] applied panel cointegration, Granger causality, and long-run structural estimation to explore the association between electricity usage, economic growth, and exports for a group of Middle Eastern states. This research used data based on time series from 1974–2002. The empirical findings revealed that, for the panel as a whole, there are statistically significant feedback effects between these selected study variables. With respect to Pakistan-specific studies, Aqeel and Butt [52] applied co-integration and Hsiao’s version of Granger causality to inspect the causal linkage between energy usage and economic progression, and employment in Pakistan, which covers the time period from 1956–1996. Their results revealed that usage of electricity leads to economic progression without feedback. Assessing the electricity access impact on economic progress for Pakistan, Reference [30] suggested the long-run positive association among variables. Furthermore, the growth-enhancing impact of electricity access has been confirmed for the urban population. Likewise, Chaudhry et al. [53] used annual data for the period from 1972 to 2012 and found that consumption of electricity is significantly stimulating economic development whereas the consumption of oil is adversely affecting the economic development. On a similar note, electricity production from solar energy has a significant impact on the environment and several economic benefits are also associated with this production for Pakistan [54]. Household consumption has been increasing in Pakistan and, with this environmental problem, has also been increasing. The estimations of the demand side scenario show that efficient water heating can save more electricity than cooling. Moreover, renewable energy use in electricity production can mitigate CO2 emission significantly [55].
Another investigation conducted by Shahbaz and Feridun [41] examined the association of electricity consumption and economic progression in Pakistan. The study used the data for Pakistan over the period from 1971 to 2008. Applying several techniques such as the ARDL, the Toda Yamamoto causality, and the Wald-test, the outcomes of the study reported that the two variables are in a long-run equilibrium association. In addition, economic progression leads to electricity consumption in Pakistan and not vice versa. The consumption pattern varies among households. The ultimate consumption depends on end use and household gender. The investment and strict regulations can protect the loss of electricity to promote growth in Pakistan [4]. In Pakistan, a study conducted by Shahbaz et al. [56] inspected the association of natural gas usage and economic development. In doing so, the study applied the ARDL procedure and the Innovative Accounting Approach (IAA). The estimated outcomes of the study reported that consumption of natural gas is positively affecting the economic progression in Pakistan.
However, there is no study that has been conducted in Pakistan to inspect the linkage between households’ consumption of energy and economic progression. This is where our study contributes to the literature. Hence, it is important and timely to explore the association of households’ energy usage and economic progression in the country by applying the technique of ARDL bounds testing and the Error Correction Model (ECM). Therefore, this study provides further evidence regarding energy and growth connection with the ARDL method. Additionally, the Granger causality and variance decomposition are used for checking the robustness of outcomes.

4. Data and Methodology

The present empirical study uses the annual time series data for Pakistan over the time span from 1972–2017 and were sourced from both international and domestic institutions, such as World Development Indicators and the Economic Survey of Pakistan [1] (
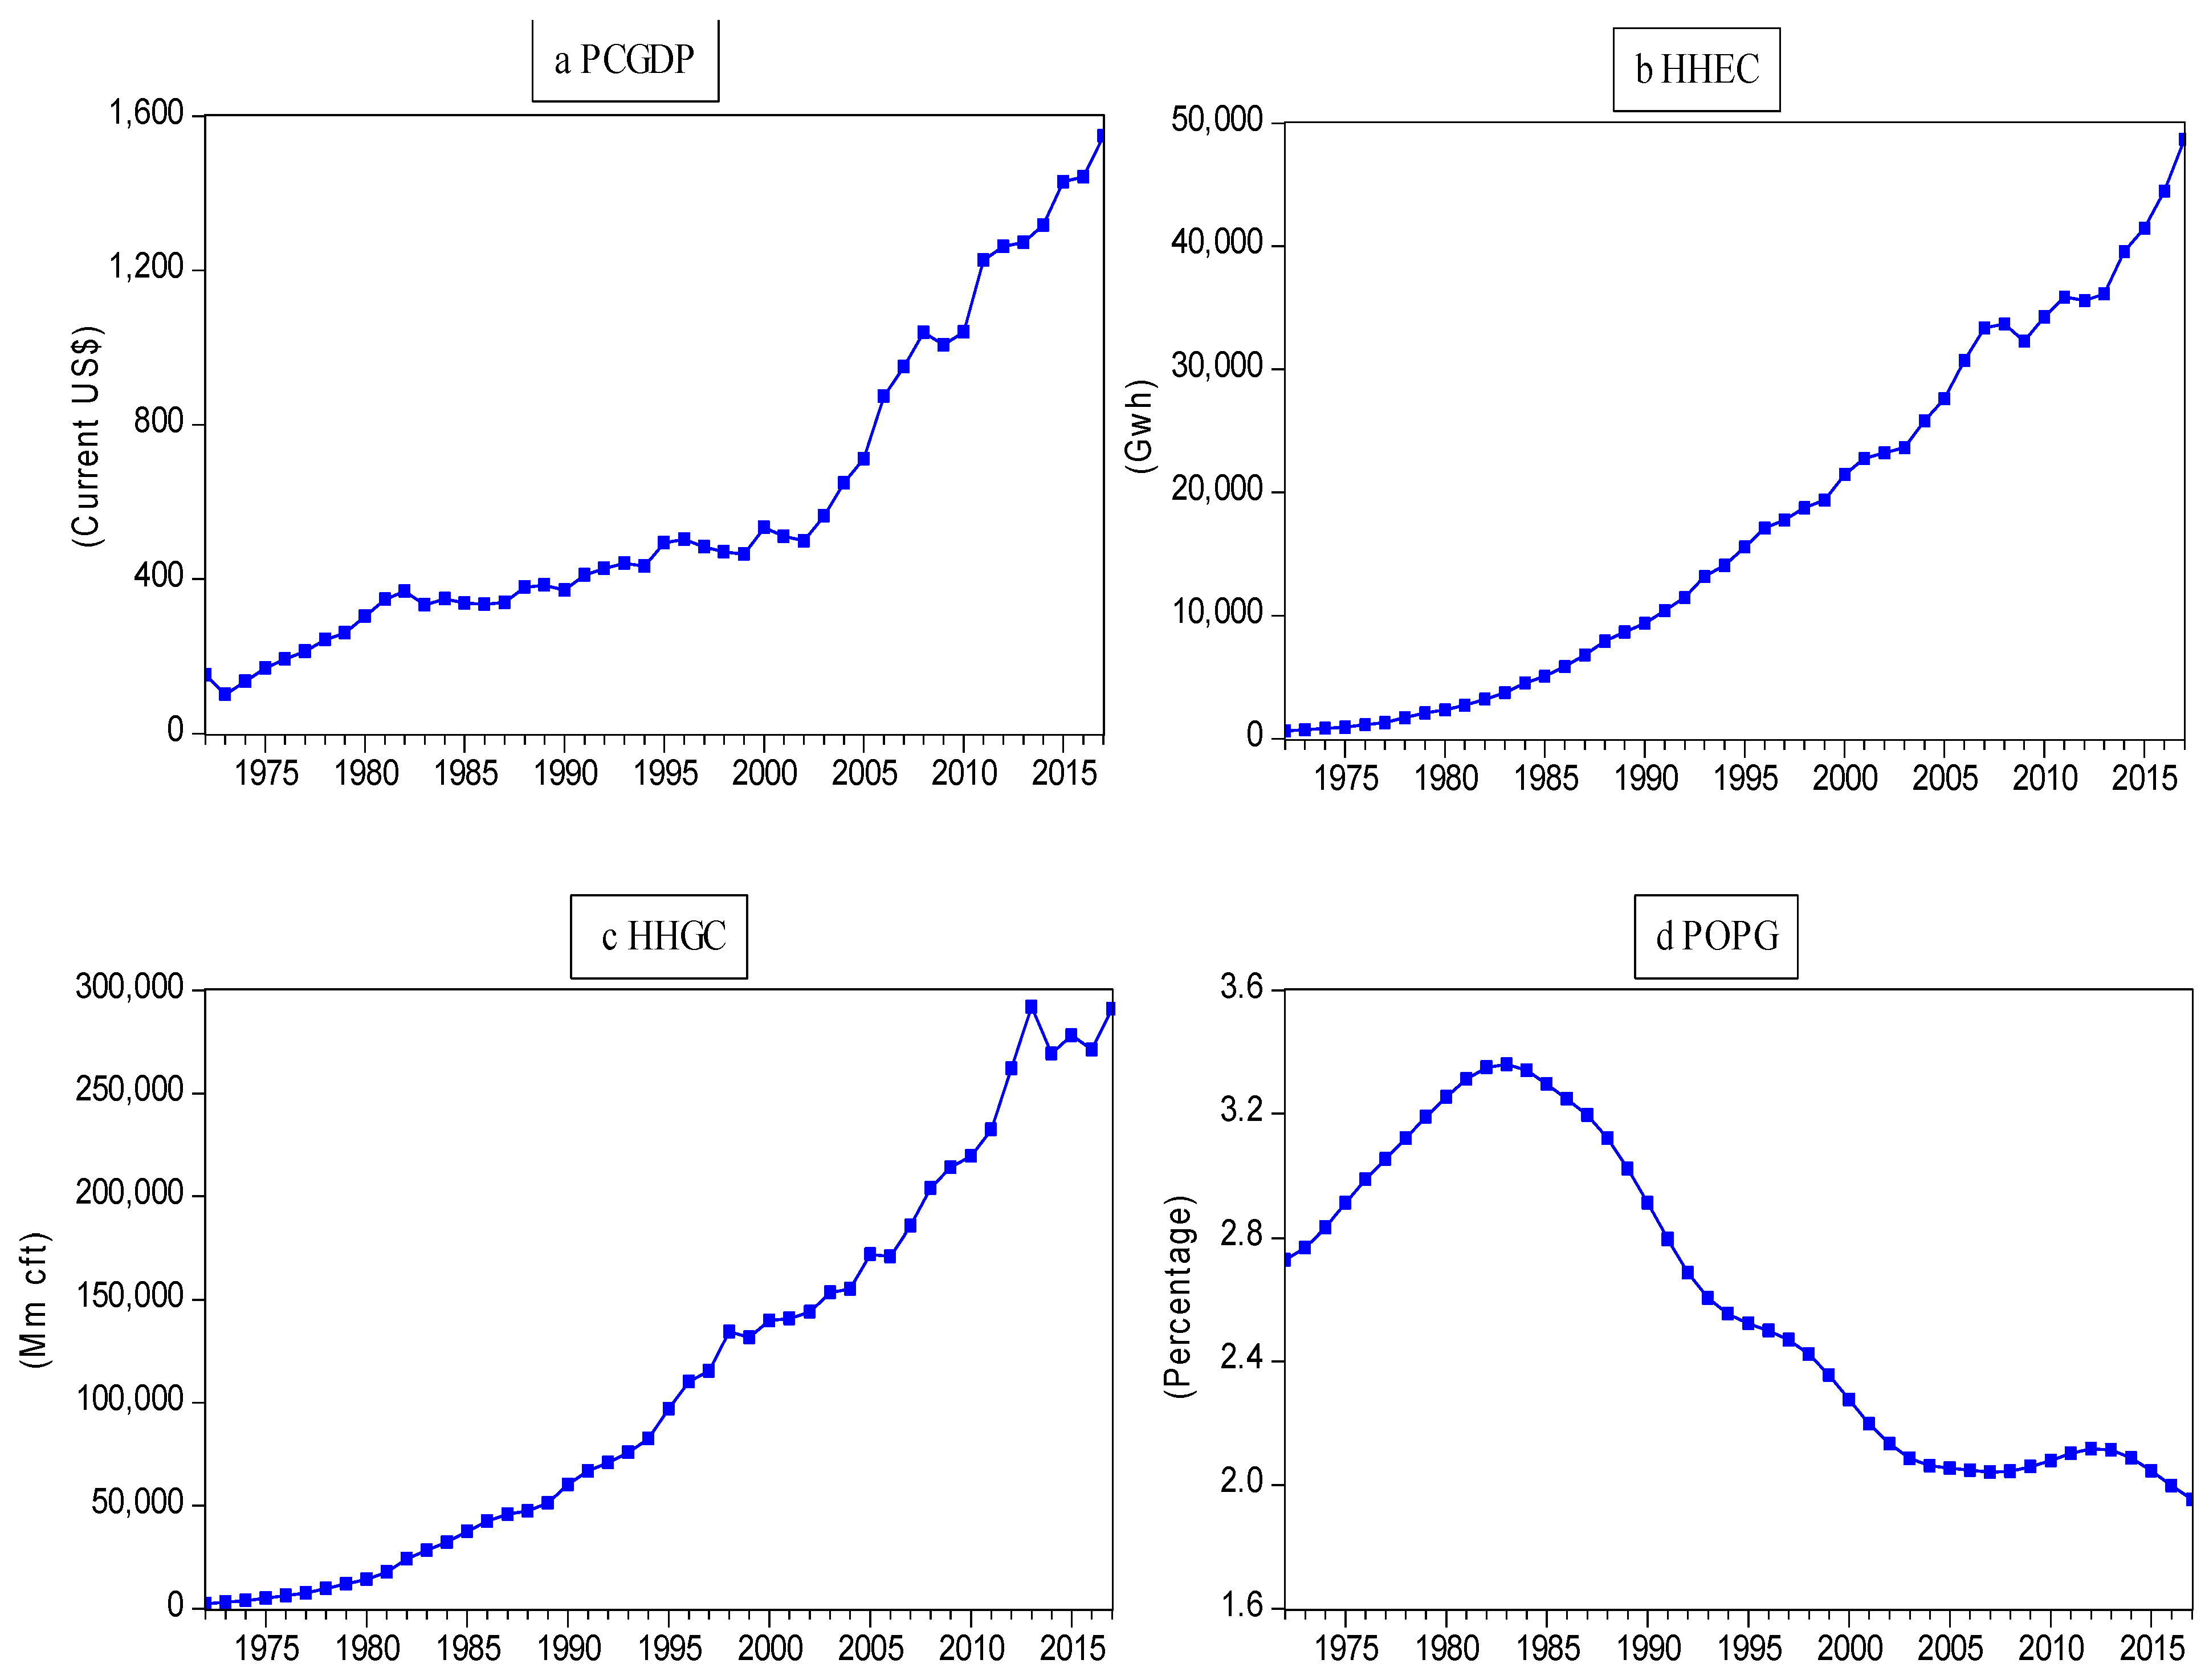
Table 1). The GDP in per capita terms is the dependent variable, and household electricity and gas use are the main independent variables. Furthermore, the influence of population growth is also considered for GDP growth. The annual data of these variables are used for statistical estimations. The details are given in Table 1. The GDP is taken in current US dollars. The annual growth of population is used to check the impact on the population. The data for household electricity and gas use is collected from the official website of the Pakistan government.

4.1. Model Specification

The present empirical study inspects the short-run and long-run linkage between electricity and gas consumption at households’ level, population growth, and economic progress in Pakistan. We used the multivariate regression model indicated below.
PCGDP t = f ( HHEC t ,   HHGC t ,   POPG t )
where P C G D P t represents the per capita GDP in (Current US$), H H E C t represents households electricity consumption in (Gwh),   H H G C t represents households gas consumption in (mm cft), and P O P G t represents population growth as a percentage.
P C G D P t = δ 0 + δ 1 H H E C t + δ 2 H H G C t + δ 3 P O P G t + υ t
By applying the natural logarithm to Equation (2), a log-linear model is given by the equation below.
L n P C G D P t = δ 0 + δ 1 L n H H E C t + δ 2 L n H H G C t + δ 3 L n P O P G t + υ t
Equation (3) is specified for the log-linear form of the selected study variables.   LnPCGDP t denotes for the natural logarithm of per capita GDP, LnHHEC t shows the natural logarithm of households usage of electricity, LnHHGC t stands for the natural logarithm of households’ usage of gas, LnPOPG t represents the natural logarithm of populating growth, t denotes the time dimension, υ t represents the error term, δ 0 denotes the constant intercept, and   δ 1 ,   δ 2 , δ 3 denotes parameters of the model to be estimated, respectively.

4.2. Unit Root Tests for Stationarity

The present empirical study examines the effects of households’ electricity and gas consumption, and population growth on economic development. Employing the unit root tests to check the stationarity among the study variables, several unit root tests including the ADF [57], P-P [58], DF-GLS [59], and Ng-Perron [60] exist in the applied economics literature. This study uses two renowned unit root methods that are ADF and P-P unit root tests to determine that none of the study variables considered is integrated of order I(2). The ARDL method is invalidated in cases where the I(2) variable is used [61]. The ADF unit root test, therefore, is performed using Equation (4).
Δ Z t = α 0 + β 0 T + β 1 Z t 1 + i 1 p α 1 Δ Z t 1 + μ t                                                                                                                                                
where Δ denotes the first difference, t refers to the time, Z symbolizes the variables being tested for a unit root, T indicates a linear trend, μ t is the error term, and p denotes the achievement of white noise residuals.

4.3. Co-Integration with the ARDL Approach

The applied economics literature provides several approaches of co-integration including J-J cointegration [62], Phillips and Hansen [63], Engle and Yoo [64], and Engle and Granger [65] in order to inspect the co-integration between electricity and gas consumption at the households’ level, the population growth, and economic progress variables. We prefer to employ the ARDL approach to avoid the criticism of employing conventional techniques of co-integration that may have serious shortcomings. It also captures short-run and long-run run linkages. The ARDL approach is very appropriate for the order of cointegration of the variables. This approach was introduced by References [66,67]. We may use the ARDL method to co-integrate if the study variables are stationary or integrated at the first difference I(1) or at the level I(0). The linkage of the long-run and short-run is inspected using the ARDL bounds testing method representation of the dynamic unrestricted error-correction model of Equation (3), as represented in Equation (5).
Δ l n P C G D P t = β 0 + i 1 p γ 1 i Δ l n P C G D P t i + i 1 p γ 2 i Δ l n H H E C t i + i 1 p γ 3 i Δ l n H H G C t i + i 1 p γ 4 i Δ l n P O P G t i + φ 1 l n P C G D P t 1 + φ 2 l n H H E C t 1   + φ 3 l n H H G C t 1 + φ 4 l n P O P G t 1 + ε t
where   β 0 represents the constant intercept, the coefficients ( γ 1 , γ 2 , γ 3 , γ 4 , γ 5 ) of the approach reflect the short-run linkage, and the coefficients ( φ 1 , φ 2 , φ 3 , φ 4 , φ 5 ) denote the short-run dynamics. The next step of the present study is to calculate the F-test for comparing the (a) upper and (b) lower critical values introduced by Reference [67], which are more appropriate for large samples. For small samples like in this study, it is suggested to use critical values introduced by Reference [68]. The ARDL bound test will favor the presence of a long-term co-integration among the study variables. If the calculated value of the F-test is greater than the value of the upper critical bound, a long-term cointegration exists. However, if the computed value of the F-test is lower than the value of the upper critical bound, no long-term cointegration exists. However, if the computed value of the F-test is between the upper and lower bounds critical values, the outcomes of the estimation are inconclusive. This study explores the long-run elasticity and short-run adjustment parameters in Equation (5).

5. Results and Discussions

5.1. Summary of Descriptive Statistics and Correlation Analysis

The estimated results of descriptive statistics and correlation analysis are available from the authors. The study finds that there is a positive correlation between per capita GDP, households’ consumption of electricity, and households’ consumption of gas. Likewise, there is also a positive association found between households’ use of electricity and households’ use of gas. Figure 2 displays the historical trend of per capita GDP, households’ use of electricity, households’ use of gas, and population growth in Pakistan over the period from 1972 to 2017.

5.2. Unit Root Tests’ Analysis

The present empirical study has conducted the two renowned unit root methods that are the ADF and the P-P unit root tests. This has been done in order to confirm that none of the series are integrated or stationary at the I(2) since this would render the outcomes of the ARDL-bounds approach to cointegration to be unacceptable because they find out on the precondition that the series are integrated or stationary at levels I(0) or, at the first difference I(1), mutually stationary or co-integrated. The outcomes of both unit root tests are reported in Table 2. The outcomes from the ADF and the PP unit root tests show that per capita GDP is stationary after the first difference, while household electricity consumption, household gas consumption, and population growth are stationary at all levels. Both unit root tests such as the ADF and the PP, therefore, display the indication of I(0) and I(1) variables, since these results suggest the use of the ARDL-bounds test for the cointegration technique. Furthermore, an advanced unit root test has been used to confirm that there is no issue of non-stationary effects among the variables. The outcomes of the Z&A test in Table 3 describe that per capita GDP is stationary at the level. The remaining three variables suffer from the unit root at the level, but the values are fine at the first difference and the break years are different for each variable. Overall, the investigation shows that the ARDL approach can be employed to check for long run and short run associations. Meanwhile, the observations of this study are annual, based on the suggestion of Pesaran and Shin [69] and Narayan [68], the maximum order of lags chosen in the ARDL-bounds test for the cointegration approach is 2. The study used AIC as proposed by Liew [70] for a small sample size. Following this suggestion, the selection of optimal lag of the ARDL-bounds test for the cointegration approach minimizes the AIC specified as (1, 1, 0, 1) in Figure 3.

5.3. Bound Testing for the Co-Integration Analysis

After checking the integration order and stationary status of the series, the ARDL bound testing co-integration technique is applied to inspect the long-term association among the study variables. The estimated outcomes of the ARDL-bounds method are demonstrated in Table 4, which displays that there is a long-term link among the study variables. The estimated results of the ARDL-bounds test display that the calculated F-tests i.e., 5.198, 11.744, 8.427, and 16.563 exceed the upper critical bound at 1% and 5% levels of significance when per capita GDP (LnPCGDP), households’ electricity consumption (LnHHEC), households’ gas consumption (LnHHGC), and populating growth (LnPOPG) are used as dependent variables. This implies that the null hypothesis of a long-term co-integration between households’ electricity consumption, households’ gas consumption, populating growth, and economic growth is rejected at 1% and 5% of the significance levels.
Furthermore, this study employed the Johansen and Juselius [62] cointegration method with trace statistics and maximum eigenvalue for the analysis of long-run robustness. The outcomes exhibited that there is a long-run co-integration linkage found between the households’ use of electricity, households’ gas consumption, population growth, and economic growth in Pakistan. This implies that long-run results are effective and robust. The details of the cointegration test is available from the authors.

5.4. Assessment of the Long-Run and Short-Run Scenario

The analysis outcomes of the long-run, short-run, and residual diagnostic tests are demonstrated in Table 5 displayed the linkage between the study variables. The estimated outcomes of the long-run and short-run evidence with Panel A and Panel B are described in Table 5. The elasticity of selected study variables in the analysis of long-run diagnostic tests in Panel A outcomes reveals that the variables households’ electricity and gas use have a positive association with economic progress with coefficients 0.205 and 0.481 with p-values 0.819 and 0.532, respectively. It is indicated in the long-run evidence that a 1% increase in the households’ consumption of electricity and households’ consumption of gas have a positive relationship with economic progress increasing at 0.205% and 0.481%. Natural gas is considered as the main fuel in Pakistan, and it contributes almost 47% of the major energy demand in 2007. Since 2000, natural gas and oil are both sources of energy that have been playing the vital role in the economy of Pakistan, demonstrating 50% and 20% of total consumption [4,41,56,71].
Likewise, population growth has a coefficient of –0.213 with a p-value of 0.827, which is showing a negative linkage with economic development in the evidence of long-run analysis. Currently, in Pakistan, the demand of households for electricity consumption is rapidly increasing in parallel with the growth of the country’s population. The production of electricity from several sources upholds and develops new approaches, which also covers the improvement of renewable energy technology [30]. Rafique and Rehman [72] reported that, for future prospects, the renewable energy has grown in Pakistan with a totally renewable energy potential of about 167.7 GW, which is more than enough to meet the demand of the country for total electricity consumption.
The outcomes analysis of the short-run are depicted in Table 5 (Panel B). The short-run dynamics outcomes expose that households’ electricity usage coefficient is 0.784. This implies that, in the short-run, a 1% increase in the households’ electricity use would lead to increases in economic progression at 0.784%. The calculated T-ratio for this coefficient is 2.090. This indicates that the short-run coefficient of households’ electricity usage is highly significant at 5%. Likewise, the short-run coefficient of households’ gas consumption is showing the right positive linkage with economic progression. The finding of this study is consistent with the outcomes of References [35,50,56].
Furthermore, in the analysis of short-run evidence, the variable population growth has the coefficient 3.889. Therefore, in the short-run, a 1% increase in the population growth will boost economic growth by 3.889%. The calculated T- ratio for this coefficient is 2.883. This shows that the short-run coefficient of population growth is highly significant at 1%. Natural gas is a clean, safe, efficient, and environmentally-friendly fuel. Its local supply accounts for about 38% of the country’s total primary energy supply portfolio. From July-March 2012–2013, the sectoral use of gas indicates that the highest share in the use of gas remained in the power sector (27.5%), which is followed by households (23.2%) and industry (22.6%) [73]. The summary of long-run and short-run effects of households’ use of energy on economic progression in Pakistan is depicted in Figure 4.
Moreover, the outcome analysis of Panel C revealed that the computed ECM is negative 0.251 and significant at the 1%. The estimated coefficient of ECM is – 0.251. Therefore, adjustment takes place 25.1% per year toward the long-run equilibrium. The large value of computed F-statistics reveals that the explanatory variable included in the ARDL model has a strong and significant effect on economic progress. The high R2 value is 0.980, which suggest that 98% variations in economic progress is explained by the variables included in the model. Furthermore, our empirical model has passed through various diagnostic tests like the ARCH test for heteroskedasticity and the Breusch-Godfrey serial correlation LM test, as displayed in Table 5. All diagnostic tests confirm that there is no heteroscedasticity problem and there is no serial correlation in the model. In addition, the CUSUM and CUSUMQ from Brown et al. [74] also show the stability of the model at the 5% significance level (see Figure 5 and Figure 6).

5.5. Robustness Analysis

The ARDL confirms the long run connection. Considering this, the direction of this relationship is a crucial aspect to investigate for policy actions. Therefore, this paper uses the VECM Granger Causality/ Block Exogeneity Wald Test as a complementary approach. The estimated outcomes are presented in Table 6.
The long run values are significant and state that a valid long run connection exists among variables. The short run results confirm a unidirectional link running from electricity and gas consumption to economic development in Pakistan. The significant values of the causality test confirm the validity of the ARDL estimations and assure that variables hold a sound connection in the short run and the long run.
The causality method captures the causal association among variables for the given period. Consequently, this study employed the generalized forecast error variance decomposition method (VDM) under VAR for a further check. This methodology postulates the extent of the predicted error variance in a series accounted for by improvements from each of the independent variables over diverse time-horizons outside the nominated time. The results of VDM are presented in Table 7. The estimated values show that gas and electricity consumption have a close connection than population with GDP in the long-run. The estimated causality outcomes also certify the long-run link among these variables. The decomposition of electricity states that the link of GDP, gas, and population grows stronger in the long-run. However, the association of growth and electricity consumption is relatively stronger than other variables. On the other hand, the relationship between gas and electricity use is more significant than population and economic development under the gas consumption decomposition. Likewise, the outcomes of population decomposition describe a significant link between electricity and population. Overall, the estimations suggested that the connection among variables is stronger in the long-run and short-run connections, which is one connection between all variables and economic development. Therefore, this approach also confirms the long-run association of all variables and certifies that electricity, gas consumption, and population have a significant impact on GDP growth in Pakistan.

6. Conclusions

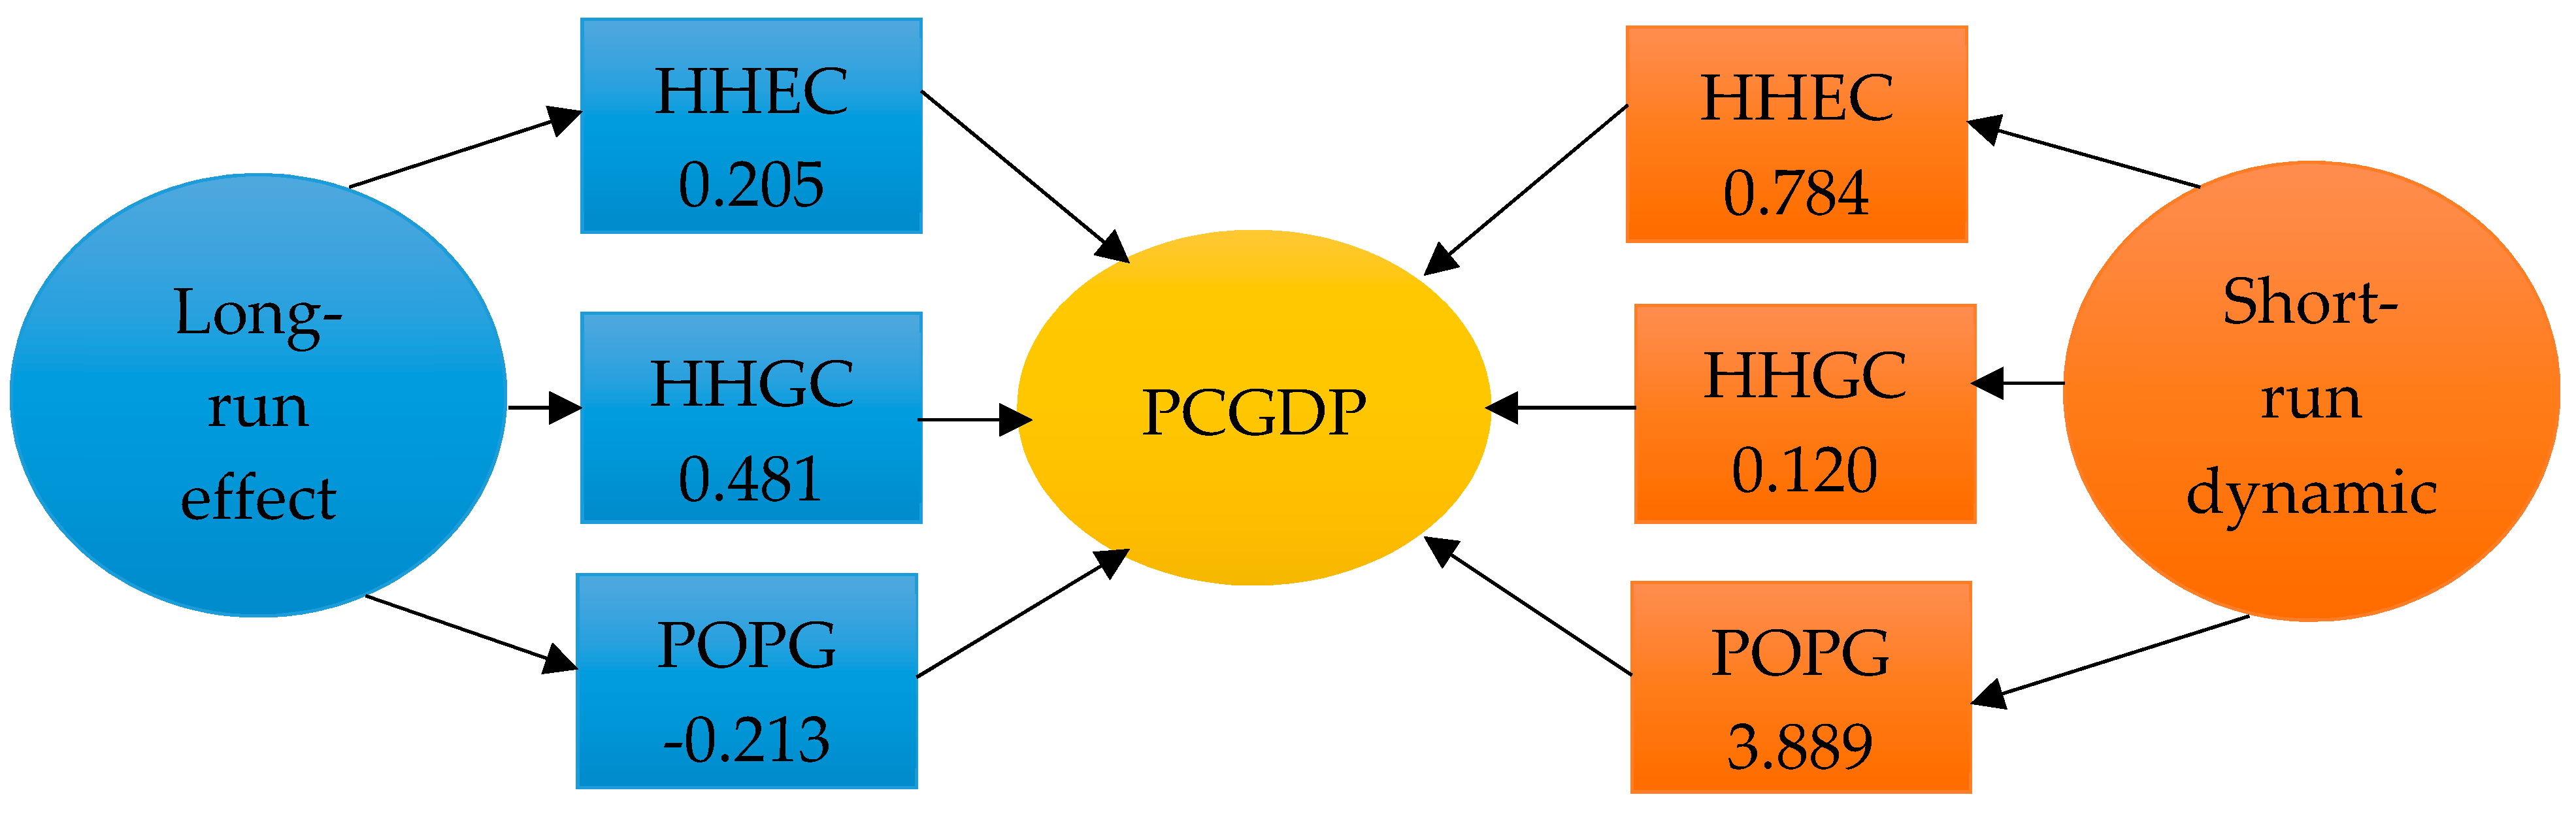
Energy plays a leading role in a country’s economic progression, and electricity plays a central role as a multi-functional form of energy. The main aim of the empirical study is to inspect the long-run and short-run connection among households’ electricity consumption, households’ gas consumption, population growth, and economic progression in Pakistan from 1972 to 2017. This empirical study applied the ARDL bounds testing for the cointegration approach as an analytical tool together with the Johansen co-integration method. The findings of the work exhibited that households’ electricity consumption and households’ gas consumption have a positive influence on economic progress in both long-run and short-run associations. However, the population growth in the long-run assessment has a negative influence while, in the short-run analysis, it has a positive influence on the economic development in Pakistan. The estimated outcomes of the VECM causality test also specify that there is a long-run connection among all variables, and a unidirectional causality from all variables to GDP growth in the short run assessment. Furthermore, the results of VDM confirm the robustness of the findings. Pakistan is a rich country in terms of energy sources including oil, coal, and gas. However, more than 20% of the population does not have access to electricity. To meet the increasing modern energy demand of its population, the government should enhance its energy policies and invest more in the energy sector to boost modern energy production. In addition, the government should place greater emphasis on producing electricity from alternative sources such as wind, solar, and nuclear power. Oil and natural gas are the country’s two main sources of energy. Economical electricity can also be generated from natural gas.

Author Contributions

All authors contributed to writing, editing, analysis, idea generation, and data collection.

Funding

This research was supported by Sichuan Agricultural University Fund for Scientific Innovation and Discipline Construction: Research on Rural Finance and Development.

Acknowledgments

The authors are thankful to the anonymous reviewers and editor for their valuable comments and suggestions on improving the quality of the paper.

Conflicts of Interest

The authors declare that there is no conflict of interest.

Abbreviations

ARDLautoregressive distributed-lag (ARDL) bounds testing approach to cointegration
Z&AZivot and Andrews
ADFaugmented Dickey-Fuller
PPPhillip-Perron
ECMerror correction model
VECMvector error correction model
CUSUMcumulative sum
CUSUMSQcumulative sum of squares. per capita
GDPper capita gross domestic product
VARvector autoregression
VDMvariance decomposition method
WDIWorld Development Indicators

References

  1. GOP. Economic Survey 2016-17; Finance Division, Economic Advisor’s Wing: Islamabad, Pakistan, 2017. [Google Scholar]
  2. Chandio, A.A.; Rauf, A.; Jiang, Y.; Ozturk, I.; Ahmad, F. Rauf Cointegration and Causality Analysis of Dynamic Linkage between Industrial Energy Consumption and Economic Growth in Pakistan. Sustainability 2019, 11, 4546. [Google Scholar] [CrossRef]
  3. Latief, R.; Lefen, L. Foreign Direct Investment in the Power and Energy Sector, Energy Consumption, and Economic Growth: Empirical Evidence from Pakistan. Sustainability 2019, 11, 192. [Google Scholar] [CrossRef]
  4. Naz, L.; Ahmad, M. What inspires energy crises at the micro level: Empirical evidence from energy consumption pattern of urban households from Sindh. In Proceedings of the Pakistan Society of Development Economics (PSDE) 29th Annual General Meeting (AGM) and Conference, Islamabad, Pakistan, 19–21 December 2013. [Google Scholar]
  5. Ahmad, F.; Draz, M.U.; Yang, S. China’s Economic Development: Does the Exchange Rate and FDI Nexus Matter? Asian Pac. Econ. Lit. 2019, 1–13. [Google Scholar] [CrossRef]
  6. Sadorsky, P. Energy consumption, output and trade in South America. Energy Econ. 2012, 34, 476–488. [Google Scholar] [CrossRef]
  7. Siddique, H.M.A.; Majeed, M.T. Energy consumption, economic growth, trade and financial development nexus in South Asia. Pak. J. Commer. Soc. Sci. (PJCSS) 2015, 9, 658–682. [Google Scholar]
  8. Sims, C.A. Money, income, and causality. Am. Econ. Rev. 1972, 62, 540–552. [Google Scholar]
  9. Kraft, J.; Kraft, A. On the relationship between energy and GNP. J. Energy Dev. 1978, 3, 401–403. [Google Scholar]
  10. Yu, E.S.H.; Hwang, B. The relationship between energy and GNP: Further results. Energy Econ. 1984, 6, 186–190. [Google Scholar] [CrossRef]
  11. Granger, C.W.J. Causality, cointegration, and control. J. Econ. Dyn. Control 1988, 12, 551–559. [Google Scholar] [CrossRef]
  12. Cheng, B.S.; Lai, T.W. An investigation of co-integration and causality between energy consumption and economic activity in Taiwan. Energy Econ. 1997, 19, 435–444. [Google Scholar] [CrossRef]
  13. Glasure, Y.U.; Lee, A. Cointegration, error-correction, and the relationship between GDP and energy: The case of South Korea and Singapore. Resour. Energy Econ. 1998, 20, 17–25. [Google Scholar] [CrossRef]
  14. Nachane, D.M.; Nadkarni, R.M.; Karnik, A.V. Co-integration and causality testing of the energy–GDP relationship: A cross-country study. Appl. Econ. 1988, 20, 1511–1531. [Google Scholar] [CrossRef]
  15. Johansen, S. Estimation and Hypothesis Testing of Cointegration Vectors in Gaussian Vector Autoregressive Models. Econometrica 1991, 59, 1551–1580. [Google Scholar] [CrossRef]
  16. Masih, A.M.M.; Masih, R. A multivariate cointegrated modelling approach in testing temporal causality between energy consumption, real income and prices with an application to two Asian LDCs. Appl. Econ. 1998, 30, 1287–1298. [Google Scholar] [CrossRef]
  17. Mehrara, M. Energy consumption and economic growth: The case of oil exporting countries. Energy Policy 2007, 35, 2939–2945. [Google Scholar] [CrossRef]
  18. Oh, W.; Lee, K. Causal relationship between energy consumption and GDP revisited: The case of Korea 1970–1999. Energy Economics 2004, 26, 51–59. [Google Scholar] [CrossRef]
  19. Ghosh, S. Electricity consumption and economic growth in India. Energy Policy 2002, 30, 125–129. [Google Scholar] [CrossRef]
  20. Soytas, U.; Sari, R. Energy consumption and GDP: Causality relationship in G-7 countries and emerging markets. Energy Econ. 2003, 25, 33–37. [Google Scholar] [CrossRef]
  21. Stern, D.I. A multivariate cointegration analysis of the role of energy in the US macroeconomy. Energy Econ. 2000, 22, 267–283. [Google Scholar] [CrossRef] [Green Version]
  22. Yang, H. Coal consumption and economic growth in Taiwan. Energy Sources 2000, 22, 109–115. [Google Scholar] [CrossRef]
  23. Al-Iriani, M.A. Energy–GDP relationship revisited: An example from GCC countries using panel causality. Energy Policy 2006, 34, 3342–3350. [Google Scholar] [CrossRef]
  24. Lee, C. Energy consumption and GDP in developing countries: A cointegrated panel analysis. Energy Econ. 2005, 27, 415–427. [Google Scholar] [CrossRef]
  25. GOP, Government of Pakistan. Energy. In Pakistan Economic Survey 2016–2017; Adviser’s Wing, Finance Division, Government of Pakistan: Islamabad, Pakistan, 2017; Chapter 14; p. 237. [Google Scholar]
  26. The World Bank. Electricity Access in Pakistan; The World Bank: Washington, DC, USA, 2017. [Google Scholar]
  27. Valasai, G.D.; Uqaili, M.A.; Memon, H.R.; Samoo, S.R.; Mirjat, N.H.; Harijan, K. Overcoming electricity crisis in Pakistan: A review of sustainable electricity options. Renew. Sustain. Energy Rev. 2017, 72, 734–745. [Google Scholar] [CrossRef]
  28. Mirjat, N.H.; Uqaili, M.A.; Harijan, K.; Valasai, G.D.; Shaikh, F.; Waris, M. A review of energy and power planning and policies of Pakistan. Renew. Sustain. Energy Rev. 2017, 79, 110–127. [Google Scholar] [CrossRef] [Green Version]
  29. Rehman, S.; Cai, Y.; Fazal, R.; Das Walasai, G.; Mirjat, N. An integrated modeling approach for forecasting long-term energy demand in Pakistan. Energies 2017, 10, 1868. [Google Scholar] [CrossRef]
  30. Rehman, A.; Deyuan, Z.; Chandio, A.A.; Hussain, I. An empirical analysis of rural and urban populations’ access to electricity: Evidence from Pakistan. Energy Sustain. Soc. 2018, 8, 40. [Google Scholar] [CrossRef]
  31. Foysal, M.A.; Hossain, M.L.; Rubaiyat, A.; Sultana, S.; Uddin, M.K.; Sayem, M.M.; Akhter, J. Household energy consumption pattern in rural areas of Bangladesh. Indian J. Energy 2012, 1, 72–85. [Google Scholar]
  32. Baul, T.; Datta, D.; Alam, A. A comparative study on household level energy consumption and related emissions from renewable (biomass) and non-renewable energy sources in Bangladesh. Energy Policy 2018, 114, 598–608. [Google Scholar] [CrossRef]
  33. Chandio, A.A.; Jiang, Y.; Rehman, A. Energy consumption and agricultural economic growth in Pakistan: Is there a nexus? Int. J. Energy Sect. Manag. 2019, 13, 597–609. [Google Scholar] [CrossRef]
  34. Chen, S.; Kuo, H.; Chen, C. The relationship between GDP and electricity consumption in 10 Asian countries. Energy Policy 2007, 35, 2611–2621. [Google Scholar] [CrossRef]
  35. Hassan, M.S.; Tahir, M.N.; Wajid, A.; Mahmood, H.; Farooq, A. Natural Gas Consumption and Economic Growth in Pakistan: Production Function Approach. Glob. Bus. Rev. 2018, 19, 297–310. [Google Scholar] [CrossRef]
  36. Ho, C.; Siu, K.W. A Dynamic Equilibrium of Electricity Consumption and GDP in Hong Kong: An Empirical Investigation. Energy Policy 2007, 35, 2507–2513. [Google Scholar] [CrossRef]
  37. Hu, J.; Lin, C. Disaggregated energy consumption and GDP in Taiwan: A threshold co-integration analysis. Energy Econ. 2008, 30, 2342–2358. [Google Scholar] [CrossRef]
  38. Jamil, F.; Ahmad, E. The relationship between electricity consumption, electricity prices and GDP in Pakistan. Energy Policy 2010, 38, 6016–6025. [Google Scholar] [CrossRef]
  39. Khan, S.; Jam, F.A.; Shahbaz, M.; Mamun, M.A. Electricity consumption, economic growth and trade openness in Kazakhstan: Evidence from cointegration and causality. OPEC Energy Rev. 2018, 42, 224–243. [Google Scholar] [CrossRef]
  40. Sbia, R.; Shahbaz, M.; Hamdi, H. A Contribution of Foreign Direct Investment, Clean Energy, Trade Openness, Carbon Emissions and Economic Growth to Energy Demand in UAE. Econ. Model. 2014, 36, 191–197. [Google Scholar] [CrossRef]
  41. Shahbaz, M.; Feridun, M. Electricity consumption and economic growth empirical evidence from Pakistan. Qual. Quant. 2012, 46, 1583–1599. [Google Scholar] [CrossRef]
  42. Shahbaz, M.; Tang, C.F.; Shabbir, M.S. Electricity consumption and economic growth nexus in Portugal using cointegration and causality approaches. Energy Policy 2011, 39, 3529–3536. [Google Scholar] [CrossRef] [Green Version]
  43. Shahbaz, M.; Zeshan, M.; Afza, T. Is energy consumption effective to spur economic growth in Pakistan? New evidence from bounds test to level relationships and Granger causality tests. Econ. Model. 2012, 29, 2310–2319. [Google Scholar] [CrossRef] [Green Version]
  44. Tang, C.F.; Shahbaz, M. Sectoral analysis of the causal relationship between electricity consumption and real output in Pakistan. Energy Policy 2013, 60, 885–891. [Google Scholar] [CrossRef]
  45. Tang, C.F.; Shahbaz, M.; Arouri, M.E.H. Re-investigating the electricity consumption and economic growth nexus in Portugal. Energy Policy 2013, 62, 1515–1524. [Google Scholar] [CrossRef]
  46. Zeshan, M.; Ahmad, V. Energy consumption and economic growth in Pakistan. Bull. Energy Econ. 2013, 1, 8–20. [Google Scholar]
  47. Zhang, Y.J. Interpreting the dynamic nexus between energy consumption and economic growth: Empirical evidence from Russia. Energy Policy 2011, 39, 2265–2272. [Google Scholar] [CrossRef]
  48. Damette, O.; Seghir, M. Energy as a driver of growth in oil exporting countries. Energy Econ. 2013, 37, 193–199. [Google Scholar] [CrossRef]
  49. Das, A.; Chowdhury, M.; Khan, S. The Dynamics of Electricity Consumption and Growth Nexus: Empirical Evidence from Three Developing Regions. Margin J. Appl. Econ. Res. 2012, 6, 445–466. [Google Scholar] [CrossRef]
  50. Saudi, M.H.M.; Sinaga, O.; Roespinoedji, D.; Jabarullah, N.H. Industrial, Commercial, and Agricultural Energy Consumption and Economic Growth Leading to Environmental Degradation. Ekoloji 2019, 28, 299–310. [Google Scholar]
  51. Narayan, P.K.K.; Smyth, R. Multivariate Granger Causality between Electricity Consumption, Exports and GDP: Evidence from a Panel of Middle Eastern Countries. Energy Policy 2009, 37, 229–236. [Google Scholar] [CrossRef]
  52. Aqeel, A.; Butt, M.S. The relationship between energy consumption and economic growth in Pakistan. Asia-Pac. Dev. J. 2001, 8, 101–110. [Google Scholar]
  53. Chaudhry, I.S.; Safdar, N.; Farooq, F. Energy consumption and economic growth: Empirical evidence from Pakistan. Pak. J. Soc. Sci. 2012, 32, 371–382. [Google Scholar]
  54. Shah, S.A.A.; Valasai, G.; Memon, A.; Laghari, A.; Jalbani, N.; Strait, J. Techno-Economic Analysis of Solar PV Electricity Supply to Rural Areas of Balochistan, Pakistan. Energies 2018, 11, 1777. [Google Scholar] [CrossRef]
  55. Bashir, S.; Ahmad, I.; Ahmad, S.R. Low-Emission Modeling for Energy Demand in the Household Sector: A Study of Pakistan as a Developing Economy. Sustainability 2018, 10, 3971. [Google Scholar] [CrossRef]
  56. Shahbaz, M.; Lean, H.H.; Farooq, A. Natural gas consumption and economic growth in Pakistan. Renew. Sustain. Energy Rev. 2013, 18, 87–94. [Google Scholar] [CrossRef] [Green Version]
  57. Dickey, D.A.; Fuller, W.A. Likelihood ratio statistics for autoregressive time series with a unit root. Econom. J. Econom. Soc. 1981, 49, 1057–1072. [Google Scholar] [CrossRef]
  58. Phillips, P.C.B.; Perron, P. Testing for a Unit Root in Time Series Regression. Biometrika 1988, 75, 335–346. [Google Scholar] [CrossRef]
  59. Elliott, G.; Rothenberg, T.J.; Stock, J.H. Efficient Tests for an Autoregressive Unit Root. Econometrica 1992, 64, 813–836. [Google Scholar] [CrossRef]
  60. Ng, S.; Perron, P. Lag Length Selection and the Construction of Unit Root Tests with Good Size and Power. Econometrica 2001, 69, 1519–1554. [Google Scholar] [CrossRef]
  61. Goswami, G.G.; Hossain, M.Z. Testing Black Market vs. Official PPP: A Pooled Mean Group Estimation Approach. Empir. Econ. Lett. 2013, 12, 1291–1300. [Google Scholar]
  62. Johansen, S.; Juselius, K. Maximum likelihood estimation and inference on cointegration—With applications to the demand for money. Oxf. Bull. Econ. Stat. 1990, 52, 169–210. [Google Scholar] [CrossRef]
  63. Phillips, P.C.B.; Hansen, B.E. Statistical Inference in Instrumental Variables Regression with I (1) Processes. Rev. Econ. Stud. 1990, 57, 99–125. [Google Scholar] [CrossRef]
  64. Engle, R.; Yoo, B. Cointegrated time series: An overview with new results (Chapter 12). In Long-Run Economic Relationships; Oxford University Press: Oxford, UK, 1991. [Google Scholar]
  65. Engle, R.F.; Granger, C.W.J. Co-integration and Error Correction: Representation, Estimation, and Testing. Econometrica 1987, 55, 251–276. [Google Scholar] [CrossRef]
  66. Pesaran, M.H.; Shin, Y. An autoregressive distributed-lag modelling approach to cointegration analysis. Econom. Soc. Monogr. 1998, 31, 371–413. [Google Scholar]
  67. Pesaran, M.H.; Shin, Y.; Smith, R.J. Bounds testing approaches to the analysis of level relationships. J. Appl. Econom. 2001, 16, 289–326. [Google Scholar] [CrossRef]
  68. Narayan, P.K. The saving and investment nexus for China: Evidence from cointegration tests. Appl. Econ. 2005, 37, 1979–1990. [Google Scholar] [CrossRef]
  69. Pesaran, M.H.; Shin, Y. An Autoregressive Distributed Lag Modelling Approach to Cointegration Analysis; Cambridge Working Papers in Economics; Faculty of Economics, University of Cambridge: Cambridge, UK, 1995; pp. 134–150. [Google Scholar]
  70. Liew, V.K.-S. Which lag length selection criteria should we employ? Econ. Bull. 2004, 3, 1–9. [Google Scholar]
  71. GOP. Economic Survey of Pakistan; Ministry of Finance: Islamabad, Pakistan, 2005.
  72. Rafique, M.M.; Rehman, S. National energy scenario of Pakistan–Current status, future alternatives, and institutional infrastructure: An overview. Renew. Sustain. Energy Rev. 2017, 69, 156–167. [Google Scholar] [CrossRef]
  73. GOP. Economic Survey of Pakistan (2012-13); Ministry of Finance: Islamabad, Pakistan, 2013.
  74. Brown, R.L.; Durbin, J.; Evans, J.M. Techniques for Testing the Constancy of Regression Relationships Over Time. J. R. Stat. Soc. Ser. B-Methodol. 1975, 37, 149–163. [Google Scholar] [CrossRef]
Figure 1. Electricity consumption (kWh per capita) of Asian countries. Source: World development indicators (WDI).
Sustainability 11 06291 g001
Figure 2. Trends of the selected study variables. Notes: (a) PCGDP; (b) HHEC; (c) HHGC; and (d) POPG denote the per capita GDP; households’ electricity consumption; households’ gas consumption; and population growth, respectively.
Sustainability 11 06291 g002
Figure 3. Akaike information criteria (top 20 models).
Sustainability 11 06291 g003
Figure 4. Long-run effect and short-run dynamic.
Sustainability 11 06291 g004
Figure 5. Plot of CUSUM.
Sustainability 11 06291 g005
Figure 6. Plot of CUSUM of square.
Sustainability 11 06291 g006
Table 1. Data description.
VariablesIdentifierData SourceMeasurement
Per Capita GDPPCGDPWorld Bank (2017)Current US $
Household Electricity ConsumptionHHECGOP (2017)Gwh
Household Gas Consumption HHGCGOP (2017)Mm cft
Population GrowthPOPGWorld Bank (2017)Percentage
Table 2. Results of the ADF and the PP unit root tests.
VariablesTest StatisticsCritical ValueRemarksTest StatisticsCritical ValueRemarksOrder of Integration
LnPCGDP−2.149−3.513Non-Stationary−9.155***−3.515StationaryI(1)
LnHHEC−7.460***−2.928Stationary I(0)
LnHHGC−4.144**−3.540Stationary I(0)
LnPOPG−3.949**−3.523Stationary I(0)
PP unit root test
LnPCGDP−2.181−3.513Non-Stationary−8.335***−3.515StationaryI(1)
LnHHEC−6.751***−2.928Stationary I(0)
LnHHGC−3.958**−3.513Stationary I(0)
LnPOPG−3.289*−3.513Stationary I(0)
Notes: The ADF unit root test assumption: test comprises an intercept and trend. LnPCGDP; LnHHEC; LnHHGC; and LnPOPG stand for the natural logarithm of per capita GDP; the natural logarithm of households’ usage of electricity; the natural logarithm of households’ usage of gas; and the natural logarithm of populating growth, respectively. *** show statistical significance at the 1% level. ** show statistical significance at the 5% level. * show statistical significance at the 10% level.
Table 3. Zivot and Andrews unit root results.
VariablesLevel1st Difference
T-StatisticsBreaksT-StatisticsBreaks
LnPCGDP−5.8622006--
LnHHEC−2.0851979−5.6201989
LnHHGC−4.1701999−7.041 1984
LnPOPG−3.252 1995−8.2151982
Notes: Critical values for the test: 1%: −5.34, 5%: −4.80, 10%: −4.58. LnPCGDP; LnHHEC; LnHHGC; and LnPOPG indicate the natural logarithm of per capita GDP; the natural logarithm of households’ electricity consumption; the natural logarithm of households’ gas consumption; and the natural logarithm of populating growth, respectively.
Table 4. The ARDL bounds test.
VariablesLnPCGDPLnHHECLnHHGCLnPOPG
F-statistics5.198**11.744***8.427***16.563***
Critical values1%2.5%5%10%
Lower bounds I(0)4.293.693.232.72
Upper bounds I(1)5.614.894.353.77
Diagnostic tests
R20.2930.7370.7750.800
Adj-R20.1820.6770.7320.767
F-statistic3.63512.29417.77824.7162
Prob(F-statistic)0.0200.0000.0000.000
Notes: LnPCGDP; LnHHEC; LnHHGC; and LnPOPG show the natural logarithm of per capita GDP; the natural logarithm of households’ electricity usage; the natural logarithm of households’ gas usage; and the natural logarithm of populating growth, respectively. *** denote statistical significance at the 1% level. ** denote statistical significance at the 5% level.
Table 5. The long-run and short-run coefficients.
AIC – ARDL (1, 1, 0, 1)
Dependent variable: LnPCGDP
Panel A: Long-run estimation
VariablesCoefficientSET-statisticsProb.
LnHHEC0.2050.8980.2290.819
LnHHGC0.4810.7630.6290.532
LnPOPG−0.2130.974−0.2190.827
C−0.8511.508−0.5640.575
Panel B: Short-run estimation
DLnHHEC0.784**0.3752.0900.043
DLnHHGC0.1200.1950.6200.538
DLnPOPG3.889***1.3482.8830.006
ECM (-1)−0.251***0.074−3.3690.001
Panel C: Diagnostic tests
R-squared 0.980
Adjusted R-squared 0.977
F-statistic 325.731***
Durbin-Watson stat1.457
χ2 SERIAL0.411 (0.665)
χ2 NORMAL1.381 (0.501)
χ2ARCH0.321 (0.574)
χ2 RESET1.510 (0.235)
CUSUM (Stable)
CUSUMSQ(Stable)
Notes: LnPCGDP; LnHHEC; LnHHGC; and LnPOPG display the natural logarithm of per capita GDP; the natural logarithm of households’ use of electricity; the natural logarithm of households’ use of gas; and the natural logarithm of populating growth, respectively. *** stand for statistical significance at the 1% level. ** stand for statistical significance at the 5% level.
Table 6. VECM Granger Causality/Block Exogeneity Wald Test.
Independent Variables
Dependent variablesLnPCGDPLnHHECLnHHGCLnPOPGECT
LnPCGDP--0.36577.614**9.539***16.076***
--(0.832)(0.022)(0.008)(0.014)
LnHHEC3.914--0.2666.164**15.868***
(0.141)--(0.875)(0.045)(0.012)
LnHHGC0.64410.529***--9.428***16.591***
(0.724)(0.005)--(0.009)(0.010)
LnPOPOG0.4290.5837.794**--18.479**
(0.806)(0.747)(0.020)--(0.020)
Notes: LnPCGDP; LnHHEC; LnHHGC; and LnPOPG represent the natural logarithm of per capita GDP; the natural logarithm of households’ electricity consumption; the natural logarithm of households’ gas consumption; and the natural logarithm of populating growth, respectively. Above values are χ2 statistics and the numbers in parenthesis are the corresponding probabilities. Values under ECT indicate the long run causality. *** refer statistical significance at the 1% level. ** refer statistical significance at the 5% level.
Table 7. Variance decomposition method.
PeriodS.E.LnPCGDPLnHHECLnHHGCLnPOPG
Variance decomposition of LnPCGDP
10.063022100.00000.0000000.0000000.000000
20.09633186.829994.1115245.8020493.256440
30.12124475.575678.5579098.2982967.568120
40.14631965.3773314.809779.8241069.988792
50.17165858.4588720.2420810.7413010.55775
60.19550753.7222224.5766711.4168310.28428
70.21681750.6715527.8678711.768339.692250
80.23570748.7888230.2857711.895099.030324
90.25246447.6975431.9659011.899658.436914
100.26747747.0797433.1009911.851997.967281
Variance decomposition of LnHHEC
10.03964612.3839387.616070.0000000.000000
20.0578168.87706590.892630.1704900.059817
30.07053710.2968385.236622.7778251.688721
40.08182814.0620674.561555.8124555.563927
50.09381717.1010563.562809.06779610.26836
60.10619518.7431954.3006912.5823214.37381
70.11856619.7705546.9584516.1479617.12304
80.13010520.7084441.4189419.4406418.43199
90.14025221.7511437.2276522.3841018.63711
100.14887622.9704733.8908124.9670218.17170
Variance decomposition of LnHHGC
10.0570640.7714891.03786698.190650.000000
20.0823690.4080870.64804998.311650.632213
30.1037680.8963401.51771095.343922.242030
40.1215691.0847761.20780393.575344.132079
50.1385231.5278381.22037692.132435.119356
60.1550792.2180222.47910190.019085.283799
70.1718122.9136614.55674587.569374.960222
80.1888713.4788656.87645585.191244.453435
90.2061853.9330339.04871583.067513.950739
100.2235204.29782310.9648381.191253.546097
Variance decomposition of LnPOPG
10.0031680.7870656.1234960.91381692.17562
20.0092360.7253138.0622850.10845891.10394
30.0180130.51234510.634200.78309488.07036
40.0288430.35559214.189422.06339183.39159
50.0408960.24492718.594753.36096177.79936
60.0533250.16759523.357754.45299772.02165
70.0654120.11728928.013035.27812266.59156
80.0766420.08622332.243885.83956361.83033
90.0867390.06731835.881116.17680157.87477
100.0956490.05557338.865906.34443454.73409
Notes: LnPCGDP; LnHHEC; LnHHGC; and LnPOPG symbolize the natural logarithm of per capita GDP; the natural logarithm of households’ electricity usage; the natural logarithm of households’ gas usage; and the natural logarithm of populating growth, respectively.

