1. Introduction
Chinese fir (
Cunninghamia lanceolata) is mainly distributed between 19°30′–34°03′ N and 101°30′–121°53′ E [
1]. On account of its advantages of fast growth, superior material quality, and wide application, it has become the dominant afforestation tree species for fast-growing industrial materials and ecological environmental protection in China [
2]. The construction of Chinese fir plantations can not only improve the income of local farmers [
3] but also improve the natural ecological environment [
4,
5]. Nevertheless, with the continuous expansion of planting area, soil degradation has taken place in some regions [
6,
7]. How to maintain soil fertility and strengthen the sustainable development of the forestry industry has become the focus of local governments and scholars. The multiple planting index of Chinese fir is relatively high [
8], so in order to meet the nutrients needed in the growth process and improve the quality, farmers increase the nutrients in the forest by increasing the application of fertilizer. The randomness of fertilization is high, leading to great differences in soil nutrients in different areas [
9]. Consequently, it is necessary to carry out a comprehensive evaluation of soil fertility in the main production areas of Chinese fir plantations and accurately determine the soil nutrient status of the forestland to provide a reference for scientific and rational fertilization and prevent forestry pollution.
Soil fertility is essential for ensuring soil quality [
10], and a scientific and objective evaluation method is the premise of soil fertility evaluation. The traditional methods of the comprehensive evaluation of soil fertility include the principal component analysis (PCA) method [
11], cluster analysis (CA) method [
12], grey relational analysis (GRA) model [
13], fuzzy comprehensive evaluation (FCE) method [
14], and matter-element (ME) model [
15]. These methods are used to evaluate soil fertility, which can effectively realize the conversion of soil fertility quantitative indexes and qualitative language expressions. However, at present, there are no uniform standards for the selection of indicators, evaluation processes, and classification of evaluation grades in soil fertility assessment. These traditional methods describe the relationship between index factors and soil fertility grade with linear functions. In the evaluation process, the weight distribution is easily affected by the data noise of an individual index, and there is a certain subjectivity in the classification process of fertility grade, which leads to great uncertainty (i.e., fuzziness and randomness) of the evaluation result.
In view of this, we have attempted to introduce an artificial intelligence cloud model that can dialectically describe the fuzziness and randomness in an attempt to solve the bias results caused by uncertainties. Firstly, we use the cloud model to synthetically evaluate the individual index soil fertility and comprehensive soil fertility of Chinese fir plantations. Then, the accuracy of the model is evaluated with the Namerow integrated index method, and the results are compared with previous studies. Finally, we conclude and hope that this will help scientists and forest managers to obtain more objective and accurate results from soil fertility evaluation by providing a novel method and new ideas for the comprehensive evaluation of soil fertility.
2. Materials and Methods
2.1. Data Collection
We searched for published peer-reviewed journal articles which determined the soil nutrients in Chinese fir plantation ecosystems using ISI—Web of Science and China National Knowledge Infrastructure (CNKI). The criteria for literature screening were as follows: (1) The subject was Chinese fir plantations; (2) the experiment was a field investigation; (3) for the long-term test of the results of different years, the final year data were selected; and (4) all data were extracted from the text, tables, charts, and appendices. In cases where data were presented graphically, Engauge software 4.1 was used to extract digital data. After screening, 65 valid documents were obtained, and eight variables were extracted, including the soil pH, soil organic matter (OM), total nitrogen (TN), total phosphorus (TP), total potassium (TK), available nitrogen (AN), available phosphorus (AP), and available potassium (AK), resulting in a total of 1512 observations. These data were distributed across 21 experimental forest farms (sites) in the six provinces (autonomous regions and municipalities) of Guangdong, Guangxi, Hunan, Jiangxi, Zhejiang, and Fujian (
Figure 1), covering three soil types. The basic situation of Chinese fir plantations is shown in
Supplementary Table S1.
2.2. Cloud Definition of the Cloud Model
The cloud model is an uncertain transformation model proposed by Li Deyi in 1995, which can combine a qualitative language value description with a scientific quantitative calculation and can reflect the randomness and fuzziness of the language concept, so it is an effective tool for realizing qualitative and quantitative conversion [
16,
17]. The definition of cloud is as follows: Let
U be a quantitative domain expressed by exact numerical values, where
C is a qualitative concept of
U. If the quantitative value is a random realization of qualitative concept
C, the degree of certainty of
x to
C is
μ (
x) ∈ [0, 1], which is a random number with a stable tendency. Then, the distribution of
x on the domain
U is called the cloud, and each
x is called a cloud drop.
2.3. Cloud Generator of the Cloud Model
Forward cloud generator algorithm (
Figure 2) [
18]: The normal cloud generator represents the uncertainty models between a qualitative linguistic description concept and quantitative data; it maps both qualitative and quantitative relationships and is characterized by being forward and direct. The algorithm of a normal cloud generator is composed of a qualitative concept expectation value (
Ex), entropy (
En), hyperentropy (
He), and a given number of clouding droplets (N). Output: the quantitative position of N droplets in the number space and the certainty of the qualitative concepts represented by the droplets.
The specific algorithms are as follows:
A normal random number
is generated with
as the expectation and
as the variance.
Here, , denotes the upper boundary value of the index corresponding to class , and denotes the lower boundary value of the index corresponding to class .
The normal random number x is generated with Ex as expectation and as variance.
The degree of certainty
is calculated using the specific input value
x and the expected value
Ex:
By means of (x, y), it is possible to fully reflect all the content of the conversion between qualitative and quantitative.
Repeat steps (1) to (4) above to generate N (N = 2000) cloud droplets.
Reverse cloud-generator algorithm [
19]: The reverse cloud generator is a qualitative concept that can transform a certain number of accurate data into a number of features (
Ex,
En,
He). There are two basic algorithms for the reverse normal cloud generator. One uses the degree of certainty information, and the other uses the degree information without certainty. In practical applications, only a set of numerical values can be given to represent a precise concept. However, the certainty
μ value representing this concept is not given and is difficult to obtain. Therefore, the inverse normal cloud algorithm with uncertain information is used to calculate the three parameters of the reduction cloud of the measured data.
The specific algorithms are as follows:
Input: sample point xi, where i = 1, 2, …, n.
Output: Numerical features reflecting qualitative concepts (Ex, En, He).
Calculate the sample average (
) of this set of data based on
xi with the first-order sample absolute center distance
and sample variance
, where
Ex,
En, and
He are calculated as Formulas (4)–(6), respectively.
2.4. Index Selection and Standard Determination
The main area of Chinese fir production in southern China was taken as the research area, and the evaluation system was constructed of nutrient elements which have a great influence on the growth process of Chinese fir. The soil pH, OM, TN, TP, TK, AN, AP, and AK were selected as evaluation indexes and their weight was determined by the PCA method conducted using SPSS 18.0. A comprehensive evaluation model of soil fertility was established based on PCA and the cloud model.
The demand for different nutrients of Chinese fir is not completely consistent, so the contribution value of each evaluation index to the growth of Chinese fir is different; that is, the weight of each index in the comprehensive evaluation of soil fertility is different. Methods of weight determination include the analytic hierarchy process (AHP) [
20], entropy weight method [
21], and correlation coefficient method [
22] amongst others. The PCA method is selected to determine the weight [
23], and the contribution rate of the variance in each common factor of the sum of the common factor variance is calculated by SPSS as the weight of the individual evaluation index.
2.5. Comprehensive Cloud Model Construction
The eigenvalues and weights of individual index cloud models were calculated by using the comprehensive cloud algorithm with virtual cloud theory [
24], such as in Formula (7)–(9), and the soil nutrient comprehensive cloud model and its numerical eigenvalues were obtained.
2.6. Evaluation Set Determination
In order to eliminate the influence of the dimension of the evaluation factors, the data were first normalized and the comprehensive evaluation cloud model of soil fertility was then obtained by using the comprehensive cloud algorithm. According to the principle of the forward cloud generator, the cloud model is expressed by using the numerical characteristics Ex, En, and He of the cloud model to express the index evaluation set V {v1, v2, v3} = {low, medium, and high}, of the cloud model, which constitutes a comment and expresses SC (Ex, En, and He).
2.7. Model Verification
In order to ensure the effectiveness of the cloud model, we used an integrated index method based on the Namerow method to test the results of this study. First, soil fertility was graded using the Namerow method. Then, the expectation value calculated by the cloud model was converted into an individual fertility index and the comprehensive fertility index, which were graded according to the same criteria. Finally, the grading results of the two methods were compared. The specific method of the Namerow method is as follows:
Individual soil fertility index: The evaluation of the individual attribute index of soil fertility is calculated as Formula (10).
Here,
Pi is the individual fertility index of soil nutrient index
i, and the level of
Pi directly reflects the richness of this index. The higher the value, the richer the index in terms of soil.
Ci is the measured data of index
i in soil, and
Si is the evaluation standard value of index n in soil (
Table 1 and
Table 2).
- 2.
Comprehensive soil fertility index: The evaluation of comprehensive soil fertility is calculated as Formula (11).
Here, Pc is the comprehensive soil fertility index; Pave is the mean value of the individual soil fertility index (Pi), and when the individual fertility index Pi > 3, the comprehensive soil fertility index is calculated with Pi = 3; Pmin is the minimum of all indexes of the individual soil fertility index, and when the individual fertility index Pi > 3, the fertility index is calculated as Pi = 3; and n is the number of soil fertility indexes involved in the evaluation.
- 3.
Soil fertility classification: In order to maintain the fairness of the evaluation results, the division of soil fertility grade is consistent with the division of the cloud model. The detailed soil fertility grading is shown in
Section 3.3.
3. Results
3.1. Evaluation Index System of Soil Fertility
Let the evaluation factor set be A = {a
1, a
2, a
3, a
4, a
5, a
6, a
7, a
8}. The classification of evaluation grade refers to the criteria of soil nutrient classification for the second national soil census (NSC) in China [
25].
Table 3 and
Table 4 are the specific evaluation criteria for each index. According to the reverse cloud model algorithm, the cloud eigenvalues of each index are obtained by inputting the measured data from the sampling points of each index, and the cloud map of each index is then obtained by using the forward cloud model.
3.2. Weight Determination
Let the weight factor set W {W
1, W
2, W
3, W
4, W
5, W
6, W
7, W
8} = {0.14, 0.15, 0.14, 0.13, 0.10, 0.13, 0.13, 0.08}, whose value indicates the contribution of the fertility index to soil fertility (
Table 5).
3.3. Evaluation Set
Referring to the criteria for the classification of forest soil fertility in southern China, the corresponding values of evaluation set V are [0, 0.9], [0.9, 1.7], and [1.7, ∞]. The corresponding cloud model is (0.45, 0.38, 0.1) |x ≤ , (1.30, 0.34, 0.1), and (0.45, 0.38, 0.1) |x ≥ ). According to the actual situation and the result of comprehensive cloud expectation values (the center value of soil fertility grade), the soil fertility grade in Chinese fir plantations was divided into four grades: I, low (<0.45); II, medium (0.45–1.4); III, relatively high (1.4–2.1); IV, high (>2.1).
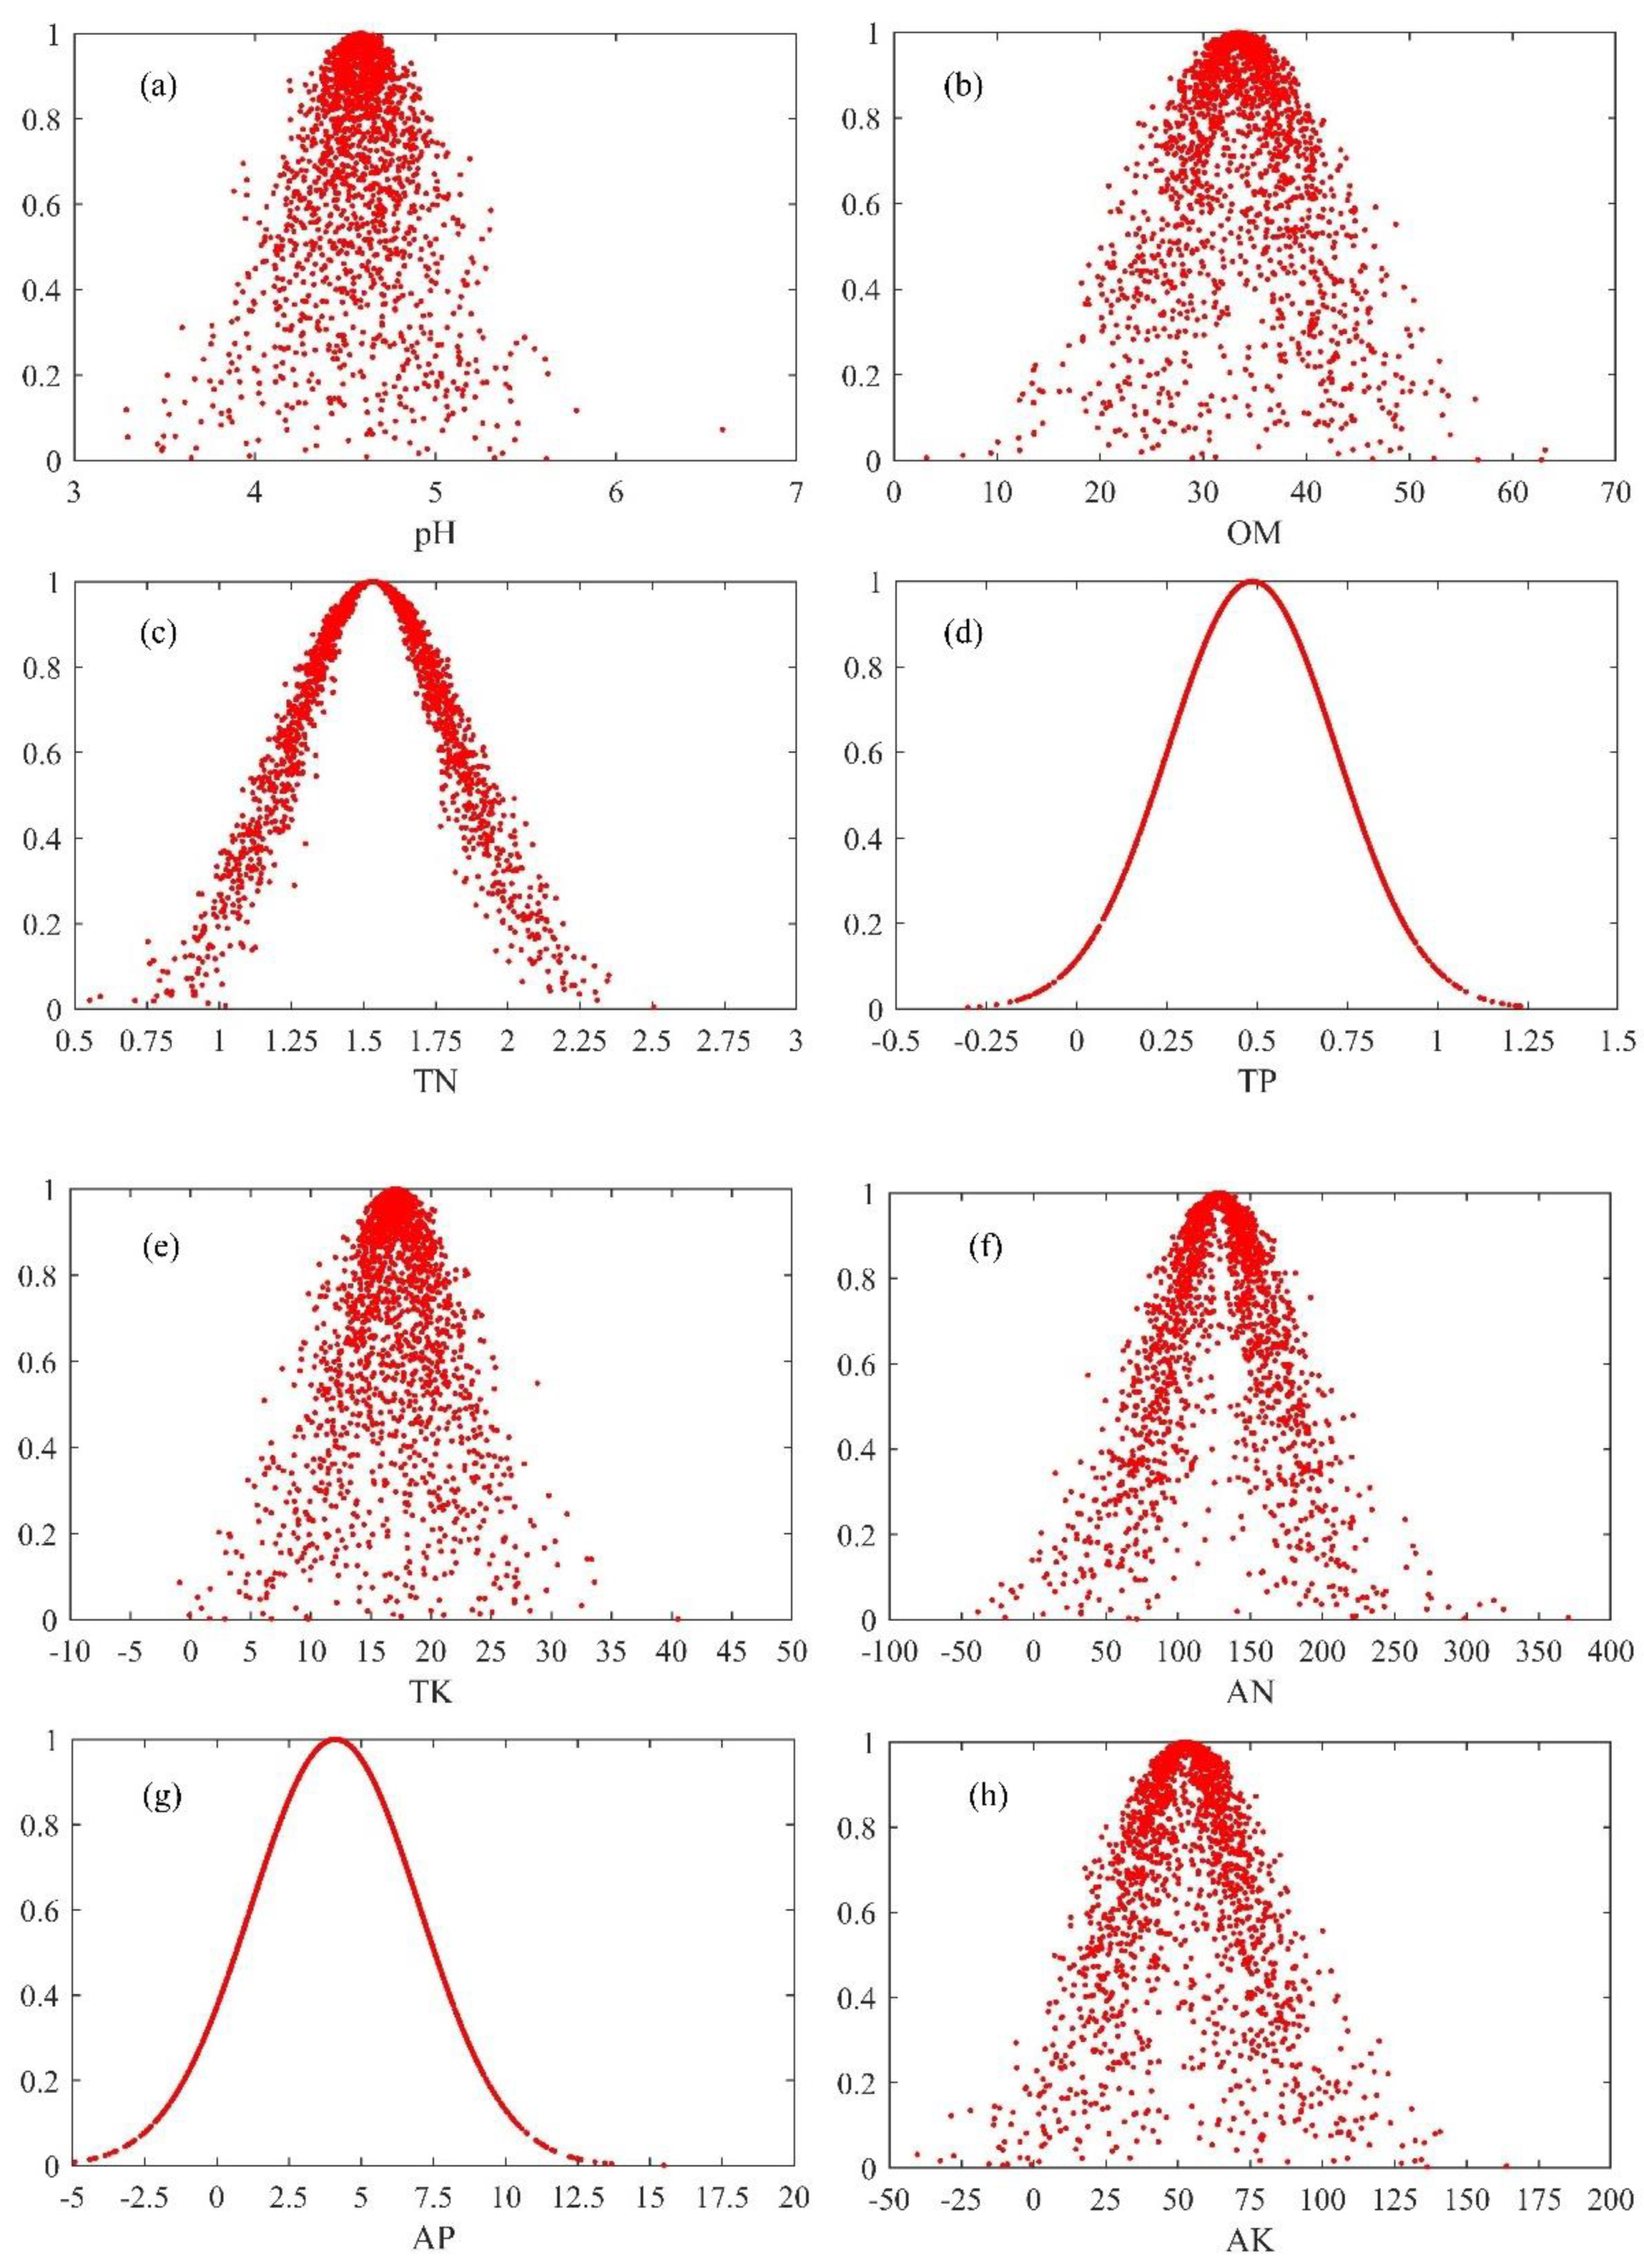
3.4. Individual Index Cloud
The cloud model for each index (
Figure 3) and its numerical characteristics (
Table 6) were obtained using the reverse and forward cloud algorithms. The expected value of the cloud model represents the central value of the evaluation value of each index. The expected value of pH was 4.59, and the value for most cloud droplets lay between 4.5 and 5.0, which indicates that the soil in the main producing area of Chinese fir plantations is strongly acidic. The expected value of OM was 33.40, and the cloud droplets were mainly concentrated in the range of 30 to 40, indicating that the content of OM is rich. The expected value of TN was 1.53, and the cloud droplets were mainly concentrated in the range of 1.25 to 1.75, indicating that the TN content is moderately rich. The expected value of TP was 0.49. The cloud droplet distribution was uniform, and the cloud was linear, which indicate that the TP content is poor and the dispersion degree of cloud droplets is small. The expected value of TK was 17.10. The values for cloud droplets were mainly distributed in the range of 15 to 20, indicating that the TK content is medium. The expected value of AN was 128.30. The values for cloud droplets were mainly concentrated from 100 to 150, indicating that the AN content is rich. The expected value of AP was 4.10, the cloud droplet distribution was uniform, and the cloud was linear, indicating that the AP content is very poor and the cloud droplet dispersion degree is small. The expected value of AK was 52.73, and the values for cloud droplets were mainly concentrated in the range of 50 to 100, indicating that the AK content is poor.
En indicates the possible value range of the evaluation value. The larger the value, the larger the range of change of corresponding indexes. The entropy value of each index is in the order AN > AK > OM > TK > AP > TN > TP > pH. The degree of certainty reflected by He indicates the degree of dispersion of cloud droplets, and the greater the value, the greater the spatial variability and instability of the index. The order of hyperentropy is AN > AK > OM > TK > pH > TN > TP = AP. The larger the hyperentropy, the greater the influence of human factors is, and the greater the instability. The hyperentropy value of AN is the largest, which is 5.48% higher than that of AK.
In summary, the soil in the main producing area of Chinese fir plantations is strongly acidic, with a small range of change and high stability. The OM content is rich with a large range of variation, and the spatial variability is strong and unstable. The TN content is moderately rich and stable. The content of TP is poor but very stable with a small range of change. The content of TK is medium and stable. The content of AN is rich, the range of variation is wide, and the spatial variability is strong. The content of AP is very poor but very stable with a small range of values. The AK content is poor, and the spatial variability is strong and unstable.
3.5. Comprehensive Cloud
According to the Formulas (7)–(9), a comprehensive cloud
C (0.653, 0.976, and 0.040) of soil fertility of Chinese fir plantations was obtained, and the cloud map is presented in
Figure 4. The central value of the soil fertility comprehensive score of Chinese fir plantations was located at 0.653, the range of cloud change was not large, and most of the cloud droplets were between 0 and 1.5, indicating that the soil fertility of Chinese fir plantations was generally on the low side. The entropy and hyperentropy of the soil fertility comprehensive cloud were smaller (0.976 and 0.040, respectively), which indicated that the soil fertility of Chinese fir plantations changed little, the spatial variability was also very low, and the overall stability was relatively stable. Multiple nutrient factors interact with each other in terms of soil fertility, though there is not a simple linear relationship between soil fertility and various nutrient factors. The integrated cloud model retains the fuzziness and uncertainty in the evaluation process through cloud model eigenvalues. At the same time, the comprehensive cloud map was able to directly obtain the evaluation results of soil fertility.
3.6. Reliability Test
According to the Namerow method calculation results of the individual soil fertility index (
Table 7), the individual fertility index of pH (
Pi = 1.00) is grade II, which is strongly acidic; the individual fertility index of OM is grade IV (
Pi = 1.00), meaning that the individual fertility is high; the individual fertility index of TN (
Pi = 0.80) and AN (
Pi = 81.00) is grade III, which is relatively high; and the individual fertility index of TP (
Pi = 1.05), TK (
Pi = 1.06), AP (
Pi = 1.03), and AK (
Pi = 0.87) is grade II, which is medium. The results of the grading evaluation of the individual fertility index and the comprehensive fertility index after the conversion of the soil fertility expectation value calculated by the cloud model (
Pc = 1.069, grade II) are consistent with the soil fertility grading evaluation results calculated by the Namerow method (
Pc = 1.019, grade II).
4. Discussion
The normal growth and development of plants requires a suitable soil pH environment. A low pH will lead to an increase of exchangeable acid and aluminum in the soil, which can inhibit the absorption, assimilation, and transfer of nitrogen and potassium of plants. Thus, the acidification injury of plants can easily occur [
26,
27,
28]. In this study, we found that the soil pH was very low and the variation was small (
He = 0.19), indicating that the soil of Chinese fir plantations in southern China is generally strongly acidic. In this case, there may be several reasons to explain this finding. First, one of the main reasons is that the growth area of forestland is mainly acidic red soil or red-yellow soil [
29]. Second, the use of chemical fertilizers or acid rain may lead to soil acidification [
30,
31]. In addition, the accumulation of organic acids and phenolic substances from the litter of coniferous trees, such as Chinese fir, is also an important factor in the process of soil acidification [
32].
Soil organic matter is an important part of the forest ecosystem. It can not only provide nutrients needed for plant growth [
33,
34], but also effectively improve the soil structure by making the soil loose [
35,
36], promoting the formation of soil water-stable aggregates [
37] and increasing the capacity of soil water and fertilizer retention [
38]. In this study, we found that the content of soil organic matter in Chinese fir plantation was rich with a high degree of variation (
He = 3.06), indicating that the soil organic matter could be affected by human management factors.
Plants are in great demand for nutrient elements such as nitrogen, phosphorus, and potassium in soils. These nutrients are also important indexes for measuring soil fertility [
39]. We found that the soil nitrogen content in forestland is high and the degree of variation is small (
He = 0.04). In general, the largest source of AN input in forestland could be overused as external nitrogen fertilizer. Therefore, there is no need to apply available nitrogen fertilizer to Chinese fir plantations in the short term. As the phosphorus content in forestland soils is poor, its content is less affected by human fertilization. This is consistent with Zhou’s conclusion that in red soil of southern China, with a low soil pH, the availability of phosphorus decreased significantly [
40,
41]. Therefore, the lack of phosphorus sources may be an important reason for restricting the sustainable management of Chinese fir plantations. We also found that the TK content in the soil is medium compared to the lower AK content. This indicates that the supply of AK is insufficient as a result of fewer sources of potassium in the soil of Chinese fir plantations.
The cloud model has better universality estimations, risk assessment [
42], time series prediction and analysis [
43], and comprehensive evaluation [
44], but it has not yet been applied in soil fertility-related research. The evaluation results from the cloud model in this study are consistent with previous studies and consistent with the reality [
6,
45]. The cloud model used in this study provides a new method of studying soil characteristics. In this study, only soil nutrients were used, although other factors such as soil physical and biological properties could affect the soil fertility. Therefore, this needs to be further improved in future studies.
5. Conclusions
The comprehensive soil fertility of Chinese fir plantations is grade II, which is medium; soil pH is grade II, belonging to strongly acidic soil; individual fertility of soil OM is grade V, rich; TN is grade V, rich; TP is grade III, poor; TK is grade IV, medium; AN is grade V, rich; AP content is grade II, very poor; and individual fertility of soil AK is grade III, poor. The degree of artificial influence of soil nutrients in Chinese fir plantations is as follows: AN > AK > OM > TK > pH > TN > TP = AP.
The soil fertility of Chinese fir plantations was comprehensively evaluated by the cloud model method, and the evaluation results were reliable. Compared with the traditional method, the cloud model can balance the randomness and fuzziness in the evaluation process, and can ensure the accuracy of the results, simplify the calculation process, and improve the calculation efficiency. Overall, this study provides a new method for evaluating soil fertility.

 ,
, 


