1. Introduction
The worldwide growth in online retail sales has resulted in an increase in the number of parcels that need to be delivered to end-consumers and the number of delivery vehicles [
1,
2,
3,
4]. With this, the instances of customers missing home deliveries have also increased [
5,
6]. For example, over 10% of home deliveries by a major courier company operating in New Zealand fail during the first attempt [
7]. This means additional vehicle operation and time costs for logistics service providers (e.g., courier companies) and greater environmental emissions per parcel delivered, because undelivered parcels are required to be redelivered to customers at a later time [
8,
9]. Moreover, the increasing demand of online shoppers for higher levels of service (e.g., same-day/urgent delivery) has affected the operational efficiency of courier companies because delivery vehicles are often not utilised to full capacity while serving such demands [
10]. This often puts considerable pressure on logistics service providers, making it challenging for them to maintain their competitive edge in the market. For example, eBay launched its same-day delivery service, “eBay Now”, at several places in the USA in 2012 and had to shut it down in 2015 due to the service being unprofitable [
11]. It should however be noted that though same-day delivery services are currently being offered, they are usually more expensive than standard deliveries for users and environmentally less sustainable, as opportunities for better load consolidation and optimization of delivery fleet’s capacity are undermined by such deliveries [
12].
Goods’ last-mile travel is considered as the final leg of a supply chain [
13] and, unfortunately, may account for up to 75% of the total cost of transporting goods from one place to another [
14,
15]. However, given the increasing concerns about global warming and climate change, last-mile logistics operations should take into account not only the costs associated with providing high levels of service to consumers, but also the corresponding environmental emissions [
16]. In New Zealand, a huge proportion (90%) of transport emissions is caused by road transport, with 67% being contributed by light vehicles (i.e., cars and other small vehicles) [
17]. This is likely due to the high car availability in New Zealand’s households, which in turn has resulted in the highly car-dependent travel behaviour of New Zealanders [
18]. Hence, there is a need to develop and implement policies (e.g., encouraging consumers’ walking and cycling) that help reduce emissions, particularly from major contributing sectors, such as transport. Therefore, a resource-efficient operation of last-mile deliveries is essential not only to sustain any logistics venture but also to ensure the sustainability of the built environment [
19,
20].
Collection-and-delivery points (CDPs), defined as third-party locations that provide consumers with an opportunity to collect parcels from (or deliver parcels to), have been viewed as a sustainable means of delivering goods bought online in many European countries (e.g., Germany, France, UK, and the Netherlands) [
21,
22] and parts of Latin America (e.g., Brazil) [
23,
24,
25]. Two types of CDPs have been used in practice, namely, service points (i.e., local shops, convenience stores, fuel stations, news agents, etc.) and locker points (i.e., communal locker boxes located at places such as parking lots, bus terminals, etc.). Being manned, service points offer more payment options and give recipients a feeling of security. On the other hand, locker points are automatically operated using digital passwords and are more flexible with respect to the hours of operation [
26,
27]. Both types of CDPs have flourished in the European market, but the concept of CDPs has only recently been introduced in New Zealand, with only a few CDPs established on a trial-basis in the three biggest cities, i.e., Auckland, Wellington, and Christchurch.
Setting up any logistics facility, regardless of whether it is being set up at a facility to be built or at an existing facility, involves using resources. Thus, the selection of facility locations can consequently increase or decrease the fixed and variable costs and improve or impair the performance, in terms of customer satisfaction with the facilities [
28,
29]. Moreover, locations selected on an ad-hoc basis may result in an uneven distribution of facilities with respect to the demand for services in the various parts of a city. For instance, a courier company trialling locker points on an ad-hoc basis in Christchurch has been struggling to get people to use this service. The company is therefore considering changing the location of the existing locker point and is also planning to increase the number of such points [
30].
One of the important measures of effectiveness of any facility system is the proportion of the target population that can be served by facilities situated at the adopted locations. This is a function of the impedance (e.g., distance and/or time) between facilities and population centres because the smaller the distance and/or time, the greater is people’s accessibility to facilities [
31,
32,
33]. Moreover, shorter distances between CDPs and consumer locations are likely to bring environmental benefits as it will encourage consumers to collect their items from CDPs on foot or cycle or car (only if visiting a CDP along with their daily commute), thereby reducing the vehicle kilometres travelled (VKT) and greenhouse gas emissions. This is in line with Kedia et al. [
34], who investigated consumers’ willingness to use a CDP to collect and deliver goods bought online using a Qualitative Content Analysis approach. They studied consumers’ perceptions of CDPs and found “accessibility to CDPs” to be an attribute having a large effect on their choice of using CDPs. Similarly, consumers’ favourable attitude and perceived relative advantage of CDPs directly lead to stronger adoption intention, as per the studies (e.g., Wang et al. [
35] and Yuen et al. [
36]) that investigated consumers’ intention to adopt CDPs using the Diffusion of Innovation theory. In addition to this, there are facility-specific factors (e.g., the capacity of potential facilities and the cost of establishing facilities) and location-specific factors (e.g., the population density around CDP locations and the shopping potential near CDP locations) that influence the selection of locations for siting facilities [
37,
38,
39,
40].
A careful consideration of the above factors is of paramount importance when selecting the locations for CDPs because determining the optimal density and locations for new facilities plays a decisive role in the success of facilities. Optimal density refers to the number of CDPs required to serve the maximum demand (i.e., consumers) that lies within a specified distance from any candidate CDP, such that the total demand-weighted distance (i.e., the total distance consumers will have to travel to CDPs) is minimised and any increase in the number of CDPs beyond the optimal density does not increase the demand coverage.
Location-allocation (LA) modelling is a tool that has long been used for solving facility location problems (FLPs) by finding the optimal density and locations of facilities. An LA model locates a set of sites to be used as facilities and simultaneously allocates the spatially distributed demands to these facilities based on the optimization of one or more attributes, such as distance, time, and cost [
41]. LA modelling has been applied to locate various types of facilities, such as health care units [
42] and manufacturing centres [
43]. However, there are only a few studies [
44,
45,
46] that have determined locations for establishing CDPs, but the majority of them have adopted a service provider–centric approach (i.e., minimizing delivery service provider’s travel distance).
Therefore, this study is aimed at identifying the optimal density and locations for establishing CDPs, using a consumer-centric approach (i.e., minimizing consumers’ distance to CDPs) and using Christchurch, the largest city in the South Island and the third-largest in New Zealand, as a case study. The city is spread over an area of 603 km
2 and inhabited by 341,000 people [
47,
48]. Given that receiving parcels via CDPs is a new concept for New Zealanders, and that service point CDPs can be established using the existing facilities (e.g., local shops) without having to build a new infrastructure (e.g., acquiring space at public properties), this study focusses on the service point CDPs (e.g., dairies and supermarkets). The study outcomes are expected to help inform decisions made by courier companies as well as by local government bodies that plan for the city’s transport infrastructure.
The rest of the paper is structured as follows.
Section 2 describes the theoretical background of FLPs and their application in last-mile logistics. Mathematical formulation of the adopted FLP is detailed in
Section 3. Data collection from consumers and secondary sources, descriptive analysis and LA model parameters are described in
Section 4.
Section 5 explains the working of the LA model, while the results of the LA analyses are discussed in
Section 6. Conclusions and directions for future research are presented in
Section 7.
2. Facility Location Problems (FLPs) and Application in Last-mile Logistics
FLPs involve solving mathematical formulations that are aimed at locating facilities in a given space. As the identification of locations for establishing CDPs is a discrete space location problem, only this type of problem has been discussed in the paper. Discrete location problems are classified by Daskin [
49] into three categories, namely, median-based problems, covering-based problems and other problems (e.g.,
p-dispersion problems). However, as consumers’ use of CDPs is likely to be governed by their accessibility to CDPs [
38], it is important to locate them close to consumers’ locations. Since the p-median problem is based on the principle of minimizing the demand-weighted average distance to facilities [
31,
50], this study adopted a p-median problem (with a service distance constraint) to determine the optimal density of CDPs and therefore, only this method is discussed in the paper. However, detailed reviews of other types of FLPs can be found in review articles [
37,
51,
52].
There have been several FLP studies [
53,
54] done in the recent years, however, they were focussed on identifying locations mainly for establishing urban consolidation centres (UCCs). Note that although CDPs are also a form of UCCs (in terms of the function to store and consolidate parcels near the consumption areas), the way last-mile deliveries take place via CDPs is different than the way they are done via UCCs [
55]. Unlike UCCs, where parcels are delivered to consumers by a service provider, CDPs require parcels to be picked up by consumers, thereby requiring consumers to travel to CDPs. Therefore, the identification of locations for establishing facilities that require consumers to visit them, must be done based on the minimisation of consumers’ distances or costs of travelling to and from those facilities. However, the existing studies [
53] were typically done from the service providers’ perspective (i.e., maximizing the profit or minimizing delivery costs). For example, Orjuela-Castro et al. [
56], using a mixed linear programming model, investigated UCCs for distributing perishable food items in Colombia. The algorithm used was aimed at minimizing the sum of the fixed costs and transport costs between each of the demand nodes and UCC locations. Other studies [
57,
58,
59,
60] determined the optimal configurations of UCCs as a part of vehicle routing problem where optimal vehicle fleet and delivery routes were identified sequentially using the optimal locations of UCCs, with a view to minimizing service providers’ costs.
Likewise, taking a service-provider-centric approach, Deutsch and Golany [
61] adopted an un-capacitated FLP to design a parcel locker network, by determining the optimal number, locations, and sizes of parcel lockers (i.e., locker point CDPs) that can be shared and used by multiple e-commerce companies in Toronto, Canada. The objective function was aimed at maximising the total profit, consisting of the revenue from customers who use the service, minus the facilities’ fixed and operational costs, the discounts in the delivery costs for customers who need to travel to collect their parcels, and the loss of potential customers who are not willing to travel for service. Based on a heuristic approach, Veenstra et al. [
45] studied a combined “facility location and vehicle routing” problem. The study was aimed at determining suitable locations for installing lockers in the Netherlands to enable people to receive medication from local pharmacies and for generating optimal routes to the selected locker locations while minimizing the routing cost and the cost for opening lockers.
Currently, there are only a few studies that consider locating CDPs (or other collection/distribution facilities) from the point of view of consumers (i.e., taking a consumer-centric approach), who need to collect parcels from (or deliver parcels to) CDPs or collection/distribution centres. For example, Wu et al. [
44] adopted a heuristic approach to locating parcel collection points in Singapore. They used both the distribution of potential customers and public transport ridership records to identify “people crowding patterns” at public places during the various times of a day. Places near crowds of people were assumed to be more convenient for establishing parcel collection centres than distantly located places. Since a large proportion (78%) of workers in Singapore travel by public transport, it seems reasonable to identify CDP locations based on public transport ridership patterns. However, in a city where the public transport share is low, such as Christchurch, with only 2% [
62], it will not be sensible to attempt CDP location selection based on public transport data. Similarly, taking a consumer-centric approach to LA modelling, Alvarado and Liu [
46] identified country-wide locations for providing the parcel self-collection service (via service point CDPs) at the outlets of a department store chain in the US. They formulated a binary integer programming function aimed at maximising savings, in terms of the transport cost for consumers and service providers, along with a reduction in the CO
2 emissions.
Therefore, along the lines of the above few studies, this study adopted a consumer-centric approach to identifying an optimal configuration of locations for establishing CDPs. Additionally, this study compared the suitability of five types of businesses (e.g., dairies and supermarkets) being used as CDPs, from the consumer perspective. This study also employed centroids of small area units (i.e., mesh blocks) as demand locations, enabling a more detailed and precise LA analysis compared to the analyses carried out using the centroids of large area units (i.e., postal code areas) in previous studies. For example, Alvarado and Liu [
46] used the centroids of postal code areas as the locations of demand points, which in turn were used to calculate the distances between the candidate sites and consumer locations. Moreover, the larger the size of an area, the less the likelihood of people being near the centroid of that area and the greater the likelihood of people being near the centroid of an adjacent area. This might result in the allocation of demand points to a CDP other than the CDP nearest to them, thereby affecting the output in terms of the optimal number and locations of CDPs. Furthermore, the ‘even’ distribution of people in an area becomes more important with large area unit size because, when the area unit is large and people are not evenly distributed, a study will have less reliable results. It should, however, be noted that the above problems of people not being allocated to the nearest CDP and not being evenly distributed also exist with the mesh block area units, but to a smaller extent than with the postal code area units.
3. Problem Formulation: Modified P-Median Problem
In the p-median problem,
sites (the maximum number of CDPs that can be placed considering resource constraints) are selected as CDP locations, such that the average distance (or time) travelled by consumers from their origins (i.e., demand points) to their nearest CDP, or the total demand-weighted transport distance, is minimised [
50]. This approach considers all candidate sites equivalent in terms of the setup cost for locating a new facility [
63]. However, it should be noted that there is no cost function considered in the problem formulation used in this study. Instead, the problem accounts for both demand (e.g., population) and the actual distances. This type of Mini-Sum model often embraces location problems of private companies, where cost minimization and profit maximization are the prime objectives. Note that the classic p-median problem does not consider any restriction on maximum distance that consumers will have to travel to reach their nearest CDP. Thus, to keep consumers from traveling long distances to reach their nearest CDPs, the classic p-median problem was modified by adding a service distance constraint (i.e.,
) as done by Toregas et al. [
64] and Khumawala [
65]. The mathematical formulation of the modified p-median problem is as follows.
Equation (1) is the objective function that minimizes the total demand-weighted distance between demand points (i.e., consumers) and their closest CDPs. Equation (2) restricts the number (
) of CDPs that can be located. Equation (3) ensures that each demand point must be allocated to exactly one CDP that is lying within the cut-off distance (
). Equation (4) ensures that demand points are allocated only to sites where CDPs are located and that the capacity at each of the CDPs is not exceeded.
where,
is demand (i.e., number of consumers/people) at point
is the shortest distance (over the network and not the Euclidean distance) between demand point and candidate site ;
if demand point is assigned to a CDP located at point , and 0 otherwise);
signifies a set of demand points/nodes (); and signifies a set of facility sites ();
is maximum number of CDPs that can be located;
if a CDP is located at candidate site , and 0 otherwise; and
is the capacity at candidate site .
If all facilities have unlimited capacities (as assumed in this study), Equation (4) becomes Equation (4a). Additionally, Equation (5) states that a binary coverage is assumed, i.e., a demand point is served if it is located within a distance cut-off () from a CDP, and not served otherwise.
Equation (6) defines the eligible facility sites, and states that only facility sites lying within the distance cut-off, can service demand point
.
where
is the distance cut-off (over the network), outside which distance from a CDP, no demand points can be served.
4. Consumers’ Characteristics and Model Parameters
An online survey of a market research company’s panel members was conducted in May and June 2018. To be eligible to participate in the survey, respondents had to be at least 18 years old, had to reside in Christchurch, and must have bought online in the 12 months prior to completing the survey. The questionnaire included questions related to consumers’ online and in-store shopping, perceptions of characteristics of last-mile deliveries, their preferences for five types of service points locations to be used as CDPs, their frequency of visiting those locations, and their socio-demographic characteristics. All the online shopping related questions were to be answered regarding products that cannot be delivered via the internet (i.e., travel tickets and hotel bookings were excluded). The flow of questions was programmed such that only relevant questions appeared to each respondent based on their initial responses, to achieve a balance between the information being sought and the burden on respondents [
66]. A total of 518 responses were obtained, but only 355 of them were fully completed and, thus, were used for the analysis.
Table 1 compares the sample and the population of Christchurch. The sample was found to represent the population satisfactorily.
Apart from consumers’ data, three types of inputs are typically required in LA modelling; the location of facilities having a potential to serve as CDPs, the spatially distributed demand (often concentrated at the centroids of areas), and a measure of distance between facility and demand locations, such as network distance or travel time. These data types are described in detail in the following sub-sections.
4.1. Demand Points’ Locations
Demand points are sources of demand (e.g., consumers) that are served by facilities to be located using LA modelling. Factors such as population density, shopping potential of neighbourhoods, and socio-demographic characteristics have been reported as governing the service providers’ choice of location for CDPs [
40,
67]. Thus, the socio-demographic characteristics of people residing in the 2931 mesh blocks that constituted the study area were obtained. A mesh block is “the smallest geographic unit, varying in size from part of a city block to large areas of rural land, for which statistical data is collected and processed in New Zealand” [
68]. Mesh blocks constituting the inner areas of the city are smaller in size and densely populated, while those in the outer areas are bigger and less densely populated. The geometric centroid of each of these mesh blocks was computed, which points were assumed to represent the population residing in the respective mesh blocks and thus were adopted as demand points for the LA analyses.
4.2. Candidate Facilities’ Locations
In many European countries (e.g., Belgium, France, Germany, and the Netherlands), CDPs have been established mainly at local shops, such as convenience stores, petrol stations, pharmacies, and post shops. These places have been reported as serving consumers in an efficient manner [
22,
34]. However, there is apparently no study available that provides a comparison of the above-mentioned types of businesses with respect to their performance as CDPs.
In New Zealand, post shops have been in use for handling failed home deliveries, and only recently, they were made available to be used as CDPs (i.e., to receive first-hand deliveries). Since post shops are businesses related to sending and receiving items, the nature of their business can be said to be similar to that of courier companies, and thus, in this study, they are called traditional CDPs. On the other hand, businesses such as supermarkets and petrol stations, which have only recently been introduced as locations for CDPs, are referred to as non-traditional CDPs. In this study, four types of businesses—namely, supermarkets, petrol stations, dairies, and pharmacies—were considered as potential non-traditional CDP locations. The spatial distribution and operating hours of businesses considered as potential CDP locations (both non-traditional and traditional) are discussed below. Consumer shopping patterns, in terms of consumers’ frequency of visiting potential CDP locations, consumers’ preferences for using these businesses as CDPs (to collect or deliver small parcels on foot or on cycle), their perceptions of travel related to using CDPs, and the distances they are willing to walk or cycle to CDPs, are also discussed in the following sections.
4.2.1. Spatial Distribution of Potential CDP Locations
Due to the damage to buildings and roads in the CBD caused by the Canterbury earthquakes in 2010 and 2011, a large number of businesses moved to suburban areas [
69,
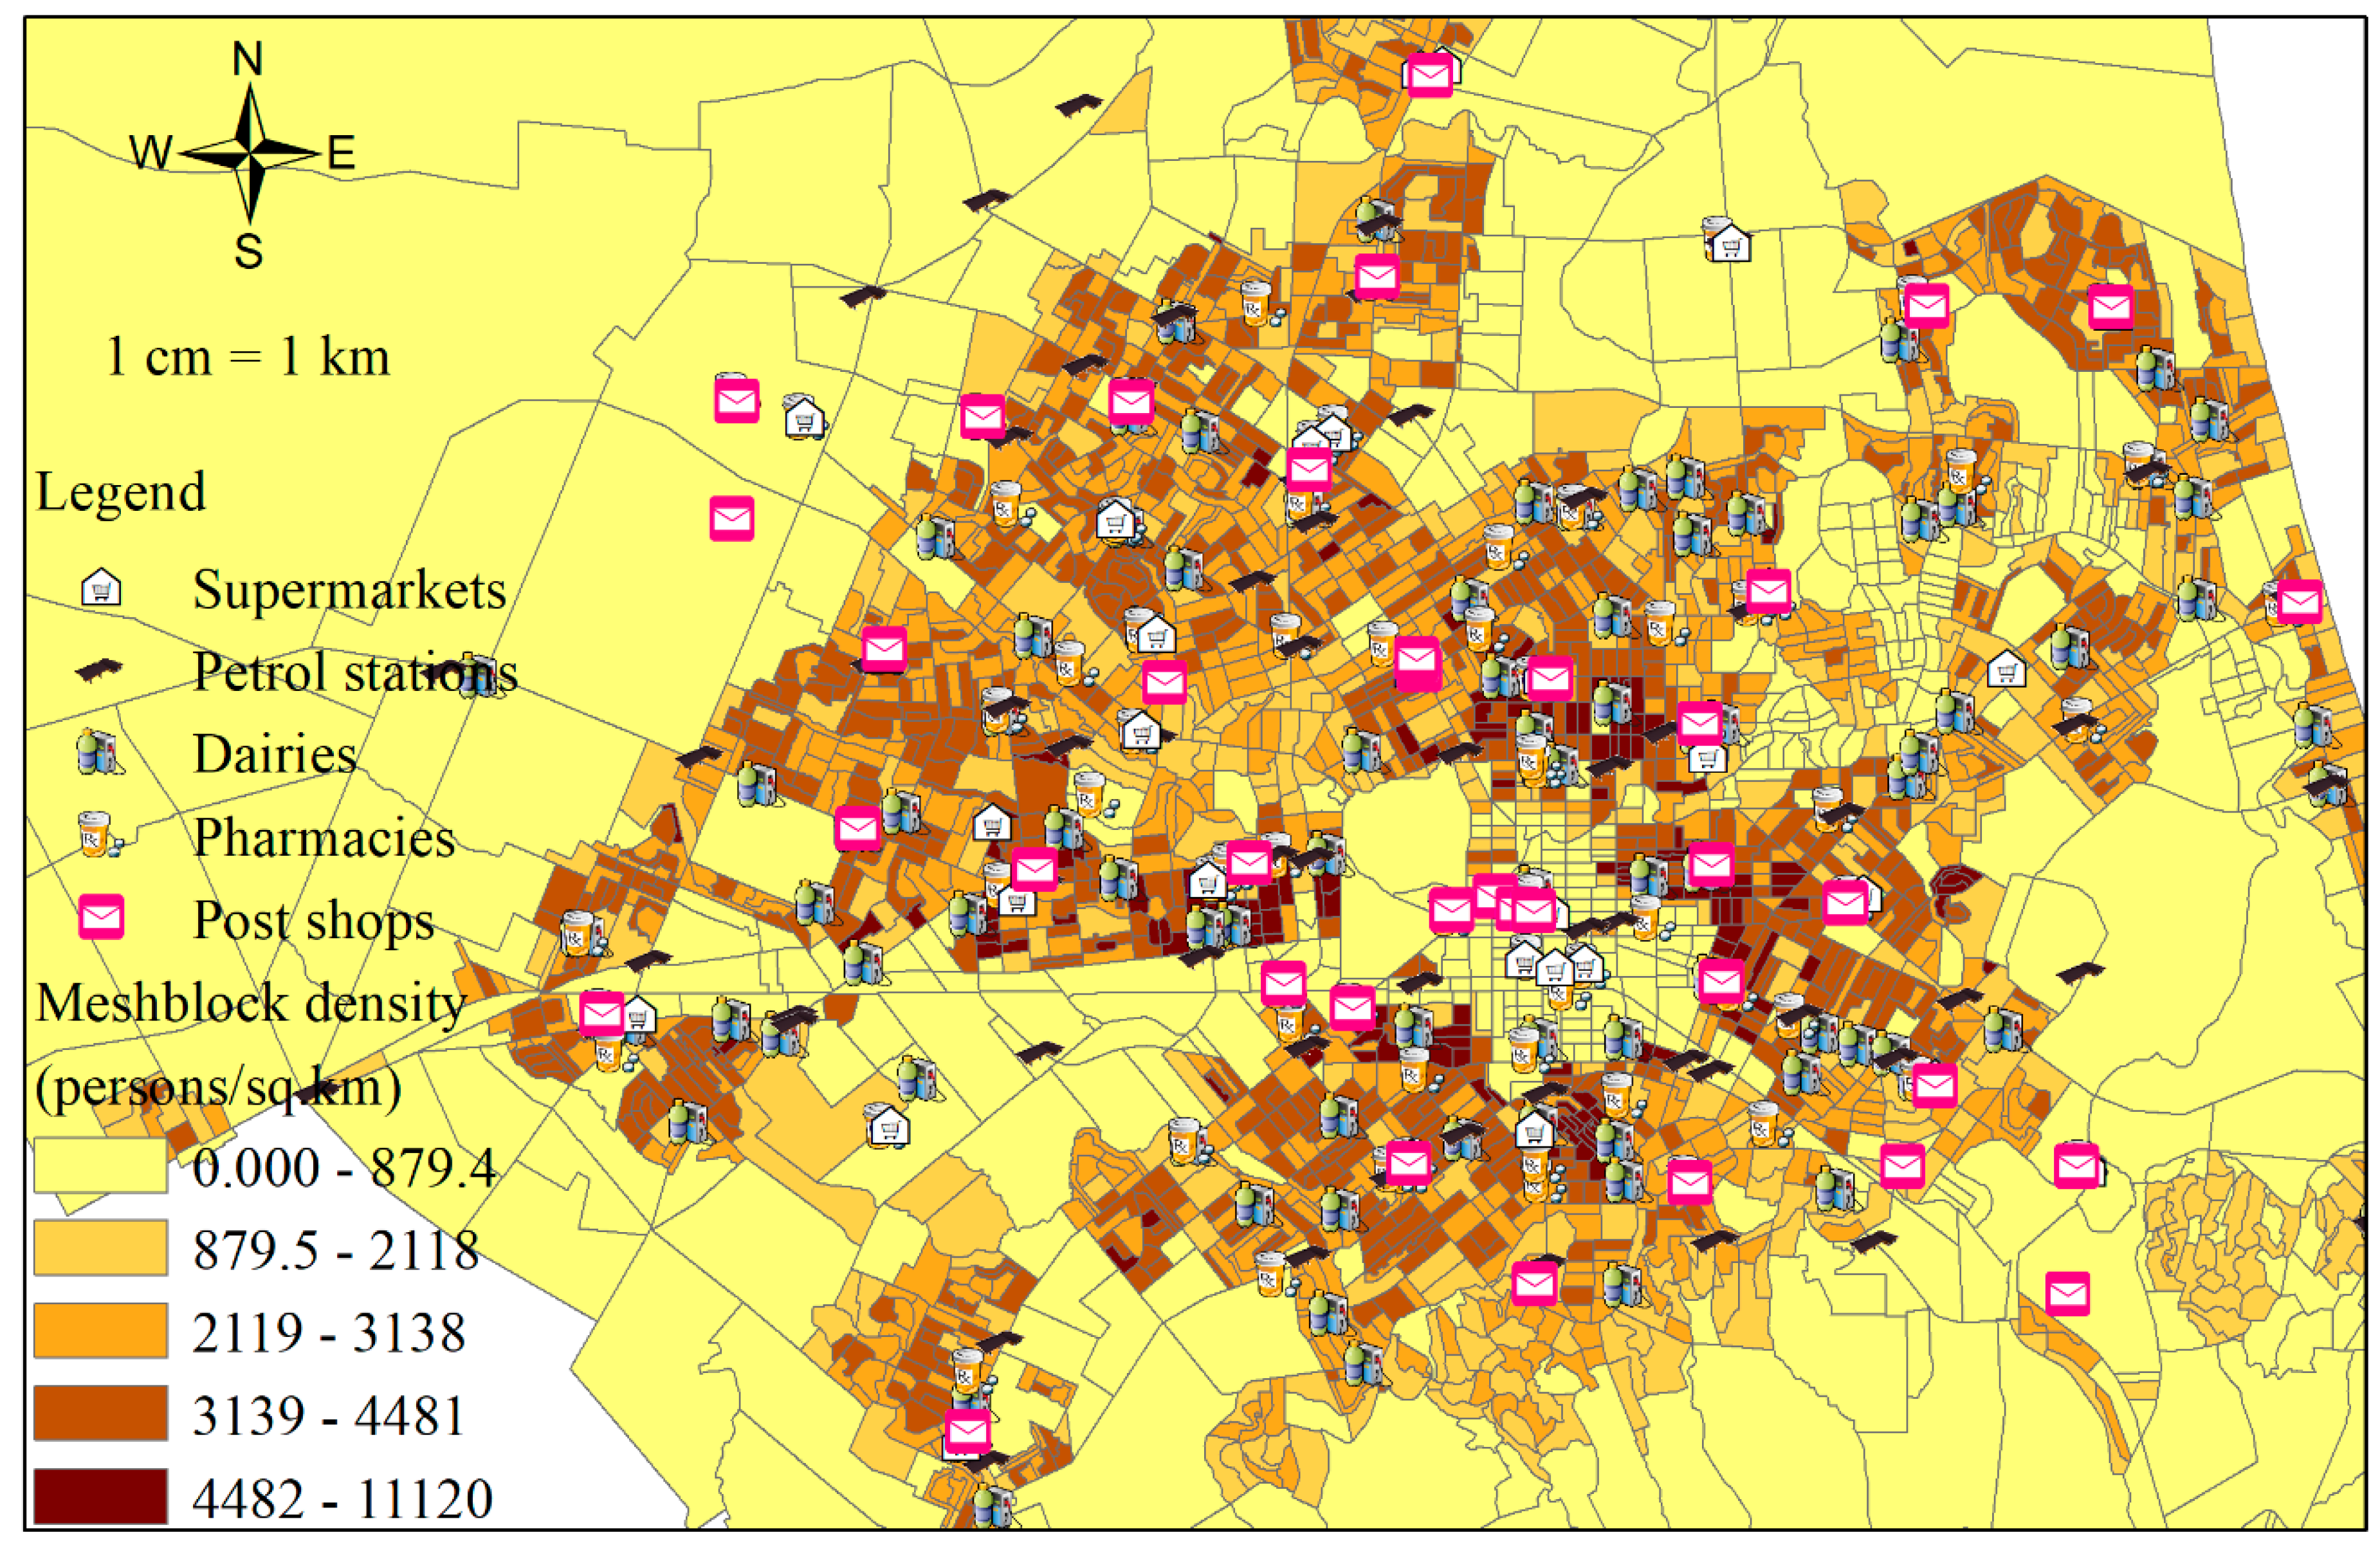
70]. This has led to a city-wide distribution of potential locations for CDPs, as shown in
Figure 1. There were 58 post shops operating in the city, including 22 post offices, 20 pharmacies and 16 other agent shops, such as bookstores and convenience stores that provide numerous postal services (see
Table 2). However, leaving those 20 pharmacies aside, the rest of the 38 post shops (of which 11 were traditional businesses serving as CDPs) were considered as potential locations for establishing traditional CDPs. A total of 39 supermarkets, 64 petrol stations, 92 dairies, and 83 pharmacies (including those 20 pharmacies that currently provide postal services) operating in the city were considered as potential locations for establishing non-traditional CDPs (see
Figure 1). It should be noted that pharmacies that provide postal services were not considered as post shops and were counted only as pharmacies for the analysis.
Information about the potential locations (e.g., geographical coordinates and operating hours) was obtained from various sources, such as websites of business firms and search engines. In this study, to simplify the analysis and due to a lack of information, it was assumed that there is no consumer bias toward any particular shop (e.g., all dairies, say, are equally attractive), with respect to possible influencing factors, such as neighbourhood type and size of a facility, i.e., the weightings were set to one for all candidate facilities.
4.2.2. Operating Hours of Potential CDP Locations
A consumer’s choice of CDPs to collect (or deliver) parcels is expected to depend on the operating hours of host businesses serving as CDPs [
26,
34]. Among the non-traditional CDP locations, dairies, petrol stations and supermarkets each operate for far more hours per day than post shops (i.e., traditional CDPs), and pharmacies operate for similar hours as post shops, on both weekdays and weekends (see
Table 2).
Since pharmacies’ and post shops’ mean operating hours (i.e., from 9 am to 5 pm) are far less than at the other facility types considered, it will restrict consumers wishing to collect parcels outside the 9am–5pm period. Thus, consumers’ perceptions of ‘fewer operating hours’ being a hindrance to collecting parcels from (or delivering parcels to) pharmacies and post shops, were obtained in terms of ratings to a statement, “Operating hours of post shops and pharmacies are not sufficient enough to facilitate collection of parcels”, on a five-point Likert scale (i.e., Strongly disagree–Strongly agree). Over 43% respondents agreed that post shops’ and pharmacies’ fewer operating hours limit their ability to facilitate consumers using them as CDPs. Only 27% of respondents disagreed (to a varying degree) with the statement, with the rest of the respondents having a neutral view.
4.2.3. Consumers’ Frequency of Visiting Potential CDP Locations
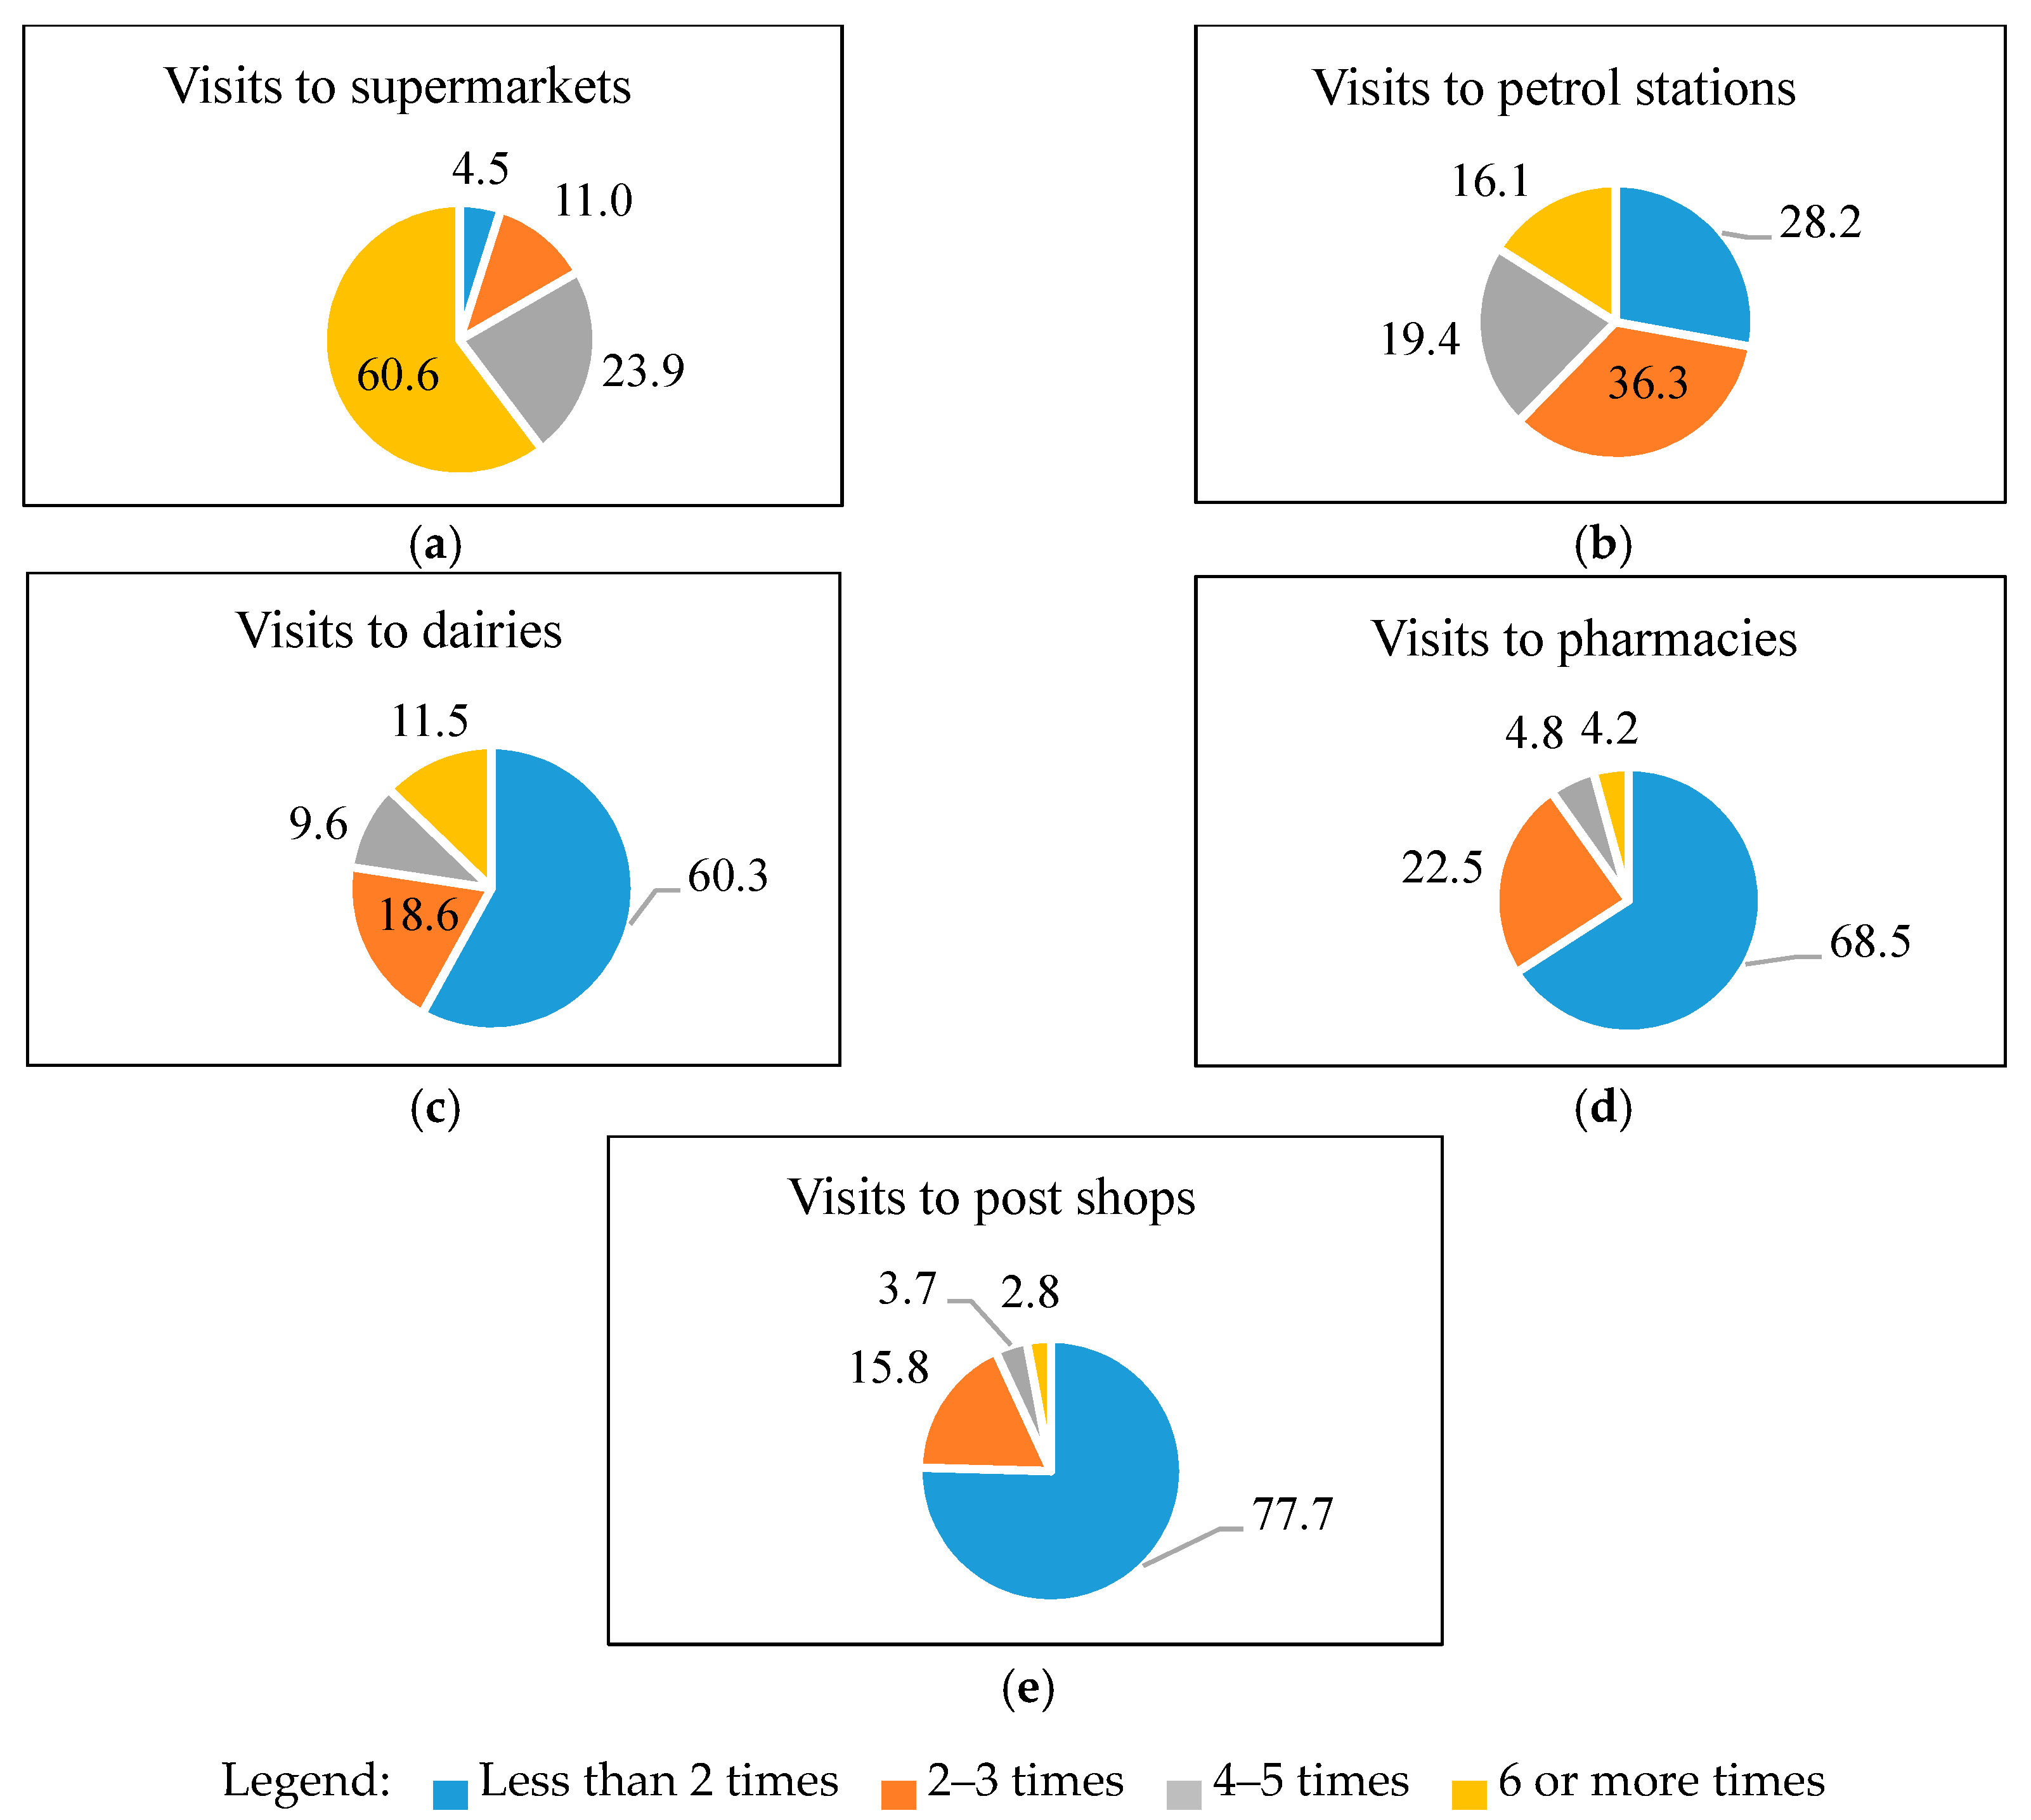
Consumers’ frequency of visiting potential CDP locations during the month prior to the survey were obtained and are shown below in
Figure 2. It can be observed that supermarkets were most frequently visited (i.e., over 60% people visiting them six or more times a month), followed by petrol stations and dairies. On the other hand, post shops were least frequently visited (i.e., over 77% people visiting them less than two times a month), followed by pharmacies. Consumers’ high frequency of visiting supermarkets can be attributed to the fact that supermarkets fulfil people’s needs in terms of groceries, and people need to visit them frequently to replenish perishable items [
71].
As the car availability in New Zealand’s households is high (i.e., 0.77 cars per capita), New Zealanders’ travel is highly car dependent [
18]. In addition, 84% of the time spent travelling for shopping purposes, and 80% of time spent travelling for work purposes, were spent in cars as a driver or a passenger during 2010–2014 [
62]. The electric-vehicle share among total vehicles in New Zealand is less than 1% [
72], and consumers’ high frequency of visiting petrol stations (i.e., around 37% people visiting them four or more times a month) can be ascribed mainly to their high demand for fuel, caused by their car-dependent travel behaviour. Also, the convenience stores located at petrol stations might have attracted some trips to these locations.
Dairies in New Zealand are densely located small-scale businesses that sell items such as food, tobacco, and newspapers. Such businesses are mainly located near residential areas and sell items usually at prices higher than at large-scale businesses, such as supermarkets. Dairies have been observed to be used mainly for unplanned and fill-in shopping [
73].
Post shops in New Zealand have been offering banking services, in addition to postal services, since 2002 [
74]. However, it is likely that post shops were visited least frequently (i.e., over 75% people visiting them less than two times a month) due to the specialized nature of their business and the decline in the usage of postal services. Similarly, pharmacies deal in items that are generally used very frequently (e.g., daily) but in small quantities, and perhaps this is the reason that the majority of consumers visit them infrequently (i.e., around 69% people visiting them less than two times a month).
4.2.4. Consumers’ Preferences for Using Potential CDP Locations
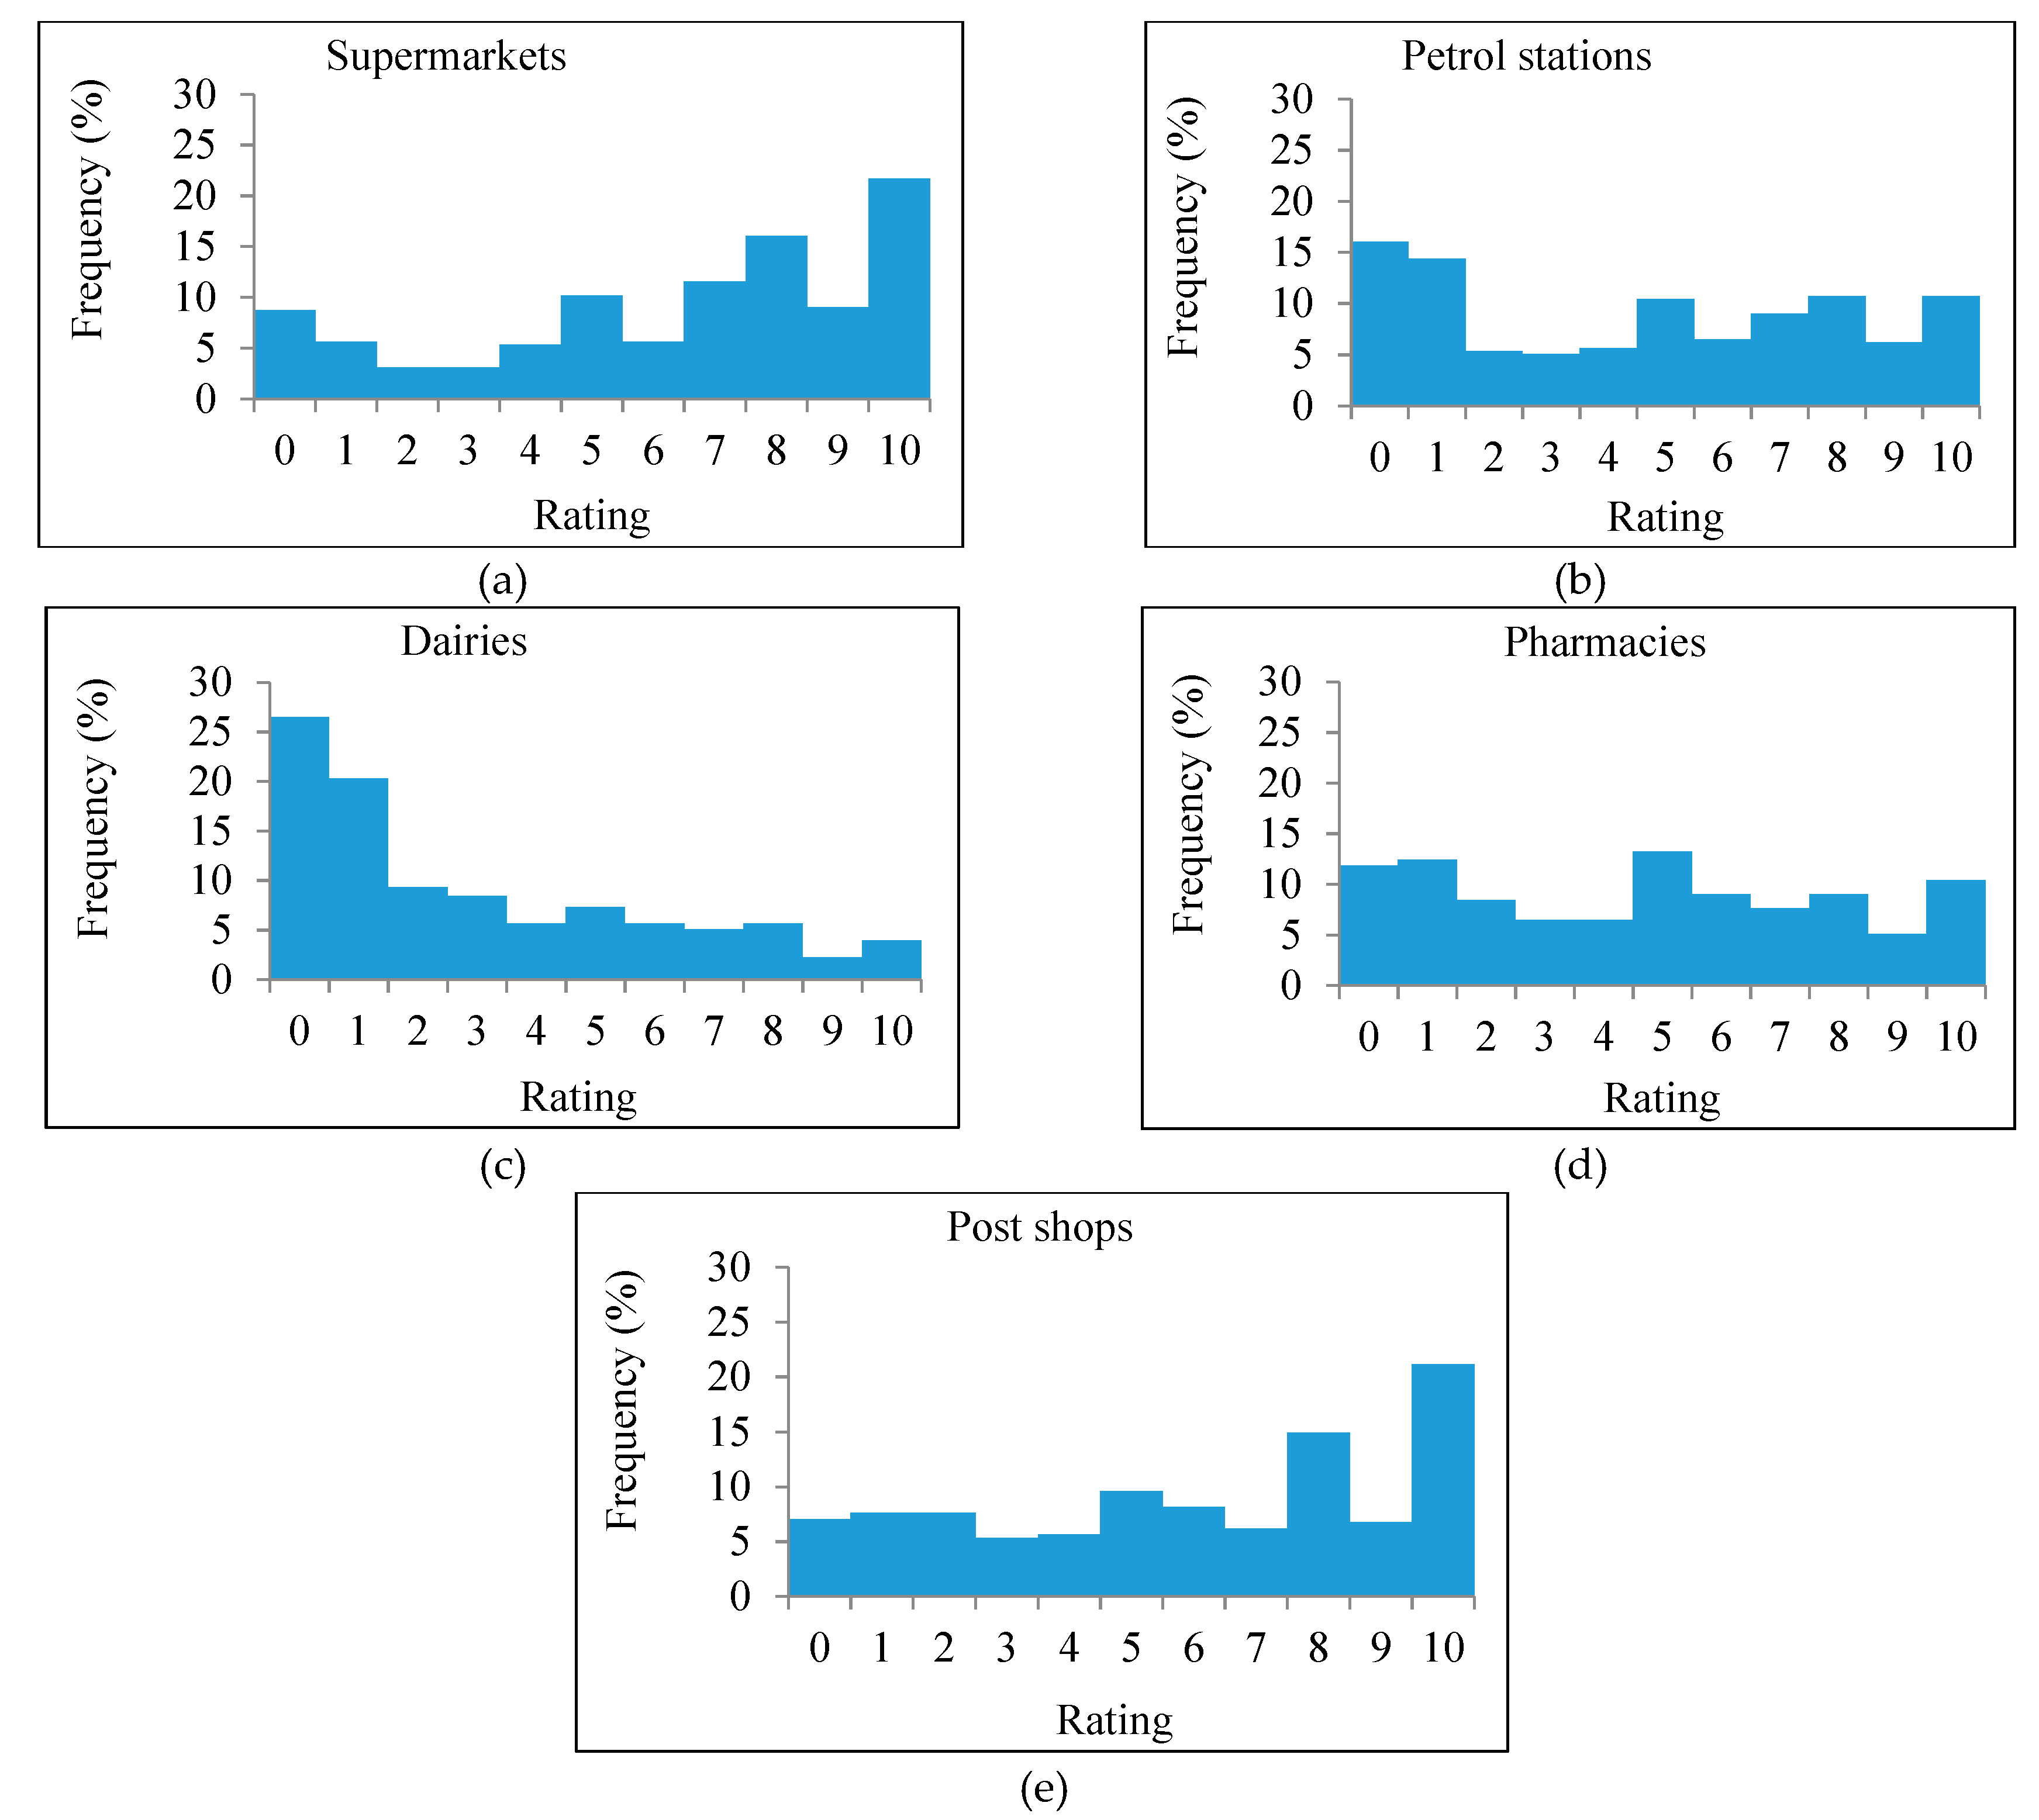
It is worth noting that a high or low frequency of visiting any business does not necessarily mean a high or low consumer preference for that business being used as a CDP. For example, a consumer may prefer a nearby dairy to collect a parcel on foot or on a bicycle, rather than taking a car to a distantly located supermarket. Thus, consumers’ preferences for each of the types of businesses being used to collect (and/or deliver) parcels were obtained using ratings, on a 0–10 scale, where 0 means not preferred and 10 means highly preferred (
Figure 3). The mean and median ratings for supermarkets were 6.3 and 7.0, while for petrol stations, they were 4.7 and 5.0, for dairies, they were 3.0 and 2.0, for pharmacies, they were 4.7 and 5.0, and for post shops, they were 5.9 and 6.0).
High consumer preference for supermarkets being used as CDPs could be due to the high frequency of visiting them. As observed in
Figure 2, supermarkets are consumers’ most frequently visited shopping destinations in New Zealand [
75], and a high portion (95%) of distance travelled for shopping and personal business purposes is by cars as a driver or passenger [
76]. This may provide consumers with an opportunity to combine their trips to CDPs with their shopping trips and collect any parcel delivered to a supermarket together with other items [
77]. Furthermore, the safety of parcels stored at CDPs is also a factor influencing consumers’ choice of location for CDPs [
34]. Thus, as supermarkets in New Zealand employ closed-circuit cameras and use a facial recognition technology to reduce theft [
78], they may seem to consumers to be a safer place to get parcels delivered. However, due to supermarkets’ low-density distribution in the city, CDPs based at supermarkets will not be as accessible as CDPs based at other densely distributed facilities (e.g., dairies).
Consumers’ low frequency of visiting pharmacies and fewer operating hours may be the reason for pharmacies being less preferred as CDPs. However, pharmacies’ fairly dense distribution (see
Figure 1) could help people collect their parcels during operating hours. Interestingly, petrol stations, despite being visited frequently, turned out to be less preferred as CDPs. Nevertheless, their longer operating hours give consumers a greater opportunity to collect or deliver parcels at night (i.e., between 17:00 and midnight).
Similarly, post shops, despite being visited infrequently (as seen in
Figure 2), were preferred as highly as supermarkets and more than pharmacies, petrol stations, and dairies as CDPs. This is likely due to consumers’ experience collecting failed deliveries from post shops [
74]. Also, the availability of other supporting items, such as postage stamps and packaging materials required for sending parcels, could be another reason behind consumers preferring post shops as CDPs.
Dairies turned out to be consumers’ least preferred type of facility to be used as CDPs. The low preference for dairies could be due to consumers’ low frequency of visiting dairies. However, as dairies are densely located throughout the city and operate for longer hours (see
Table 2), they can be considered as potential facilities to be used as CDPs. Unlike less densely located facilities that could well undermine CDPs’ ability to reduce VKT, by requiring people to travel by car to collect or deliver parcels, dairies, being located in close proximity to residential areas, may provide people with an opportunity to collect their parcels on foot or on bicycle and thus reduce the VKT for goods’ last-mile deliveries.
4.2.5. Consumers’ Perceptions of Travel to CDPs
As the objective underlying CDPs’ implementation is to reduce the VKT and greenhouse gas emissions per last-mile delivery, CDPs must be located such that the sum of the courier companies’ VKT to transport parcels to/from CDPs and consumers’ VKT to receive parcels from (or deliver parcels to) CDPs decreases. Leaving courier companies’ VKT aside, consumers’ VKT to collect or deliver parcels using CDPs is largely dependent on the distance to CDPs and the travel mode they use to visit CDPs. If consumers use cars or other motorised vehicles to visit CDPs, it will undermine the goal of VKT reduction. Thus, the location of CDPs should be such that it encourages consumers to use active modes of transport, such as walking and cycling to CDPs.
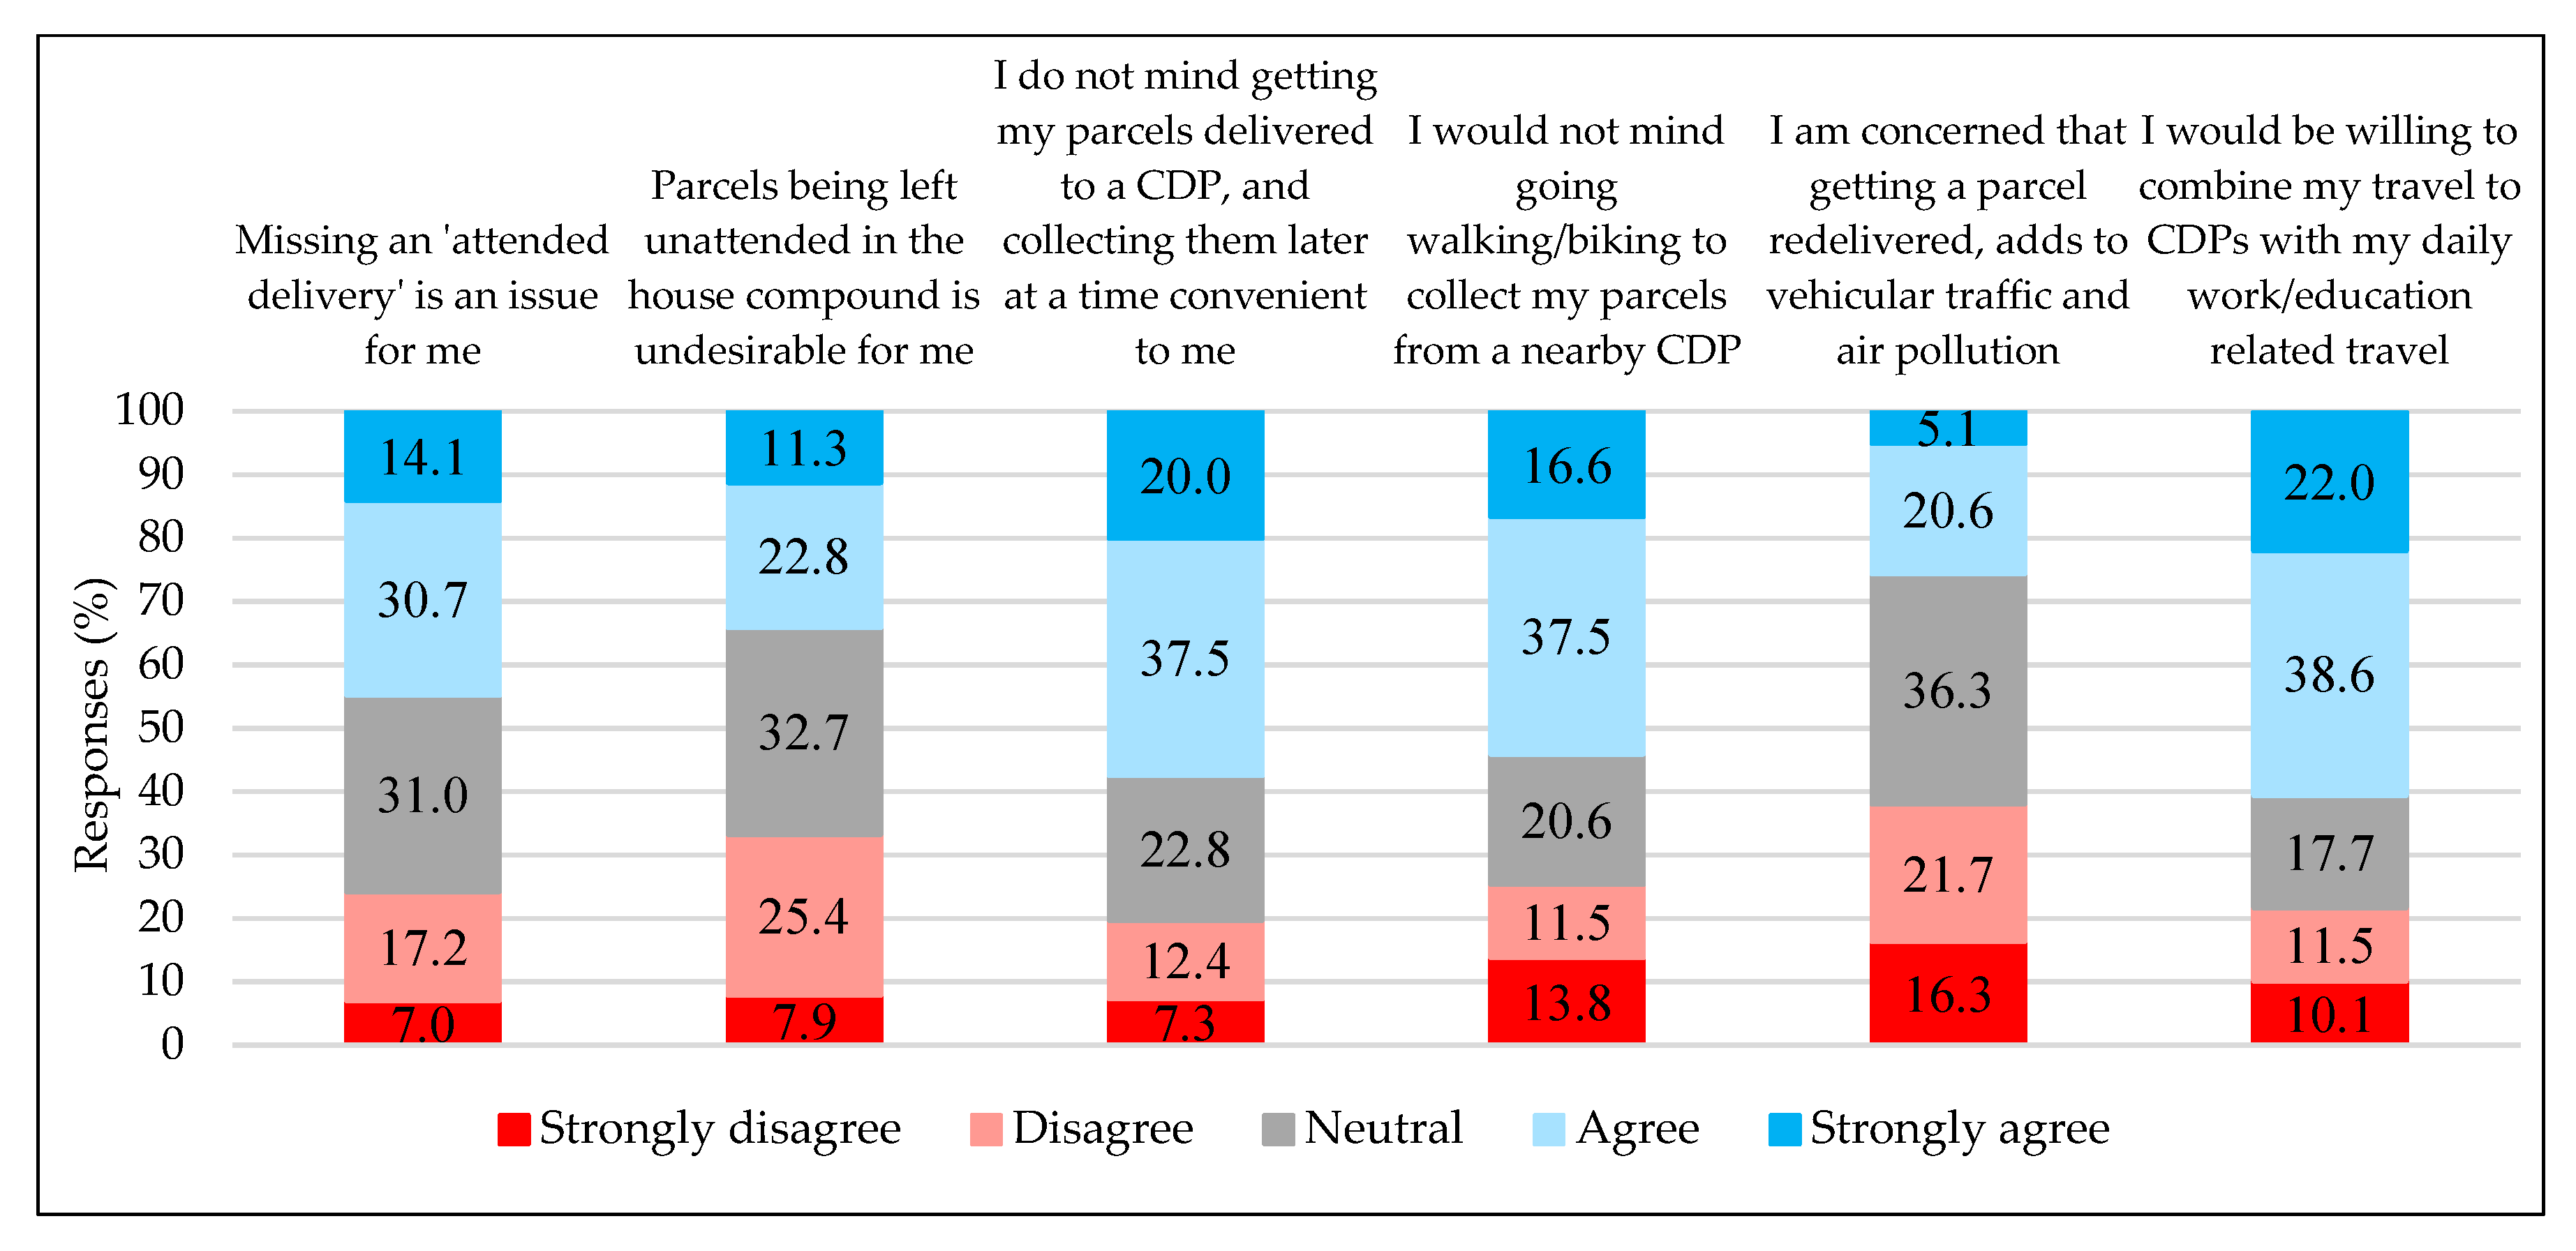
Consumers’ willingness to use CDPs, and their perceptions of travel to CDPs using active transport, were obtained in terms of ratings for several qualitative statements on a five-point Likert scale, as shown in
Figure 4.
Only 24% of respondents disagreed with failed ‘attended’ deliveries being an issue for them. This shows the inconvenience or dissatisfaction caused by failed ‘attended’ deliveries to consumers, in terms of not being able to receive items at the expected delivery day/time. Similarly, only 33% of respondents disagreed with ‘parcels left unattended’ being undesirable, which confirms consumers’ concern over the security of parcels that are left unattended. Over 57% of respondents agreed that they do not mind getting their parcels delivered to a CDP and collecting them at a convenient time. This shows a potential for CDPs in the New Zealand market. Also, despite New Zealanders’ highly car-dependent travel pattern [
76], over 54% of respondents were found to be willing to use active transport modes to visit CDPs. However, as not everyone will be using active modes of transport to visit CDPs, it is important that those who use motorised vehicles (e.g., a car) to travel to CDPs optimise travel (i.e., minimize VKT) by combining their trips to CDPs with other trips. In line with this, over 60% respondents said they would be willing to combine their CDP-bound trips with their daily commute. We acknowledge that this proportion is high but note that trip chaining was not considered in the LA analyses. Furthermore, consumers’ perceptions of traffic and environmental implications of missed home deliveries were sought, and only 25% of respondents were found to appreciate that deliveries involving multiple delivery attempts by courier companies add to vehicular traffic and air pollution. However, with people’s increasing awareness of global warming and climate change, the percentage of people having this concern might well increase in the future.
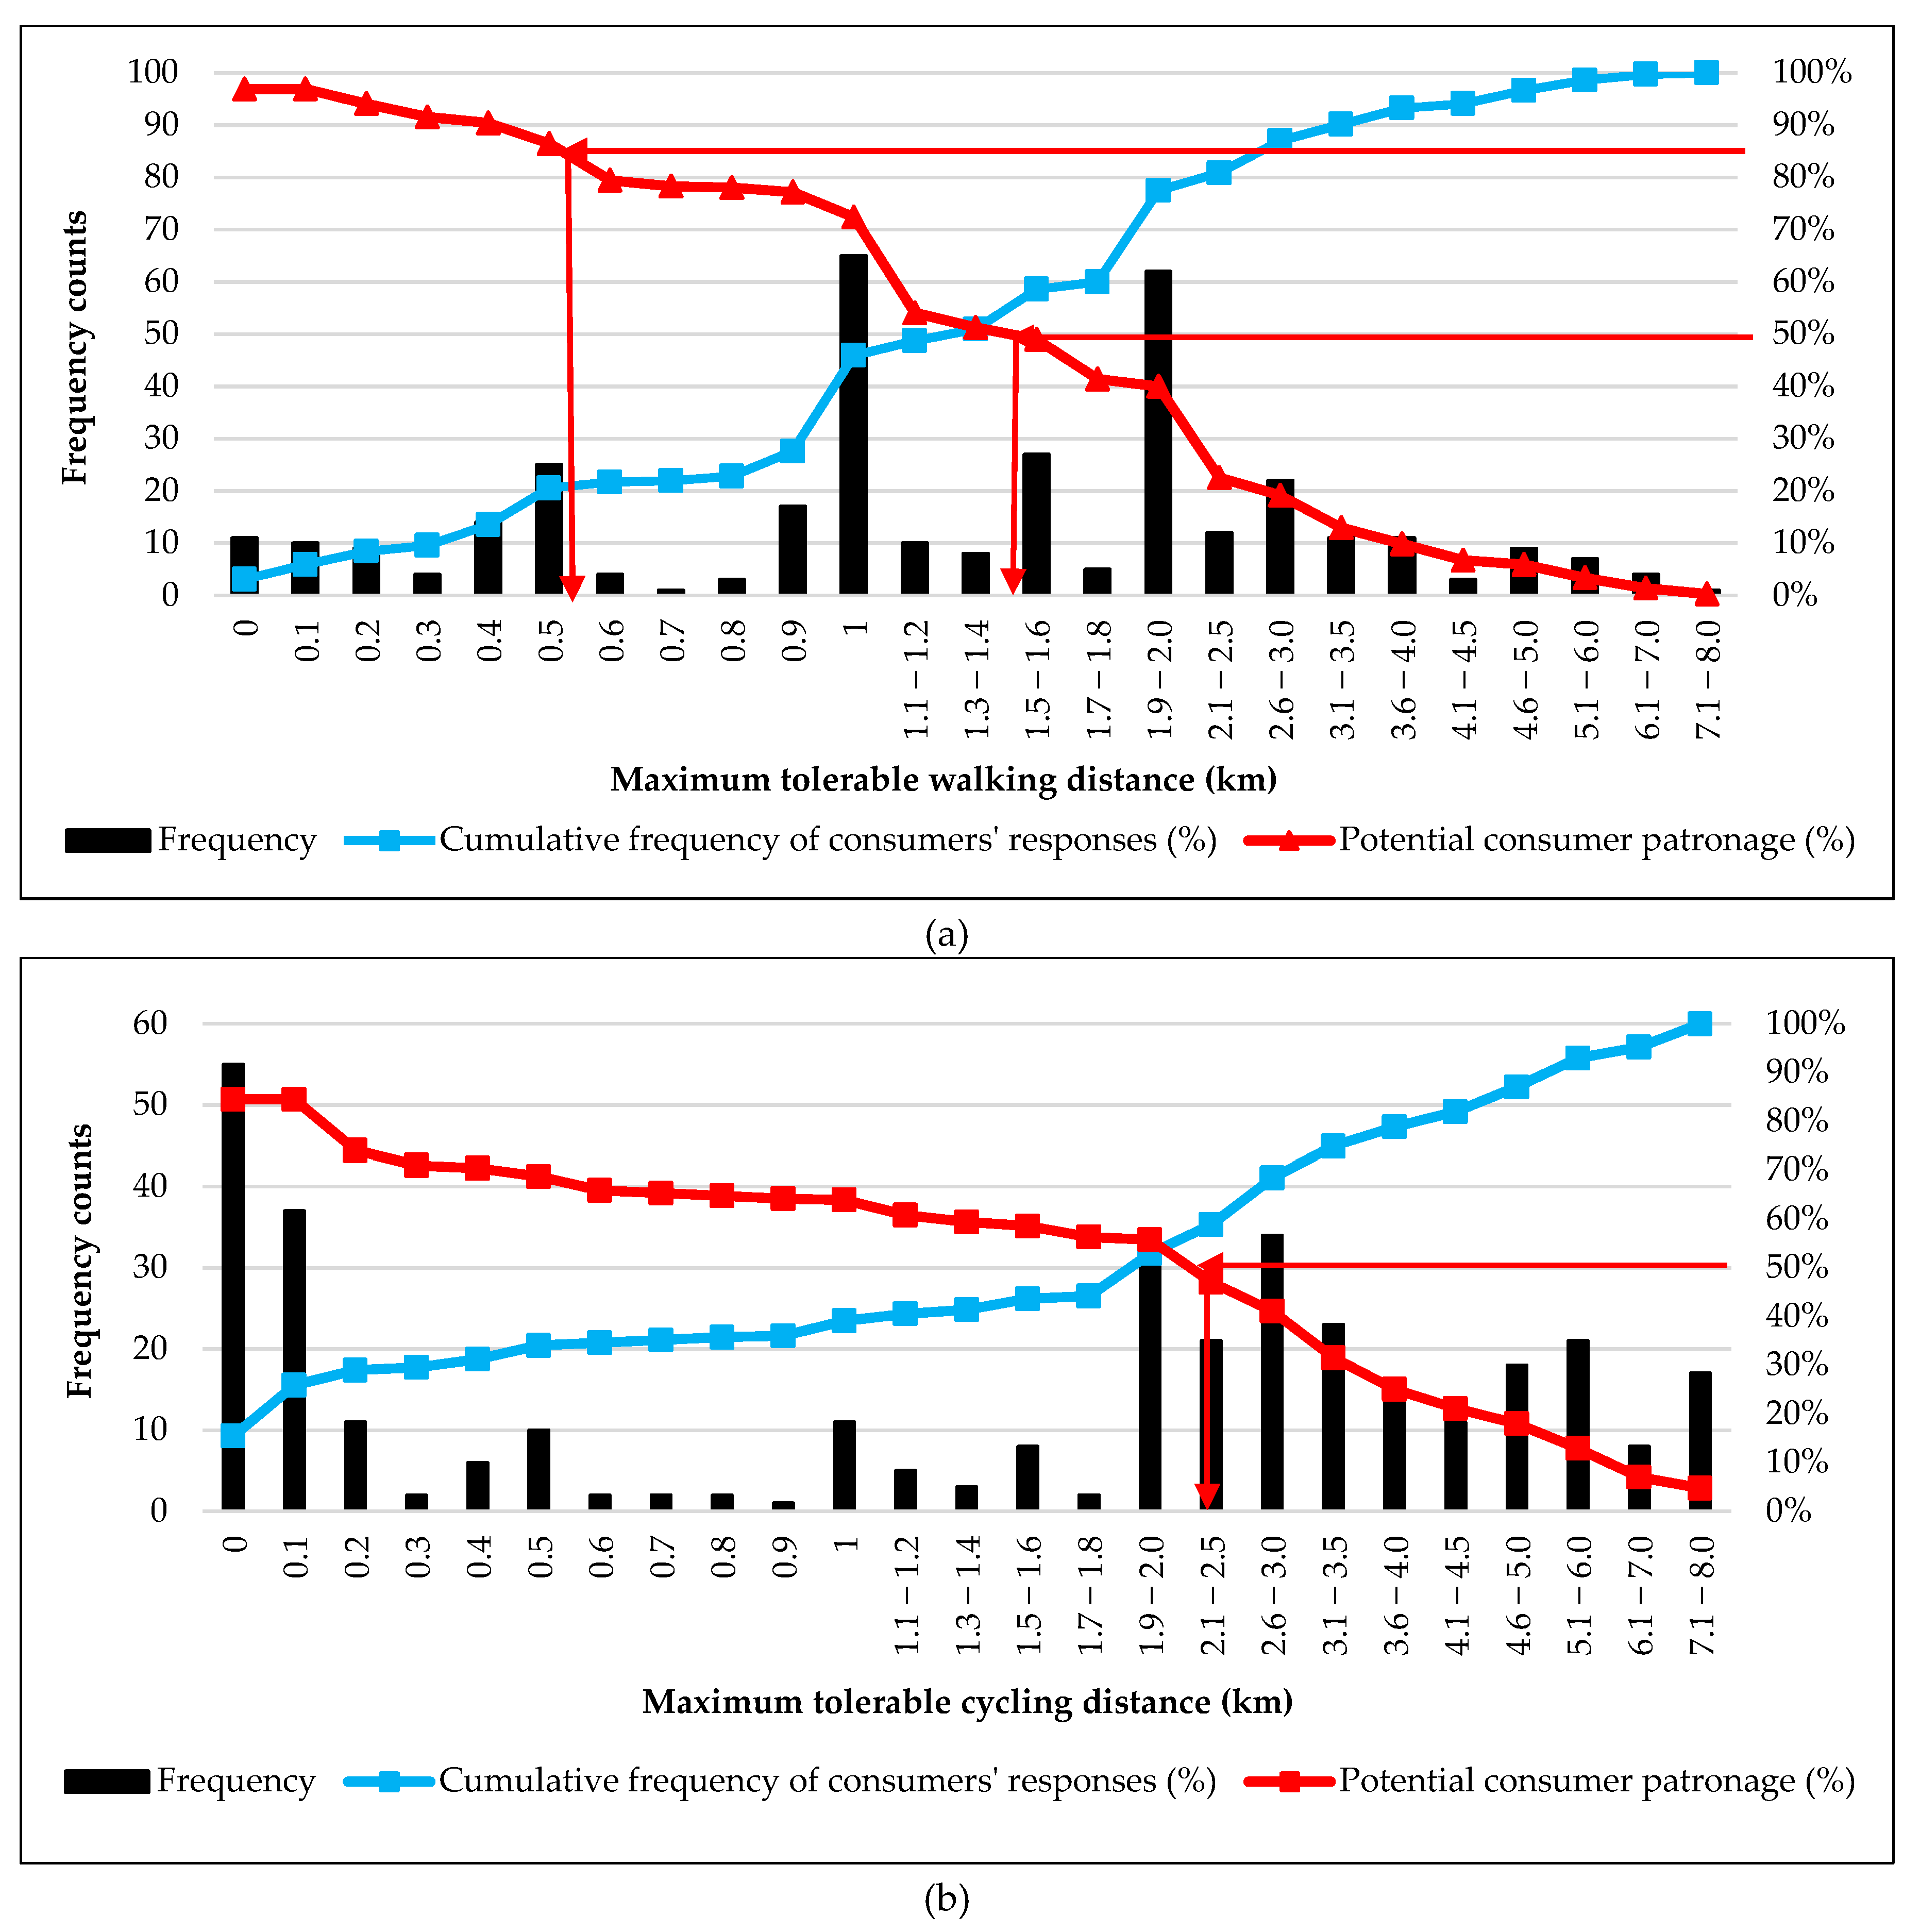
Also, distances that consumers would not mind walking and cycling to collect parcels from (or deliver parcels to) CDPs were obtained and are shown in
Figure 5a,b respectively. It should be noted that the scale used to show the walking and cycling distance is non-standard (i.e., it has unequal intervals).
From
Figure 5a,b, it can be observed that the potential consumer patronage (PCP), i.e., the proportion of consumers willing to walk and cycle to CDPs (represented by red coloured lines) decreases with an increase in the distance that consumers will have to travel to reach CDPs. It is worth noting that around 17% of consumers were found to be unwilling to use bicycles to visit CDPs regardless of the travel distance. A likely explanation for this is that not all consumers have access to bicycles, as only 52% of the households in New Zealand own at least one bicycle [
18]. On the other hand, only 3% of the consumers were observed to have completely ruled out the option of walking to CDPs, irrespective of their locations. The distances corresponding to the 50th and 85th percentile values of PCP and mean tolerable distance are shown in
Table 3. Consumers’ mean ‘maximum tolerable distance’ to walk and cycle were found to be 1.70 km (standard deviation = 1.37 km) and 2.33 km (standard deviation = 2.22 km) respectively, to collect or deliver parcels using CDPs. The tolerable distance to CDPs corresponding to the 85th percentile PCP refers to the distance that 85% of the consumers would not mind walking or cycling to collect or deliver parcels using CDPs, and likewise with the 50th percentile PCP. It should be noted that the cycling distance corresponding to 85th percentile PCP does not exist because 17% respondents completely ruled out the option of cycling to collect or deliver parcels using CDPs.
Therefore, considering factors, such as traditional CDPs’ fewer operating hours, their low density distribution in the city, consumers’ low frequency of visiting them, consumers’ willingness to use CDPs only if they are nearby (which is less likely with traditional CDPs), and consumers’ willingness to use active transport to visit CDPs only if they are in a close proximity (which is less likely with traditional CDPs), it appears that it might not be feasible to serve the city-wide demand with only the traditional CDPs in place. Thus, since the non-traditional CDPs appear to have greater potential for encouraging consumers to receive parcels using CDPs, and LA analyses were carried out to help establish the optimal location of only non-traditional CDPs.
4.3. Road Network and Attributes
The travel distance between demand points (i.e., consumers’ locations) and CDP locations acts as impedance to consumers’ willingness to travel to CDPs for collecting or delivering a parcel. Also, road traffic conditions are a function of time of the day, day of the week, and the mode of travel. Ideally travel time, distance and mode need to be considered collectively to optimize the generalised cost of travel between a typical set of a CDP and consumer locations. However, in this study, due to a lack of travel time data, only shortest distances if travelling by a car were considered for estimating the network costs associated with each demand allocation. For the Christchurch road network, the distances between the demand and facility locations were assumed to be similar by car, walking, and cycling modes of transport. A traffic planning model for the Christchurch network was used to carry out the analyses.
4.4. Store Owners’ and Courier Companies’ Survey
Apart from the above data types, personal interviews were conducted with three major courier companies, to understand their interest in and approach to installing CDPs in the city. Also, given the dense distribution of dairies in the city and their potential for being used as CDPs, dairy owners’ perception of CDPs and their willingness to participate as a CDP were explored by means of face-to-face interviews with five randomly selected dairy owners. The results of these interviews will be discussed along with the discussion of the results of LA modelling.
5. Location-Allocation (LA) Modelling
The LA problem is a combinatorial problem of the type “choose P (the number of locations to be selected) from N (the number of possible locations)”. This means the solution space grows exponentially with increases in N and P. For example, there are over nine trillion combinations when selecting 15 out of the existing 92 dairies, making finding an exact optimal solution in a reasonable search time a very difficult task. Thus, in this study, a heuristic approach, often used in LA problems, was used. This method tends to carry out faster searches and can yield a near-optimal solution without having to evaluate every possible combination [
65].
The LA tool in ArcMap 10.6 (ESRI, Redlands, California, USA) was used to calculate shortest network distances between any two typical locations using Dijkstra’s algorithm [
79]. Then, using a process, called Hillsman editing [
80], an origin-destination cost matrix was computed. Finally, a near-optimal location configuration was obtained through a combination of the vertex substitution heuristic [
81] and meta-heuristics.
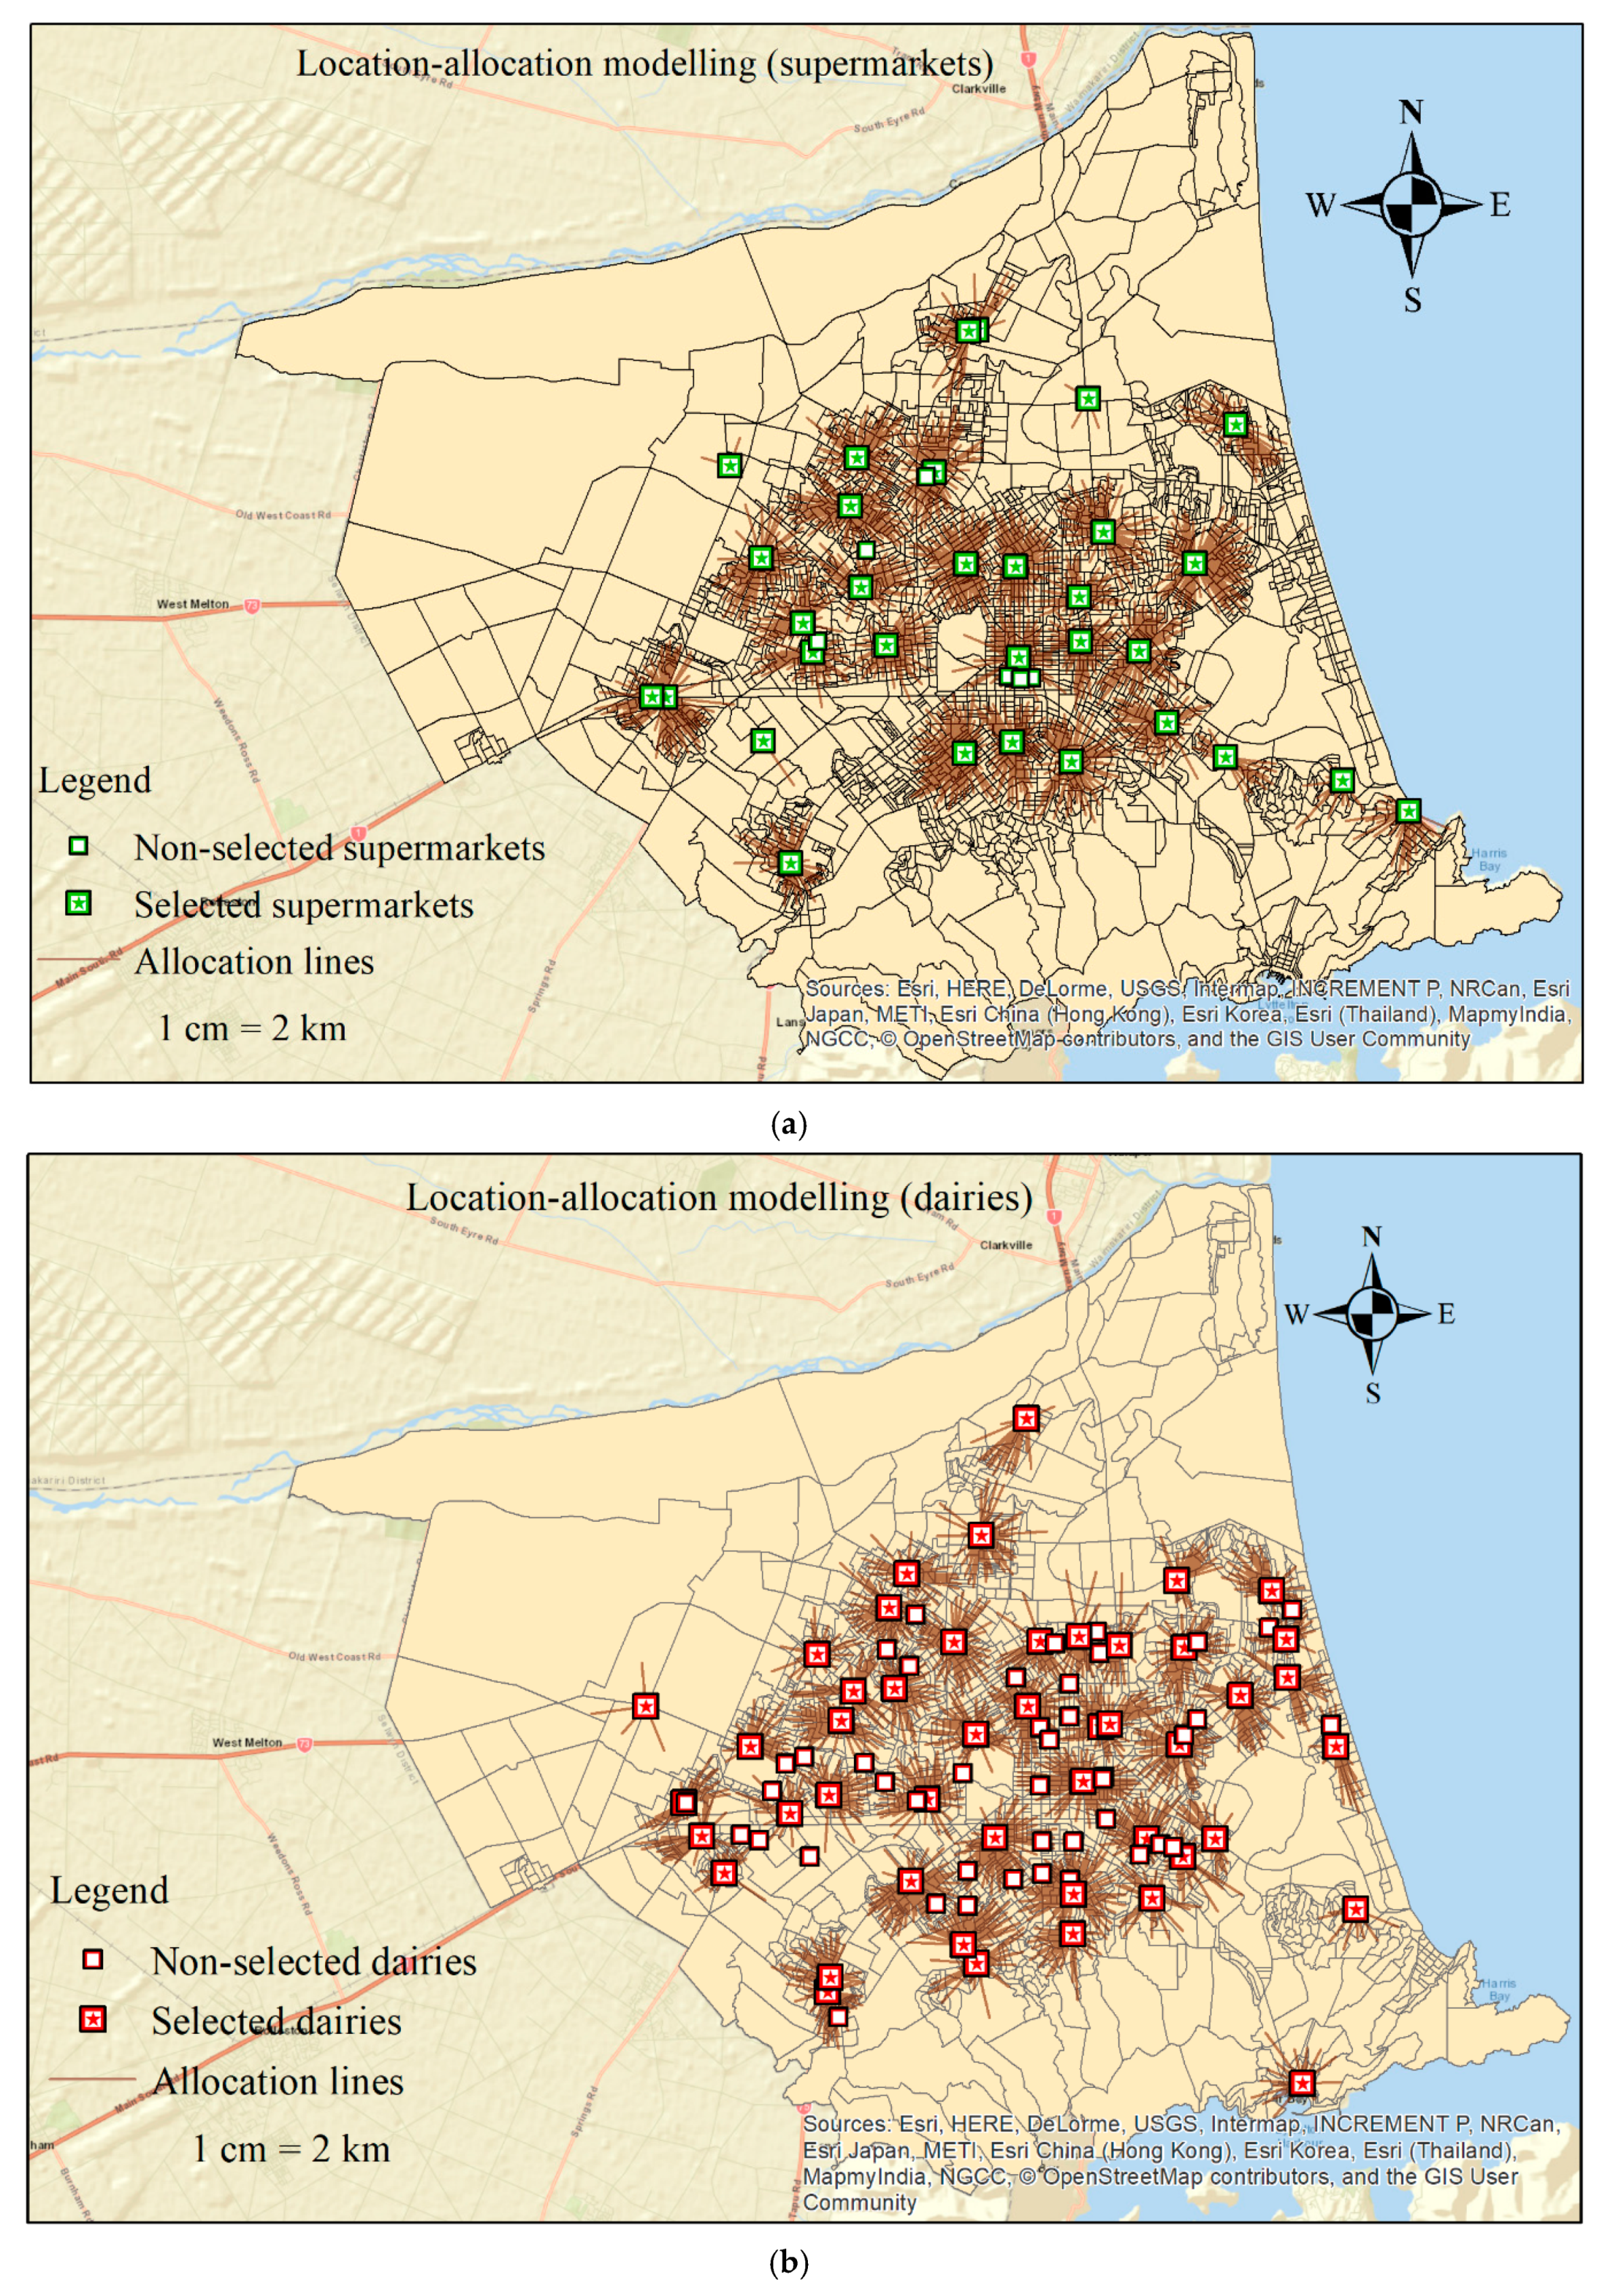
Figure 6a,b show the outputs of typical model runs that resulted in optimal densities and locations for establishing CDPs, using supermarkets and dairies, respectively, corresponding to the situation where the maximum distance that consumers would travel (the distance cut-off,
) to collect or deliver parcels using CDPs was assumed to be two kilometres. The optimal location configuration corresponding to other candidate locations—namely, petrol stations and pharmacies—are not included in the paper. It should be noted that post shops, as mentioned earlier, were not made a part of the LA analyses.
It is important to note that some mesh blocks have not been allocated to any selected facility. For example, in
Figure 6a,b, several mesh blocks, especially those lying on the outer areas of the city, are not allocated to any of the selected CDPs (i.e., supermarkets and dairies). This is due to their being situated further than two kilometres from the selected facilities, and due to some mesh blocks, situated within two kilometres, having no or low population residing in them. This means a zero or a very low demand-weighted distance, corresponding to those mesh blocks, rules them out from being allocated. At the same time, some of the candidate facilities were also not chosen by the algorithm because they do not form a part of the near-optimal solution that minimizes the demand-weighted network distance (not the straight-line distance) to CDPs. Each allocation line represents demand points and facilities they are allocated to. Though allocation lines are shown to be straight, they are based on network distances. Similar observations can be made over location configurations resulted from models analysing other types of CDP facilities (i.e., petrol stations and pharmacies) that are not shown in the paper.
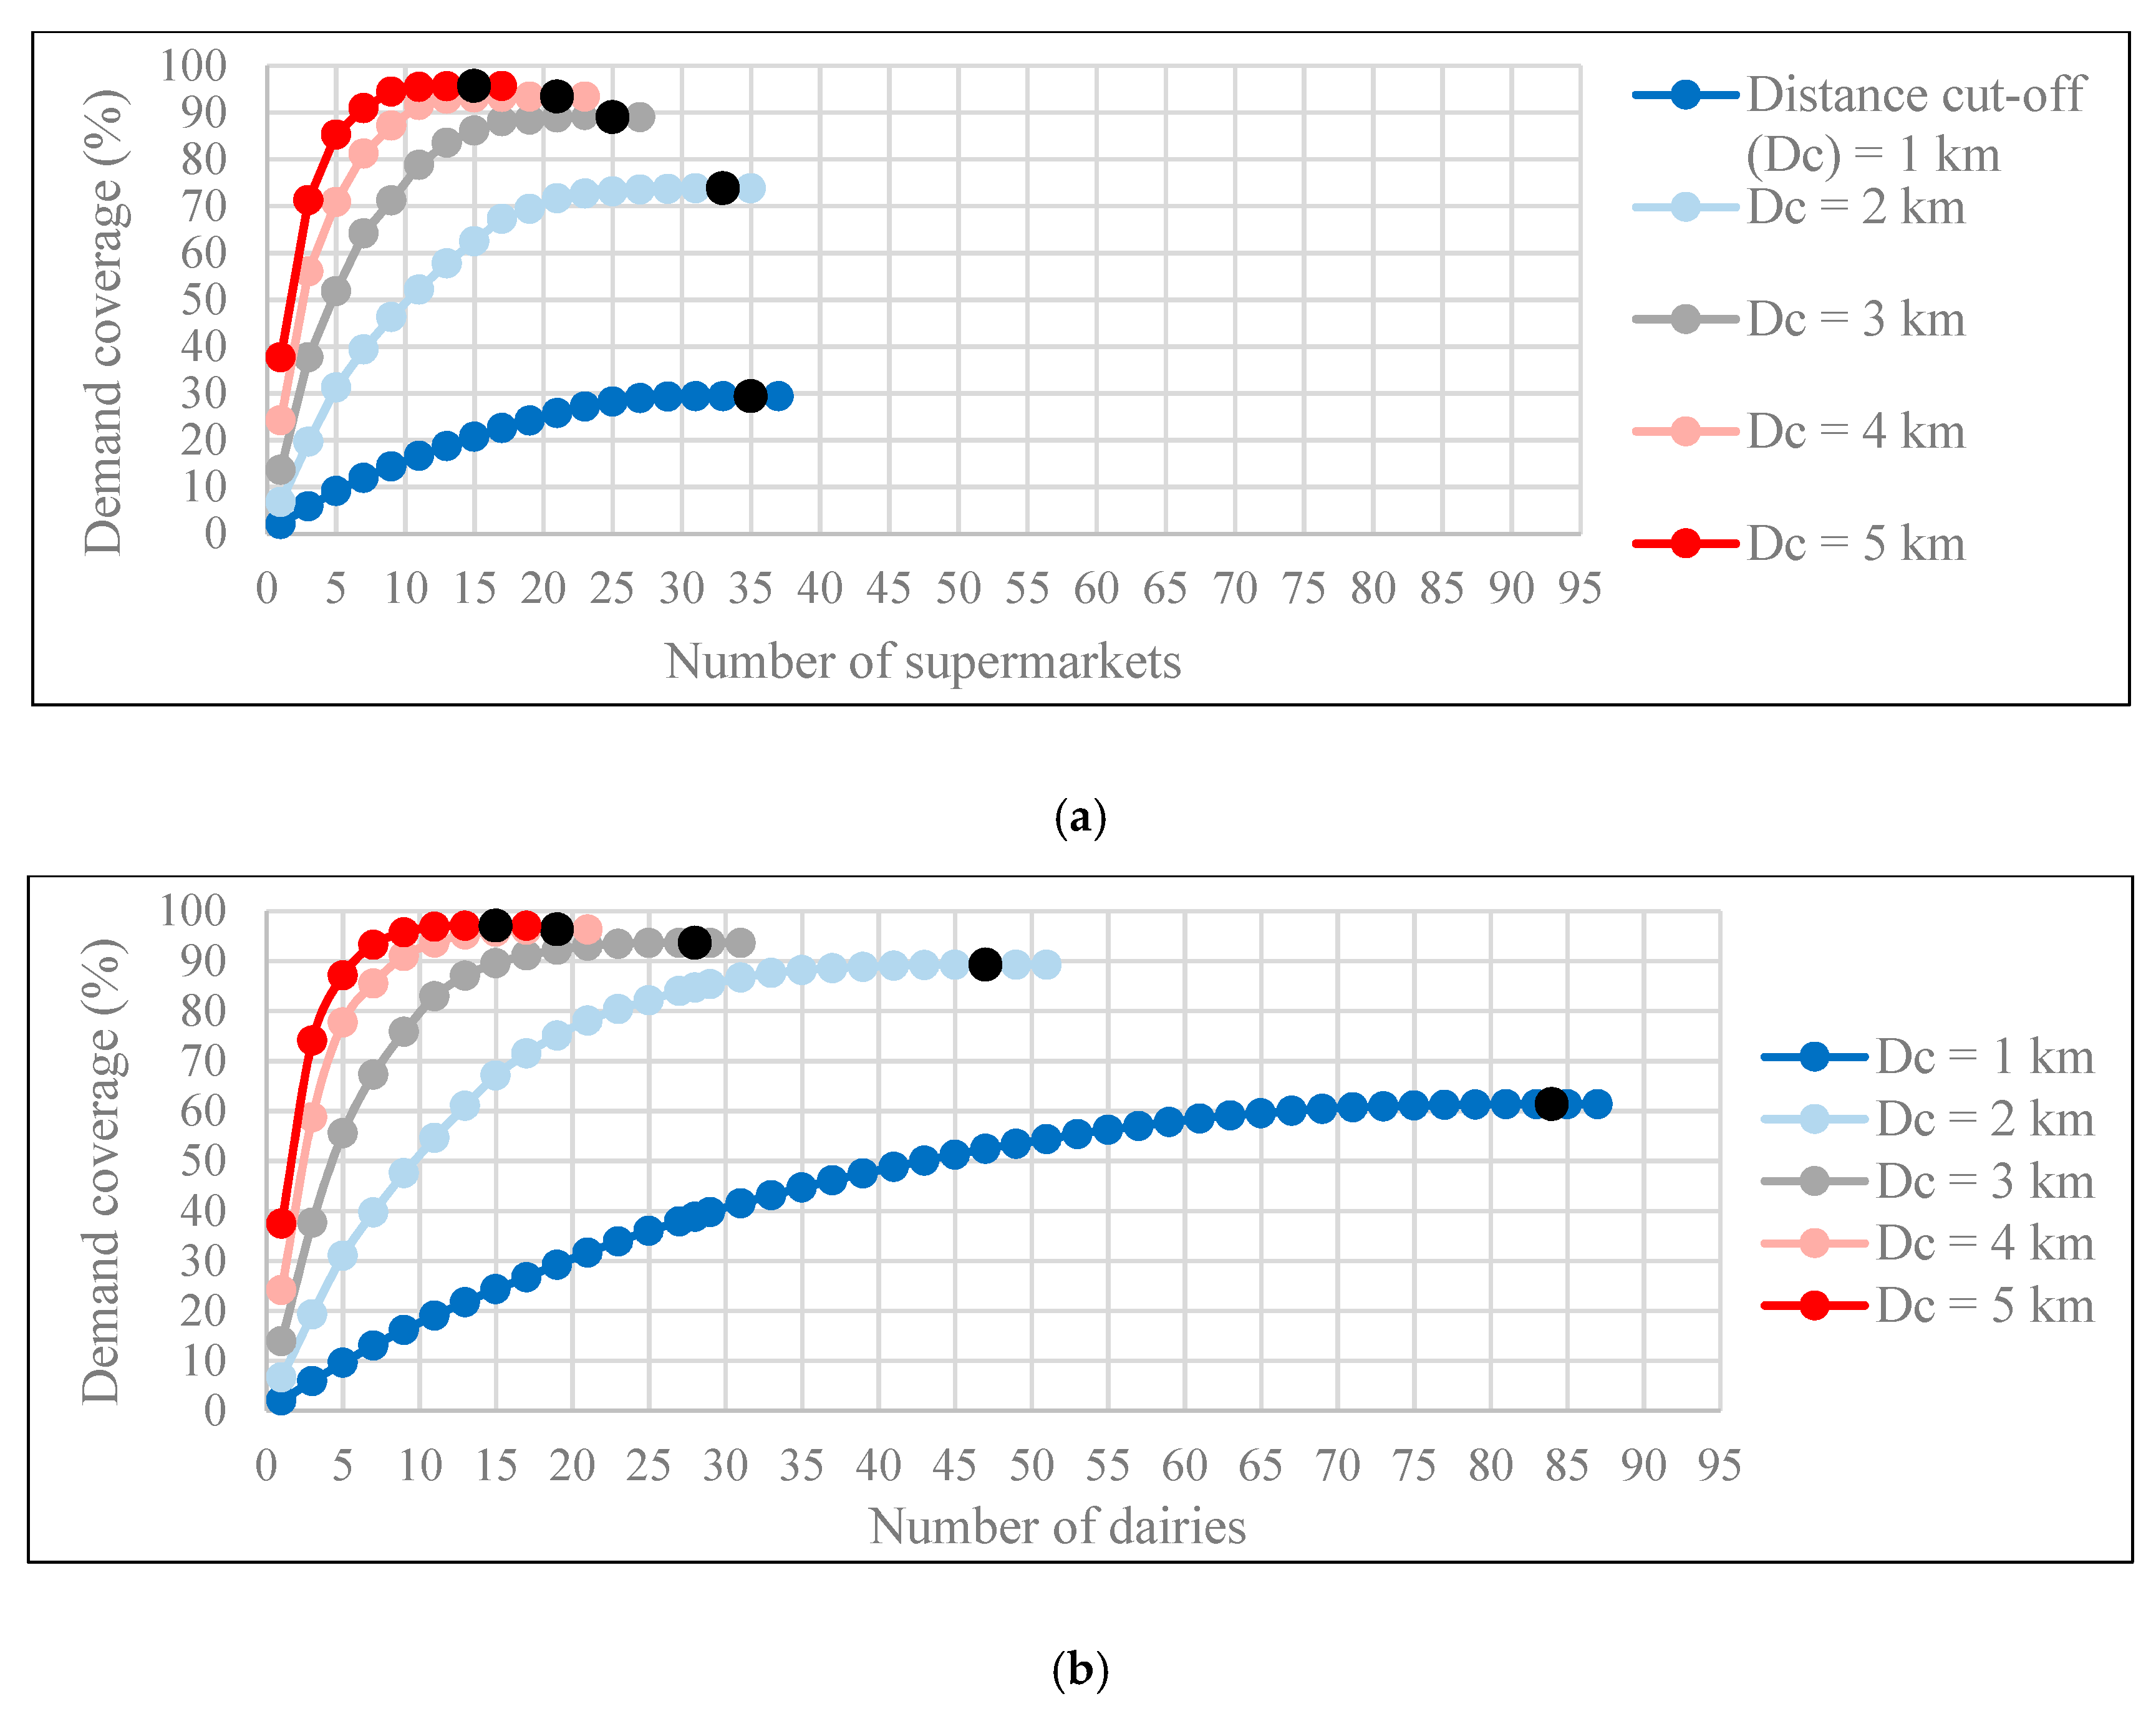
6. Results and Discussions
Figure 7a,b show the demand coverage if supermarkets and dairies, lying within various distance cut-offs (i.e., 1.0, 2.0, 3.0, 4.0, and 5.0 km) from demand points, were respectively selected as CDPs. It can be observed that the demand coverage increases with the number of facilities adopted as CDPs, only up to a point (the black-coloured points in
Figure 7a,b), called the optimal density of CDPs. After this point, any increase in the number of CDPs does not increase the demand coverage. As discussed earlier, this implies that all the unallocated demand points lie outside the respective service distance cut-offs from the selected CDPs or there is no or low population residing in the mesh blocks associated with those demand points.
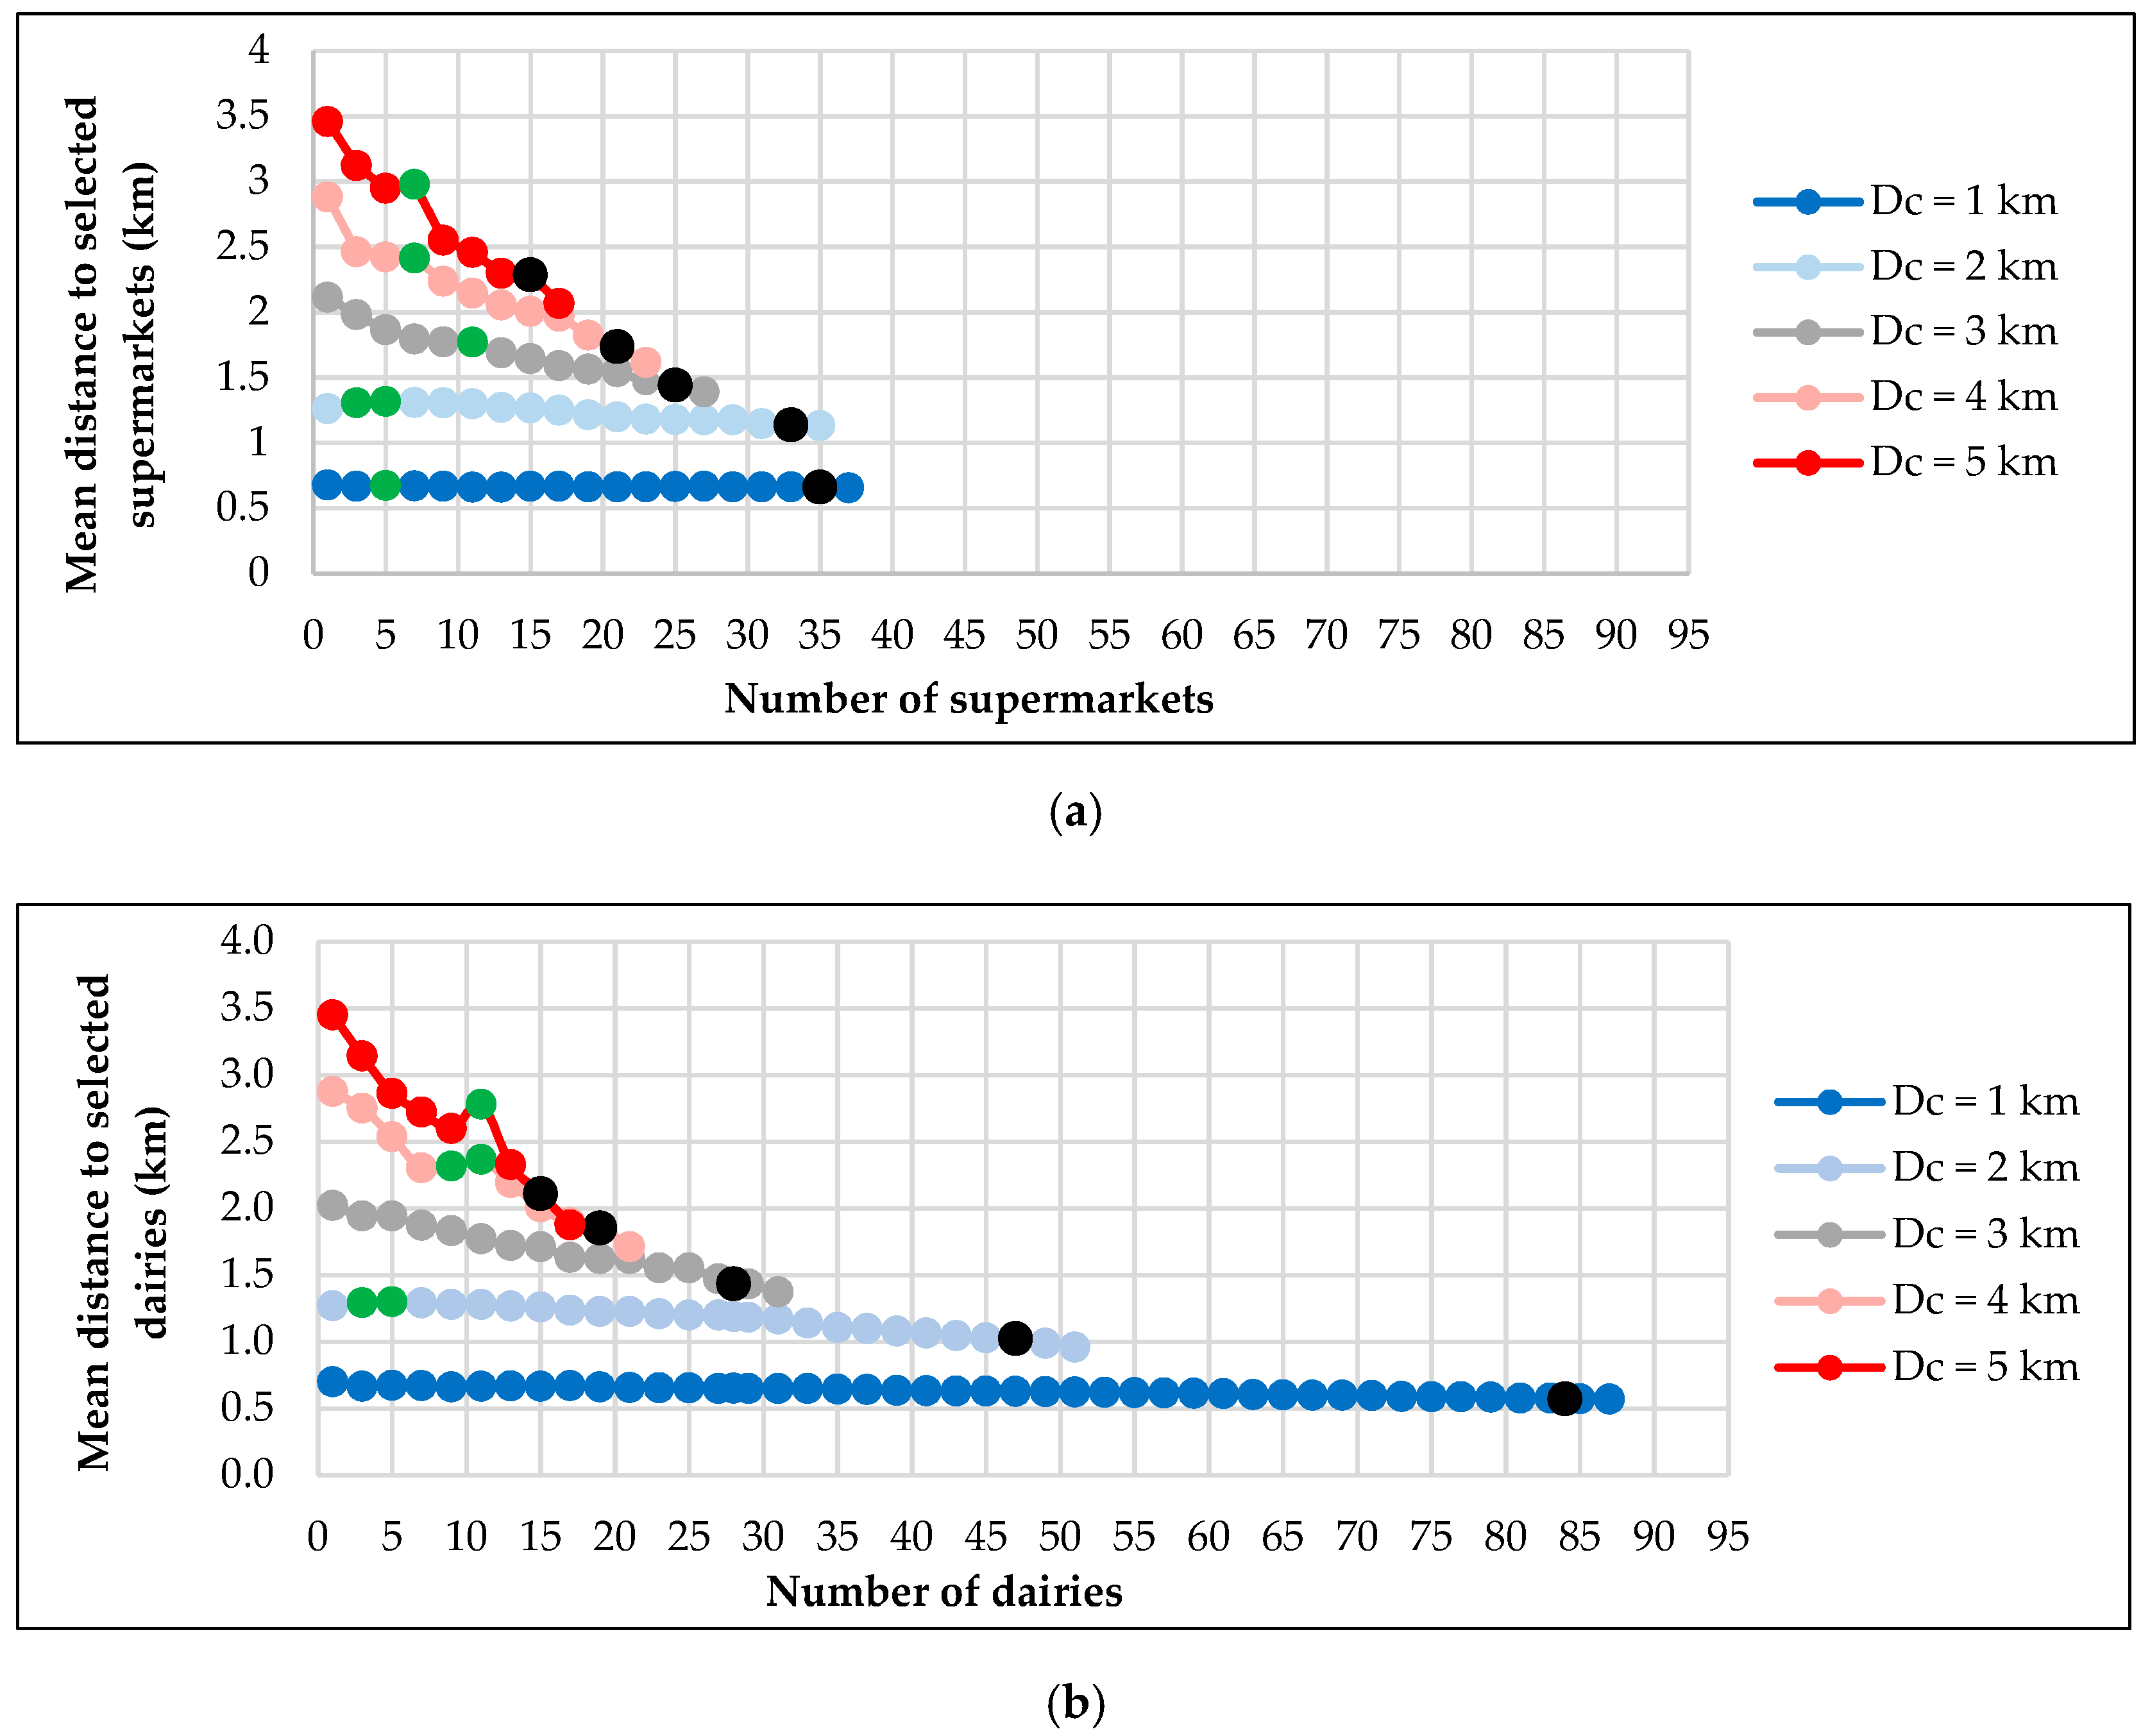
It is also worth noting that, for all five values of
, the demand-weighted mean distance (referred to as the mean distance hereafter) that consumers will have to travel to CDPs decreases with an increase in the number of facilities adopted as CDPs, and it continues to decrease even after the optimal density is reached (see
Figure 8a,b). However, it must be noted that the decrease is non-monotonic, as the mean distance increases at a few points where a CDP is perhaps located in a less dense area (see the green points in
Figure 8a,b). The overall decrease in the mean distance can be attributed to demand points being allocated to newly added CDPs that are located nearer than the CDPs they had previously been allocated to. However, the rate of decrease in the mean distance to CDPs with an increase in the number of CDPs, is higher for large values of
(see
Figure 8a,b). This can be ascribed to the fact that when
is large (say 5.0 km), the catchment (i.e., the number of demand points lying within 5.0 km) of each CDP is bigger than when
is small (say 2.0 km).
When additional CDPs are adopted, it results in bigger overlaps of catchments of CDPs when is large. This implies that, for a large value of , a larger number of CDPs are likely to be available within the distance cut-off from demand points, leading to a large proportion of demand points being reallocated to other nearby CDPs. Readers should note that similar observations were made when considering petrol stations and pharmacies as candidate locations, but the diagrams are not included in the paper.
Table 4 summarizes the results of LA analyses carried out using each of the four facility types considered in this study, in terms of demand coverage, mean distance to selected CDP locations, and optimal number of CDPs, corresponding to each of the values of
(km). It can be observed that, in general, as
increases, the demand coverage increases, and the required number of facilities (required to be used as CDPs to cover the same demand) decreases. However, the mean distance that consumers will have to travel to collect parcels from (or deliver parcels to) a CDP increases with an increase in
. For example, for
equal to 1.0 km, 29.3% of people will have to travel 0.66 km to reach a CDP at a supermarket, while for
equal to 2.0 km, 73.8% of people will have to travel 1.15 km to reach a CDP at a supermarket (see
Table 4).
It is important to note that the mean distances might not be good representatives of the entire demand coverage that they are associated with, because a mean distance may mask the presence of outliers and hence, may not depict the non-uniformity of the distances. For example, for
= 1.0, a mean distance of 0.66 km (see
Table 4) to supermarket-based CDPs is only the 42nd percentile value of distance to CDPs, which means that 42% of consumers will have to travel up to 0.66 km and rest of them will have to travel a distance ranging from 0.67 to 1.0 km. Therefore, 85th percentile values in addition to the mean distances were computed and are shown in
Table 4.
Interestingly, for the first three values of
(i.e., 1.0, 2.0, and 3.0 km), the 85th percentile distances to be travelled by consumers to their allocated CDPs are least when dairies are adopted as CDPs, compared to the distances if other types of facilities are adopted as CDPs (see
Table 4). On the other hand, for other values of
(i.e., 4.0 and 5.0 km), the 85th percentile distances are least when pharmacies are adopted as CDPs, compared to when other facilities are adopted as CDPs. It should be noted that mean and percentile distances to the respective facilities, corresponding to same values of
, differ only marginally. However, for small values of
(i.e., 1.0 and 2.0 km), a substantial variation can be observed in both the demand coverage and the optimal number of CDPs obtained for the different types of facilities adopted as CDPs (see
Table 4).
It is important to note however that one objective of courier companies wanting to establish CDPs will likely be to minimise the set-up costs. Another objective will likely be to minimise the cost of transporting parcels from their distribution centres or regional warehouses to CDPs. On the other hand, consumers are likely to want CDPs to be located close to their residences. To make the CDP service attractive, courier companies will need to balance minimising their costs against satisfying the wishes of consumers. CDP services are new for New Zealanders and adopting a consumer-centric approach to location selection (i.e., providing consumers with easy access to CDPs), at least initially, will facilitate a quicker penetration of CDPs in the New Zealand market.
Personal interviews with the representatives of the three largest courier companies operating in Christchurch, undertaken to understand their views about CDPs, revealed that businesses willing to be contracted as CDPs are typically paid a flat monthly fee, regardless of the number of parcels being handled in a month. Hence, the cost of establishing CDPs at existing facilities is much less than it would be if new facilities were established. This study adopted a consumer-centric approach and at the same time accounted (indirectly) for the courier companies’ objective of minimising CDP establishment costs by considering CDPs in existing facilities only, plus the ease of consumer access to CDPs.
As far as the selection of the type of a facility to be used as CDPs is concerned, supermarkets and post shops were observed to be consumers’ preferred facilities to be used as CDPs. Nevertheless, it is worth noting that their high preferences for supermarkets and post shops, at least to some extent, could be due to their high frequency of visiting supermarkets and the tradition of collecting failed deliveries from post shops, respectively. On the other hand, though dairies were observed to be less preferred as CDPs by consumers, results of the LA analyses show that for lower values of (i.e., 1.0 and 2.0 km), a dense distribution of dairies across the city makes them the most accessible locations for consumers.
A dense network of dairies being used to establish CDPs can potentially result in CDPs being located at a short distance from consumers’ residences. This is likely to encourage them to walk or cycle to CDPs to collect and/or deliver parcels (as discussed in
Section 4.2) and hence result in substantial health benefits and reduction in VKT and greenhouse gas emissions. This is consistent with the observations of McLeod et al. [
82]. Additionally, it may result in consumers combining car trips to CDPs with their daily commute and result in a substantial reduction in VKT. It could be argued however that as consumers currently visit supermarkets frequently, they may prefer them as CDPs because they can combine car trips to CDPs with their shopping trips, and their using supermarkets as CDPs may therefore decrease consumers’ VKT. On the other hand, dairy-based CDPs, being located closer to consumer locations, will reduce the need for consumers to take cars to CDPs.
Also, it should be noted that the results of interviews with five dairy owners, regarding their willingness to have their business contracted as a CDP, show that all the dairy owners were found to be willing to serve as a CDP. They were optimistic about the increase in revenue and number of customers that may result from their businesses being a part of a CDP network. Moreover, they were found to be willing to allocate a reasonable amount of space in their business premises to store parcels. Therefore, from the consumers’ perspective of accessibility to CDPs and from the sustainability perspective, dairies tend to be better locations, compared to other businesses for establishing CDPs.
7. Conclusions and Directions for Future Research
Locating a CDP is a complex task that involves decisions based on the technical, social, and economic aspects of goods’ last-mile delivery. A modified p-median problem determines the optimal density and locations for establishing CDPs, taking into consideration mesh-block level socio-demographic data for Christchurch. A dense distribution of dairies across the city, compared to other less densely distributed facility types, such as petrol stations and supermarkets, provides a promising network of CDPs that might well encourage people to adopt active transport modes, such as walking or cycling, to receive or send items bought online. Thus, delivery using CDPs as an alternative option to standard home deliveries is likely to increase the efficiency of goods’ last-mile travel in terms of decreased transport cost (i.e., time and distance), decreased greenhouse gas emissions, and a more sustainable built environment. The modelling approach used in this study, with the consideration of contextual factors that may differ in cities within and between countries, can be applied to implement CDPs in other cities around the world that are characterised by sparse population densities and where a considerable proportion of home deliveries fail. The study outcomes may be used by the various stakeholders, such as transport planners (e.g., strengthening active transport infrastructure around CDPs) and courier companies (e.g., selecting the number of CDPs to be employed considering their budgetary constraints and planning for delivery vehicle routing) in Christchurch as well as other cities that have a similar distributional pattern of CDP facilities and population centres.
Future studies could consider a greater number of socio-demographic factors, such as the distribution of people in various age-groups residing in each mesh block, to account for variations in the online shopping frequency of different age groups. Such models would need to be refined periodically and use national Census data. In addition, similar analyses considering network travel time, instead of distance, as impedance to consumers’ travel to CDPs, would be worth carrying out, to make a comparison with the location configurations suggested by this study.


