The Possible Stimulation of the Mid-Holocene Period’s Initial Hydrological Recession on the Development of Neolithic Cultures along the Margin of the East Asian Summer Monsoon

Abstract
1. Introduction
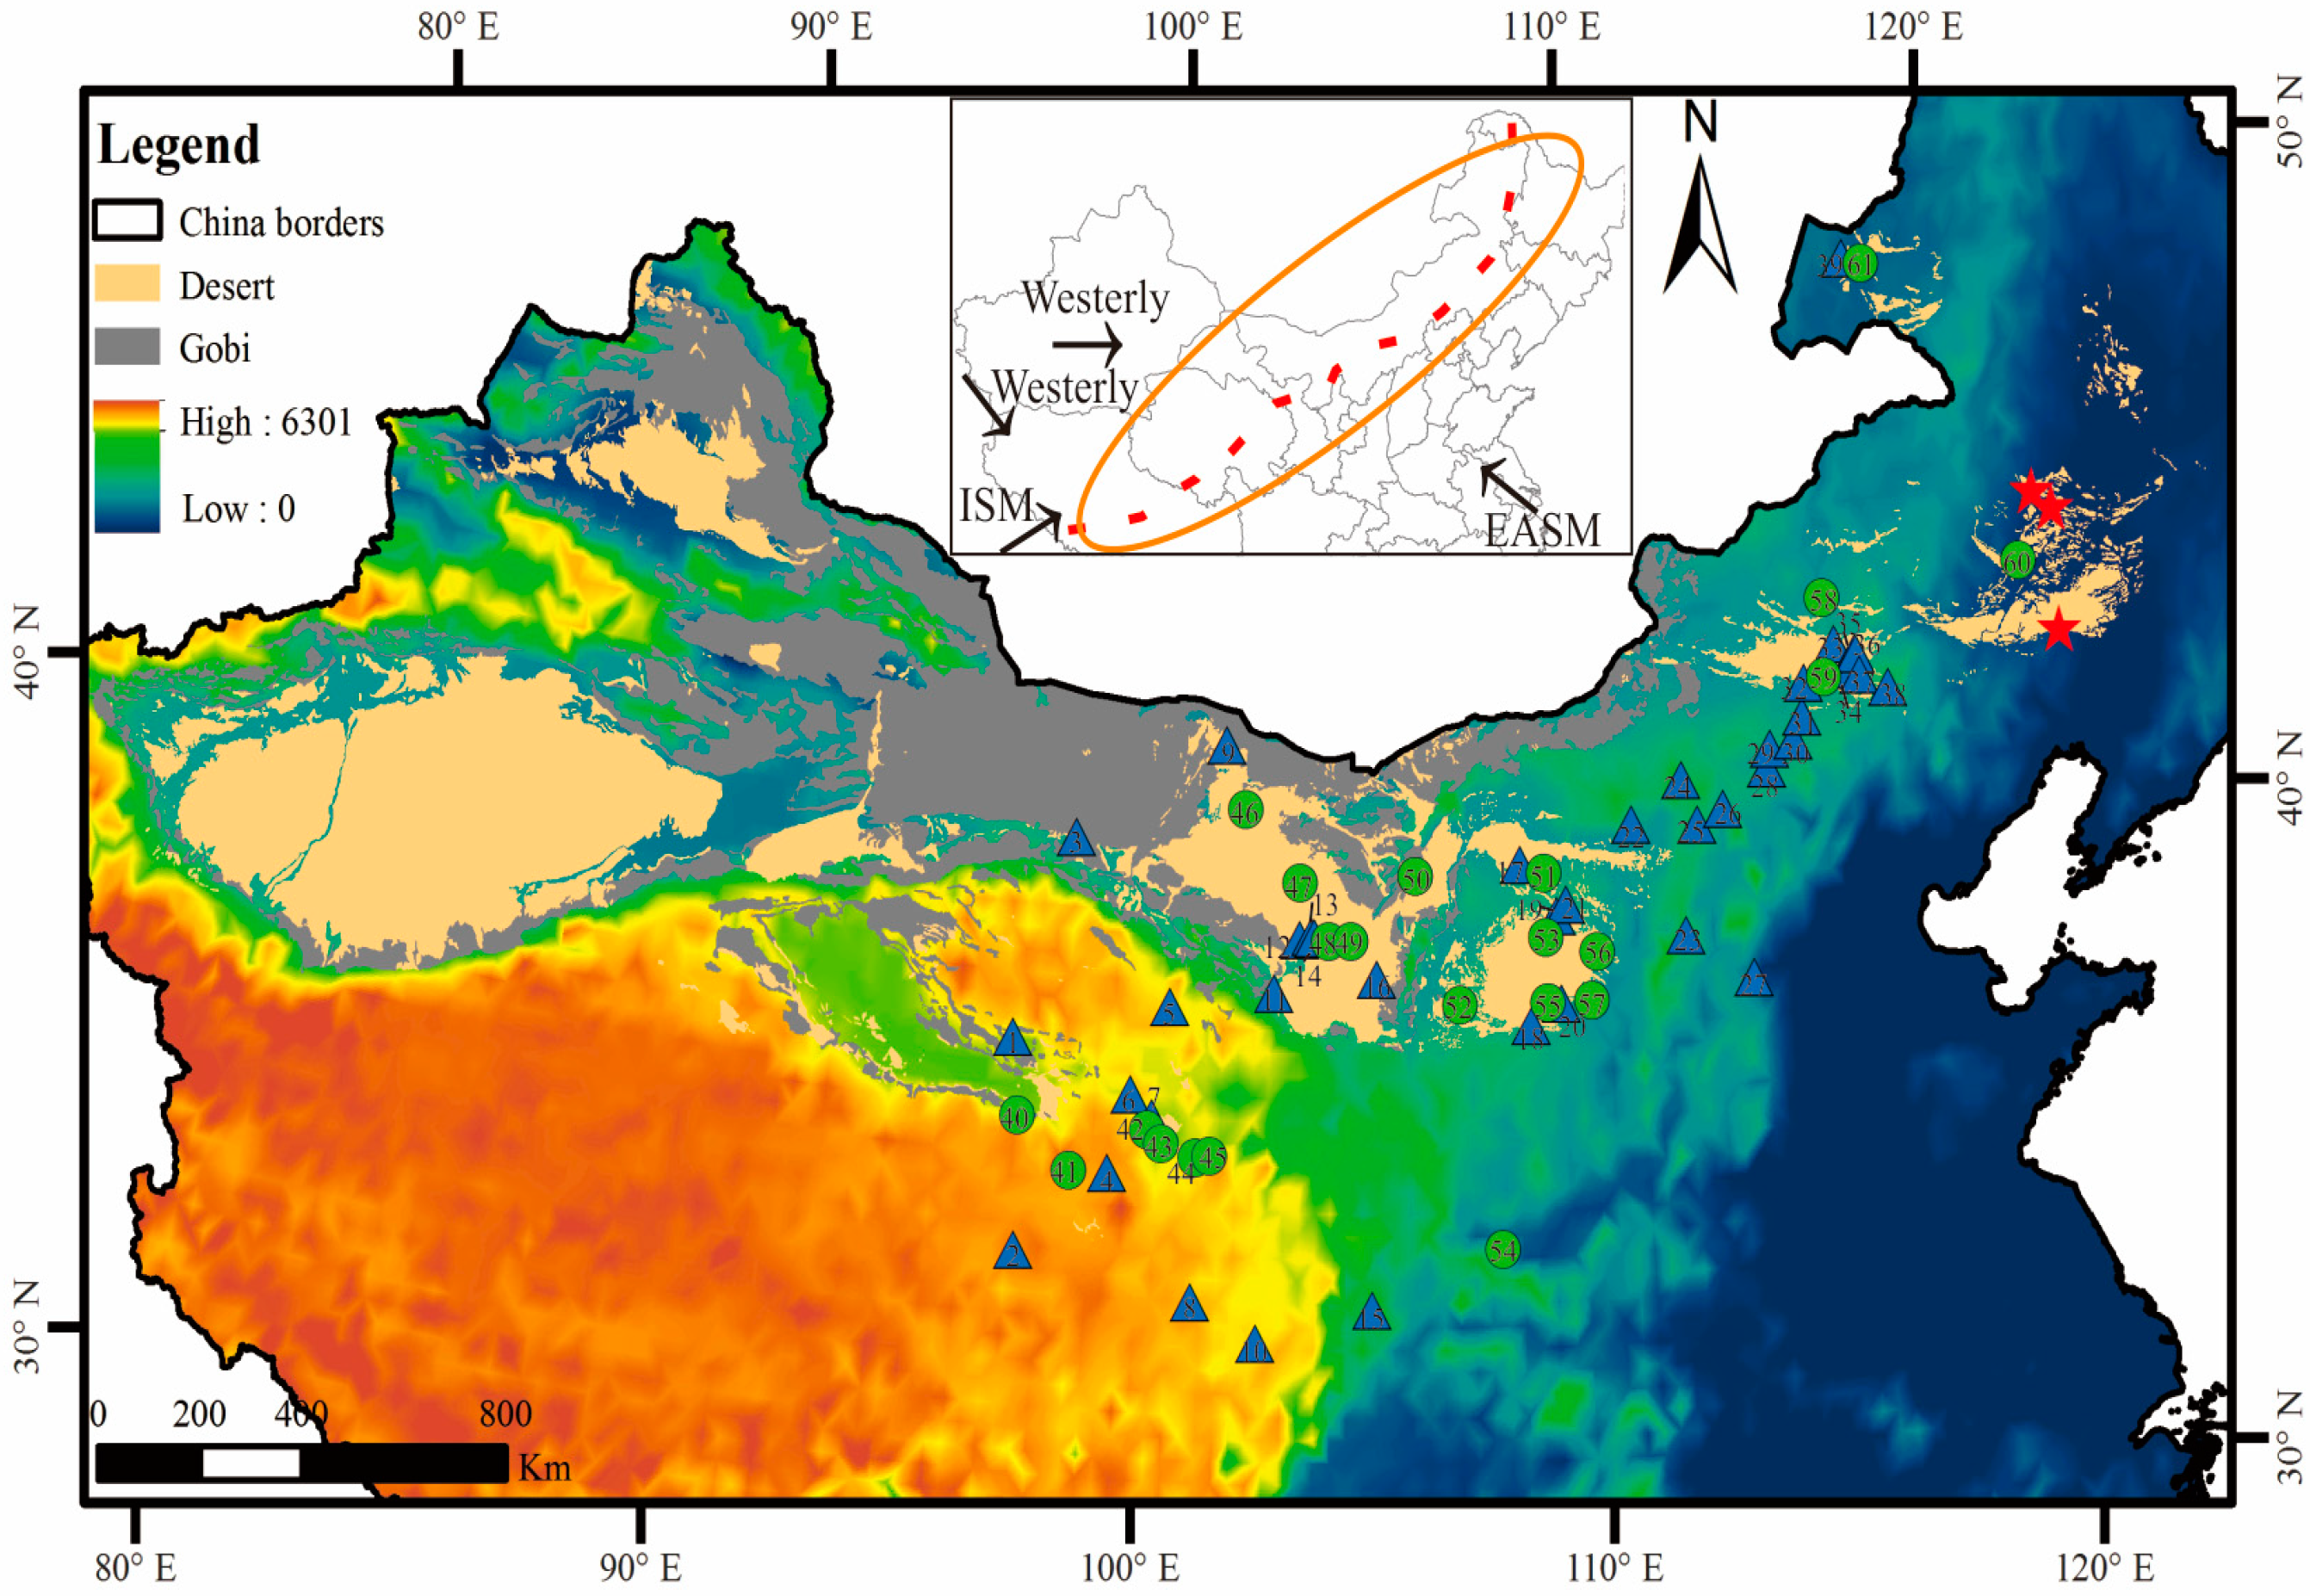
2. Regional Setting
3. Material and Methods
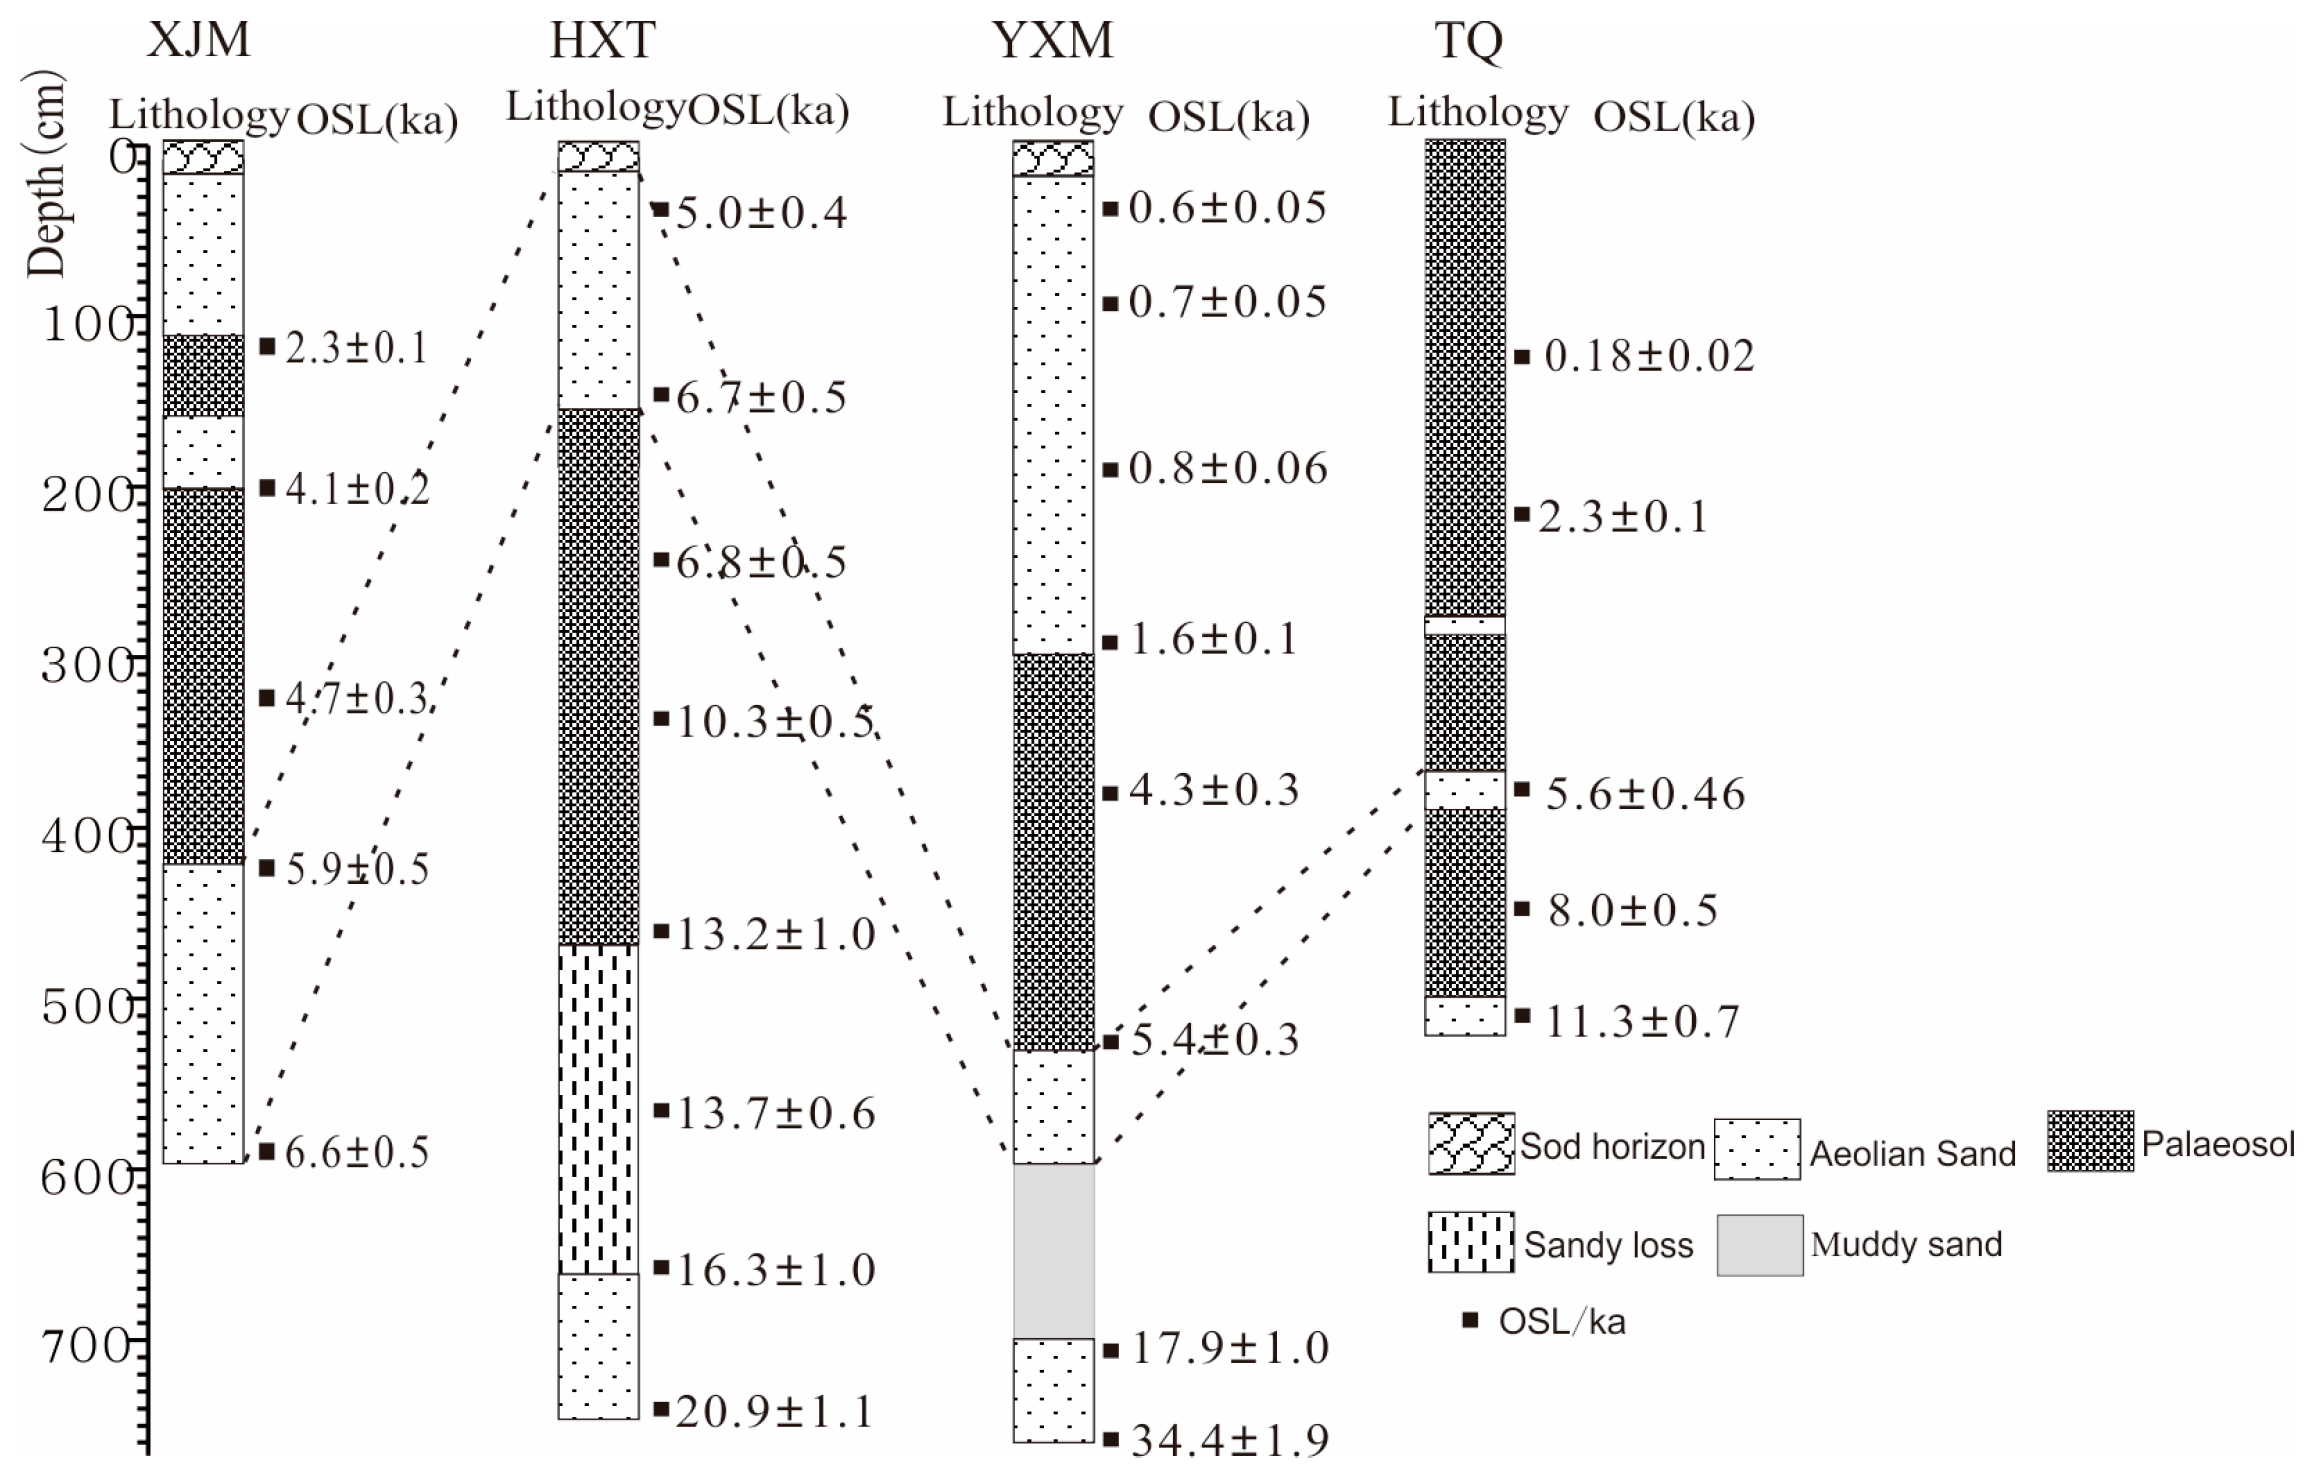
3.1. Optically Stimulated Luminescence (OSL) Dating
3.2. Measurements of Geochemical Elements in the Horqin Sandy Land
3.3. Holocene Lacustrine, Stalagmite, Loess, and Aeolian Records from the EASM Boundary
3.4. The Munsell Soil Color Charts
4. Results
4.1. Chronology and Stratigraphy
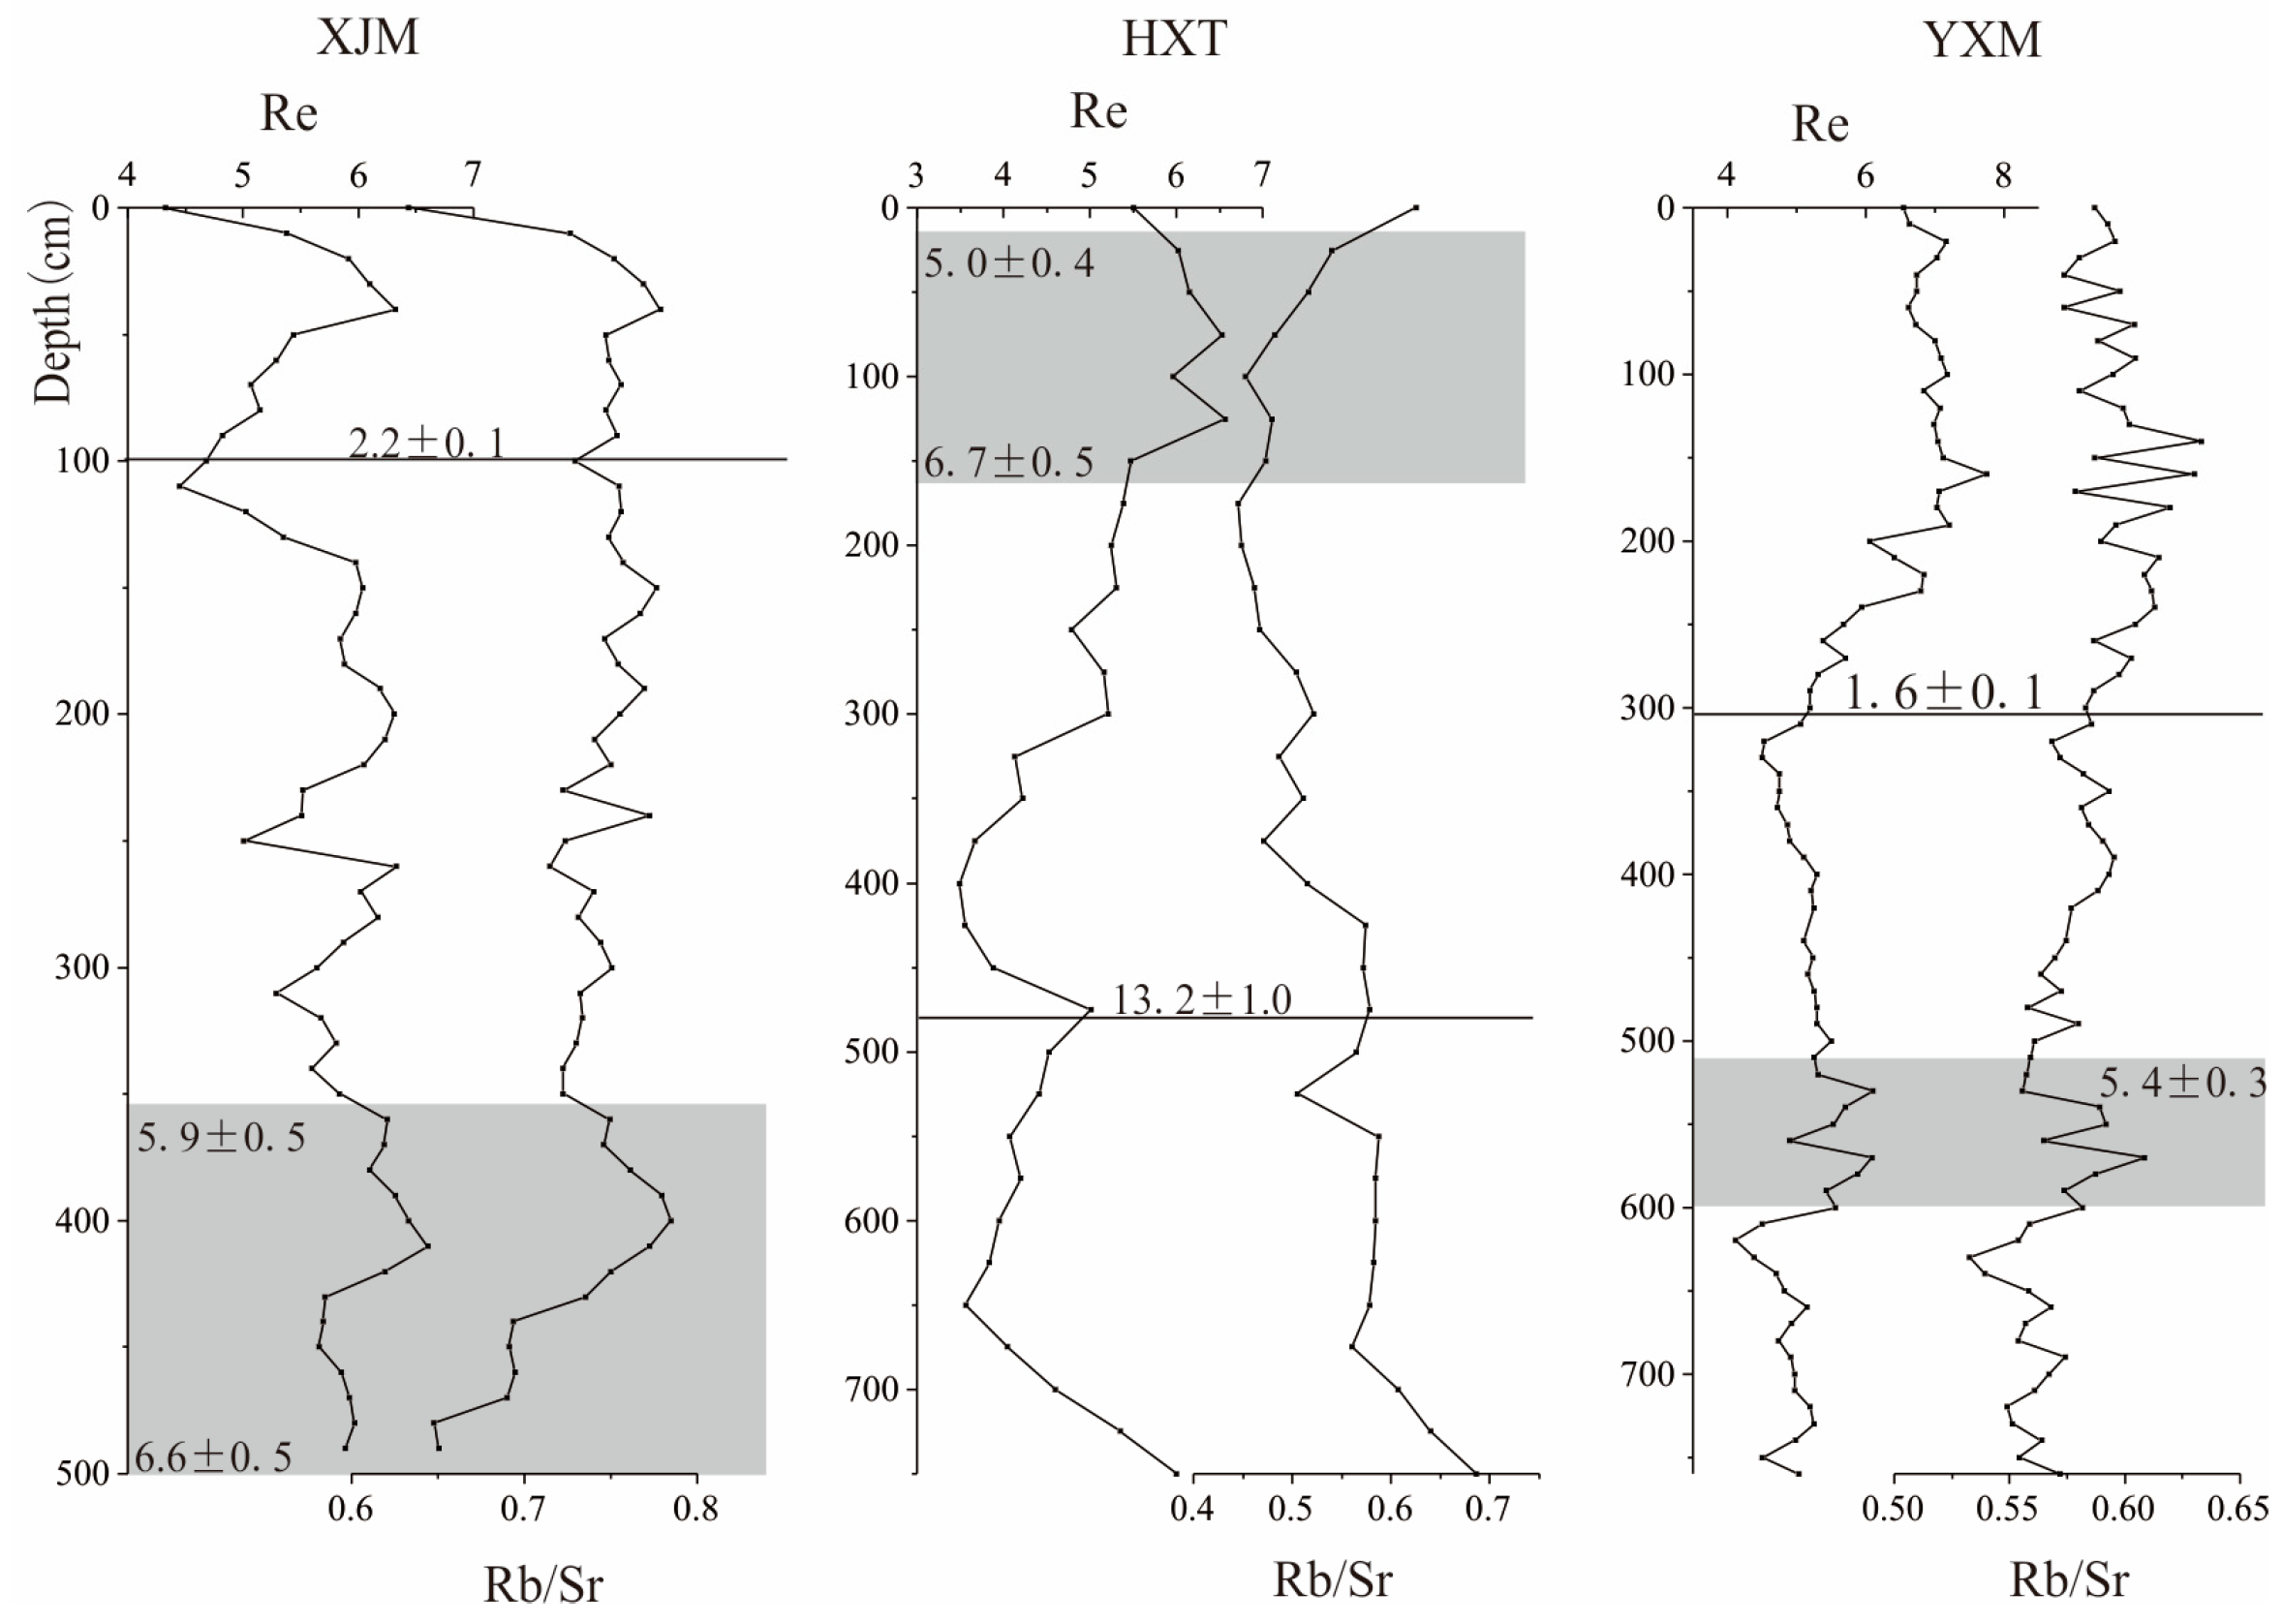
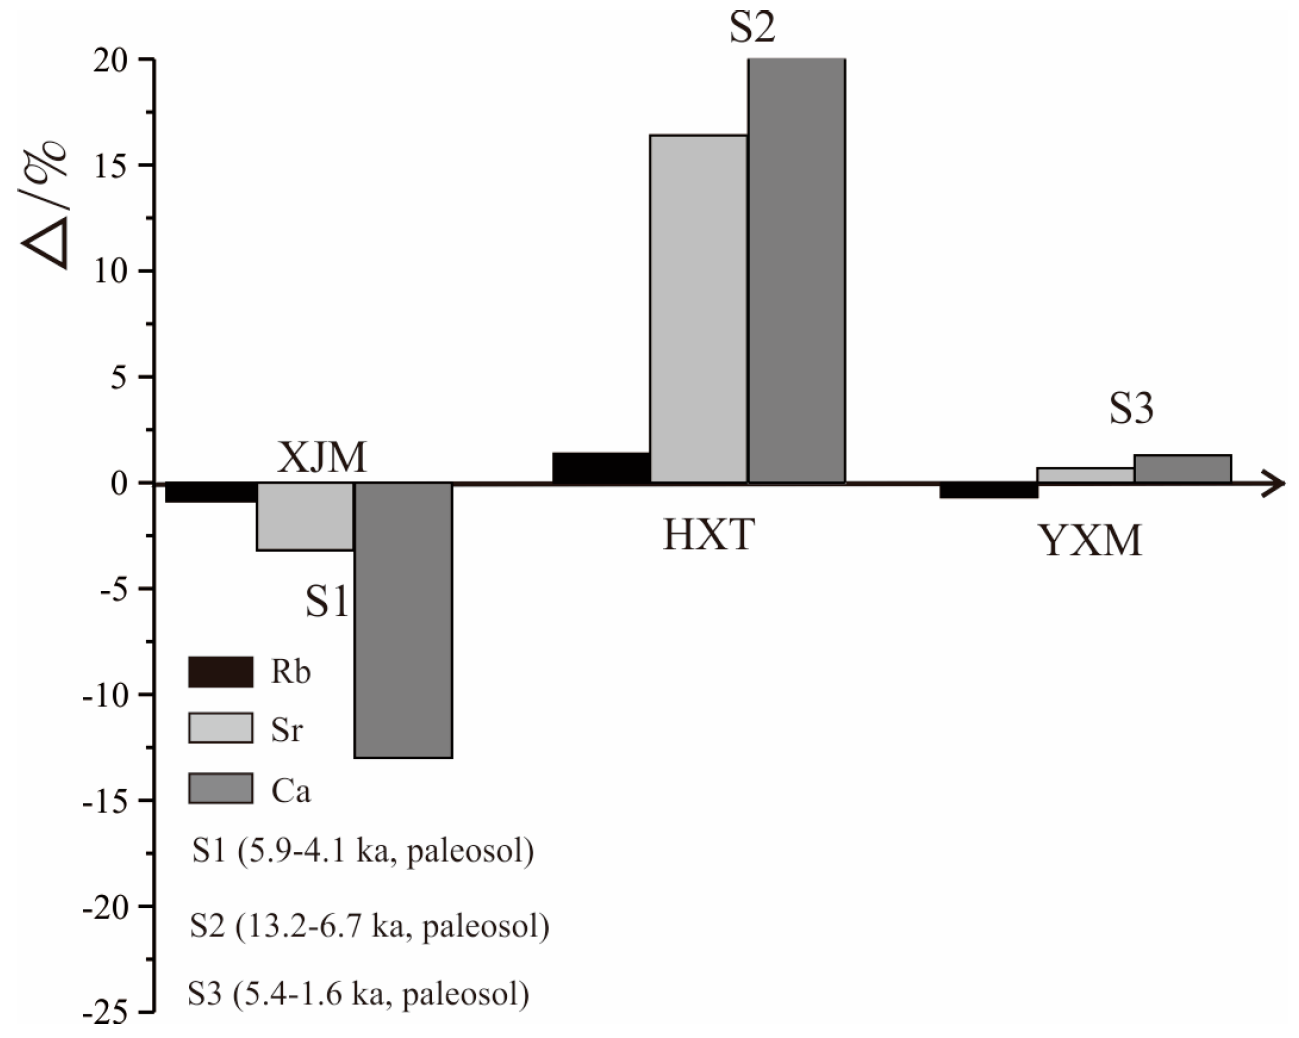
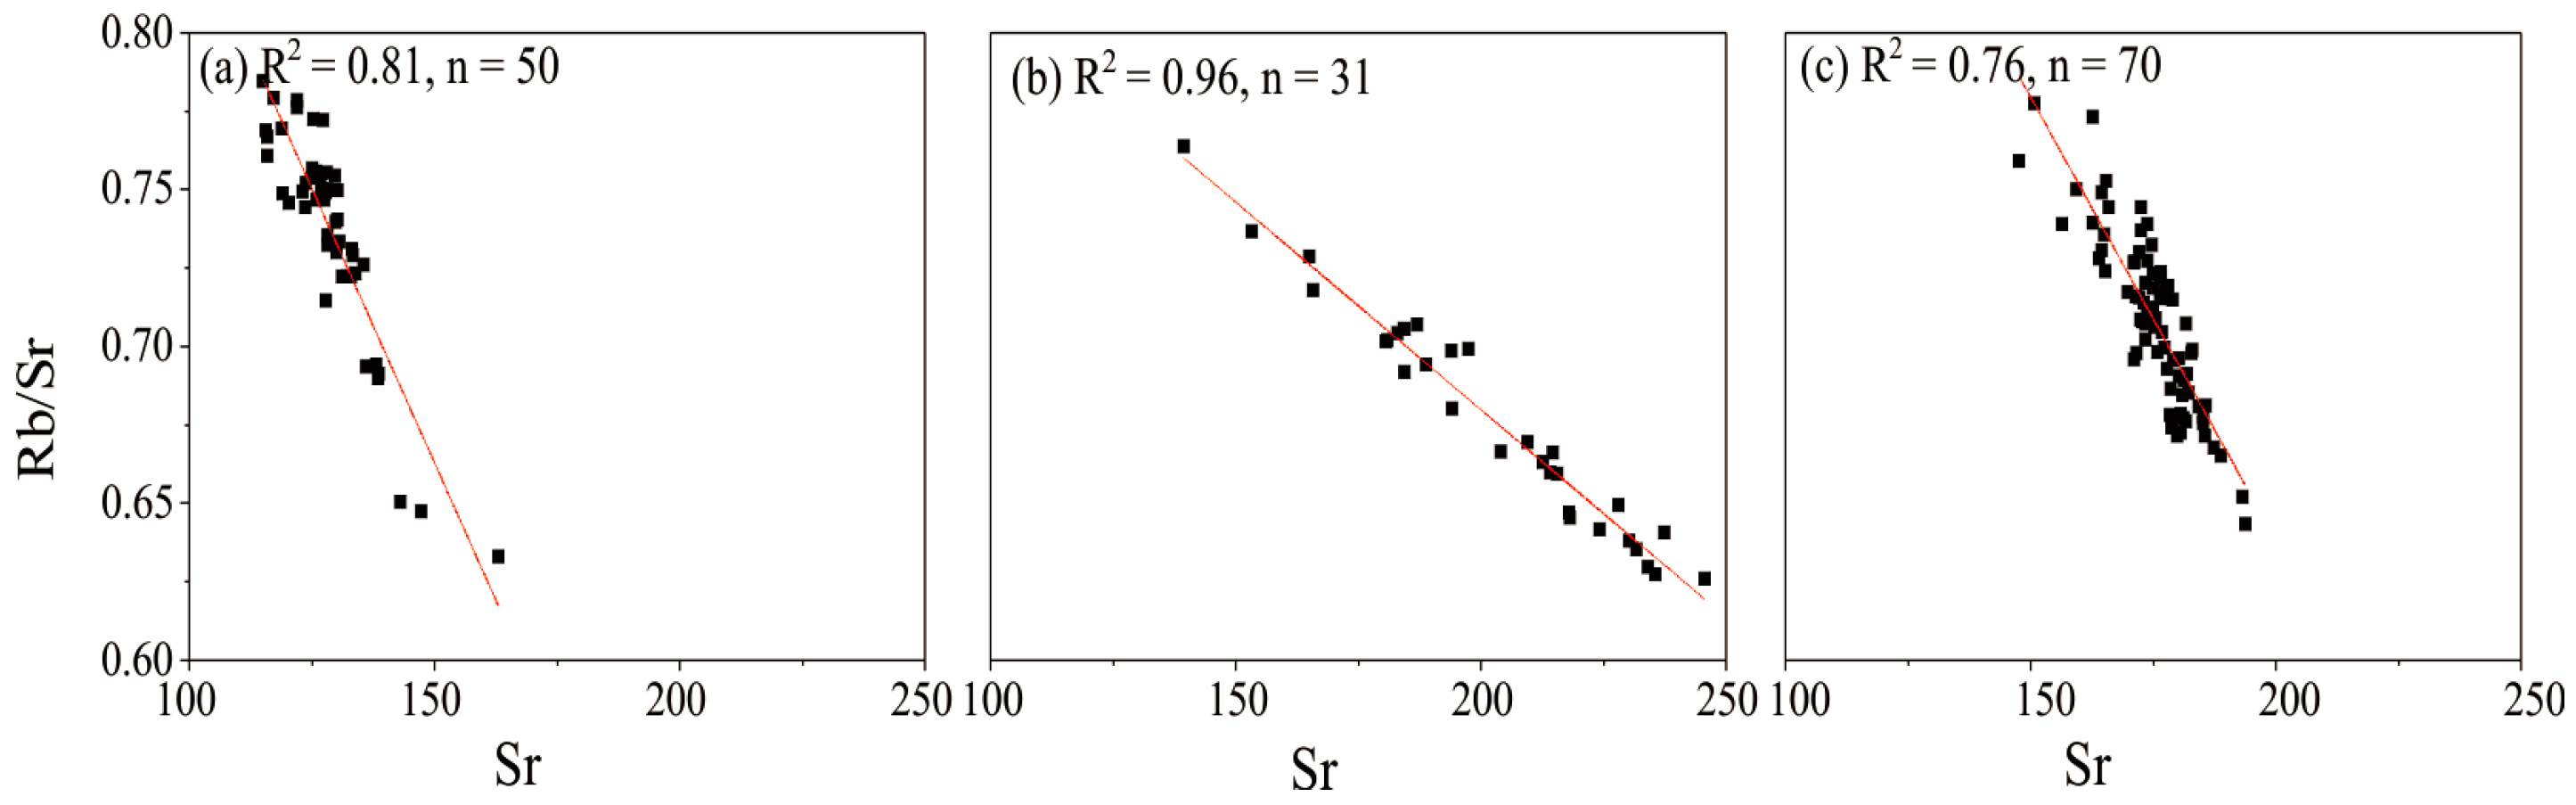
4.2. Arid Reconstruction and Rb/Sr Ratio
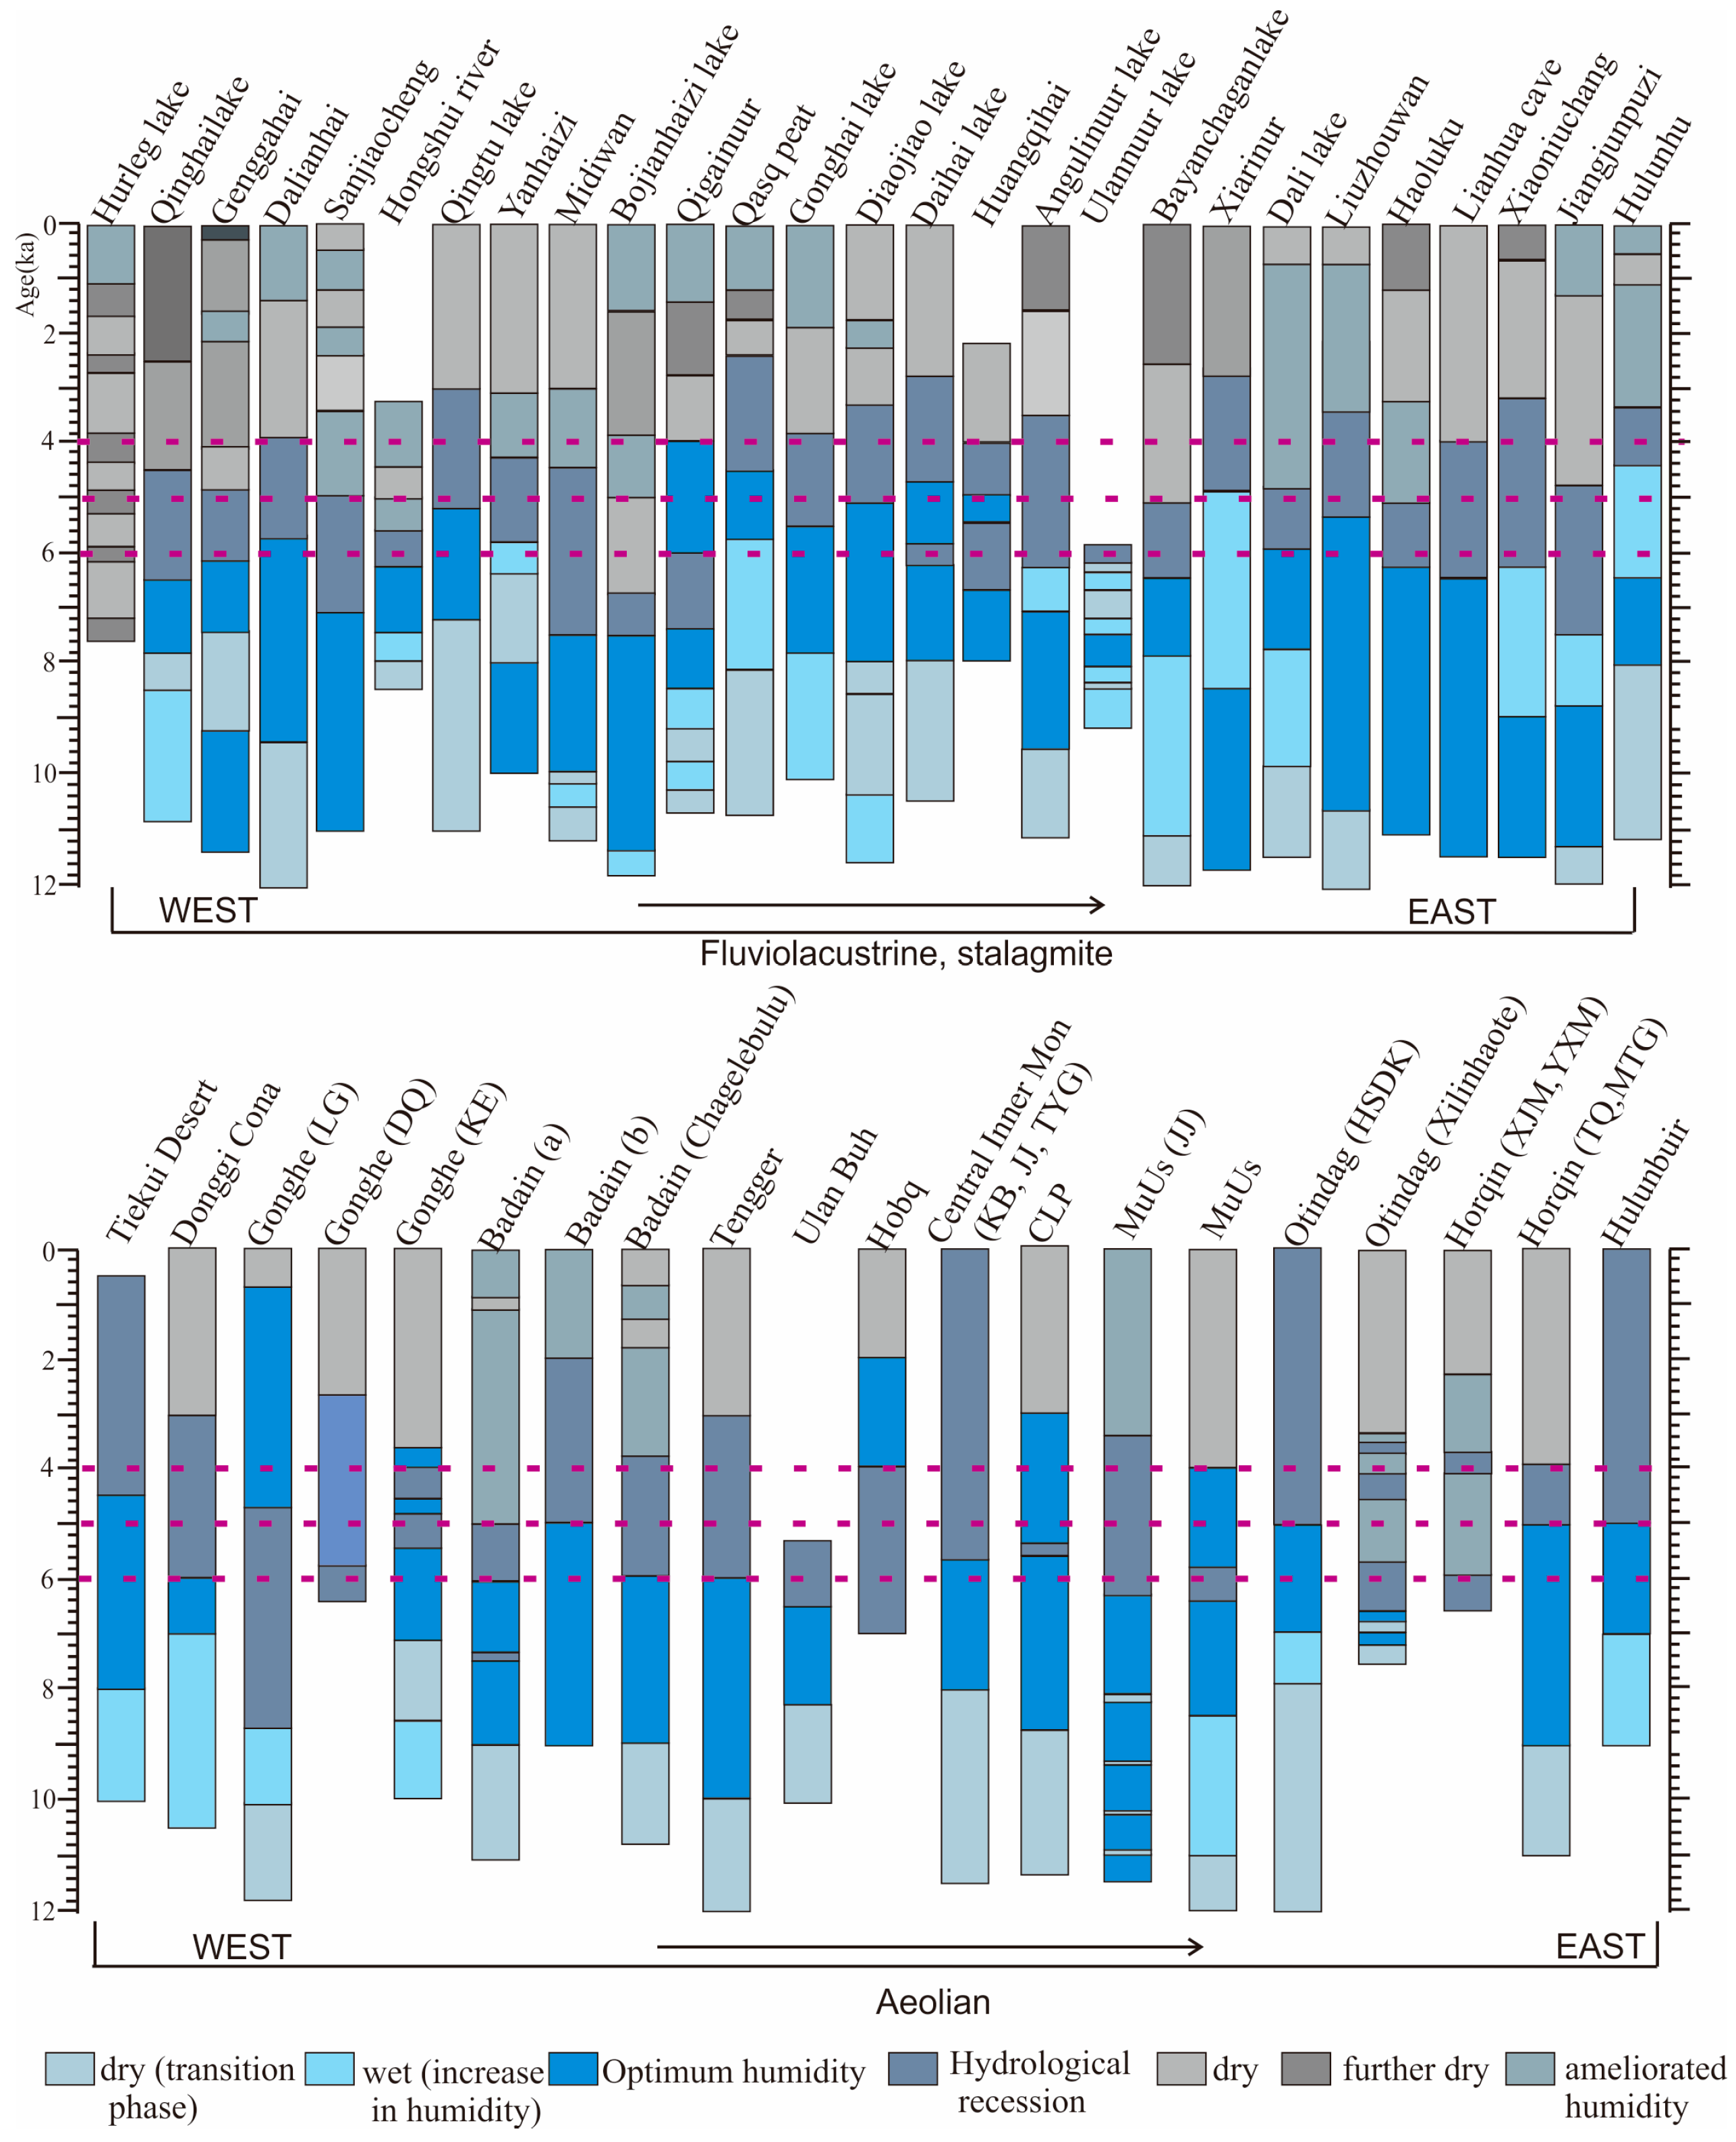
4.3. Holocene Hydrological Changes Indicated by Fluvial-Lacustrine and Aeolian Records
5. Discussion
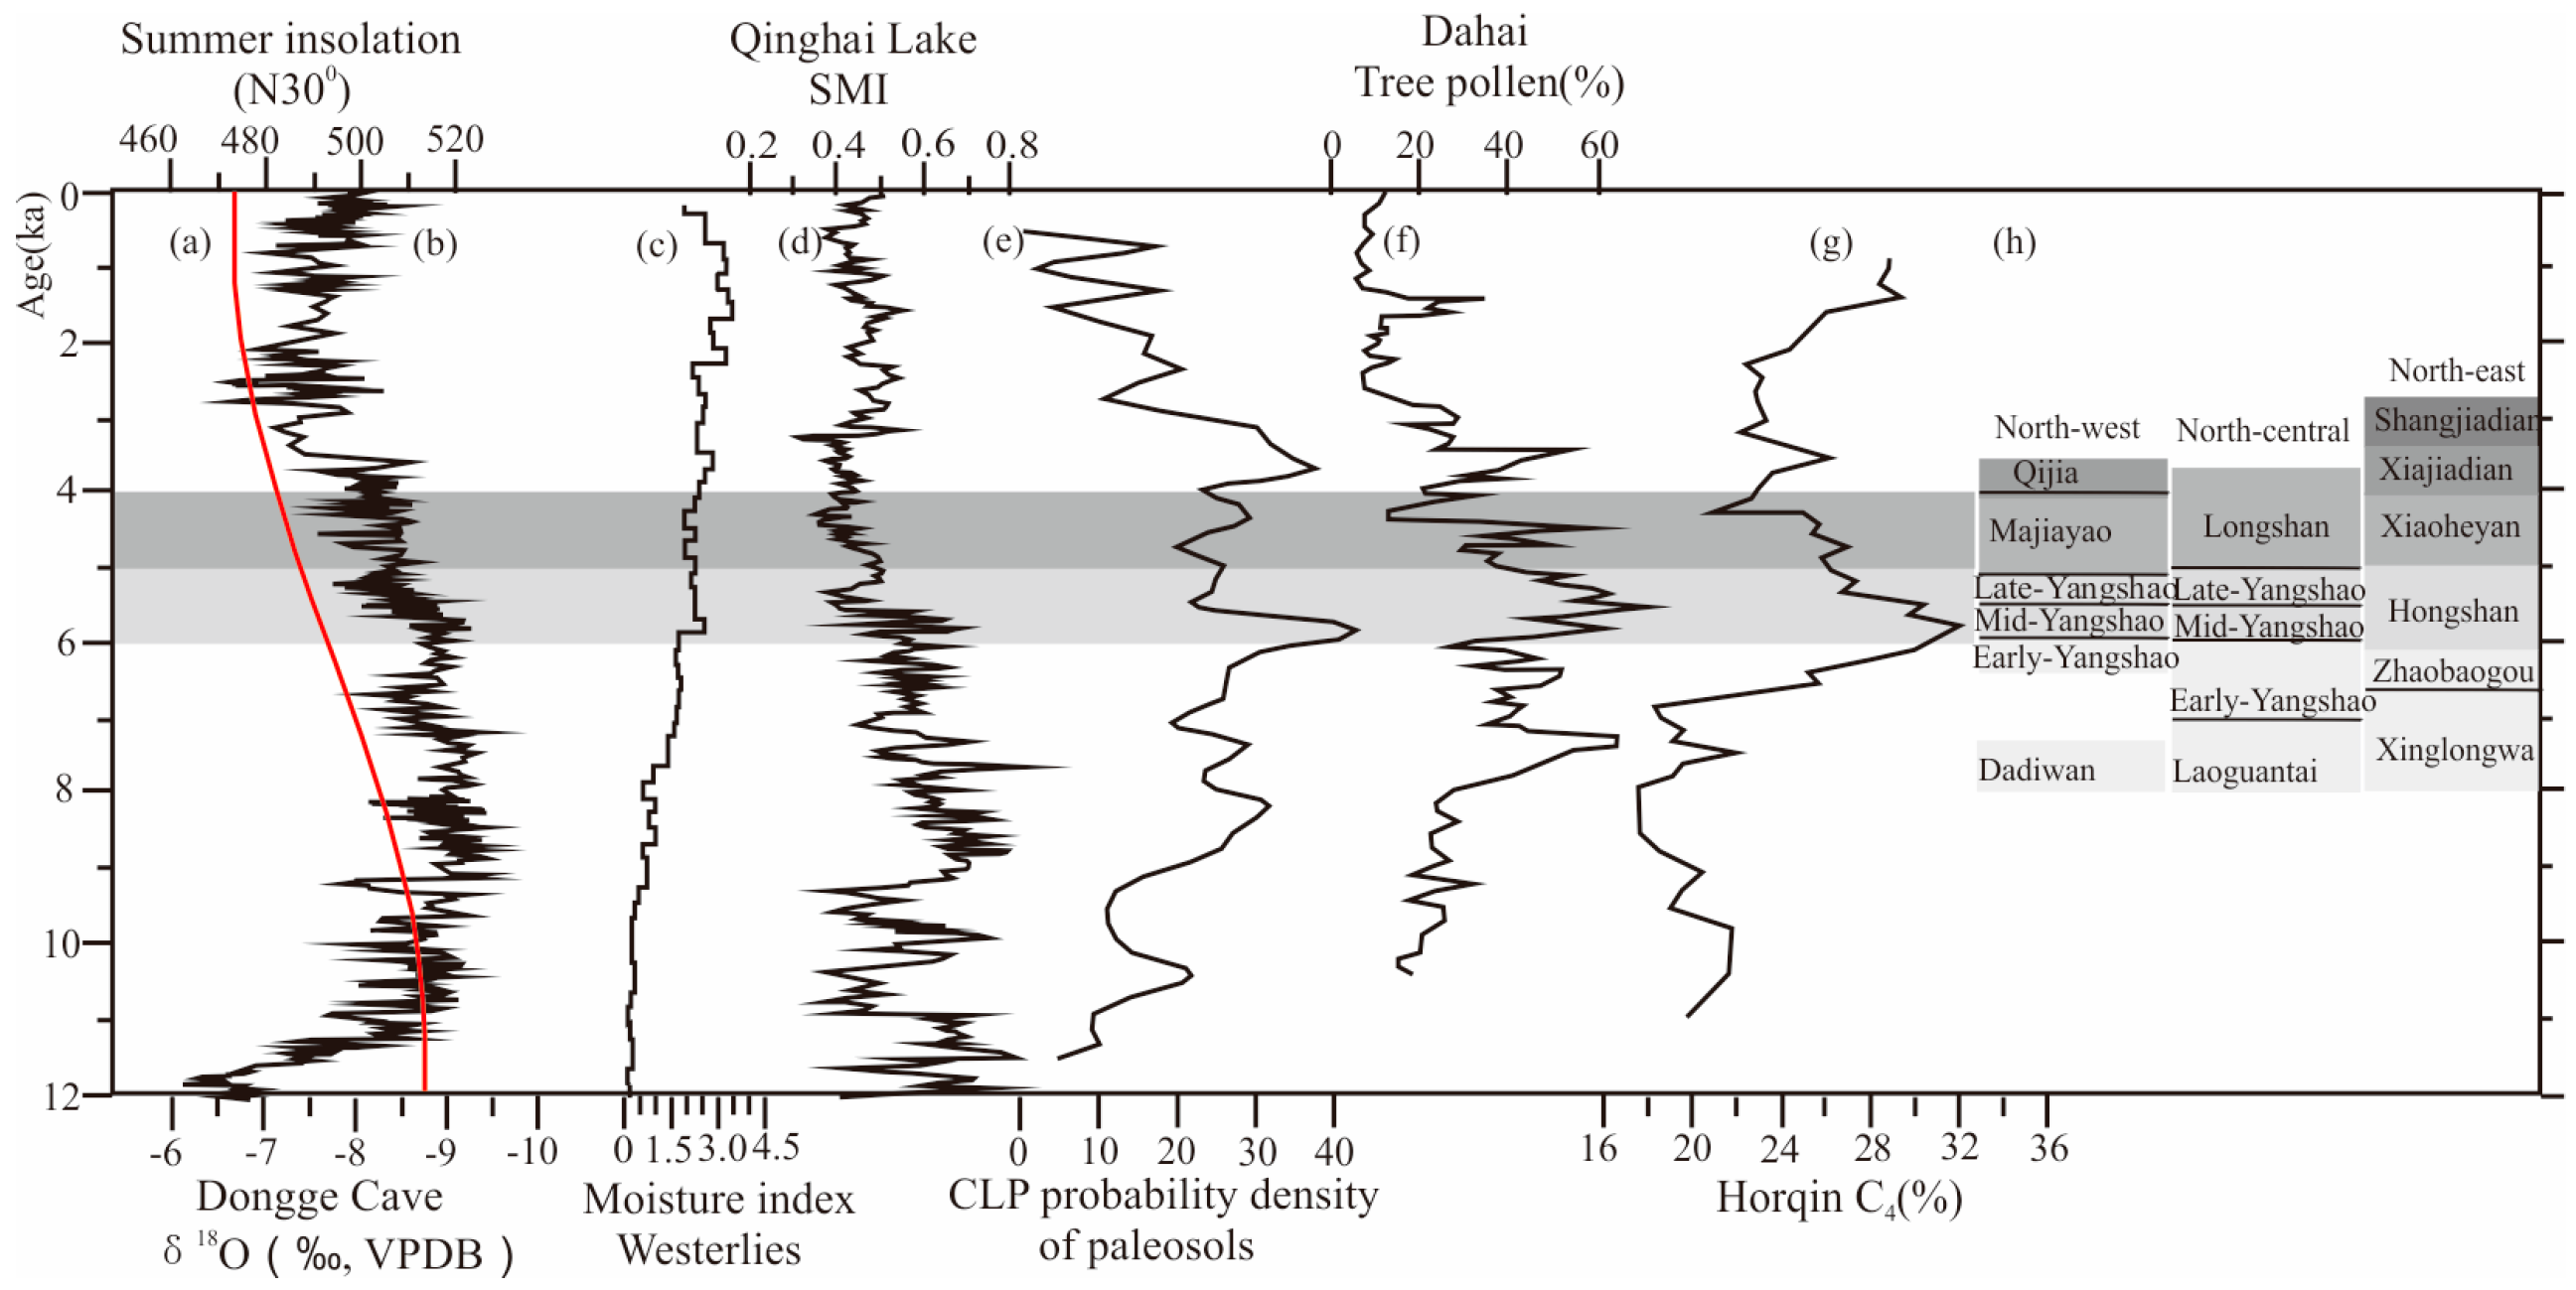
5.1. Asynchronous Onset of Mid-Holocene Moisture Decline
5.2. Possible Mechanism for Holocene Hydroclimate Change
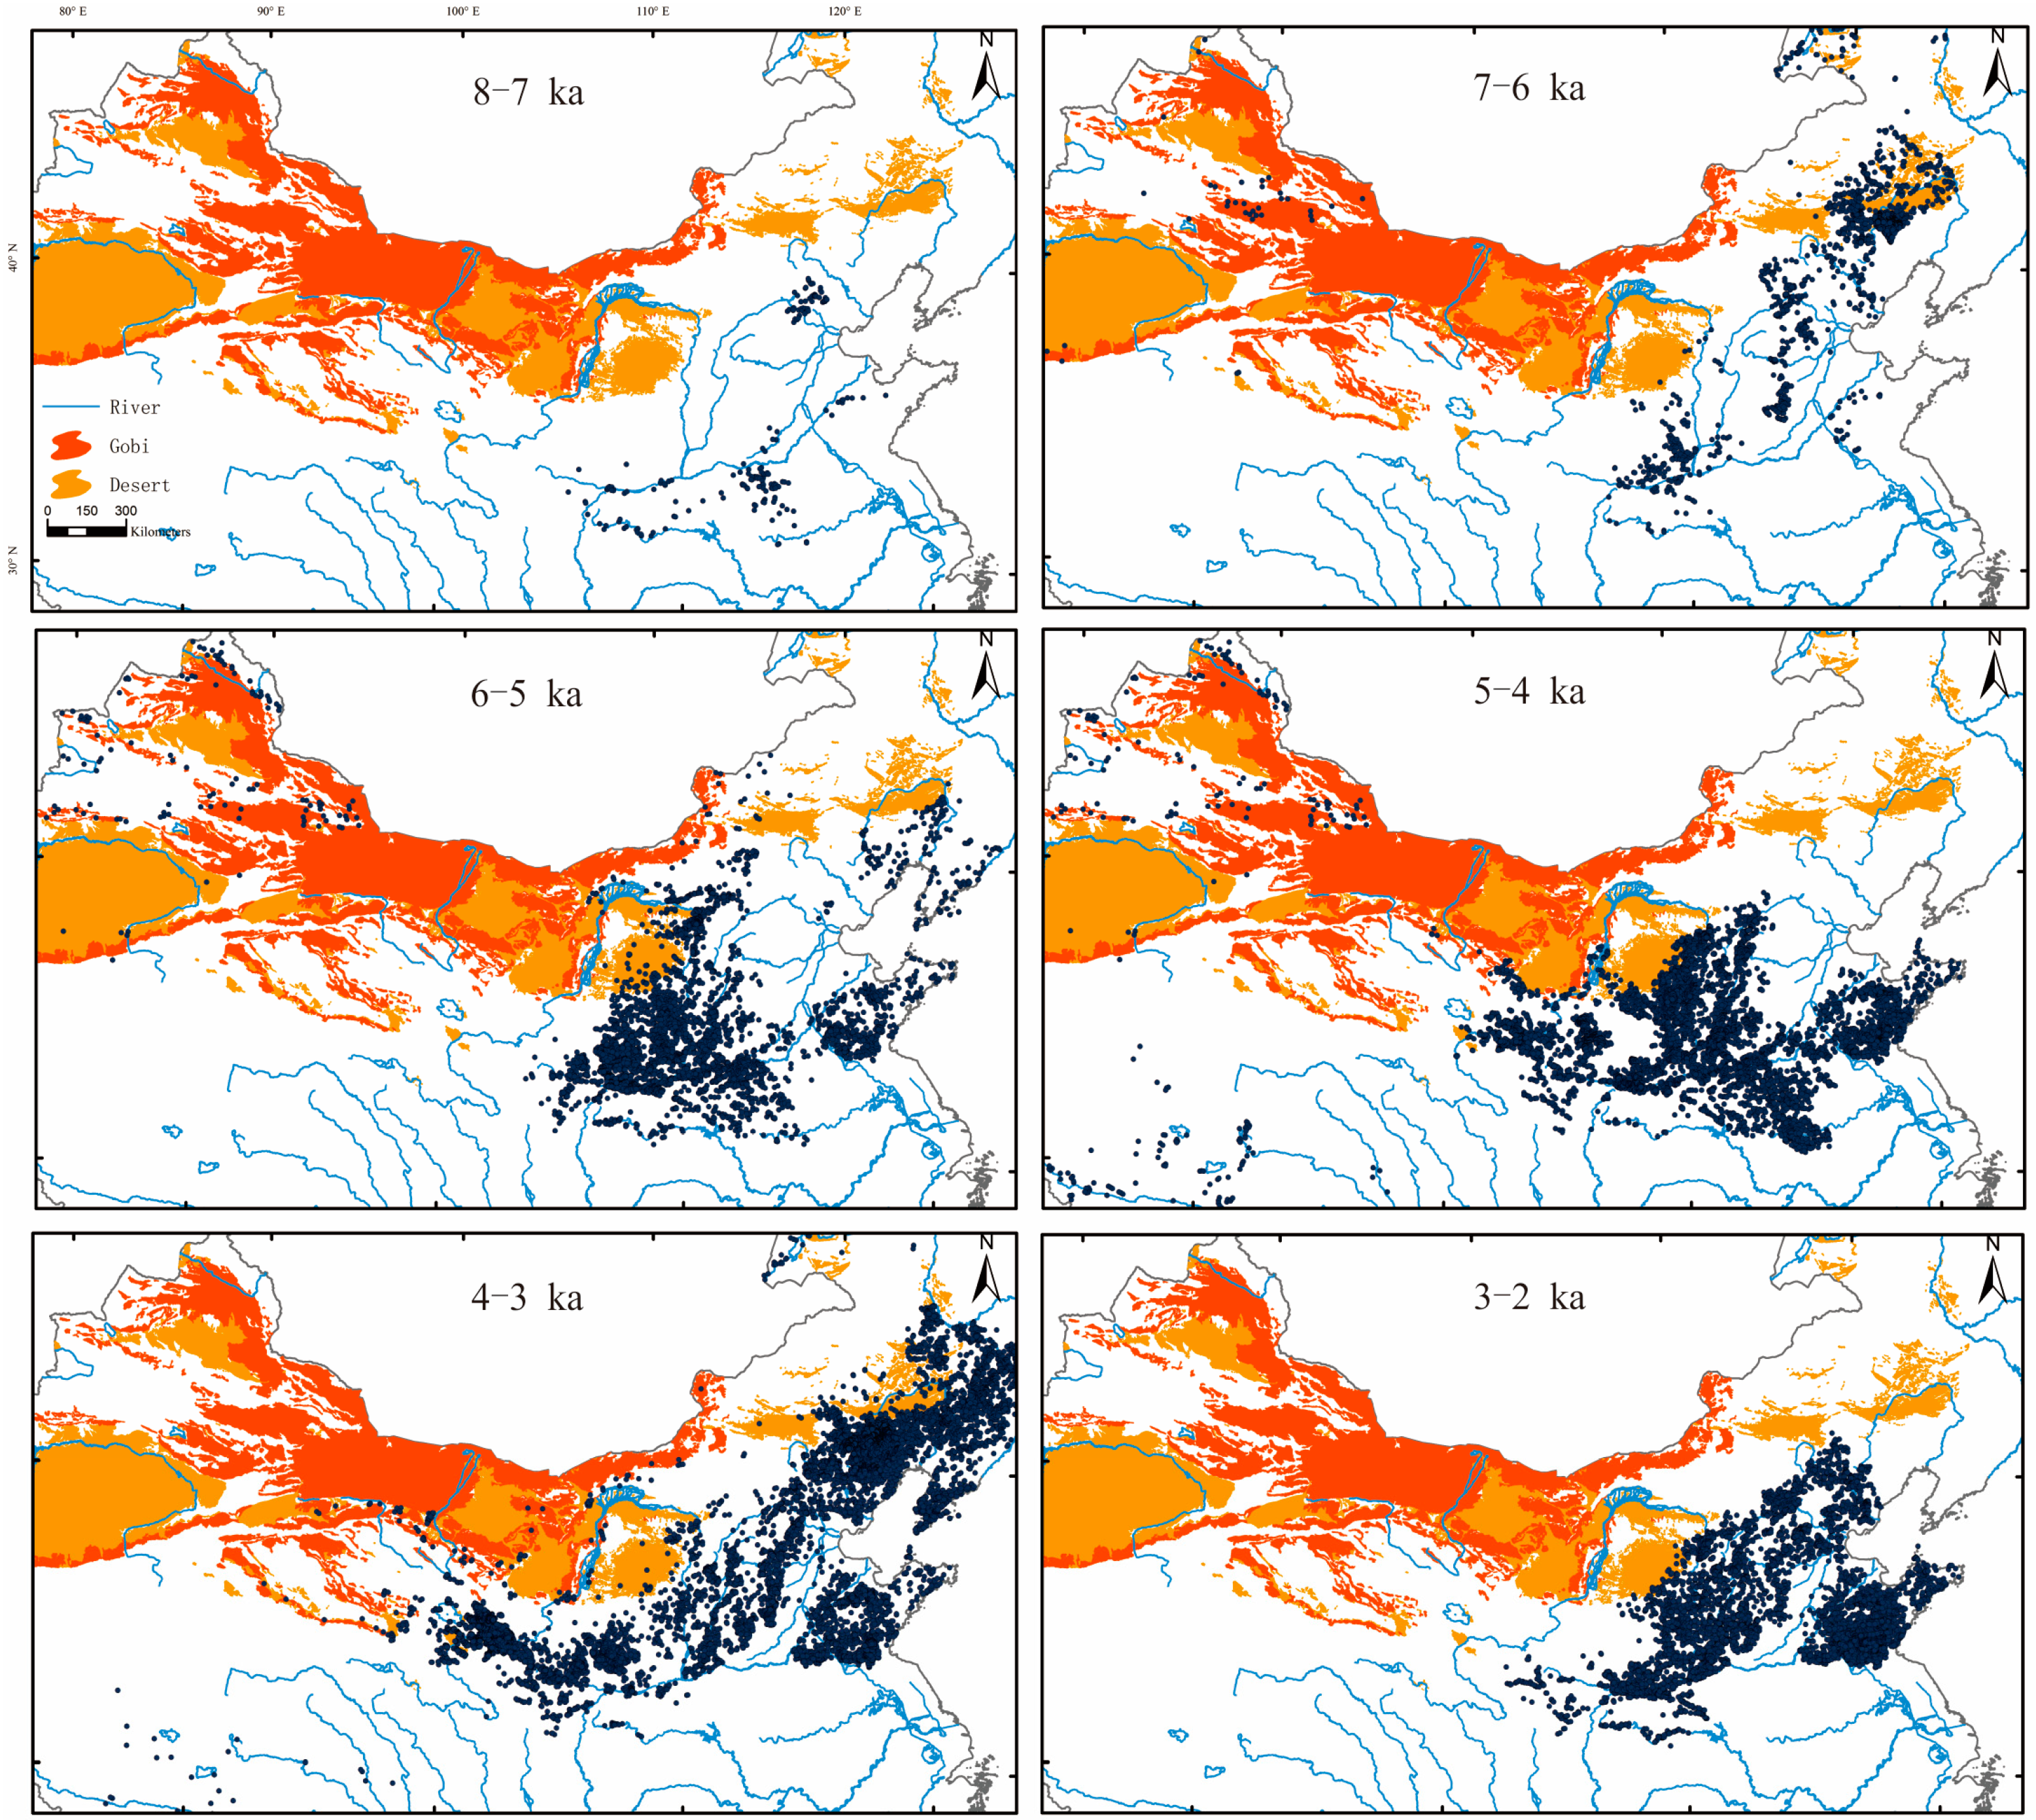
5.3. Influence of Hydrographic Recession on Neolithic Culture’s Development
6. Conclusions
Author Contributions
Funding
Acknowledgments
Conflicts of Interest
References
- Childe, V.G. The urban revolution. Town Plan. Rev. 1950, 21, 3–17. [Google Scholar] [CrossRef]
- Liu, L.; Duncan, N.A.; Chen, X.C.; Zhao, H.; Ji, P. Changing Patterns of Plant-based Food Production During the Neolithic and Early Bronze Age in Central-south Inner Mongolia. Quat. Int. 2016, 419, 36–53. [Google Scholar] [CrossRef]
- Dodson, J.R.; Li, X.Q.; Zhou, X.Y.; Zhao, K.L.; Sun, N.; Atahan, P. Origin and spread of wheat in China. Quat. Sci. Rev. 2013, 72, 108–111. [Google Scholar] [CrossRef]
- Crawford, G. Agricultural origins in north China pushed back to the Pleistocenee Holocene boundary. Proc. Natl. Acad. Sci. USA 2009, 106, 7271–7272. [Google Scholar] [CrossRef] [PubMed]
- Zhao, Z.J. The process of origin of agriculture in China: Archaeological evidence from flotation results. Quat. Sci. 2014, 34, 73–84. (In Chinese) [Google Scholar]
- Sandweiss, D.H.; Maasch, K.A.; Anderson, D.G. Transitions in the mid-Holocene. Science 1999, 283, 499–500. [Google Scholar] [CrossRef]
- Mayewski, P.A.; Rohling, E.E.; Stager, J.C.; Karlen, W.; Maasch, K.A.; Meeker, L.; Meyerson, E.A.; Gasse, F.; Kre veld, S.V.; Holmgren, K.; et al. Holocene climate variability. Quat. Res. 2004, 62, 243–255. [Google Scholar] [CrossRef]
- Marchant, R.; Hooghiemstra, H. Rapid environmental change in African and South American tropics around 4000 years before present: A review. Earth Sci. Rev. 2004, 66, 217–260. [Google Scholar] [CrossRef]
- Drysdale, R.; Zanchetta, G.; Hellstrom, J.; Maas, R.; Fallick, A.; Pickett, M.; Cartwright, I.; Piccini, L. Late Holocene drought responsible for the collapse of Old World civilizations is recorded in an Italian cave flowstone. Geology 2006, 34, 101–104. [Google Scholar] [CrossRef]
- Marshall, M.H.; Lamb, H.F.; Huws, D.; Davies, S.J.; Bates, R.; Bloemendal, J.; Boyle, J.; Leng, M.J.; Umer, M.; Bryant, C. Late Pleistocene and Holocene drought events at Lake Tana, the source of the Blue Nile. Glob. Planet Chang. 2011, 78, 147–161. [Google Scholar] [CrossRef]
- Prasad, V.; Farooqui, A.; Sharma, A.; Phartiyal, B.; Chakraborty, S.; Bhandari, S.; Raj, R.; Singh, A. Mid-late Holocene monsoonal variations from mainland Gujarat, India: A multi-proxy study for evaluating climate culture relationship. Palaeogeogr. Palaeoclimatol. Palaeoecol. 2014, 397, 38–51. [Google Scholar] [CrossRef]
- Leipe, C.; Demske, D.; Tarasov, P.E.; HIMPAC Project Members. A Holocene pollen record from the northwestern Himalayan lake Tso Moriri: Implications for palaeoclimatical and archaeological research. Quat. Int. 2014, 348, 93–112. [Google Scholar] [CrossRef]
- Lillios, K.T.; Blanco-Gonzalez, A.; Drake, B.L.; Lopez-Saez, J.A. Mid-late Holocene climate, demography, and cultural dynamics in Iberia: A multi-proxy approach. Quat. Sci. Rev. 2016, 135, 138–153. [Google Scholar] [CrossRef]
- Bond, G.; Kromer, B.; Beer, J.; Muscheler, R.; Evans, M.N.; Showers, W.; Hoffmann, S.; Lotti-Bond, R.; Hajdas, I.; Bonani, G. Persistent solar influence in North Atlantic climate during the Holocene. Science 2001, 294, 2130–2136. [Google Scholar] [CrossRef] [PubMed]
- Wright, R. The Ancient Indus: Urbanism Economy and Society, Case Studies in Early Societies; Cambridge University Press: New York, NY, USA, 2010. [Google Scholar]
- De Menocal, P.B. Cultural responses to climate change during the late Holocene. Science 2001, 292, 667–673. [Google Scholar] [CrossRef]
- Jin, G.Y.; Liu, T.S. Mid-Holocene climate change in North China, and the effect on cultural development. Chin. Sci. Bull. 2002, 47, 408–413. [Google Scholar] [CrossRef]
- Wu, W.X.; Liu, T.S. Possible role of the ‘Holocene Event 3’ on the collapse of Neolithic Cultures around the Central Plain of China. Quat. Int. 2004, 117, 153–166. [Google Scholar]
- Liu, L.; Chen, X.C.; Lee, Y.K.; Wright, H.; Rosen, A. Settlement patterns and development of social complexity in the Yiluo region, North China. J. Field Archaeol. 2004, 29, 75–100. [Google Scholar] [CrossRef]
- Liu, L.; Duncan, N.A.; Chen, X.C.; Ji, P. Plant-based subsistence strategies and development of complex societies in Neolithic Northeast China: Evidence from grinding stones. J. Archaeol. Sci. Rep. 2016, 7, 247–261. [Google Scholar] [CrossRef]
- Dong, G.H.; Jia, X.; An, C.B.; Chen, F.H.; Zhao, Y.; Tao, S.C.; Ma, M.M. Mid-Holocene climate change and its effect on prehistoric cultural evolution in eastern Qinghai Province, China. Quat. Res. 2012, 77, 23–30. [Google Scholar] [CrossRef]
- Liu, F.G.; Feng, Z.D. A dramatic climatic transition at ~4000 cal. yr BP and its cultural responses in Chinese cultural domains. Holocene 2012, 22, 1181–1197. [Google Scholar] [CrossRef]
- Li, F.; Wu, L.; Zhu, C.; Zheng, C.G.; Sun, W.; Wang, X.H.; Shao, S.X.; Zhou, Y.; He, T.T.; Li, S.Y. Spatial–temporal distribution and geographic context of Neolithic cultural sites in the Hanjiang River Basin, Southern Shaanxi, China. J. Archaeol. Sci. 2013, 40, 3141–3152. [Google Scholar] [CrossRef]
- Jia, X.; Sun, Y.G.; Wang, L.; Sun, W.F.; Zhao, Z.J.; Lee, H.F.; Huang, W.B.; Wu, S.Y.; Lu, H.Y. The transition of human subsistence strategies in relation to climate change during the Bronze Age in the West Liao River Basin, Northeast China. Holocene 2016, 26, 781–789. [Google Scholar] [CrossRef]
- An, C.B.; Feng, Z.D.; Tang, L.Y. Environmental change and cultural response between 8000 and 4000 cal yr B.P. in the western Loess Plateau, northwest China. J. Quat. Sci. 2004, 19, 529–535. [Google Scholar] [CrossRef]
- Liu, L.; Chen, X. The Archaeology of China: From the Late Palaeolithic to the Early Bronze Age; Cambridge University Press: Cambridge, UK, 2012. [Google Scholar]
- Yuan, Y.Y. Cultural evolution and spatial-temporal distribution of archaeological sites from 9.5–2.3 ka BP in the Yan-Liao region, China. J. Geogr. Sci. 2019, 29, 449–464. [Google Scholar] [CrossRef]
- Morrison, K.D. Archaeology: Failure and how to avoid it. Science 2006, 440, 752–754. [Google Scholar]
- O’Sullivan, P. The ‘collapse’ of civilizations: What palaeoenvironmental reconstruction cannot tell us, but anthropology can. Holocene 2008, 18, 45–55. [Google Scholar] [CrossRef]
- Gasse, F.; Van Campo, E. Abrupt post-glacial climate events in West Asia and North Africa monsoon domains. Earth Planet. Sci. Lett. 1994, 126, 435–456. [Google Scholar] [CrossRef]
- Sarkar, S.; Prasad, S.; Wilkes, H.; Riedel, N.; Stebich, M.; Basavaiah, N.; Sachse, D. Monsoon source shifts during the drying mid-Holocene: Biomarker isotope based evidence from the core ’monsoon zone’ (CMZ) of India. Quat. Sci. Rev. 2015, 123, 144–157. [Google Scholar] [CrossRef]
- deMenocal, P.B.; Ortiz, J.; Guilderson, T.; Adkins, J.; Sarnthein, M.; Baker, L.; Yarusinsky, M. Abrupt onset and termination of the Africa Humid period: Rapid climate responses to gradual insolation forcing. Quat. Sci. Rev. 2000, 19, 347–361. [Google Scholar] [CrossRef]
- Magny, M.; Haas, J.N. A major widespread climatic change around 5300 cal. yr BP at the time of Alpine Iceman. J. Quat. Sci. 2004, 19, 423–430. [Google Scholar] [CrossRef]
- Jimenez-Moreno, G.; Anderson, R.S. Holocene vegetation and climate change recorded in alpine bog sediments from the Borreguiles de la Virgen, Sierra Nevada, southern Spain. Quat. Res. 2012, 77, 44–53. [Google Scholar] [CrossRef]
- Jambrina-Enríquez, M.; Rico, M.; Moreno, A.; Leira, M.; Barnardez, P.; Prego, R.; Recio, C.; Valero-Garces, B.L. Timing of deglaciation and postglacial environ- mental dynamics in NW Iberia: The Sanabria Lake record. Quat. Sci. Rev. 2014, 94, 136–158. [Google Scholar]
- Bond, G.; Showers, W.; Cheseby, M.; Lotti, R.; Almasi, P.; de Menocal, P.; Priore, P.; Cullen, H.; Hajdas, I.; Bonani, G. A pervasive millennial-scale cycle in the North Atlantic Holocene and glacial climates. Science 1997, 294, 2130–2136. [Google Scholar] [CrossRef]
- Baker, R.G.; Bettis, E.A., III; Denniston, R.F.; Gonzalez, L.A. Plant remains, alluvial chronology, and cave speleothem isotopes indicate abrupt Holocene climatic change in Midwestern USA. Glob. Planet. Chang. 2001, 28, 285–291. [Google Scholar] [CrossRef]
- Haug, G.H.; Hughen, K.A.; Sigman, D.M.; Peterson, L.C.; Rohl, U. Southward migration of the intertropical convergence zone through the Holocene. Science 2001, 293, 1304–1308. [Google Scholar] [CrossRef]
- Masson, V.; Vimeux, F.; Jouzel, J.; Morgan, V.; Delmotte, M.; Ciais, P.; Hammer, C.; Johnsen, S.; Lipenkov, V.Y.; Mosley-Thompson, E.; et al. Holocene climate variability in Antarctica based on 11 ice-core isotopic records. Quat. Res. 2000, 54, 348–358. [Google Scholar] [CrossRef]
- Lamy, F.; Rühlemann, C.; Hebbeln, D.; Wefer, G. High-and low-latitude climate control on the position of the southern Peru-Chile Current during the Holocene. Palaeogeogr. Palaeoclimatol. Palaeoecol. 2002, 17, 16/1–16/10. [Google Scholar] [CrossRef]
- Cai, Y.; Zhang, H.; Cheng, H.; An, Z.S.; Edwards, R.L.; Wang, X.F.; Tan, L.C.; Liang, F.Y.; Wang, J.; Kelly, M. The Holocene Indian monsoon variability over the southern Tibetan Plateau and its teleconnections. Earth Planet Sci. Lett. 2012, 335–336, 135–144. [Google Scholar] [CrossRef]
- Thompson, L.G.; Mosley-Thompson, E.; Davis, M.E.; Bolzan, J.F.; Dai, J.; Klein, L.; Yao, T.; Wu, X.; Xie, Z.; Gundestrup, N. Holocene-Late Pleistocene climatic ice core records from Qinghai-Tibetan Plateau. Science 1989, 246, 474–477. [Google Scholar] [CrossRef]
- Cai, Y.J.; Zhang, M.L.; Peng, Z.C.; Lin, Y.S.; An, Z.S.; Zhang, Z.F.; Cao, Y.N. The δ18O variation of a stalagmite from Qixingcave, Guizhou Province and indicated climate change during Holonece. Chin. Sci. Bull. 2001, 40, 1904–1907. [Google Scholar] [CrossRef]
- Zhou, W.; Yu, X.; Jull, A.J.T.; Burr, G.; Xiao, J.Y.; Lu, X.; Xian, F. High-resolution evidence from southern China of an early Holocene optimum and a mid-Holocene dry event during the past 18,000 years. Quat. Res. 2004, 62, 39–48. [Google Scholar] [CrossRef]
- Wang, Y.J.; Cheng, H.; Edwards, R.L.; He, Y.Q.; Kong, X.G.; An, Z.S.; Wu, J.Y.; Kelly, M.J.; Dykoski, C.A.; Li, X.D. The Holocene Asian monsoon: Links to solar changes and North Atlantic climate. Science 2005, 308, 854–857. [Google Scholar] [CrossRef]
- Dykoski, C.A.; Edwards, R.L.; Cheng, H.; Yuan, D.X.; Cai, Y.J.; Zhang, M.L.; Lin, Y.S.; Qing, J.M.; An, Z.S.; Revenaugh, J. A high resolution, absolute-dated Holocene and deglacial Asian monsoon record from Dongge Cave, China. Earth Planet Sci. Lett. 2005, 233, 71–86. [Google Scholar] [CrossRef]
- Li, Y.P.; Ma, C.M.; Zhou, B.; Cui, A.N.; Zhu, C.; Huang, R.; Zheng, C.G. Environmental processes derived from peatland geochemistry since the last deglaciation in Dajiuhu, Shennongjia, Central China. Boreas 2016, 45, 423–438. [Google Scholar] [CrossRef]
- Goldsmith, Y.; Broecker, W.S.; Xu, H.; Polissar, P.J.; deMenocal, P.B.; Porat, N.; Lan, J.; Cheng, P.; Zhou, W.J.; An, Z. Northward extent of East Asian monsoon covaries with intensity on orbital and millennial timescales. Proc. Natl. Acad. Sci. USA 2017, 114, 1817–1821. [Google Scholar] [CrossRef]
- Goldsmith, Y.; Broecker, W.S.; Xu, H.; Polissar, P.J.; deMenocal, P.B.; Porat, N.; Lan, J.; Cheng, P.; Zhou, W.J.; An, Z. Reply to Liu et al.: East Asian summer monsoon rainfall dominates Lake Dali lake area changes. Proc. Natl. Acad. Sci. USA 2017, 114, 2989–2990. [Google Scholar] [CrossRef]
- Wang, H.P.; Chen, J.H.; Zhang, X.J.; Chen, F.H. Palaeosol development in the Chinese Loess Plateau as an indicator of the strength of the East Asian summer monsoon: Evidence for a mid-Holocene maximum. Quat. Int. 2014, 334, 155–164. [Google Scholar] [CrossRef]
- Bai, Y.J.; Zhang, P.Z.; Gao, T.; Yu, R.Z.; Zhou, P.C.; Cheng, H. The 5400 a BP extreme weakening event of the Asian summer monsoon and cultural evolution. Sci. China Earth Sci. 2017, 60, 1171–1182. [Google Scholar] [CrossRef]
- Shen, J.; Liu, X.Q.; Wang, S.M.; Ryo, M. Palaeoclimatic changes in the Qinghai Lake area during the last 18,000 years. Quat. Int. 2005, 136, 131–140. [Google Scholar]
- Herzschuh, U.; Winter, K.; Wunnemannc, B.; Li, S.J. A general cooling trend on the central Tibetan Plateau throughout the Holocene recorded by the Lake Zigetang pollen spectra. Quat. Int. 2006, 154–155, 113–121. [Google Scholar] [CrossRef]
- Zhao, Y.; Yu, Z.C.; Chen, F.H.; Zhang, J.W.; Yang, B. Vegetation response to Holocene climate change in monsoon-influenced region of China. Earth Sci. Rev. 2009, 97, 242–256. [Google Scholar] [CrossRef]
- Zhao, Y.; Yu, Z.C.; Chen, F.H. Spatial and temporal patterns of Holocene vegetation and climate changes in arid and semi-arid China. Quat. Int. 2009, 194, 6–18. [Google Scholar] [CrossRef]
- Wang, W.; Feng, Z.D. Holocene moisture evolution across the Mongolian Plateau and its surrounding areas: A synthesis of climatic records. Earth Sci. Rev. 2013, 122, 38–57. [Google Scholar] [CrossRef]
- Guo, L.C.; Xiong, S.F.; Ding, Z.L.; Jin, G.Y.; Wu, J.B.; Ye, W. Role of the mid Holocene environmental transition in the decline of late Neolithic cultures in the deserts of NE China. Quat. Sci. Rev. 2018, 190, 98–113. [Google Scholar] [CrossRef]
- Morrill, C.; Overpeck, J.T.; Cole, J.E. A synthesis of abrupt changes in the Asian summer monsoon since the last deglaciation. Holocene 2003, 13, 465–476. [Google Scholar] [CrossRef]
- Shanahan, T.M.; Mckay, N.P.; Hughen, K.A.; Overpeck, J.T.; Ottobliesner, B.; Heil, C.W.; King, J.; Scholz, C.A.; Peck, J. The time-transgressive termination of the African Humid Period. Nat. Geos. 2015, 8, 140–144. [Google Scholar] [CrossRef]
- Roman, H.S.F.; Herrs, C. Staaten der Frühzeit—Ursprünge und Herrschaftsformen (Translated by Zhao Ronghuan); Peking University Press: Beijing, China, 1998; pp. 1–395. (In Chinese) [Google Scholar]
- Wu, W.X.; Zheng, H.B.; Hou, M.; Ge, Q.S. The 5.5 cal ka BP climate event, population growth, circumscription and the emergence of the earliest complex societies in China. Sci. China Earth Sci. 2018, 61, 134–148. [Google Scholar] [CrossRef]
- Hosner, D.; Wagner, M.; Tarasov, P.E.; Chen, X.C.; Leipe, C. Spatiotemporal distribution patterns of archaeological sites in China during the Neolithic and Bronze Age: An overview. Holocene 2016, 26, 1576–1593. [Google Scholar] [CrossRef]
- Wu, W.X.; Liu, T.S. 5500a BP Climatic event and its implications for the emergence of civilizations in Egypt and Mesopotamia and Neolichic Cultural development in China. Earth Sci. Front. 2002, 9, 155–163. (In Chinese) [Google Scholar]
- Zhang, X.S. Editorial Committee of Vegetation Map of China Chinese Academy of Sciences (Ed.), Vegetation Map of the People’s Republic of China (1:1,000,000), Vegetation Map of China and its Geographic Pattern—Illustration of the Vegetation Map of The People’s Republic of China (1:1 000 000); Geological Publishing House: Beijing, China, 2007. [Google Scholar]
- Zhao, Y.; Yu, Z.C. Vegetation response to Holocene climate change in East Asian monsoon-margin region. Earth Sci. Rev. 2012, 113, 1–10. [Google Scholar] [CrossRef]
- Wang, T. Atlas of Sandy Desert and Aeolian Desertification in Northern China; Science Press: Xi’an, China, 2014. [Google Scholar]
- Han, G.; Zhang, G.; Dong, Y. A model for the active origin and development of source-bordering dune fields on a semiarid fluvial plain: A case study from the Xiliaohe Plain, Northeast China. Geomorphology 2007, 86, 512–524. [Google Scholar] [CrossRef]
- Zhao, H.; Lu, Y.C.; Yin, J.H. Optical dating of Holocene sand dune activities in the Horqin sand-fields in Inner Mongolia, China, using the SAR protocol. Quat. Geochronol. 2007, 2, 29–33. [Google Scholar] [CrossRef]
- Lu, Y.C.; Wang, X.L.; Wintle, A.G. A new OSL chronology for dust accumulation in the last 130,000 yr for the Chinese Loess Plateau. Quat. Res. 2007, 67, 152–160. [Google Scholar] [CrossRef]
- Zhao, H.; Lu, Y.C.; Wang, C.M.; Chen, J.; Liu, J.F.; Mao, H.L. ReOSL dating of Aeolian and fluvial sediments from Nihewan Basin, northern China and its environmental application. Quat. Geochronol. 2010, 5, 159–163. [Google Scholar] [CrossRef]
- Lai, Z.P.; Zöller, L.; Fuchs, M.; Brückner, H. Alpha efficiency determination for OSL of quartz extracted from Chinese loess. Radiat. Meas. 2008, 43, 767–770. [Google Scholar] [CrossRef]
- Prescott, J.R.; Hutton, J.T. Cosmic ray contributions to dose rates for luminescence and ESR dating: Large depths and long term variations. Radiat. Meas. 1994, 23, 497–500. [Google Scholar] [CrossRef]
- Lai, Z.P.; Ou, X.J. Basic procedures of optically stimulated luminescence (OSL) dating. Prog. Geogr. 2013, 32, 684–693. [Google Scholar]
- Munsell, C. Munsell Soil Color Chart, 2000 Revised Washable ed.; Gretagmacbeth: New Windsor, NY, USA, 2000. [Google Scholar]
- Guo, L.C.; Xiong, S.F.; Yang, P.; Ye, W.; Jin, G.Y.; Wu, W.W.; Zhao, H. Holocene environmental changes in the Horqin desert revealed by OSL dating and δ13C analyses of paleosols. Quat. Int. 2018, 469, 11–19. [Google Scholar] [CrossRef]
- Zhao, C.; Yu, Z.C.; Zhao, Y.; Ito, E. Holocene millennial-scale climate variations documented by multiple lake-level proxies from Hurleg Lake in northwestern China. J. Paleolimnol. 2010, 44, 995–1008. [Google Scholar] [CrossRef]
- Mischke, S.; Kramer, M.; Zhang, C.; Shang, H.; Herzschuh, U.; Erzinger, J. Reduced early Holocene moisture availability in the Bayan Har Mountains, northeastern Tibetan Plateau, inferred from a multi-proxy lake record. Palaeogeogr. Palaeoclimatol. Palaeoecol. 2008, 267, 59–76. [Google Scholar] [CrossRef]
- Wang, N.; Li, Z.; Li, Y.; Cheng, H. Millennial-scale environmental changes in the asian monsoon margin during the holocene, implicated by the lake evolution of huahai lake in the hexi corridor of northwest china. Quat. Int. 2013, 313–314, 100–109. [Google Scholar] [CrossRef]
- Mischke, S.; Zhang, C.; Börner, A.; Herzschuh, U. Lateglacial and Holocene variation in aeolian sediment flux over the northeastern Tibetan Plateau recorded by laminated sediments of a saline meromictic lake. J. Quat. Sci. 2010, 25, 162–177. [Google Scholar] [CrossRef]
- Qiang, M.R.; Song, L.; Chen, F.H.; Li, M.Z.; Liu, X.X.; Wang, Q. A 16-ka lake-level record inferred from macrofossils in a sediment core from Genggahai Lake, northeastern Qinghai-Tibetan Plateau (China). J. Paleolim. 2013, 49, 575–590. [Google Scholar] [CrossRef]
- Cheng, B.; Chen, F.H.; Zhang, J.W. Palaeovegetational and palaeoenvironmental changes since the last deglacial in Gonghe Basin, northeast Tibetan Plateau. J. Geogr. Sci. 2013, 23, 136–146. [Google Scholar] [CrossRef]
- Mischke, S.; Zhang, C.J. Holocene cold events on the Tibetan Plateau. Glob. Planet. Chang. 2010, 72, 155–163. [Google Scholar] [CrossRef]
- Chen, F.H.; Wu, W.; Holmes, J.A.; Madsen, D.B.; Zhu, Y.; Jin, M.; Oviatt, C.G. A mid-Holocene drought interval as evidenced by lake desiccation in the Alashan Plateau, inner Mongolia, China. Chin. Sci. Bull. 2003, 48, 1401–1410. [Google Scholar] [CrossRef]
- Yu, X.F.; Zhou, W.J.; Lars, G.F.; Xian, F.; Chen, P.; Jull, A.J.T. High-resolution peat record for Holocene monsoon history in the eastern Tibetan Plateau. Sci. China (Ser. D) 2006, 49, 615–621. [Google Scholar] [CrossRef]
- Zhang, H.C.; Ma, Y.Z.; Wünnemann, B. A Holocene climatic record from arid northwestern China. Palaeogeogr. Palaeoclimatol. Palaeoecol. 2000, 162, 389–401. [Google Scholar] [CrossRef]
- Ma, Y.Z.; Zhang, H.C.; Pachur, H.J.; Wunnemann, B.; Li, J.J.; Feng, Z.D. Late glacial and Holocene vegetation history and paleoclimate of the Tengger Desert, northwestern China. Chin. Sci. Bull. 2003, 48, 1457–1462. [Google Scholar] [CrossRef]
- Chen, F.H.; Cheng, B.; Zhao, Y.; Zhu, Y.; Madsen, D.B. Holocene environmental change inferred from a high-resolution pollen record, Lake Zhuyeze, arid China. Holocene 2006, 16, 675–684. [Google Scholar] [CrossRef]
- Zhao, Y.; Yu, Z.; Chen, F.H.; Li, J. Holocene vegetation and climate change from a lake sediment record in the Tengger Sandy Desert, northwest China. J. Arid Environ. 2008, 72, 2054–2064. [Google Scholar] [CrossRef]
- Li, Y.; Wang, N.A.; Cheng, H.Y.; Long, H.; Zhao, Q. Holocene environmental change in the marginal area of the Asian monsoon: A record from Zhuye Lake, NW China. Boreas 2009, 38, 349–361. [Google Scholar] [CrossRef]
- Chen, C.T.A.; Lan, H.C.; Lou, J.Y.; Chen, Y.C. The dry Holocene Megathermal in Inner Mongolia. Palaeogeogr. Palaeoclimatol. Palaeoecol. 2003, 193, 181–200. [Google Scholar] [CrossRef]
- Li, X.J.; Zhou, W.J.; An, Z.S.; Dodson, J. The vegetation and monsoon variations at the desert-loess transition belt at Midiwan in northern China for the last 13 ka. Holocene 2003, 13, 779–784. [Google Scholar]
- Huang, C.Q.; Guo, L.L. Pollen evidence of a humid mid-Holocene climate from Bahar Nuur, Inner Mongolia. Open Access Libr. J. 2017, 4, 34–67. [Google Scholar] [CrossRef]
- Jiang, Y.J.; Wang, W.; Ma, Y.Z.; Li, Y.Y.; Liu, L.N.; He, J. A preliminary study on Holocene climate change of Ordos Plateau, as inferred by sedimentary record from Bojianghaizi Lake of Inner Mongolia, China. Quat. Sci. 2014, 34, 654–665. (In Chinese) [Google Scholar]
- Sun, A.Z.; Feng, Z.D. Holocene climatic reconstructions from the fossil pollen record at Qigai Nuur in the southern Mongolian Plateau. Holocene 2013, 23, 1391–1402. [Google Scholar] [CrossRef]
- Wang, L.; Sarnthein, M.; Erlenkeuser, H.; Grimalt, J.; Grootes, P.; Heilig, S.; Lvanova, E.; Kienast, M.; Pelejero, C.; Pflaumann, U. East Asian monsoon climate during the Late Pleistocene: High resolution sediment records from the South China Sea. Mar. Geol. 1999, 156, 245–284. [Google Scholar] [CrossRef]
- Liu, J.B.; Chen, J.H.; Kandasamy, S.; Chen, S.Q.; Xie, C.L.; Chen, Q.M.; Lin, B.Z.; Yu, K.F.; Xu, Q.H.; Velasco, V.M.; et al. A 14.7 ka record of earth surface processes from the arid-monsoon transitional zone of China. Earth Surf. Proc. Land. 2018, 43, 723–734. [Google Scholar] [CrossRef]
- Chen, F.H.; Xu, Q.H.; Chen, J.H.; Birks, H.J.B.; Liu, J.B.; Zhang, S.R.; Jin, L.Y.; An, C.B.; Telford, R.J.; Cao, X.Y.; et al. East Asian summer monsoon precipitation variability since the last deglaciation. Sci. Rep. 2015, 5, 86–111. [Google Scholar] [CrossRef] [PubMed]
- Shi, P.J.; Song, C.Q. Palynological records of environmental changes in the middle part of Inner Mongolia, China. Chin. Sci. Bull. 2003, 48, 1433–1438. [Google Scholar] [CrossRef]
- Xu, Q.H.; Xiao, J.L.; Li, Y.C.; Tian, F.; Nakagawa, T. Pollen-based quantitative reconstruction of Holocene climate changes in the Daihai Lake area, Inner Mongolia, China. J. Clim. 2010, 23, 2856–2868. [Google Scholar] [CrossRef]
- Xiao, J.L.; Xu, Q.H.; Xu, T.; Nakamura, X.L.; Yang, W.D.; Liang, W.D.; Inouchi, Y. Holocene vegetation variation in the Daihai Lake region of north-central China: A direct indication of the Asian monsoon climatic history. Quat. Sci. Rev. 2004, 23, 1669–1679. [Google Scholar] [CrossRef]
- Xiao, J.L.; Wu, J.T.; Si, B.; Liang, W.D.; Nakamura, T.; Liu, B.L.; Inouchi, Y. Holocene climate changes in the monsoon/arid transition reflected by carbon concentration in Daihai Lake of Inner Mongolia. Holocene 2006, 16, 551–560. [Google Scholar] [CrossRef]
- Shen, H.Y.; Jia, Y.L.; Guo, F. Characteristics and environmental significance of the magnetic susceptibility in sediment of Huangqihai Lake, Inner Mongolia. China. Arid Land Geogr. 2010, 33, 151–157. (In Chinese) [Google Scholar]
- Dong, J.G.; Shen, C.C.; Kong, X.G.; Wang, H.C.; Jiang, X.Y. Reconciliation of hydroclimate sequences from the Chinese loess plateau and low-latitude East Asian summer monsoon regions over the past 14,500 years. Palaeogeogr. Palaeoclimatol. Palaeoecol. 2015, 435, 127–135. [Google Scholar] [CrossRef]
- Liu, H.Y.; Yin, Y.; Zhu, J.L.; Zhao, F.J.; Wang, H.Y. How did the forest respond to Holocene climate drying at the forest steppe ecotone in northern China? Quat. Int. 2010, 227, 46–52. [Google Scholar] [CrossRef]
- Wang, H.Y.; Liu, H.Y.; Zhu, J.L.; Yin, Y. Holocene environmental changes as recorded by mineral magnetism of sediments from Anguli-nuur Lake, southeastern Inner Mongolia Plateau, China. Palaeogeogr. Palaeoclimatol. Palaeoecol. 2010, 285, 30–49. [Google Scholar] [CrossRef]
- Wang, H.Y.; Liu, H.Y.; Zhao, F.J.; Yin, L.; Zhu, J.L.; Snowball, I. Early- and mid-Holocene palaeoenvironments as revealed by mineral magnetic, geochemical and palynological data of sediments from Bai Nuur and Ulan Nuur, southeastern Inner Mongolia Plateau, China. Quat. Int. 2012, 250, 100–118. [Google Scholar] [CrossRef]
- Jiang, W.Y.; Guo, Z.T.; Sun, X.J.; Wu, H.B.; Chu, G.Q.; Yuan, B.Y.; Hatte, C.; Guiot, J. Reconstruction of climate and vegetation changes of Lake Bayanchagan (Inner Mongolia): Holocene variability of the East Asian monsoon. Quat. Res. 2006, 65, 411–420. [Google Scholar] [CrossRef]
- Tang, L.; Wang, X.S.; Zhang, S.Q.; Chu, G.Q.; Yun, C.; Pei, J.L.; Sheng, M.; Yang, Z.Y. High-resolution magnetic and palynological records of the last deglaciation and Holocene from Lake Xiarinur in the Hunshandake Sandy Land, Inner Mongolia. Holocene 2015, 25, 844–856. [Google Scholar] [CrossRef]
- Fan, J.W.; Xiao, J.L.; Wen, R.L.; Zhang, S.R.; Wang, X.; Cui, L.L.; Li, H.; Xue, D.S.; Yamagata, H. Droughts in the East Asian summer monsoon margin during the last 6 kyrs: Link to the North Atlantic cooling events. Quat. Sci. Rev. 2016, 151, 88–99. [Google Scholar] [CrossRef]
- Fan, J.W.; Xiao, J.L.; Wen, R.L.; Zhang, S.R.; Wang, X.; Cui, L.L.; Yamagata, H. Carbon and nitrogen signatures of sedimentary organic matter from Dali Lake in Inner Mongolia: Implications for Holocene hydrological and ecological variations in the East Asian summer monsoon margin. Quat. Int. 2017, 452, 65–78. [Google Scholar] [CrossRef]
- Xiao, J.L.; Si, B.; Zhai, D.Y.; Itoh, S.; Lomtatidze, Z. Hydrology of Dali Lake in central-eastern Inner Mongolia and Holocene East Asian monsoon variability. J. Paleolim. 2008, 40, 519–528. [Google Scholar] [CrossRef]
- Wang, H.; Liu, H.; Cui, H.; Abrahamsen, N. Terminal Pleistoncene/Holocene palaeoenvironmental changes revealed bymineral-magnetism measurements of lake sediments for Dali Nor area, southeastern Inner Mongolia Plateau, China. Palaeogeogr. Palaeoclimatol. Palaeoecol. 2001, 170, 115–132. [Google Scholar] [CrossRef]
- Guan, Y.Y.; Wang, Y.; Yao, P.Y.; Chi, Z.Q.; Zhao, Z.L. Environmental evolution since the Holocene in the Haolaihure ancient lake, Keshiketengqi, Inner Mongolia, China. Geol. Bull. China 2010, 29, 891–900. (In Chinese) [Google Scholar]
- Wang, H.Y.; Liu, H.Y.; Liu, Y.H.; Cui, H.T. Mineral magnetism of lacustrine sediments and Holocene paleoenvironmental changes in Dali Nor area, southeast Inner Mongolia Plateau, China. Paleogeogr. Paleoclimatol. Paleoecol. 2004, 208, 175–193. [Google Scholar] [CrossRef]
- Wen, R.L.; Xiao, J.L.; Chang, Z.G.; Zhai, D.Y.; Xu, Q.H.; Li, Y.C.; Itoh, S.; Lomtatidze, Z. Holocene climate changes in the mid-highlatitude-monsoon margin reflected by the pollen record from Hulun Lake, northeastern Inner Mongolia. Quat. Res. 2010, 73, 293–303. [Google Scholar] [CrossRef]
- Yu, L.P.; Lai, Z.P. OSL chronology and palaeoclimatic implications of aeolian sediments in the eastern Qaidam Basin of the northeastern Qinghai-Tibetan Plateau. Palaeogeogr. Palaeoclimatol. Palaeoecol. 2012, 337–338, 120–129. [Google Scholar] [CrossRef]
- Stauch, G.; IJmker, J.; Pötsch, S.; Zhao, H.; Hilgers, A.; Diekmann, B.; Dietze, E.; Hartmann, K.; Opitz, S.; Wünnemann, B.; et al. Aeolian sediments on the north-eastern Tibetan Plateau. Quat. Sci. Rev. 2012, 57, 71–84. [Google Scholar] [CrossRef]
- Qiang, M.R.; Jin, Y.X.; Liu, X.X.; Song, L.; Li, H.; Li, F.S.; Chen, F.H. Late Pleistocene and Holocene aeolian sedimentation in Gonghe Basin, northeastern Qinghai-Tibetan Plateau: Variability, processes, and climatic implications. Quat. Sci. Rev. 2016, 132, 57–73. [Google Scholar] [CrossRef]
- Liu, B.; Jin, H.L.; Sun, L.Y.; Sun, Z.; Sun, Z.Z.; Zhang, C.X. Holocene climatic change revealed by aeolian deposits from the Gonghe Basin, northeastern Qinghai-Tibetan Plateau. Quat. Int. 2013, 296, 231–240. [Google Scholar] [CrossRef]
- Liu, B.; Jin, H.L.; Sun, L.Y.; Su, Z.; Zhang, C.X.; Zhao, S. History of moisture change derived from slope sediments of the eastern gonghe basin (northeastern qinghai-tibetan plateau) during the last 17 ka. Geol. J. 2016, 52, 583–593. [Google Scholar] [CrossRef]
- Liu, B.; Jin, H.L.; Miao, Y.F.; Sun, Z.; Su, Z.Z.; Zhang, C.X. Evidence of Holocene millennial-scale climatic change from Gonghe Basin peat deposit, northeastern Qinghai-Tibet Plateau. J. Arid Environ. 2014, 106, 1–10. [Google Scholar] [CrossRef]
- Yang, X.; Liu, T.; Xiao, H. Evolution of megadunes and lakes in the Badain Jaran Desert, Inner Mongolia, China during the last 31,000 years. Quat. Int. 2003, 104, 99–112. [Google Scholar] [CrossRef]
- Fan, Y.X.; Zhang, F.; Zhang, F.; Liu, W.H.; Chen, X.L.; Fan, T.L.; Wang, Y.D.; Chen, F.H.; Lai, Z.P. History and mechanisms for the expansion of the BadainJaran Desert, northern China, since 20 ka: Geological and luminescence chronological evidence. Holocene 2016, 26, 532–548. [Google Scholar] [CrossRef]
- Guo, Y.J.; Li, B.S.; Wen, X.H.; Wang, F.N.; Niu, D.F.; Shi, Y.J.; Guo, Y.H.; Jiang, S.P.; Hu, G.G. Holocene climate variation determined from rubidium and strontium contents and ratios of sediments collected from the BadainJaran Desert, Inner Mongolia, China. Chem. Erde-Geochem. 2014, 74, 571–576. [Google Scholar] [CrossRef]
- Peng, J.; Dong, Z.B.; Han, F.Q.; Gao, L. Aeolian activity in the south margin of the Tengger Desert in northern China since the Late Glacial Period revealed by luminescence chronology. Palaeogeogr. Palaeoclimatol. Palaeoecol. 2016, 457, 330–341. [Google Scholar] [CrossRef]
- Zhao, H.; Li, G.Q.; Sheng, Y.W.; Jin, M.; Chen, F.H. Early-middle Holocene Lake-desert evolution during Holocene in Ulan Buh Desert, China. Palaeogeogr. Palaeoclimatol. Palaeoecol. 2012, 331–332, 31–38. [Google Scholar] [CrossRef]
- Yang, X.P.; Forman, S.; Hu, F.G.; Zhang, D.G.; Liu, Z.T.; Li, H.W. Initial insights into the age and origin of the Kubuqi sand sea of northern China. Geomorphology 2016, 259, 30–39. [Google Scholar] [CrossRef]
- Fan, Y.X.; Chen, X.L.; Fan, T.L.; Jin, M.; Liu, J.B.; Chen, F.H. Sedimentary and OSL dating evidence for the development of the present Hobq desert landscape, northern China. Sci. China Earth Sci. 2013, 56, 2037–2044. [Google Scholar] [CrossRef]
- Sun, J.M.; Li, S.H.; Han, P.; Chen, Y. Holocene environmental changes in the central Inner Mongolia, based on single-aliquot-quartz optical dating and multi-proxy study of dune sands. Palaeogeogr. Palaeoclimatol. Palaeoecol. 2006, 233, 51–62. [Google Scholar] [CrossRef]
- Huang, C.C.; Zhou, J.; Pang, J.L.; Han, Y.P.; Hou, C.H. A regional aridity phase and its possible cultural impact during the Holocene Magathermal in the Guanzhong Basin, China. Holocene 2000, 10, 135–142. [Google Scholar] [CrossRef]
- He, Z.; Zhou, J.; Lai, Z.; Yang, L.; Liang, J.; Long, H.; Ou, X. Quartz OSL dating of sand dunes of Late Pleistocene in the Mu Us Desert in northern China. Quat. Geochronol. 2010, 5, 102–106. [Google Scholar] [CrossRef]
- Liu, B.; Jin, H.L.; Sun, L.Y.; Sun, Z.; Zhao, S. Geochemical evidence for Holocene millennial-scale climatic and environmental changes in the southeastern Mu Us Desert, northern China. Int. J. Earth Sci. 2015, 104, 1889–1900. [Google Scholar] [CrossRef]
- Jia, F.F.; Lu, R.J.; Gao, S.Y.; Li, J.F.; Liu, X.K. Holocene aeolian activities in the southeastern Mu Us Desert, China. Aeolian Res. 2015, 19, 267–274. [Google Scholar] [CrossRef]
- Gong, Z.; Li, S.H.; Sun, J.; Xue, L. Environmental changes in Hunshandake (Otindag) sandy land revealed by optical dating and multi proxy study of dune sands. J. Asian Earth Sci. 2013, 76, 30–36. [Google Scholar] [CrossRef]
- Jin, H.L.; Su, Z.Z.; Sun, L.Y.; Sun, Z.; Zhang, H.; Jin, L.Y. Holocene climatic change in Hunshandake desert. Chin. Sci. Bull. 2004, 49, 1730–1735. [Google Scholar] [CrossRef]
- Zeng, L.; Yi, S.W.; Lu, H.Y.; Chen, Y.Y.; Lei, F.; Xu, Z.W.; Wang, X.Y.; Zhang, W.F. Response of dune mobility and pedogenesis to fluctuations in monsoon precipitation and human activity in the Hulunbuir dune field, northeastern China, since the last deglaciation. Glob. Planet. Chang. 2018, 168, 1–14. [Google Scholar] [CrossRef]
- Guan, Y.Z. The element, clay mineral and depositional Environment in Horqin sand land. J. Des. Res. 1992, 12, 9–15. (In Chinese) [Google Scholar]
- Chen, J.; Wang, H.; Lu, H. Behaviors of REE and other trace elements during weathering––evidence from chemical leaching of loess and paleosol from the Luochuan section in central China. Acta Geol. Sin. 1996, 9, 290–302. [Google Scholar]
- Goldstein, S.L. Decoupled evolution of Nd and Sr isotopes in the continental crust and the mantle. Nature 1988, 336, 733–738. [Google Scholar] [CrossRef]
- Brass, G.W. The effect of weathering on the distribution of strontium isotopes in weathering profiles. Geochim. Cosmochim. Acta 1975, 39, 1647–1653. [Google Scholar] [CrossRef]
- Chen, J.; An, Z.; Head, J. Variation of Rb/Sr ratios in the loess-paleosol sequences of central China during the last 130,000 years and their implications for monsoon paleoclimatology. Quat. Res. 1999, 51, 215–219. [Google Scholar] [CrossRef]
- Liu, B.; Jin, H.L.; Sun, L.Y.; Sun, Z.; Niu, Q.H.; Xie, S.B.; Li, G.H. Holocene moisture change revealed by the Rb/Sr ratio of aeolian deposits in the southeastern Mu Us Desert, China. Aeolian Res. 2014, 13, 109–119. [Google Scholar] [CrossRef]
- Zhao, J.B. Migration depth and content of chemical composition in loess strata. J. Shaanxi Norm. Univ. (Natl. Sci. Ed.) 1999, 27, 103–108. (In Chinese) [Google Scholar]
- Zhao, J.B. A new Geological theory about Eluvial zone-Theory Illuvial on Depth of CaCO3. Acta Sedimentol. Sin. 2000, 18, 29–36. (In Chinese) [Google Scholar]
- An, C.B.; Feng, Z.D.; Barton, L. Dry or humid? mid-Holocene humidity changes in arid and semi-arid China. Quat. Sci. Rev. 2006, 25, 351–361. [Google Scholar] [CrossRef]
- Yang, L.H.; Long, H.; Cheng, H.Y.; Hu, G.Y. OSL dating of a mega-dune in the eastern Lake Qinghai basin (northeastern Tibetan Plateau) and its implications for Holocene aeolian activities. Quat. Geochronol. 2019, 49, 165–171. [Google Scholar] [CrossRef]
- Guo, Z.T.; Petit-Maire, N.; Kropelin, S. Holocene non-orbital climatic events in present-day arid areas of northern Africa and China. Glob. Planet. Chang. 2000, 26, 97–103. [Google Scholar] [CrossRef]
- Li, X.Q.; Zhou, J.; Shen, J.; Weng, C.Y.; Zhao, H.L.; Sun, Q.L. Vegetation history and climatic variations during the last 14ka BP inferred from a pollen record at Daihai Lake, northcentral China. Rev. Palaeobot. Palynol. 2004, 132, 195–205. [Google Scholar]
- Fan, J.W.; Xiao, J.L.; Wen, R.L.; Zhang, S.R.; Huang, Y.; Yue, J.J.; Xu, W.; Cui, L.L.; Li, H.; Xue, D.S.; et al. Mineralogy and carbonate geochemistry of the Dali Lake sediments: Implications for paleohydrological changes in the East Asian summer monsoon margin during the Holocene. Quat. Int. 2018. [Google Scholar] [CrossRef]
- Li, Y.; Wang, N.A.; Zhou, X.H.; Zhang, C.Q.; Wang, Y. Synchronous or asynchronous holocene indian and east asian summer monsoon evolution: A synthesis on holocene asian summer monsoon simulations, records and modern monsoon indices. Glob. Planet. Chang. 2014, 116, 30–40. [Google Scholar] [CrossRef]
- Chen, F.H.; Yu, Z.C.; Yang, M.L.; Ito, E.; Wang, S.M.; Madsen, D.B.; Huang, X.Z.; Zhao, Y.; Sato, T.; Birks, H.J.B.; et al. Holocene moisture evolution in arid central Asia and its out-of-phase relationship with Asian monsoon history. Quat. Sci. Rev. 2008, 27, 351–364. [Google Scholar] [CrossRef]
- Kutzbach, J.E. Monsoon climate of the early Holocene: Climate experiment using the earth’s orbital parameters for 9000 years ago. Science 1981, 214, 59–61. [Google Scholar] [CrossRef]
- Koutavas, A.; deMenocal, P.B.; Olive, G.C.; Lynch-Stieglitz, J. Mid-Holocene El Niño-Southern Oscillation (ENSO) attenuation revealed by individual foraminifera in eastern tropical Pacific sediments. Geology 2006, 34, 993–996. [Google Scholar] [CrossRef]
- Yancheva, G.; Nowaczyk, N.R.; Mingram, J.; Dulski, P.; Schettler, G.; Negendank, J.F.W.; Liu, J.Q.; Sigman, D.M.; Peterson, L.C.; Haug, G.H. Influence of the intertropical convergence zone on the East Asian monsoon. Nature 2007, 445, 74–77. [Google Scholar] [CrossRef]
- Berger, A.; Loutre, M.F. Insolation values for the climate of the last 10 million years. Quat. Sci. Rev. 1991, 10, 297–317. [Google Scholar] [CrossRef]
- Chen, F.H.; Jia, J.; Chen, J.H.; Li, G.Q.; Zhang, X.J.; Xie, H.C.; Xie, D.S.; Huang, W.; An, C.B. A persistent Holocene wetting trend in arid central Asia, with wettest conditions in the late Holocene, revealed by multi-proxy analyses of loess-paleosol sequences in Xinjiang, China. Quat. Sci. Rev. 2016, 146, 134–146. [Google Scholar] [CrossRef]
- An, Z.S.; Colman, S.M.; Zhou, W.J.; Li, X.Q.; Brown, E.T.; Jull, A.J.T.; Cai, Y.J.; Huang, Y.S.; Lu, X.F.; Chang, H.; et al. Interplay between the Westerlies and Asian monsoon recorded in Lake Qinghai sediments since 32 ka. Sci. Rep. 2012, 2, 619. [Google Scholar] [CrossRef] [PubMed]
- Bohner, J. General climatic controls and top climatic variations in central and high Asia. Boreas 2006, 35, 279–295. [Google Scholar] [CrossRef]
- Vandenberghe, J.; Renssen, H.; van Huissteden, K.; Nugteren, G.; Konert, M.; Lu, H.Y.; Dodonov, A.; Buylaert, J.P. Penetration of Atlantic westerly winds into central and East Asia. Quat. Sci. Rev. 2006, 25, 2380–2389. [Google Scholar] [CrossRef]
- Li, D.L.; Shao, P.C.; Wang, H.; Chen, L. Advances in Research of the North boundary belt of East Asia subtropical Summer Monsoon in China. Plateau Meteorol. 2013, 32, 305–314. (In Chinese) [Google Scholar]
- Zhou, W.J.; Yu, S.Y.; Georges, B.; Kukla, G.J.; Jull, A.J.T.; Xian, F.; Xiao, J.Y.; Colman, S.M.; Yu, H.G.; Liu, Z.; et al. Postglacial changes in the Asian summer monsoon system: A pollen record from the eastern margin of the Tibetan Plateau. Boreas 2010, 39, 528–539. [Google Scholar] [CrossRef]
- Chen, M.; Pollard, D.; Barron, E.J. Regional climate change in East Asia simulated by an interactive atmosphere-soil-vegetation model. J. Clim. 2004, 17, 557–572. [Google Scholar] [CrossRef]
- Kǜper, R.; Kröpelin, S. Climate-controlled Holocene occupation in the Sahara: Motor of Africa’s evolution. Science 2006, 313, 803–807. [Google Scholar] [CrossRef]
- Jia, X.; Yi, S.W.; Sun, Y.G.; Wu, S.Y.; Lee, H.F.; Wang, L.; Lu, H.Y. Spatial and temporal variations in prehistoric human settlement and their influencing factors on the south bank of the Xar Moron River, Northeastern China. Front. Earth Sci. 2016, 11, 137–147. [Google Scholar] [CrossRef]
- Liu, L.; Chen, X.C.; Wright, H.; Xu, H.; Li, Y.Q.; Chen, G.L.; Zhao, H.T.; Kim, H.; Lee, G. Rise and fall of complex societies in the Yiluo region, North China: The spatial and temporal changes. Quat. Int. 2019, 521, 4–15. [Google Scholar] [CrossRef]
- Zhang, X.L.; Wang, J.X.; Xian, Z.Q.; Qiu, S.H. Studies on ancient human diet. Archaeology 2003, 2, 62–75. (In Chinese) [Google Scholar]
- Sun, Y.G.; Zhao, Z.J. A comprehensive study on plant remains excavated from Weijiawopu site, a Hongshan site. Agric. Archaeol. 2013, 33, 1–5. (In Chinese) [Google Scholar]
- Jin, G.; Luan, F.; Zhang, C.; Wang, Y. Liaodong bandao nanbu nongye kaogu diaocha baogao—Zhiguiti de zhengju. Dongfang Kaogu 2009, 6, 306–316. (In Chinese) [Google Scholar]
- Rosen, A.M.; Macphail, R.; Liu, L.; Chen, X.; Weisskop, A. Rising Social Complexity, Agricultural Intensification, and the Earliest Rice Paddies on the Loess Plateau of Northern China. Quat. Int. 2015, 437, 50–59. [Google Scholar] [CrossRef]
- Costin, C.L. Craft specialization: Issues in defining, documenting, and explaining the organization of production. Archaeol. Method Theory 1991, 5, 1–56. [Google Scholar]
- Zhang, H.; Bevan, A.; Guo, D.S. The neolithic ceremonial complex at Niuheliang and wider Hongshan landscapes in Northeastern China. J. World Prehistory 2013, 26, 1–24. [Google Scholar] [CrossRef]
- Drennan, R.D.; Peterson, C.E.; Lu, X.M.; Li, T. Hongshan households and communities in Neolithic northeastern China. J. Anthropol. Archaeol. 2017, 47, 50–71. [Google Scholar] [CrossRef]
- Lee, G.-A.; Crawford, G.W.; Liu, L.; Chen, X. Plants and people from the early Neolithic to Shang periods in North China. Proc. Natl. Acad. Sci. USA 2007, 104, 1087–1092. [Google Scholar] [CrossRef]
- Sun, G.Q. “Henan jingnei de Dawenkou wenhua he Qujialing wenhua” (The Dawenkou Culture and Qujialing Culture in Henan). Zhongyuan Wemvu 2000, 2, 22–28. (In Chinese) [Google Scholar]
- Li, X.Q.; Shang, X.; Dodson, J.; Zhou, X.Y. Holocene agriculture in the Guanzhong Basin in NW China indicated by pollen and charcoal evidence. Holocene 2009, 19, 1213–1220. [Google Scholar] [CrossRef]
- Wei, J. Miaozigou and Dabagou the Report on Excavation of Ancient Sites of Primitive Inhabitant Tribes in the New Stone Age; Encyclopedia of China Publishing House: Beijing, China, 2003. (In Chinese) [Google Scholar]
- Mo, D.W.; Yang, X.Y.; Wang, H.; Li, S.C.; Guo, D.S.; Zhu, D. Study on the Environmental background of Niuheliang site, Hongshan culture, and the relationship between ancient man and environment. Quat. Sci. 2002, 22, 174–181. (In Chinese) [Google Scholar]
- Zhang, J.X.; Wang, X.Y.; Yang, R.X.; Li, X.Z.; Zhang, W. Multicultural responses to environmental changes of the Holocene in the Nihewan-Huliu Basin of North China. Quat. Int. 2019, 507, 53–61. [Google Scholar]
- Zhou, X.Y.; Li, X.Q.; Zhao, K.L.; Dodson, J.; Sun, N.; Yang, Q. Early agricultural development and environmental effects in the Neolithic Longdong basin (eastern Gansu). Chin. Sci. Bull. 2011, 56, 762–771. [Google Scholar] [CrossRef]
- Cui, Y.F.; Liu, Y.J.; Ma, M.M. Spatiotemporal evolution of prehistoric Neolithic-Bronze Age settlements and influencing factors in the Guanting Basin, northeast Tibetan Plateau. Sci. China (Earth Sci.) 2018, 61, 149–162. [Google Scholar] [CrossRef]
- Chen, F.H.; Dong, G.H.; Zhang, D.J.; Liu, X.Y.; Jia, X.; An, C.B.; Ma, M.M.; Xie, Y.W.; Barton, L.; Ren, X.Y.; et al. Agriculture facilitated permanent human occupation of the Tibetan Plateau after 3600 BP. Science 2015, 347, 248–250. [Google Scholar] [CrossRef] [PubMed]
- Lu, L.D. Mid-Holocene Climate and Cultural Dynamics in Eastern Central China; Climate and Cultural Change: Exploring Holocene Transitions; Academic Press: Salt Lake City, UT, USA, 2007; pp. 279–330. [Google Scholar]


| Lab No. | Depth (cm) | U (ppm) | Th (ppm) | K (%) | De (Gy) | D (Gy/ka) | Water Content (%) | Age (ka) |
|---|---|---|---|---|---|---|---|---|
| XJM-1 | 110 | 0.84 ± 0.05 | 3.67 ± 0.14 | 2.37 ± 0.07 | 7.31 ± 0.27 | 3.19 ± 0.13 | 5 | 2.3 ± 0.1 |
| XJM-2 | 170 | 0.74 ± 0.04 | 3.29 ± 0.13 | 2.34 ± 0.07 | 12.72 ± 0.30 | 3.07 ± 0.12 | 3.4 | 4.1 ± 0.2 |
| XJM-3 | 280 | 0.70 ± 0.04 | 3.09 ± 0.12 | 2.28 ± 0.07 | 13.97 ± 0.66 | 2.96 ± 0.12 | 5.5 | 4.7 ± 0.3 |
| XJM-4 | 350 | 0.72 ± 0.04 | 3.38 ± 0.13 | 2.25 ± 0.07 | 17.40 ± 1.19 | 2.96 ± 0.12 | 5.0 | 5.9 ± 0.5 |
| XJM-5 | 495 | 0.90 ± 0.05 | 3.65 ± 0.14 | 2.29 ± 0.07 | 20.13 ± 1.25 | 3.06 ± 0.12 | 6.6 | 6.6 ± 0.5 |
| HXT-1 | 40 | 0.83 ± 0.05 | 3.91 ± 0.15 | 2.51 ± 0.07 | 16.82 ± 1.05 | 3.36 ± 0.13 | 3.3 | 5.0 ± 0.4 |
| HXT-2 | 150 | 0.85 ± 0.05 | 3.88 ± 0.15 | 2.45 ± 0.07 | 21.88 ± 1.23 | 3.28 ± 0.13 | 3.4 | 6.7 ± 0.5 |
| HXT-3 | 245 | 1.04 ± 0.05 | 4.90 ± 0.18 | 2.59 ± 0.07 | 24.04 ± 1.29 | 3.55 ± 0.14 | 5.8 | 6.8 ± 0.5 |
| HXT-4 | 340 | 1.12 ± 0.05 | 5.38 ± 0.19 | 2.50 ± 0.07 | 36.60 ± 0.96 | 3.52 ± 0.14 | 4.9 | 10.3 ± 0.5 |
| HXT-5 | 470 | 1.20 ± 0.06 | 4.97 ± 0.18 | 2.34 ± 0.07 | 44.66 ± 2.69 | 3.36 ± 0.13 | 4.2 | 13.2 ± 1.0 |
| HXT-6 | 570 | 1.36 ± 0.07 | 5.74 ± 0.20 | 2.36 ± 0.07 | 47.56 ± 0.86 | 3.48 ± 0.14 | 5.9 | 13.7 ± 0.6 |
| HXT-7 | 665 | 1.24 ± 0.06 | 5.15 ± 0.19 | 2.47 ± 0.07 | 56.80 ± 2.42 | 3.48 ± 0.14 | 5.4 | 16.3 ± 1.0 |
| HXT-8 | 740 | 0.75 ± 0.05 | 2.92 ± 0.12 | 2.31 ± 0.07 | 61.45 ± 1.86 | 2.93 ± 0.12 | 5.0 | 20.9 ± 1.1 |
| YXM-1 | 40 | 0.6 ± 0.04 | 2.6 ± 0.11 | 2.6 ± 0.07 | 1.95 ± 0.17 | 3.2 ± 0.13 | 5.0 | 0.6 ± 0.05 |
| YXM-2 | 100 | 0.6 ± 0.04 | 2.9 ± 0.12 | 2.4 ± 0.07 | 2.36 ± 0.14 | 3.1 ± 0.13 | 5.0 | 0.7 ± 0.05 |
| YXM-3 | 195 | 0.7 ± 0.05 | 3.5 ± 0.14 | 2.8 ± 0.07 | 2.84 ± 0.17 | 3.5 ± 0.14 | 5.0 | 0.8 ± 0.06 |
| YXM-4 | 300 | 0.7 ± 0.05 | 3.5 ± 0.14 | 2.4 ± 0.07 | 5.11 ± 0.27 | 3.2 ± 0.13 | 5.0 | 1.6 ± 0.1 |
| YXM-5 | 380 | 0.7 ± 0.05 | 3.5 ± 0.13 | 2.4 ± 0.07 | 13.7 ± 0.93 | 3.2 ± 0.13 | 5.0 | 4.3 ± 0.3 |
| YXM-6 | 530 | 0.7 ± 0.05 | 3.5 ± 0.14 | 2.5 ± 0.07 | 17.4 ± 0.50 | 3.2 ± 0.13 | 4.0 | 5.4 ± 0.3 |
| YXM-7 | 710 | 0.77 ± 0.05 | 4.05 ± 0.15 | 2.42 ± 0.07 | 56.56 ± 2.39 | 3.16 ± 0.13 | 5.2 | 17.9 ± 1.0 |
| YXM-8 | 760 | 0.86 ± 0.05 | 4.67 ± 0.17 | 2.44 ± 0.07 | 112.4 ± 4.34 | 3.27 ± 0.13 | 6.3 | 34.4 ± 1.9 |
| No. site | Latitude | Longitude | Elevation | Archive | Proxy | Climate Signal | Onset Age (cal.kyr BP) | Dating Method | Reference |
|---|---|---|---|---|---|---|---|---|---|
| 1. Hurleg Lake | 37.28 | 96.9 | 2817 | Lake | OM, Ca, MS, GE, δ18O, | dry | 6.2–5.9, 5.3–4.9 | AMS14C | [76] |
| 2. Koucha Lake | 34.01 | 97.24 | 4530 | Lake | P, GE, TOC, δ13C, δ18O, | dry | 4.3 | 14C | [77] |
| 3. Huahai | 40.43 | 98.07 | 1200 | Lake | GS, Ca, TOC, C/N | dry | 5.5 | AMS14C | [78] |
| 4. Kuhai Lake | 35.30 | 99.18 | 4150 | Lake | LOI, GS, δ13C, δ18O, P, GE | dry | 6.1–5.4 | 14C | [79] |
| 5. Qinghai Lake | 37.91 | 99.6 | 3200 | Lake | P, Ca, TOC, TN, δ13C, | dry | 6–4.5, | AMS14C | [52] |
| 6. Genggahai | 36.18 | 100.1 | 2860 | Lake | GE, FO, TOC, TN, δ13C, | dry | 6.3–5.5 | 14C | [80] |
| 7. Dalianhai | 36.53 | 100.4 | 2850 | Lake | Ca, GS, P | dry | 5.7–3.9 | AMS14C | [81] |
| 8. Ximencuo Lake | 33.38 | 101.1 | 4030 | Lake | TOC,13C, C/N, GS, MS | cold | 5.7, 4.2 | 14C | [82] |
| 9. Juyanze Lake | 41.99 | 101.53 | 920 | Lake | P, L, | dry | 7–5 | AMS14C | [83] |
| 10. Hongyuan Peatland | 32.78 | 102.51 | 3527 | Outcrop | St, P | cold, dry | 6.2, 5.9–4.1 | 14C | [84] |
| 11. Hongshui River | 38.18 | 102.76 | 1460 | Outcrop | GE, δ13C, δ18O, P, | dry, warm | 6.2–5.6, 5.0–4.4, | 14C | [85,86] |
| 12. Zhuyeze (Sanjiaocheng) | 39.01 | 103.34 | 1320 | Lake | L, P, LOI | dry | 7–5 | AMS14C | [87] |
| 13. Qingtu Lake | 39.07 | 103.61 | 1302 | Outcrop | MS, GS, Ca, P | dry | 4.7 | AMS14C | [88] |
| 14. Zhuyeze | 39.05 | 103.67 | 1309 | Outcrop | GS, P, GE, | dry | 4.7 | AMS14C | [89] |
| 15. Wanxiang Cave | 33.32 | 105 | 1200 | Stalagmites | δ18O | dry | 6.1–5.7, 5.7–4.9 | 230Th | [51] |
| 16. Toudaohu Lake | 38.42 | 105.12 | 1300 | Lake | P, L, | dry | 7–5 | AMS14C | [83] |
| 17. Yanhaizi | 40.13 | 108.45 | 1180 | Lake | GS, TOC, TOC/TN, MS | dry | 5.8–4.3 | AMS14C | [90] |
| 18. Midiwan | 37.65 | 108.62 | 1400 | Peat secton | P, TOC, δ13C | dry, warm | 7.5–4.5 | AMS14C | [91] |
| 19. Baihar Nuur | 39.32 | 109.27 | 1278 | Lake | P, L, Ca, TOC, δ13C | humid | 6.3–4.4 | AMS14C | [92] |
| 20. Bojianghaizi Lake | 37.97 | 109.31 | 1365 | Lake | GS, LOI, P | dry | 6.8 | AMS14C | [93] |
| 21. QigaiNuur | 39.5 | 109.5 | 1403 | Lake | P, GE, OM, | cold, dry | 7.4–6 | AMS14C | [94] |
| 22. Qasq Peat | 40.67 | 111.12 | 1000 | Outcrop | P, | dry | 4100–2400(14C) | 14C | [95] |
| 23. Gonghai lake | 38.9 | 112.23 | 1860 | Lake | Ca, EM, GC, GS, OM, P | warm, dry | 5.5–4.8 | AMS14C | [96,97] |
| 24. Diaojiaohaizi Lake | 41.3 | 112.35 | 1800 | Lake | P, | warm, dry | 4400–3000(14C) | 14C | [98] |
| 25. Daihai Lake | 40.59 | 112.67 | 1230 | Lake | P, Ma. | dry | 6,4.5–2.9 | AMS14C | [99,100,101] |
| 26. Huangqihai | 40.8 | 113.3 | 1277 | Lake | GS, GE, MS | cold, dry | 6.7–5.5, 5.0–4.0 | AMS14C, OSL | [102] |
| 27. Lianhua Cave | 38.17 | 113.72 | 1200 | Stalagmites | δ18O | dry | 6.5 | 230Th | [103] |
| 28. AnguliNuur Lake | 41.35 | 114.4 | 1315 | Lake | MS, GS, P, TOC, C/N | dry | 6.3–3.5 | AMS14C,210Pb/137Cs | [104,105] |
| 29. BaiNuur | 41.64 | 114.52 | 1346 | Outcrop | MS, GS, P, | dry | 6.9/6.8 | AMS14C | [105,106] |
| 30. UlanNuur | 41.74 | 115.09 | 1246 | Outcrop | MS, GS, P, TOC, C/N | dry | 6.2/6.1 | AMS14C | [105,106] |
| 31. Bayanchagan Lake | 42.08 | 115.35 | 1355 | Lake | Pollen | dry | 6.5–5.1 | AMS14C | [107] |
| 32. Xiarinur | 42.6 | 115.47 | 1225 | Lake | EM, GS, P | dry | 4.9 | AMS14C | [108] |
| 33. Dali Lake | 43.15 | 116.29 | 1220 | Lake | GE, δ13C, δ18O, δ5N, | dry | 5.9–4.8 | AMS14C, OSL | [109,110,111] |
| 34. Liuzhouwan | 42.71 | 116.67 | 1365 | Outcrop | GE, EM, GC, GS, LOI, OM, P | dry | 4700(14C) | AMS14C | [112] |
| 35. Haoluku | 42.96 | 116.75 | 1295 | Outcrop | LOI, TOC, GE, MS | dry | 5600(14C) | AMS14C | [112] |
| 36. Haolainure | 42.95 | 116.79 | 1295 | outcrop | P | warm, wet | 5.8–2.9 | AMS14C, OSL | [113] |
| 37. Xiaoniuchang | 42.62 | 116.83 | 1460 | Outcrop | LOI, TOC, GE, MS, P | dry | 5600–3000(14C) | AMS14C | [114] |
| 38. Jiangjunpaozi | 42.37 | 117.47 | 1490 | Outcrop | LOI, TOC, GE, MS, P | dry | 6600–4300(14C) | AMS14C | [114] |
| 39. Hulun Lake | 49.13 | 117.51 | 545 | Lake | P | dry | 6.4–4.4 | AMS14C | [115] |
| 40. Tiekui Desert | 36.08 | 97.12 | 2800–3300 | Aeolian | L | dry | 4.5 | OSL | [116] |
| 41. Donggi Cona | 35.3 | 98.32 | 4090 | Aeolian | GS | dry | 6 | AMS14C | [117] |
| 42. Gonghe Basin | 35.5–36.93 | 98.8–101.4 | 2400–3200 | Aeolian | L, GS, GE | dry | 5 | OSL | [118] |
| 43. Gonghe basin (LG) | 35.80 | 100.33 | 3780 | Aeolian | MS, TOC, Ca, GS, GE | cold, dry | 5.3–4.7 | OSL | [119] |
| 44. Gonghe basin (DQ) | 35.60 | 101.08 | 3534 | Aeolian | MS, TOC, Ca, GE | dry | 6.5–5.8 | 14C | [120] |
| 45. Gonghe basin (KE) | 35.65 | 101.1 | 3780 | Aeolian | MS, TOC, P | cold, dry | 5.3–4.9 | 14C | [121] |
| 46. Badain(a) | 39.3–42 | 99.8–104.2 | 1200–1700 | Aeolian, Lake | GE | dry | 5 | AMS14C, TL | [122] |
| 47. Badain(b) | 38–40.5 | 102.5–106.5 | 1600 | Aeolian | L | dry | 6–5 | OSL | [123] |
| 48. Badain (Chagelebuuulu) | 39.89 | 103.30 | 1800 | Aeolian | GE | cold, dry | 6.2 | AMS14C | [124] |
| 49. Tengger | 37.45–40 | 102.2–105.2 | 1200–1400 | Aeolian | GS, S | dry | 6 | AMS14C | [125] |
| 50. Ulan Buh | 39.8–40.6 | 105.7–106.5 | 1030 | Aeolian, Lake | GS | dry | 6.5 | OSL, 14C | [126] |
| 51. Hobq | 39.6–40.8 | 107.1–111.5 | 1200 | Aeolian | GS, MS, TOC, TC, Ca, | dry | 7–4 | OSL | [127,128] |
| 52. InnerMong (KB, JJ, TYG) | 37.37–40.8 | 106.1–111.5 | 1000–1200 | Aeolian | P | dry | 5.6 | OSL | [129] |
| 53. CLP | 33.68–41.27 | 100.8–114.5 | 1000–2000 | Loess | L, S | dry | 5.5 | OSL,14C | [50] |
| 54. Qingquicun | 34.22 | 107.83 | 500 | Loess | L, GS, GE, MS, TOC | dry | 6–5 | 14C | [130] |
| 55. MuUs | 37.27–39.22 | 107.2–111.30 | 1200–1600 | Aeolian | L | dry | 5 | OSL | [131] |
| 56. MuUs (JJ) | 38.74 | 110.17 | 1159 | Aeolian | GE | dry | 6.6–5.4 | OSL | [132] |
| 57. MuUs | 37.45–39.48 | 107.3–111.5 | 1000–1200 | Aeolian | L, TOC, S | dry | 6.4 | 14C, OSL | [133] |
| 58. Otindag (HSDK) | 42.66 | 115.95 | 1100 | Aeolian | L, MS, GS, S | dry | 5 | OSL | [134] |
| 59. Otindag (Xilinhot) | 43.88 | 116.093 | 960 | Aeolian | MS, OM | dry | 5.9 | 14C | [135] |
| 60. Horqin | 42.67–45.25 | 118.5–124.5 | 120–800 | Aeolian | L, δ13C, S | dry | 6–4 | OSL | [57,74] |
| 61. Hulunbuir Dune | 47.5–49.5 | 117.5–119.5 | 600–800 | Aeolian | GS, MS, S | dry | 5 | OSL | [136] |
| Section | Age (ka) | Lithology | Re | Rb/Sr ratio | Rb (ppm) | Sr (ppm) | CaCO3 |
|---|---|---|---|---|---|---|---|
| XJM | 6.6–5.9 | Aeolian sand | 6.06 | 0.725 | 93.5 | 129.6 | 0.44 |
| 5.9–4.1 | Paleosol | 5.83 | 0.739 | 95.2 | 128.9 | 0.37 | |
| 4.1–? | Aeolian sand | 5.96 | 0.762 | 93.3 | 122.6 | 0.35 | |
| ?–2.3 | Paleosol | 4.94 | 0.753 | 96.8 | 128.5 | 0.93 | |
| <2.3 | Aeolian sand | 5.36 | 0.754 | 93.5 | 124.1 | 1.10 | |
| HXT | 20.9–16.3 | Aeolian sand | 5.0 | 0.623 | 99.4 | 160.7 | 1.45 |
| 16.3–13.2 | Sandy loess | 4.19 | 0.571 | 106.9 | 187.9 | 2.54 | |
| 13.2–6.7 | Paleosol | 4.50 | 0.498 | 109.5 | 221.0 | 2.99 | |
| 6.7–5.0 | Aeolian sand | 6.12 | 0.491 | 105.3 | 208.2 | 3.71 | |
| YXM | 34.4–17.9 | River sand | 4.99 | 0.558 | 101.5 | 182.0 | 0.39 |
| 17.9–? | Muddy sand | 4.75 | 0.557 | 102.7 | 184.7 | 0.61 | |
| ?–5.4 | Aeolian sand | 5.58 | 0.585 | 102.1 | 174.6 | 0.60 | |
| 5.4–1.6 | Paleosol | 5.1 | 0.575 | 101.5 | 176.6 | 0.67 | |
| 1.6–0.6 | Aeolian sand | 6.6 | 0.597 | 101.2 | 169.7 | 0.48 |
© 2019 by the authors. Licensee MDPI, Basel, Switzerland. This article is an open access article distributed under the terms and conditions of the Creative Commons Attribution (CC BY) license (http://creativecommons.org/licenses/by/4.0/).
Share and Cite
Xue, W.; Jin, H.; Liu, B.; Sun, L.; Liu, Z. The Possible Stimulation of the Mid-Holocene Period’s Initial Hydrological Recession on the Development of Neolithic Cultures along the Margin of the East Asian Summer Monsoon. Sustainability 2019, 11, 6146. https://doi.org/10.3390/su11216146
Xue W, Jin H, Liu B, Sun L, Liu Z. The Possible Stimulation of the Mid-Holocene Period’s Initial Hydrological Recession on the Development of Neolithic Cultures along the Margin of the East Asian Summer Monsoon. Sustainability. 2019; 11(21):6146. https://doi.org/10.3390/su11216146
Chicago/Turabian StyleXue, Wenping, Heling Jin, Bing Liu, Liangying Sun, and Zhenyu Liu. 2019. "The Possible Stimulation of the Mid-Holocene Period’s Initial Hydrological Recession on the Development of Neolithic Cultures along the Margin of the East Asian Summer Monsoon" Sustainability 11, no. 21: 6146. https://doi.org/10.3390/su11216146
APA StyleXue, W., Jin, H., Liu, B., Sun, L., & Liu, Z. (2019). The Possible Stimulation of the Mid-Holocene Period’s Initial Hydrological Recession on the Development of Neolithic Cultures along the Margin of the East Asian Summer Monsoon. Sustainability, 11(21), 6146. https://doi.org/10.3390/su11216146