Article

Quality Control Systems in Higher Education Supported by the Use of Mobile Messaging Services

by
Luis Matosas-López
1,*,
Cesar Bernal-Bravo
2,
Alberto Romero-Ania
3 and
Irene Palomero-Ilardia
2
1
Department of Financial Economics, Accounting and Modern Language, Rey Juan Carlos University, Paseo Artilleros s/n, 28032 Madrid, Spain
2
Department of Education Sciences, Language, Culture and Arts, Rey Juan Carlos University, Paseo Artilleros s/n, 28032 Madrid, Spain
3
Department of Applied Economics, Rey Juan Carlos University, Paseo Artilleros s/n, 28032 Madrid, Spain
*
Author to whom correspondence should be addressed.
Sustainability 2019, 11(21), 6063; https://doi.org/10.3390/su11216063
Submission received: 2 October 2019 / Revised: 25 October 2019 / Accepted: 29 October 2019 / Published: 31 October 2019

Abstract

:
This study breaks away from the immobility experienced by quality control systems in higher education. The authors, following the Sustainable Development Goals (SDGs) on quality education set by the United Nations, propose a questionnaire delivery system through mobile messaging services that overcomes the problem of the low response rates of students for these surveys. The research follows an experimental design, is developed over three years, and involves 811 subjects who are distributed in two groups: an experimental group, in which the questionnaires are delivered through mobile messaging services, and a control group. The researchers examine the existence of differences in response rates through a descriptive comparative exploration between the two groups, also applying the Student’s t-test to evaluate the significance of the findings. The results reveal that the rates for the experimental group are not only higher than those achieved for the control group but are also significant. The authors conclude that the delivery of surveys through mobile messaging services significantly increases response rates. This fact improves the representativity of the information collected and meets the goals of the quality control system with greater certainty.

1. Introduction

Quality has become a concept of essential importance in modern societies [1,2,3]. Any organized social activity can be optimized, and this optimization occurs through the creation of quality evaluation mechanisms. These mechanisms allow the control of the efficacy, efficiency, functionality and reliability of the evaluated process, and this, by definition, is the basis for preserving and improving quality in any activity [4]. At present, quality control systems are applied, in general, in all relevant areas of society: government programs, business activity, health processes, urban development, transportation, agriculture or food, among others [5]. In recent years, there is no area of social action that has remained outside of quality control systems, and, of course, the field of education is no exception.
There are many studies within the educational context that have addressed the issue of quality control in recent years [6,7,8]. According to Mateo [1], this growing interest in quality control in the educational field is determined by the development of a new management paradigm in which four principles are highlighted:
  • Principle of purpose: Educational actions pursue the attainment of previously defined objectives, both at the operational level and at the strategic level;
  • Principle of accountability: All elements or agents of the system must be audited to evaluate the degree of attainment achieved in the objectives preliminarily set;
  • Principle of subsidiarity: Although decisions should initially be made at the same level in which they will be applied, there is the possibility of transferring decision-making to a higher level with strategic competencies; and
  • Principle of self-organization and development: It is understood that the system is not static and, consequently, that agents have the obligation to manage themselves efficiently to face future changes.
Although research on quality has addressed this concept in different aspects of the educational system [9,10,11], it is within the context of higher education that this reality has been explored most extensively [12,13,14,15]. Ruiz Carrascosa [16] notes that the importance of the university as a key service in society coupled with the strong investment of funds that it requires intensifies the concern regarding the quality control of the service. In the same vein, Sierra Sánchez [3] also notes that quality control has become one of the great challenges of university management in the 21st century.
However, measuring the quality of a service with an intangible nature, as in the case of education, is not an easy task. The concept of quality in higher education can have multiple connotations, approaches or meanings, and this is reflected in the literature. Among the most common approaches, three stand out: those that focus on the idea of service, those that explore quality from the perspective of the student body, and those that approach this concept from the perspective of the teaching staff (see Table 1).
Gil Edo, Roca Puig and Camisón Zornoza [17], in their study of the customer-oriented quality of service models in public universities, highlight seven determining traits: (1) the technical dimension of the faculty, (2) the functional dimension of the faculty, (3) the accessibility and academic structure, (4) the attention of the service personnel, (5) the tangible and visible aspects of the facilities, (6) the visible aspects of the staff, and (7) the existence of complementary services (restoration, reprography, et al.).
In the same line of the service-based approach, Veciana Vergés and Capelleras i Segura [18] emphasize the importance of four relevant aspects when defining quality in the area of higher education: (1) the attitude and competence of teachers, (2) curriculum content, (3) equipment and facilities, and (4) the organizational aspect in the institution.
Resino Blázquez, Chamizo González, Cano Montero and Gutiérrez Broncano [2], in their work on quality indicators that determine student satisfaction, highlight three dimensions: (1) facilities and resources (library services, transportation, etc.), (2) academic aspects (teaching, reputation of degrees, etc.), and (3) social aspects (sports activities, exchange programs, etc.).
Similarly, a study by Alvarado Lagunas et al. [6] on the quality of a university from the student perspective reflects the existence of four critical aspects to consider: (1) physical infrastructure, (2) the teaching staff, (3) the teaching materials, and (4) the comprehensive development of the student.
Also adopting the approach of the student’s perspective, the research by González López [13] on the factors that determine quality in higher education indicates the existence of up to 13 elements: (1) competencies training, (2) the development of skills to access the labor market, (3) the development of critical thinking, (4) mechanisms of institutional evaluation (teachers, resource management, etc.), (5) services available to students, (6) functioning of governing and representative bodies, (7) student involvement in institutional objectives, (8) optimal professional specialization, (9) satisfaction of students with their personal performance, (10) the existence of associative movements, (11) availability and access to academic information, (12) the provision of supplementary training, and (13) counseling on career opportunities.
Álvarez Rojo, García Jiménez and Gil Flores [19], from discussion groups with teachers, indicate that quality in a university is defined by the interaction of four main variables: (1) the profession and teaching skills, (2) the art and vocation of teaching, (3) structural and social conditions (administrative processes, work opportunities, physical conditions or group size), and (4) the management of the dilemmas and paradoxes inherent to the university environment (research vs. teaching, innovation vs. inertia).
However, any of the previous works, regardless of the approach taken by researchers (a service-based approach, student perspective-based or teacher perspective-based), maintain a similarity: the indelible mark of the functional dimension of teachers as an essential element of quality in higher education. The control of teaching quality is not only a recurring element and cornerstone in all research of this scientific body, but it is also an aspect that sometimes overlaps with the concept of quality in university teaching in its broadest sense.

1.1. Quality Control in Teaching

Quality control in teaching has a dual purpose: on the one hand, formative; on the other hand, summative [20,21]. The formative purpose aims to obtain information on the weaknesses and strengths of the teacher with the ultimate aim of improving teaching [22]. The summative purpose, for its part, is that the information collected serves as a support for decision-making regarding the professional accreditation of teachers [23]. This dual purpose makes the quality control systems in teaching fundamental guarantors of quality in the field of higher education [24].
Paradoxically, despite the important role played by quality control systems, they have suffered an alarming immobility over the years. The review of the literature by the authors reveals that, when the first quality control systems in teaching began to appear [25], the same measurement pattern keeps repeating itself. This pattern is the implementation of student satisfaction surveys [26].
These surveys gather the degree of agreement or disagreement of the student with a series of statements related to the teacher’s performance, generating feedback that is critical to satisfy the dual purpose of the evaluation. The degree of agreement was represented, generally, by responding to questions with Likert-type scales with between five and seven response levels [27,28]. In recent decades, this pattern of quality control has only experienced slight variations. One of these variations is one which concerns the delivery of the surveys, as, in 1990, delivery began its transition from paper surveys to systems with online questionnaires through the Internet [29].
Although the pattern of teacher quality control through surveys of student satisfaction has proven to be reasonably efficient [30,31], the system is not free of limitations. This pattern addresses the psychometric challenges of satisfaction surveys: reliability, validity [32,33], leniency error [34] or the halo effect [35]. Additionally, these surveys are subject to the influence of different bias variables, such as teacher gender [36], age [37], size of the group [38], or grades expected by the student [39]. To all of the above must also be added the growing problem of low student participation.

1.2. The Problem of Response Rates for Determining Quality Control in Teaching

The low response rates of students have become one of the great threats to current quality control systems. The first consequence of these low participation rates is the overemphasis of several of the inconsistencies inherent in this quality control system [40]. The reduced response rates can increase the leniency error and the halo effect and even increase the influence of biasing variables in the evaluation. Likewise, when participation rates are excessively low, the information collected is not very representative; this compromises the significance of the results, affects the psychometric measurement and, consequently, makes it difficult to infer real conclusions about the quality of the work of the teacher [40].
This problem of participation has not only been corrected over time but has been aggravated by the implementation of questionnaires delivered online. There are many studies that show how response rates in teacher quality evaluation processes are lower when surveys are delivered online instead of on paper and in person (see Table 2).
Among the aspects that cause low response rates in these surveys is the lack of knowledge that the student has about the objective and purpose of the evaluation as well as the indiscernible impact of this exercise on teaching in the eyes of the student, especially in the short term. However, in regard to online surveys, the main cause of these low participation rates is the lack of anonymity or confidentiality perceived by the student when filling out the questionnaire [29,54,55]. This lack of confidence in the confidentiality of information is generated when, throughout the process, the student is forced to enter their credentials to access the online platform on which the survey is presented. Even when the identity of the student is irrelevant in the process and anonymity is guaranteed, this situation sows significant doubts in the student.
However, despite the misgivings that these low participation rates pose to universities, the advantages of online surveys, in terms of management, are so numerous that the transition from paper to an online questionnaire is an indisputable need. Online surveys eliminate the costs of printing, distribution, collection, scanning, data transcription and even physical storage of forms, significantly reducing the workload throughout the process [46,56].
Given that the implementation of online surveys in teacher quality control systems is such a consummate and true reality, as are their low participation rates, many institutions have adopted different types of strategies to increase response rates. Among these strategies, the following stand out: the use of reminders, the granting of extra credit and rewards in the form of coupons, or early access to grades [41,45,57,58].
However, the application of this type of measure while serving to improve response rates also entails significant drawbacks. The use of teacher quality control systems that use surveys related to obtaining incentives contributes to making the evaluation process a mechanical and obligatory task for the student to achieve the promised benefit. This causes the student to sometimes provide random answers and even answers without reading the statements [59]. This situation compromises once again the significance of the information collected, thus distorting the objective of the process and making it impossible to use the results to satisfy the stated purposes, whether formative or summative.

1.3. Objectives

The panorama of quality control systems in teaching described above, with the exception of the slight variations referenced on the implementation of online surveys and the introduction of incentives for completion, has remained practically static for decades.
For instance, the use of online questionnaires actively delivered by email has not led to any variation in this static scenario. Studies such as those of Goodman, Anson and Belcheir [58], Standish, Joines, Young and Gallagher [60] or Boswell [61] confirm that the use of email does not imply substantial improvements over other passive quality control systems that also use questionnaires delivered online.
This situation has generated a scenario of immobility that has not contributed to overcoming the limitations to which these quality control systems are subjected. These limitations are, therefore, a good example of the need for latent evolution in the field of quality control systems in the context of higher education. This research breaks away from the existing immobility by postulating a new strategy for the delivery of online questionnaires using mobile messaging services.
The present work, in addition to postulating a survey delivery system that improves the response rates of existing systems, is adapted to the social behaviors that young people currently exhibit. The authors, in view of other studies that corroborate the total integration of mobile devices among students in the university context [62,63,64,65], propose a delivery system which is sustainable and adapted to the evolution of youths’ social behavior at the current time.
Furthermore, according to the Sustainable Development Goals (SDG) plan set by the United Nations General Assembly in 2015 [66], obtaining a quality education is the foundation of creating sustainable development, with the lack of adequate teachers being one of the reasons for the lack of quality education. Analyzing and improving the quality control systems in education through an efficient proposal which is not based on traditional paper questionnaires is in line with the SDG fourth goal on quality education, since one of the aims in this SDG plan is to increase the supply of qualified teachers.
The study developed by the authors, based on the implementation of the referenced strategy, raises two research questions:
RQ1: 
Are the response rates achieved in the delivery of quality control surveys for teaching efficiency using mobile messaging services greater than those obtained with traditional online delivery systems?
RQ2: 
Are there significant differences between the response rates achieved in the delivery of quality control surveys for teaching efficiency using mobile messaging services and those obtained with traditional online delivery systems?

2. Materials and Methods

2.1. Sample and Participants

This research was developed throughout the academic years 2016–2017, 2017–2018 and 2018–2019 in the School of Legal and Social Sciences of the Rey Juan Carlos University (Universidad Rey Juan Carlos, URJC). Among all the courses taught in the referenced school, researchers selected, by incidental sampling [67], ten courses from ten different programs. The total number of participants in the study was 811 students. For a confidence level of 98% set by the authors, and assuming that the value of P is equal to Q, the maximum accepted sampling error is 3.90%. A sampling error below 5% provides the study with sufficient statistical significance to draw conclusions about the general population [68].
The research, following the guidelines of Hernández Pina [69] for the design of experimental studies, is developed in parallel in two groups of participants: an experimental group, in which quality control surveys were delivered using mobile messaging services (Group A); and a control group, in which the surveys were delivered through the Student Services Portal following the management protocol traditionally used by the URJC (Group B). The sociodemographic data (age and gender) for both groups are shown in Table 3.
Groups A and B were formed by selecting participants in courses in which the same teacher teaches in the two subgroups of students simultaneously throughout the course. Given that this was based on a sample of ten courses in ten different programs, there were 20 subgroups of students who took part in the study. Ten subgroups of students formed the experimental group, and ten subgroups constituted the controls. There were 408 participants in group A and 403 participants in group B.
All subjects in the sample gave their informed consent for inclusion before they participated in the study. The research was conducted in accordance with the ethical codes accepted by the international academic community [70].

2.2. Procedure

In both groups, an online survey was used, with ten items represented by Likert-type scales with five levels (1—strongly disagree/5—strongly agree). The survey was delivered to both groups, allowing a period of four weeks for the student to complete the survey.
In group A, time was counted from the day of sending the message that directed them to the questionnaire. In group B, the four weeks were counted from the date the survey was activated on the Student Services Portal. After the four-week completion period ended, the researchers compiled the answers and calculated the participation rates for the ten subgroups considered in each of the two groups. The calculation of the response rates was performed using the number of students enrolled in the target subgroup as a reference. In the particular case of group A, enrollees who were part of the sample, prior to the experiment, granted explicit consent for the use of their cell phone number for research purposes.
Once the participation rates of each group were known, the two research questions posed were answered. To respond to RQ1, a comparative descriptive exploration of the rates reached in each group was performed, considering their differences [71]. To answer RQ2, it was determined whether the response rates followed a normal distribution by extracting the Shapiro–Wilk statistic [72]. After that, the existence of significant differences in these rates was examined between groups A and B, performing a parametric analysis for independent samples using the Student’s t-test [73]. All analyses were developed using the IBM SPSS version 25 software package.

2.2.1. Delivery through Mobile Messaging Services (Group A)

In group A, the quality control survey was delivered proactively through a mobile messaging service via SMS. In line with previous studies [40], the researchers opted for the SMS format and not for messaging services supported by data traffic such as WhatsApp (XMPP (Extensible Messaging and Presence Protocol)) or Telegram (MTProto (Mobile Transport Protocol)), which, although cheaper, offer lower guarantees for research purposes.
Researchers analyzed the technical specifications of several mobile messaging service companies, considering the factors of security, confidentiality, technical support, delivery reliability and personalization. After this analysis and the relevant tests with the different providers, the researchers opted for the messaging service provider Textanywhere. When the company was selected, the parameters required for sending were configured through the web control panel enabled by the provider in its platform. The configured parameters were name of the sender, coding of text characters and scheduling.
The sender was designated as “URJC” to allow the student to identify the message in the SMS service inbox of their mobile device. The text, instead of using traditional character coding in the GSM format (Global System for Mobile Communications), was configured using Unicode character encoding. This allowed the use of accents and other special characters in the message. The text also included a shortened link to access to the online teacher quality control survey. The SMS content amounted to 158 characters (spaces included):
“UNIVERSIDAD REY JUAN CARLOS-Calidad Docente: Haz clic en el enlace para cumplimentar la encuesta: http://bit.ly/2ywPZBr Tu colaboración es esencial. GRACIAS”
“REY JUAN CARLOS UNIVERSITY–Teaching Quality: Click on the link to complete the survey: http://bit.ly/2ywPZBr Your collaboration is essential. THANK YOU”
Researchers created ten SMS messages for the ten subgroups considered in group A. The only difference in each SMS was the shortened link that directed the student specifically to the survey on quality control of teaching for the course taken. As a result, ten different links were also created to collect, separately, the responses of students from each of the ten subgroups. The use of SMS and differentiated links allowed the student to directly access the survey without being forced to enter their institutional credentials. Each link could be accessed only once from the same mobile device, so the students could not reply to the questionnaire several times.
Regarding scheduling, the ten SMS were sent in ten different sending campaigns by matching the moment of the launch of the message with the last class session of the course taken. All the SMS were sent between 16:00 p.m. and 18:00 p.m., and no reminder was sent.
Finally, the researchers, 48 hours after the execution of each sending campaign, accessed the supplier platform to extract the delivery reports for the different campaigns. The delivery reports indicated that 99.86% of the sent messages were delivered satisfactorily.

2.2.2. Delivery through the Student Services Portal (Group B)

In the control group or group B, the survey was delivered passively following the protocol routinely used by the URJC. This system is supported by the Student Services Portal, which is accessed from the university intranet. The use of the Student Services Portal required students to enter their institutional credentials to access the platform on which they later filled out the questionnaire.
Once the student entered the platform, the quality control survey was enabled in the section containing records or grades. This delivery system required the student to complete the teacher quality control survey to obtain early access to the final course grade.

3. Results

3.1. Results in Response to Research Question RQ1

First, the researchers conducted a descriptive comparative exploration of the rates achieved and their respective differences. The findings reveal that the response rates in the group in which the survey was delivered through SMS (group A) are higher than those achieved in the group in which the questionnaire was delivered passively through the Student Services Portal (group B).
This improvement is observed in the ten courses studied, with differences in favor of the messaging delivery system ranging from 0.12 to 0.31 points (see Table 4). Likewise, the aggregate response rate for group A (0.92) greatly exceeds the joint participation rate of group B (0.71), with a difference of 0.21 points in this case.
Likewise, the descriptive exploration of the response rates achieved in both groups shows coefficients of standard deviation that reinforce the data presented previously. In group A, there is a certain concentration around the response rates reached in the different programs (SD = 0.035); in group B, a higher degree of dispersion of the response rates is obtained (SD = 0.098).

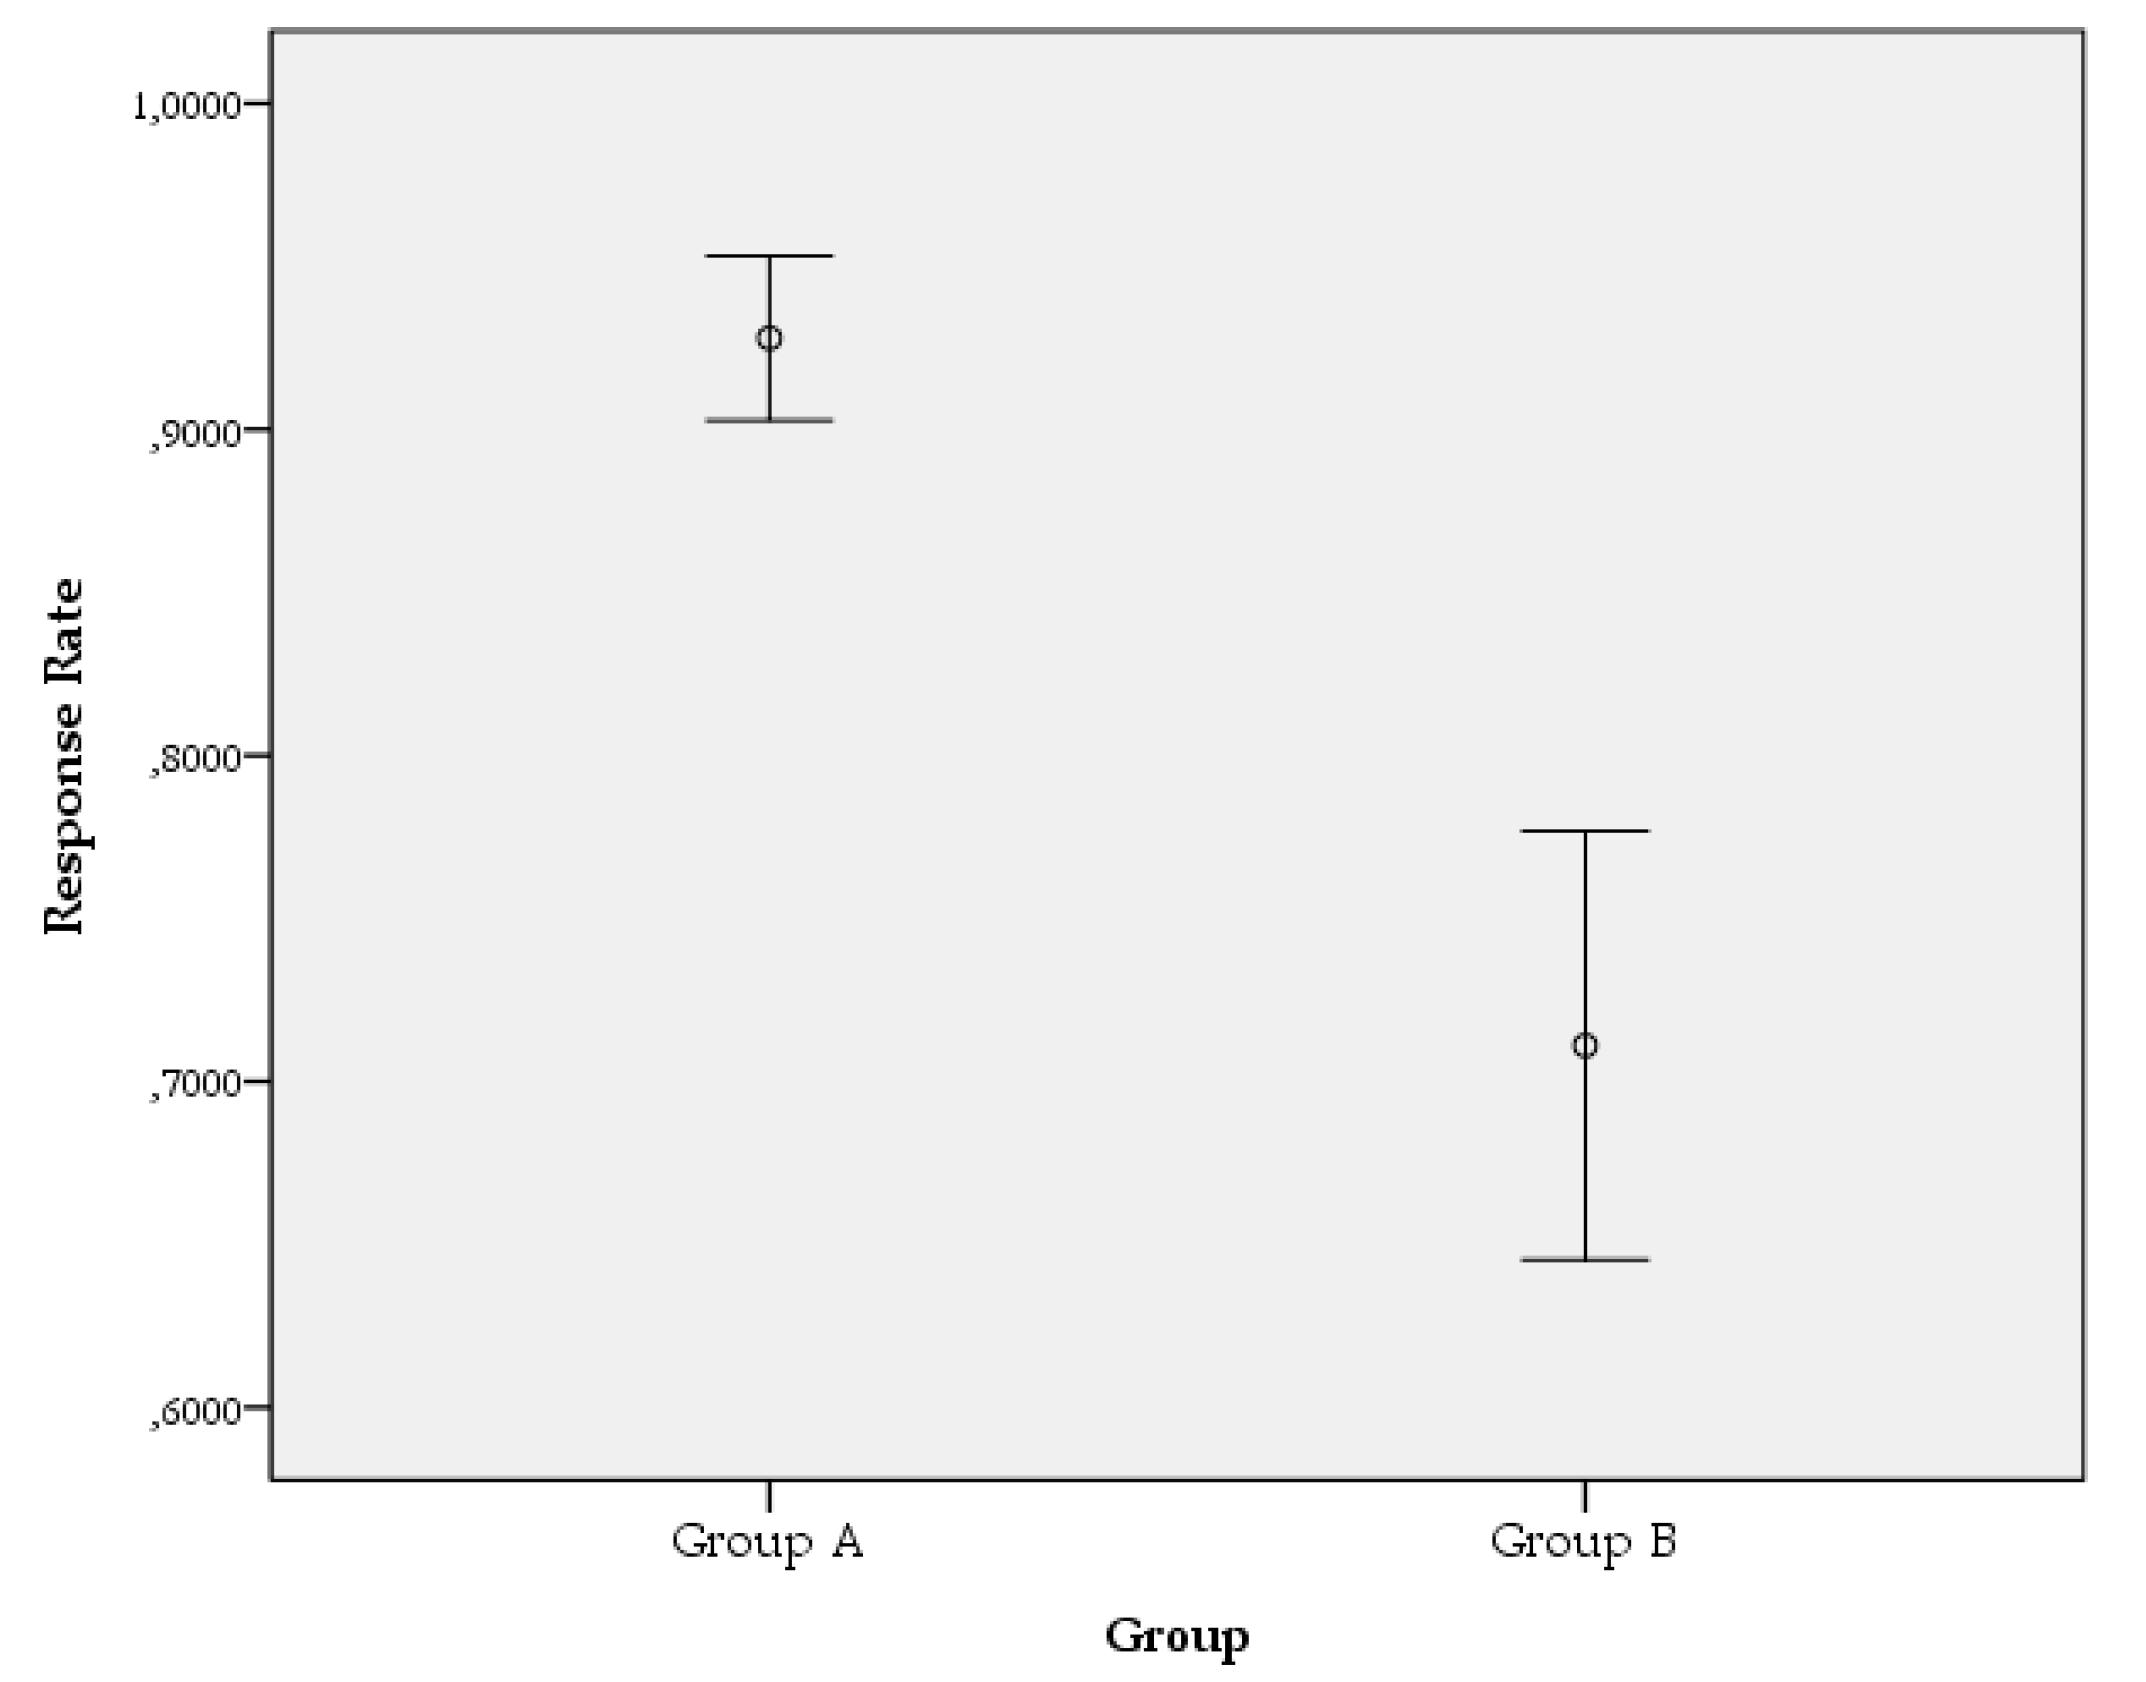
3.2. Results in Response to Research Question RQ2

The second research question is addressed by developing a parametric analysis for independent samples using the Student’s t-test. However, before applying this test, the authors checked whether the rate data collected for both groups followed a normal distribution. For this purpose, the Shapiro–Wilk test was used. The p-value was 0.431 for the data of group A, and the p-value was 0.404 for the data of group B; both values are above 0.05, evincing that the participation values were normally distributed.
With the normality of the data contrasted, parametric analysis was performed for independent samples (see Table 5). The coefficient of significance of Levene’s test revealed that researchers must reject the assumption of equality of variances. Therefore, under the assumption of inequal variances, the Student’s t-test, at a significance level of α = 0.05, presented a t statistic of 6.969 with 11.584 degrees of freedom that yielded a p-value < 0.05. The two-tailed significance of less than 0.05 and even less than 0.001 indicates that the differences observed in the response rates obtained in both groups were significant.
Likewise, and in line with the above, the simple error bar graph extracted, for a confidence interval of 95%, showed not only the absence of overlap between the response rates but also a substantial distance between these values in both groups (see Figure 1). This fact again confirms the presence of explicit differences between the two survey delivery systems applied.

4. Discussion

The participation rates achieved with the mobile messaging-supported delivery system considerably surpass the rates achieved in previous studies that also use online quality control systems for teacher evaluation [45,74]. It should also be noted that the aggregate response rate of 0.92 in group A is well above the average participation of 0.60 achieved in the studies by Chapman and Joines [75] and Avery, Bryant, Mathios, Kang and Bell [48] for online delivery systems.
The participation rates achieved through the delivery system via SMS also satisfy the response rate requirements per number of students recommended by Nulty [71] based on the estimation formula proposed by Dillman [76]. Although Dillman’s calculations are originally based on the premise that the probability that the student does not complete the survey is identical to the probability that he or she does (50:50), Nulty develops his estimates considering that the probability of not completing a survey is 70:30, supposing a stricter—but probably also more realistic—scenario. From there, Nulty’s work presents two scenarios of recommended participation rates: on the one hand, a scenario of “liberal” conditions and, on the other hand, a scenario of “stringent” conditions. For the first, the author assumes a sampling error of 10% and a confidence interval of 80%. For the second, a sampling error of 3% and a confidence interval of 95% are assumed. In the so-called “liberal” scenario, the expected response rates for groups, such as those considered in this study, between 27 and 61 students range from 0.25 to 0.58. In the strictest scenario, the response rates for these group sizes range from 0.90 to 0.97.
Considering the previously described scenarios, Table 6 shows that the rates obtained for group A far exceed those required as a function of the size of the group under “liberal” conditions in the ten courses analyzed and that they moderately satisfy those estimated for “stringent” conditions. In the scenario of “stringent” conditions, the rates achieved with the messaging delivery system satisfy Nulty’s estimates in eight of the ten courses examined, leaving only the courses of programs 6 and 8 at 0.05 and 0.03 points, respectively, from the minimum recommended rate.
The delivery system described for group A, in line with Moss and Hendry [77], eliminates password access to the questionnaire, making it unnecessary for the student to use their username and password in any step prior to completing the survey. The use of SMS to distribute the survey moves the response collection interface from the Student Services Portal to an open form on the student’s mobile device. As a consequence, as the information collection is not developed through the Student Services Portal and the institutional intranet, but in an open form, the student should not have to enter his/her credentials at any point in the process.

Limitations and Further Research

Even though the focus of the present research is not the lack of anonymity perceived during the survey but the improvement in the response rates, the authors, in line with previous studies [29,40,54,55], state that one of the reasons that could lead to this improvement in participation is the sense of privacy presumably experienced by the student in the mobile messaging-supported delivery system.
However, the present work does not explore this topic in depth, nor does it provide evidence in this regard. Therefore, the statement made by the authors regarding the influence of the perceived anonymity on the response rates should be considered only as an impression to be taken with caution. Although this issue has been explored more intensely by the studies previously referenced [29,40,54,55], further research is still needed to expand our understanding of this influence in the field of quality control systems in the university context.

5. Conclusions

The findings of this study respond positively and conclusively to the two research questions posed by the authors. The results show not only that the response rates obtained in both groups present significant differences, but also that the rates achieved using the SMS delivery of surveys are substantially improved compared with those obtained using the Student Services Portal delivery system.
Additionally, increases in response rates obtained with the SMS delivery system improve the representativity of the information collected, which increases the significance of the results and makes it possible for them to be used to satisfy the purposes—both formative and summative—of the quality control system with greater assurance. Considering the importance and significance of the feedback provided in the surveys of student satisfaction, using appropriate tools to increase response rates in these quality control systems is a critical issue.
The delivery of teacher quality surveys through mobile messaging services offers significant improvements in teacher quality control systems in terms of student participation. In light of the findings, the authors conclude that the delivery of SMS surveys represents an improved alternative to current teacher quality control systems, contributing to ending the immobility observed and opening new avenues of study.

Author Contributions

Conceptualization, data curation, formal analysis and investigation, L.M.-L.; methodology, project administration and supervision, C.B.-B.; resources and writing—original draft, A.R.-A.; resources and writing—review & editing, I.P.-I. All authors equally contributed to this article.

Funding

This research was funded by the European Regional Development Fund (FEDER) and the Spanish Ministry of Economy and Competitiveness, grant number EDU2015-64015-C3-1-R. Research project: “Media competencies of citizens in emerging digital media (smartphones and tablets): Innovative practices and educommunicative strategies in multiple contexts”.

Conflicts of Interest

The authors declare no conflict of interest.

References

  1. Mateo, J. La evaluación del profesorado y la gestión de la calidad de la educación. Hacia un modelo comprensivo de evaluación sistemática de la docencia. Rev. Investig. Educ. 2000, 18, 7–34. [Google Scholar]
  2. Resino Blázquez, J.J.; Chamizo González, J.; Cano Montero, E.I.; Gutiérrez Broncano, S. Calidad de vida universitaria: Identificación de los principales indicadores de satisfacción estudiantil. Rev. Educ. 2013, 362, 458–484. [Google Scholar]
  3. Sierra Sánchez, J. Factors influencing a student’s decision to pursue a communications degree in Spain. Intang. Cap. 2012, 8, 43–60. [Google Scholar] [CrossRef]
  4. De La Orden, A. Evaluación del rendimiento educativo y la calidad de la enseñanza. En Instituto de Pedagogía “San José de Calasanz”. In La Calidad de la Educación; Consejo Superior de Investigaciones Científicas (CSIC): Madrid, Spain, 1981; pp. 111–131. [Google Scholar]
  5. De La Orden, A. Evaluación y calidad: Análisis de un modelo. Estud. Sobre Educ. 2009, 16, 17–36. [Google Scholar]
  6. Alvarado Lagunas, E.; Ramírez, D.M.; Téllez, E.A. Percepción de la calidad educativa: Caso aplicado a estudiantes de la Universidad Autónoma de Nuevo León y del Instituto Tecnológico de Estudios Superiores de Monterrey. Rev. Educ. Super. 2016, 45, 55–74. [Google Scholar] [CrossRef]
  7. Gazïel, H.; Warnet, M.; Cantón Mayo, I. La Calidad en Los Centros Docentes Del Siglo XXI: Propuestas y Experiencias Prácticas; Muralla: Madrid, Spain, 2000; ISBN 8471336995. [Google Scholar]
  8. Muñoz Cantero, J.M.; Ríos De Deus, M.P.; Abalde Paz, E. Evaluación docente vs Evaluación de la calidad. RELIEVE Rev. Electrón. Investig. Eval. Educ. 2002, 8, 103–134. [Google Scholar] [CrossRef]
  9. Debón Lamarque, S.; Romo Castillejo, A. El liderazgo del director como factor de cambio de la calidad de la enseñanza. In Factores Que Favorecen la Calidad Educativa; Ruiz Carrascosa, J., Pérez Ferra, M., Eds.; Universidad de Jaén: Jaen, Spain, 1995; pp. 134–156. ISBN 8488942354. [Google Scholar]
  10. Fernández Millán, J.M.; Fernández Navas, M. Elaboración de una escala de evaluación de desempeño para educadores sociales en centros de protección de menores. Intang. Cap. 2013, 9, 571–589. [Google Scholar]
  11. Torres González, J.A. La formación del profesorado como factor favorecedor de la calidad educativa. In Factores Que Favorecen la Calidad Educativa; Ruiz Carrascosa, J., Pérez Ferra, M., Eds.; Universidad de Jaén: Jaén, Spain, 1995; pp. 69–133. ISBN 8488942354. [Google Scholar]
  12. Bienayme, A. Eficiencia y calidad en la educación superior. In Calidad, Eficiencia y Equidad en la Educación Superior; Universidad Autónoma de Guadalajara: Guadalajara, Mexico, 1986; p. 312. [Google Scholar]
  13. González López, I. Determinación de los elementos que condicionan la calidad de la universidad: Aplicación práctica de un análisis factorial. RELIEVE Rev. Electrón. Investig. Eval. Educ. 2003, 9, 83–96. [Google Scholar] [CrossRef]
  14. Hernández, H.; Martínez, D.; Rodríguez, J. Gestión de la calidad aplicada en el mejoramiento del sector universitario. Rev. Espac. 2017, 38, 29. [Google Scholar]
  15. Lago de Vergara, D.; Gamoba Suárez, A.A.; Montes Miranda, A.J. Calidad de la educación superior: Un análisis de sus principales determinantes. Saber Cienc. Lib. 2014, 9, 157–170. [Google Scholar] [CrossRef]
  16. Ruiz Carrascosa, J. La evaluación de la enseñanza por los alumnos en el plan nacional de evaluación de la calidad de las universidades. Construcción de un instrumento de valoración. Rev. Investig. Educ. 2000, 18, 433–445. [Google Scholar]
  17. Gil Edo, M.T.; Roca Puig, V.; Camisón Zornoza, C. Hacia modelos de calidad de servicio orientados al cliente en las universidades públicas: El caso de la Universitat Jaume I. Investig. Eur. Dir. Econ. Empresa 1999, 5, 69–92. [Google Scholar]
  18. Veciana Vergés, J.M.; Capelleras Segura, J.L. Calidad de servicio en la enseñanza universitaria desarrollo y validación de una escala media. Rev. Eur. Dir. Econ. Empres. 2004, 13, 55–72. [Google Scholar]
  19. Álvarez Rojo, V.; García Jiménez, E.; Gil Flores, J. La calidad de la enseñanza universitaria desde la perspectiva de los profesores mejor valorados por los alumnos. Rev. Educ. 1999, 319, 273–290. [Google Scholar]
  20. Linse, A.R. Interpreting and using student ratings data: Guidance for faculty serving as administrators and on evaluation committees. Stud. Educ. Eval. 2017, 54, 94–106. [Google Scholar] [CrossRef]
  21. Nygaard, C.; Belluigi, D.Z. A proposed methodology for contextualised evaluation in higher education. Assess. Eval. High. Educ. 2011, 36, 657–671. [Google Scholar] [CrossRef]
  22. Sproule, R. Student Evaluation of Teaching: A Methodological Critique. Educ. Policy Anal. Arch. 2000, 8, 50. [Google Scholar] [CrossRef]
  23. Huybers, T. Student evaluation of teaching: The use of best–worst scaling. Assess. Eval. High. Educ. 2014, 39, 496–513. [Google Scholar] [CrossRef]
  24. Matosas-López, L.; Leguey-Galán, S.; Doncel-Pedrera, L.M. Converting Likert scales into Behavioral Anchored Rating Scales(Bars) for the evaluation of teaching effectiveness for formative purposes. J. Univ. Teach. Learn. Pract. 2019, 16, 1–24. [Google Scholar]
  25. Remmers, H.H. The relationship between students’ marks and student attitude toward instructors. Sch. Soc. 1928, 28, 759–760. [Google Scholar]
  26. Leguey-Galán, S.; Leguey-Galán, S.; Matosas-López, L. ¿De qué depende la satisfacción del alumnado con la actividad docente? Espacios 2018, 39, 13–29. [Google Scholar]
  27. Lizasoain-Hernández, L.; Etxeberria-Murgiondo, J.; Lukas-Mujika, J.F. Propuesta de un nuevo cuestionario de evaluación de los profesores de la Universidad del País Vasco. Estudio psicométrico, dimensional y diferencial. RELIEVE Rev. Electrón. Investig. Evaluac. Educ. 2017, 23, 1–21. [Google Scholar] [CrossRef]
  28. Molero López-Barajas, D.M.; Ruiz Carrascosa, J. La evaluación de la docencia universitaria. Dimensiones y variables más relevantes. Rev. Investig. Educ. 2005, 23, 57–84. [Google Scholar]
  29. Layne, B.H.; Decristoforo, J.R.; Mcginty, D. Electronic versus traditional student ratings of instruction. Res. High. Educ. 1999, 40, 221–232. [Google Scholar] [CrossRef]
  30. Vanacore, A.; Pellegrino, M.S. How Reliable are Students’ Evaluations of Teaching (SETs)? A Study to Test Student’s Reproducibility and Repeatability. Soc. Indic. Res. 2019. [Google Scholar] [CrossRef]
  31. Zhao, J.; Gallant, D.J. Student evaluation of instruction in higher education: Exploring issues of validity and reliability. Assess. Eval. High. Educ. 2012, 37, 227–235. [Google Scholar] [CrossRef]
  32. Marsh, H.W. Student evaluations of university teaching: Dimensionality, reliability, validity, potential biases, utility. J. Educ. Psychol. 1984, 76, 707–754. [Google Scholar] [CrossRef]
  33. Marsh, H.W. Students’ Evaluations of University Teaching: Dimensionality, Reliability, Validity, Potential Biases and Usefulness. In The Scholarship of Teaching and Learning in Higher Education: An Evidence-Based Perspective; Perry, R.P., Ed.; Springer Netherlands: Dordrecht, The Netherlands, 2007; pp. 319–383. [Google Scholar]
  34. Sharon, A.T.; Bartlett, C.J. Effect of instructional conditions in producing leniency on two types of rating scales. Pers. Psychol. 1969, 22, 251–263. [Google Scholar] [CrossRef]
  35. Bernardin, H.J. Behavioural expectation scales versus summated scales. J. Appl. Psychol. 1977, 62, 422–427. [Google Scholar] [CrossRef]
  36. Mitchell, K.M.W.; Martin, J. Gender Bias in Student Evaluations. PS 2018, 51, 648–652. [Google Scholar] [CrossRef] [Green Version]
  37. Wilson, J.H.; Beyer, D.; Monteiro, H. Professor Age Affects Student Ratings: Halo Effect for Younger Teachers. Coll. Teach. 2014, 62, 20–24. [Google Scholar] [CrossRef]
  38. Gannaway, D.; Green, T.; Mertova, P. So how big is big? Investigating the impact of class size on ratings in student evaluation. Assess. Eval. High. Educ. 2017, 43, 1–10. [Google Scholar] [CrossRef]
  39. Griffin, B.W. Grading leniency, grade discrepancy, and student ratings of instruction. Contemp. Educ. Psychol. 2004, 29, 410–425. [Google Scholar] [CrossRef]
  40. Matosas-López, L.; García-Sánchez, B. Beneficios de la distribución de cuestionarios web de valoración docente a través de mensajería SMS en el ámbito universitario: Tasas de participación, inversión de tiempo al completar el cuestionario y plazos de recogida de datos. Rev. Complut. Educ. 2019, 30, 831–845. [Google Scholar] [CrossRef]
  41. Ha, T.S.; Marsh, J.; Jones, J. A Web-based System for Teaching Evaluation. In Proceedings of the New Challenges and Innovations in Teaching and Training into the 21st Centruy (NCITT), Hong Kong, China, May 1998; Volume 11, pp. 1–11. [Google Scholar]
  42. Woodward, D.K. Comparison of course evaluations by traditional and computerized on-line methods. Am. J. Pharm. Educ. 1998, 62, 90S. [Google Scholar]
  43. Thorpe, S.W. Online student evaluation of instruction: An Investigation of non-response bias. In Proceedings of the 42nd Annual Forum for the Association for Institutional Research, Toronto, Japan, 2–5 June 2002; pp. 1–14. [Google Scholar]
  44. Watt, S.; Simpson, C.; McKillop, C.; Nunn, V. Electronic Course Surveys: Does automating feedback and reporting give better results? Assess. Eval. High. Educ. 2002, 27, 325–337. [Google Scholar] [CrossRef]
  45. Dommeyer, C.J.; Baum, P.; Hanna, R.W.; Chapman, K.S. Gathering faculty teaching evaluations by in-class and online surveys: Their effects on response rates and evaluations. Assess. Eval. High. Educ. 2004, 29, 611–623. [Google Scholar] [CrossRef]
  46. Anderson, H.; Cain, J.; Bird, E. Online student course evaluations review of literature and a pilot study. Am. J. Pharm. Educ. 2005, 2, 1–10. [Google Scholar] [CrossRef]
  47. Ballantyne, C. Moving student evaluation of teaching online: Reporting pilot outcomes and issues with a focus on how to increase student response rate. In Proceedings of the 2005 Australasian Evaluations Forum: University Learning and Reaching: Evaluating and Enhancing the Experience, Sydney, Australia, 28–29 November 2005. [Google Scholar]
  48. Avery, R.J.; Bryant, W.K.; Mathios, A.; Kang, H.; Bell, D. Electronic Course Evaluations: Does an Online Delivery System Influence Student Evaluations? J. Econ. Educ. 2006, 37, 21–37. [Google Scholar] [CrossRef]
  49. Nowell, C.; Gale, L.R.; Handley, B. Assessing faculty performance using student evaluations of teaching in an uncontrolled setting. Assess. Eval. High. Educ. 2010, 35, 463–475. [Google Scholar] [CrossRef]
  50. Morrison, R. A comparison of online versus traditional student end-of-course critiques in resident courses. Assess. Eval. High. Educ. 2011, 36, 627–641. [Google Scholar] [CrossRef]
  51. Stowell, J.R.; Addison, W.E.; Smith, J.L. Comparison of online and classroom-based student evaluations of instruction. Assess. Eval. High. Educ. 2012, 37, 465–473. [Google Scholar] [CrossRef]
  52. Gerbase, M.W.; Germond, M.; Cerutti, B.; Vu, N.V.; Baroffio, A. How Many Responses Do We Need? Using Generalizability Analysis to Estimate Minimum Necessary Response Rates for Online Student Evaluations. Teach. Learn. Med. 2015, 27, 395–403. [Google Scholar] [CrossRef]
  53. Stanny, C.J.; Arruda, J.E. A comparison of student evaluations of teaching with online and paper-based administration. Scholarsh. Teach. Learn. Psychol. 2017, 3, 198–207. [Google Scholar] [CrossRef]
  54. Dommeyer, C.J.; Baum, P.; Hanna, R.W. College Students’ Attitudes Toward Methods of Collecting Teaching Evaluations: In-Class Versus On-Line. J. Educ. Bus. 2002, 78, 11–15. [Google Scholar] [CrossRef]
  55. Sorenson, D.L.; Reiner, C. Charting the Uncharted Seas of Online Student Ratings of Instruction. New Dir. Teach. Learn. 2003, 2003, 1–24. [Google Scholar] [CrossRef]
  56. Nair, C.S.; Adams, P. Survey platform: A factor influencing online survey delivery and response rate. Qual. High. Educ. 2009, 15, 291–296. [Google Scholar] [CrossRef]
  57. Ballantyne, C. Online Evaluations of Teaching: An Examination of Current Practice and Considerations for the Future. New Dir. Teach. Learn. 2003, 103–112. [Google Scholar] [CrossRef]
  58. Goodman, J.; Anson, R.; Belcheir, M. The effect of incentives and other instructor-driven strategies to increase online student evaluation response rates. Assess. Eval. High. Educ. 2015, 40, 958–970. [Google Scholar] [CrossRef]
  59. Matosas-López, L.; Leguey-Galán, S.; Leguey-Galán, S. Evaluación de la calidad y la eficiencia docente en el contexto de la educación superior: Alternativas de mejora. In La Educación Superior en el Siglo XXI: Una Mirada Multidisciplinaria; Gómez-Galán, J., Martín-Padilla, A.H., Cobos, D., y López-Meneses, E., Eds.; UMET: Wheaton, IL, USA, 2019; pp. 240–257. ISBN 978-1-943697-21-2. [Google Scholar]
  60. Standish, T.; Joines, J.A.; Young, K.R.; Gallagher, V.J. Improving SET Response Rates: Synchronous Online Administration as a Tool to Improve Evaluation Quality. Res. High. Educ. 2018, 59, 812–823. [Google Scholar] [CrossRef]
  61. Boswell, S.S. Ratemyprofessors is hogwash (but I care): Effects of Ratemyprofessors and university-administered teaching evaluations on professors. Comput. Hum. Behav. 2016, 56, 155–162. [Google Scholar] [CrossRef]
  62. Salcines-Talledo, I.; González-Fernández, N. Diseño y Validación del Cuestionario “Smartphone y Universidad. Visión del Profesorado” (SUOL). Rev. Complut. Educ. 2016, 27, 603–632. [Google Scholar] [CrossRef]
  63. Al-Emran, M.; Elsherif, H.M.; Shaalan, K. Investigating attitudes towards the use of mobile learning in higher education. Comput. Hum. Behav. 2016, 56, 93–102. [Google Scholar] [CrossRef]
  64. Champagne, M.V. Student use of mobile devices in course evaluation: A longitudinal study. Educ. Res. Eval. 2013, 19, 636–646. [Google Scholar] [CrossRef]
  65. Young, K.; Joines, J.; Standish, T.; Gallagher, V. Student evaluations of teaching: The impact of faculty procedures on response rates. Assess. Eval. High. Educ. 2018, 44, 37–49. [Google Scholar] [CrossRef]
  66. United Nations (UN). Post-2015 Development Agenda; United Nations: New York, NY, USA, 2015; Volume A 69/L.85. [Google Scholar]
  67. Albert Gómez, M.J. La Investigación Educativa: Claves Teóricas; McGraw-Hill: Madrid, Spain, 2006; ISBN 9788448159429. [Google Scholar]
  68. Matosas-López, L.; Romero-Ania, A.; Cuevas-Molano, E. ¿Leen los universitarios las encuestas de evaluación del profesorado cuando se aplican incentivos por participación? Una aproximación empírica. Rev. Iberoam. Sobre Calid. Efic. Cambio Educ. 2019, 17, 99–124. [Google Scholar] [CrossRef]
  69. Hernández Pina, F. Diseños de investigación experimental. In Métodos de Investigación en Psicopedagogía; Buendía, L., Colas Bravo, P., Hernández Pina, F., Eds.; McGraw-Hill: Madrid, Spain, 1997; pp. 91–117. ISBN 84-481-1254-7. [Google Scholar]
  70. Buendía Eisman, L.; Berrocal de Luna, E. La ética de la investigación educativa. Agora Digit. 2001, 1, 1–14. [Google Scholar]
  71. Nulty, D.D. The adequacy of response rates to online and paper surveys: What can be done? Assess. Eval. High. Educ. 2008, 33, 301–314. [Google Scholar] [CrossRef]
  72. Mohd Razali, N.; Bee Wah, Y. Power comparisons of Shapiro-Wilk, Kolmogorov-Smirnov, Lilliefors and Anderson-Darling tests. J. Stat. Model. Anal. 2011, 2, 21–33. [Google Scholar]
  73. Matosas-López, L. Diferencias en las puntuaciones de las encuestas de valoración del profesorado en función del tipo de cuestionario: Comparativa cuestionarios Likert vs cuestionarios BARS. Rev. Infancia Educ. Aprendiz. 2019, 5, 371–378. [Google Scholar] [CrossRef]
  74. Nair, C.; Wayland, C.; Soediro, S. Evaluating the student experience: A leap into the future. In Proceedings of the Australasian Evaluations Forum: University Learning and Teaching: Evaluating and Enhancing the Experience, Sydney, Australia, 28–29 November 2005. [Google Scholar]
  75. Chapman, D.D.; Joines, J.A. Strategies for Increasing Response Rates for Online End-of-Course Evaluations. Int. J. Teach. 2017, 29, 47–60. [Google Scholar]
  76. Dillman, D.A. Mail and Internet Surveys: The Tailored Design Method, 2nd ed.; John Wiley and Sons: New York, NY, USA, 2000. [Google Scholar]
  77. Moss, J.; Hendry, G. Use of electronic surveys in course evaluation. Br. J. Educ. Technol. 2002, 33, 583–592. [Google Scholar] [CrossRef]
Figure 1. Simple error bar graph: group A vs. group B.
Sustainability 11 06063 g001
Table 1. Aspects of quality.
AuthorsApproach of QualityAspects of Quality Considered
Gil Edo, Roca Puig and Camisón Zornoza [17]Service-based approachFaculty technical dimension, faculty functional dimension, academic structure, service personnel, facilities, staff, complementary services
Veciana Vergés and Capelleras i Segura [18]Service-based approachTeachers´ competence, curriculum, equipment and facilities, organization
Resino Blázquez et al. [2]Student perspective-basedFacilities, academic aspects, social aspects
Alvarado Lagunas et al. [6]Student perspective-basedInfrastructure, teaching staff, teaching materials, student´s development
González López [13]Student perspective-basedCompetencies, skills for the labor market, critical thinking, institutional evaluation, services, representative bodies, student involvement, professional specialization, students´ performance, associative movements, academic information, supplementary training, career opportunities
Álvarez Rojo, García Jiménez and Gil Flores [19]Teacher perspective-basedTeaching skills, vocation of teaching, structural and social conditions, management of the university environment
Table 2. Response rates: paper vs. online.
AuthorsPaper Response RateOnline Response RateDifference
Ha, Marsh and Jones [41]0.60.23+ 0.37
Woodward [42]0.450.33+ 0.12
Layne et al. [29]0.600.47+ 0.13
Thorpe [43]0.500.46+ 0.04
Watt, Simpson, McKillo and Nunn [44]0.330.32+ 0.01
Dommeyer, Baum, Hanna and Chapman [45]0.750.43+ 0.32
Anderson, Cain and Bird [46]From 0.80 to 0.81From 0.75 to 0.89From + 0.05 to − 0.08
Ballantyne [47]0.550.47+ 0.08
Avery, Bryant, Mathios, Kang and Bell [48]0.720.48+ 0.24
Nowell, Gale and Handley [49]0.720.28+ 0.44
Morrison [50]0.970.21+ 0.76
Stowell, Addison and Smith [51]0.810.61+ 0.20
Gerbase, Germond, Cerutti, Vu and Baroffio [52]0.740.30+ 0.44
Stanny and Arruda [53]From 0.71 to 0.72From 0.32 to 0.34From + 0.39 to + 0.38
Table 3. Sociodemographic data by group.
AgeGender
GroupMeanStandard DeviationMaleFemale
Group A20.011.1446.61%53.39%
Group B20.861.7349.24%50.76%
Total, sample20.521.6847.99%52.01%
Table 4. Response rates: group A vs. group B.
Response Rates *
Course-ProgramGroup AGroup BDifference
Program 10.970.66+ 0.31
Program 20.960.84+ 0.12
Program 30.940.81+ 0.13
Program 40.930.71+ 0.22
Program 50.910.64+ 0.27
Program 60.880.59+ 0.29
Program 70.910.74+ 0.17
Program 80.870.71+ 0.16
Program 90.970.82+ 0.15
Program 100.940.59+ 0.35
Total0.920.71+ 0.21
* Response rates calculated based on the number of students in the sample (group B) and on the number of students in the sample who provided explicit consent for the use of their mobile number (group A).
Table 5. Parametric analysis for independent samples.
Levene’s Test for Equality of Variancest-Test for Equality of Means
FSig.td.f.Sig. (Two-Tailed)Difference in MeansStandard Error of the Difference95% Confidence Interval
LowerUpper
Variances assumed equal7.0550.0166.969180.0000.21700000.03113590.15158590.2824141
Variances not assumed equal 6.96911.5840.0000.21700000.03113590.14888980.2851102
Table 6. Response rates by number of students in group A.
Course-ProgramTotal, Students in the CourseLiberal Conditions (10% Sampling Error; 80% Confidence Interval)Stringent Conditions (3% Sampling Error; 95% Confidence Interval)Response Rate Current Study *
Program 127Between 0.48 and 0.58Between 0.96 and 0.970.97
Program 229Between 0.48 and 0.58Between 0.96 and 0.970.96
Program 331Between 0.35 and 0.40Between 0.93 and 0.950.94
Program 432Between 0.35 and 0.40Between 0.93 and 0.950.93
Program 555Between 0.25 and 0.31Between 0.90 and 0.920.91
Program 642Between 0.35 and 0.40Between 0.93 and 0.950.88
Program 761Between 0.25 and 0.31Between 0.90 and 0.920.91
Program 858Between 0.25 and 0.31Between 0.90 and 0.920.87
Program 929Between 0.48 and 0.58Between 0.96 and 0.970.97
Program 1044Between 0.35 and 0.40Between 0.93 and 0.950.94
* Response rates calculated for the number of students in the sample who provided explicit consent for the use of their mobile number (group A). Source: Prepared by the authors based on the criteria of Nulty [71].

