Environmental Implications of Taiwanese Oolong Tea and the Opportunities of Impact Reduction


Abstract
1. Introduction
2. Methods and Data
2.1. Cultivation and Harvesting
2.2. Manufacturing and Roasting
2.3. Packaging
2.4. Consumption
3. Results
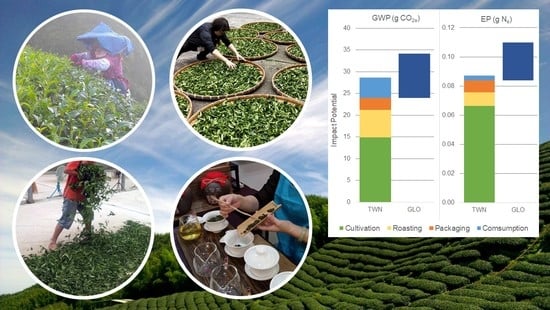
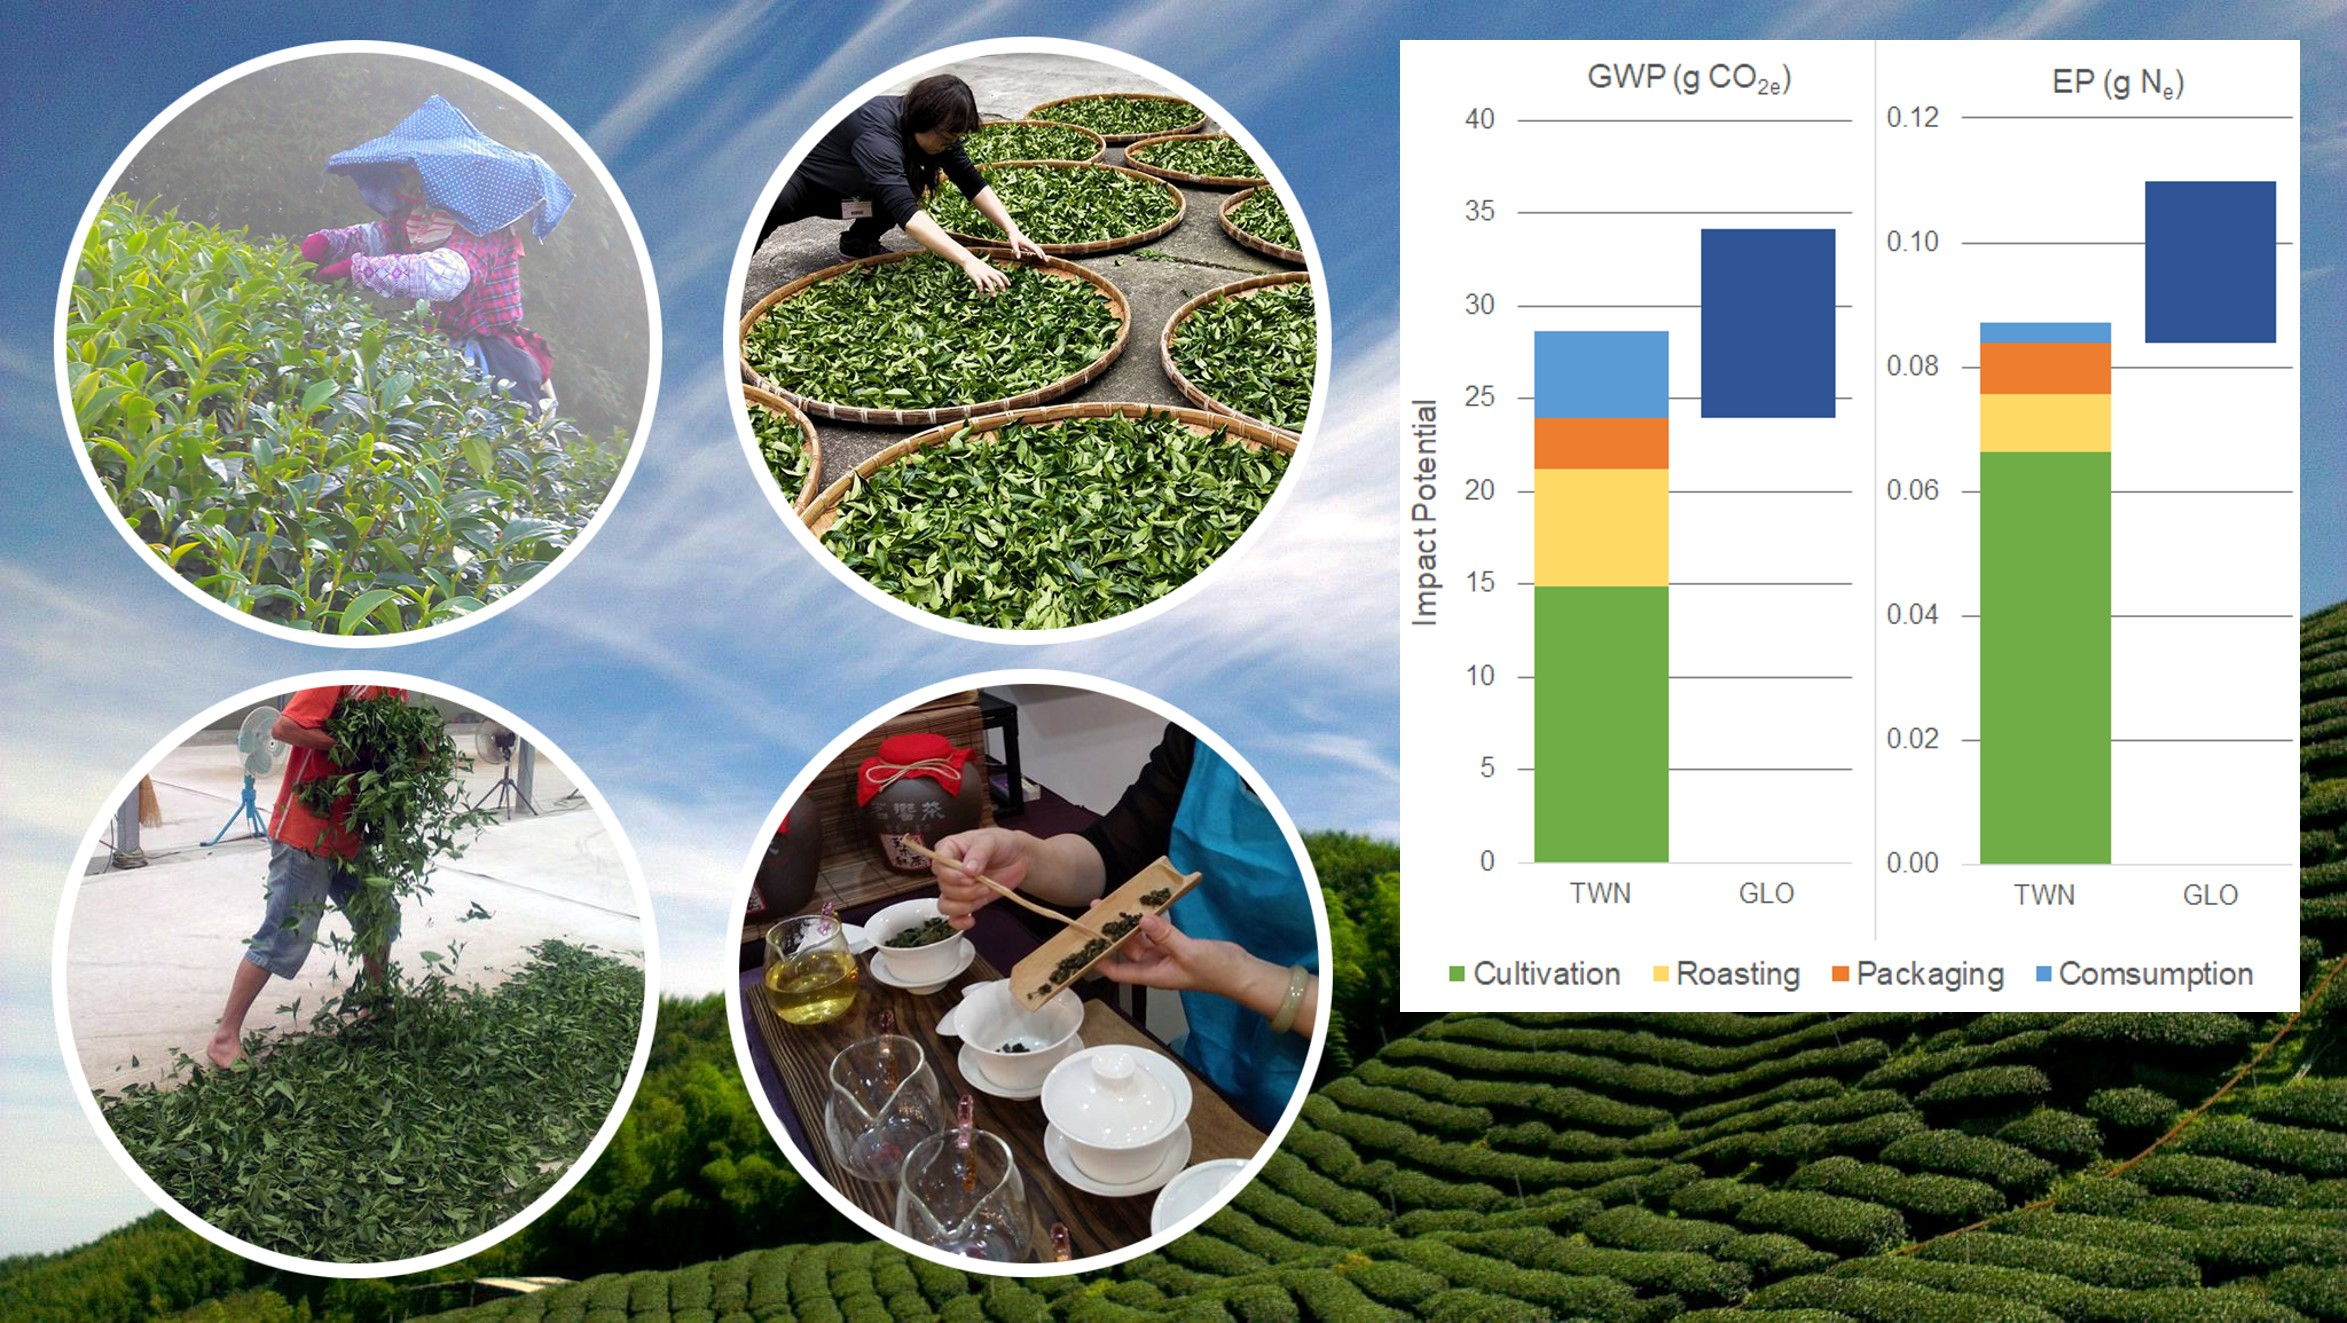
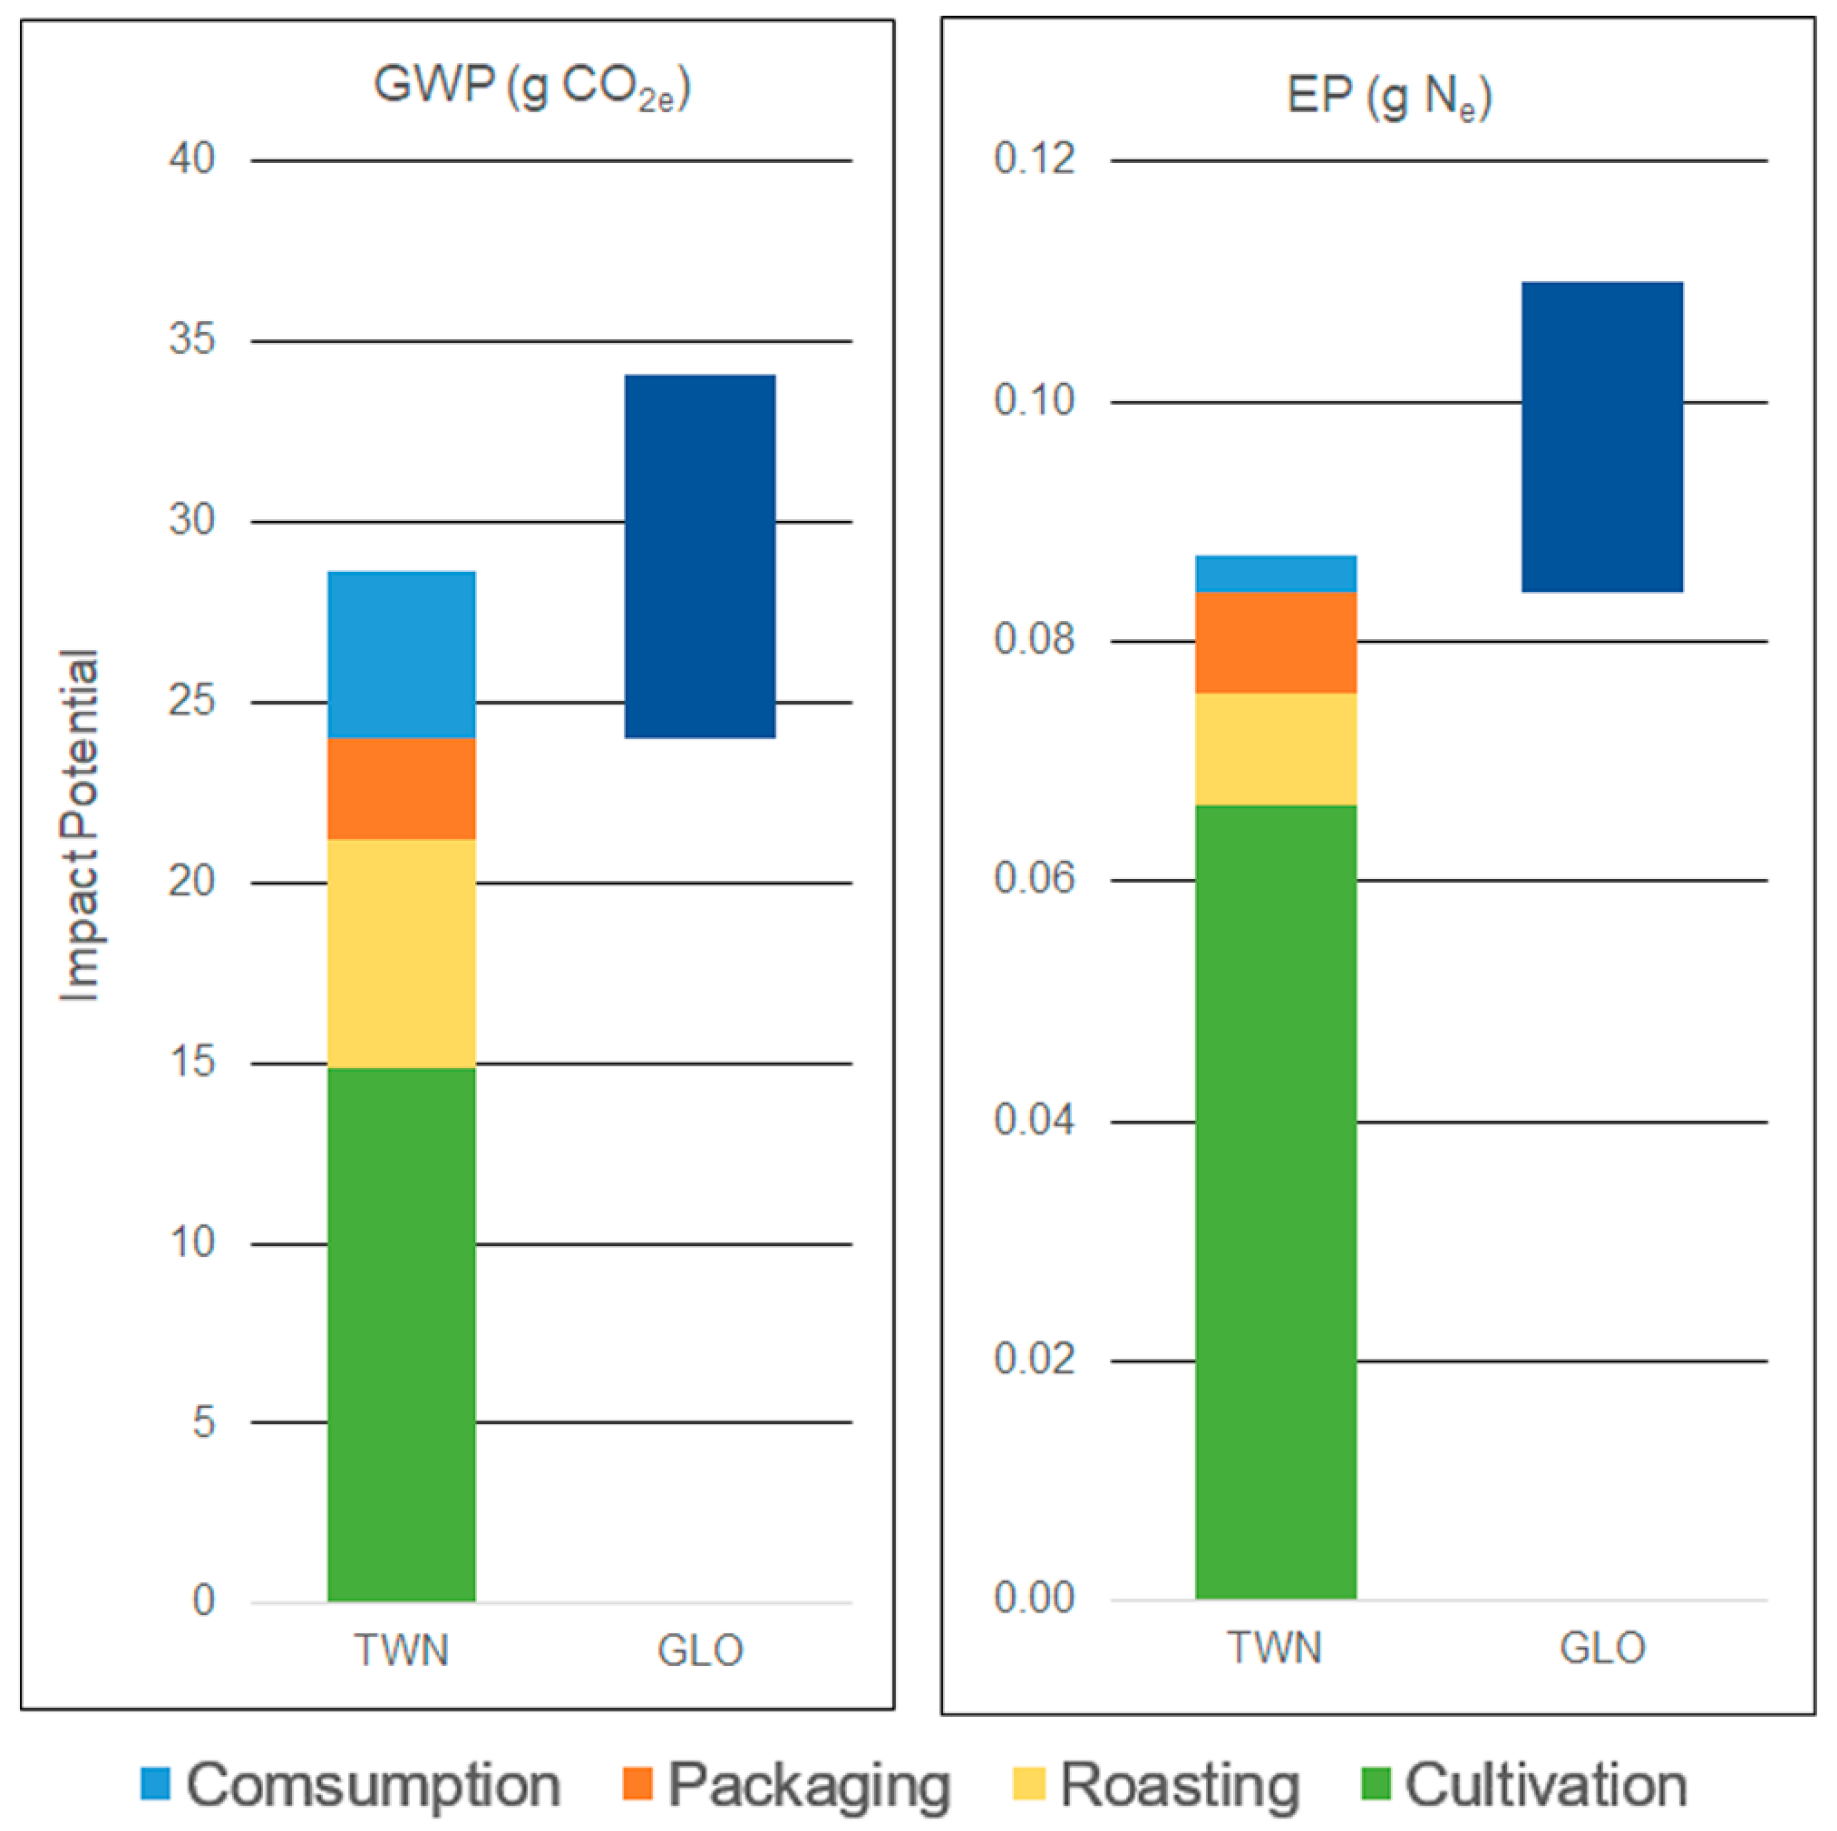
3.1. Global Warming Potential
3.2. Eutrophication Potential
4. Discussion: Opportunities for Impact Reduction
4.1. Systematic Data Collection and Schematic Configuration
4.2. Cultivation and Manufacturing
4.3. Cooking Energy
5. Conclusions
Funding
Acknowledgments
Conflicts of Interest
References
- Etherington, D.M.; Forster, K. The structural transformation of Taiwan’s tea industry. World Dev. 1992, 20, 401–422. [Google Scholar] [CrossRef]
- Hicks, A. Review of global tea production and the impact on industry of the Asian economic situation. AU J. Technol. 2001, 5, 1–8. [Google Scholar]
- Food and Agriculture Organization. FAOSTAT. Available online: http://www.fao.org/faostat (accessed on 22 January 2019).
- Executive Yuan ROC Taiwan. The Republic of China Yearbook 2016. Available online: https://english.ey.gov.tw/ (accessed on 13 January 2019).
- International Organization for Standardization. ISO 14040: Environmental Management—Life cycle Assessment—Principles and Framework; ISO: Geneva, Switzerland, 2006. [Google Scholar]
- Marsmann, M. The ISO 14040 family. Int. J. Life Cycle Assess. 2000, 5, 317–318. [Google Scholar] [CrossRef]
- Pryshlakivsky, J.; Searcy, C. Fifteen years of ISO 14040: A review. J. Clean. Prod. 2013, 57, 115–123. [Google Scholar] [CrossRef]
- Guinée, J.B.; Udo de Haes, H.A.; Huppes, G. Quantitative life cycle assessment of products. J. Clean. Prod. 1993, 1, 3–13. [Google Scholar] [CrossRef]
- Giraldi-Díaz, M.; Medina-Salas, D.; Castillo-González, E.; La Cruz-Benavides, D. Environmental Impact Associated with the Supply Chain and Production of Biodiesel from Jatropha curcas L. through Life Cycle Analysis. Sustainability 2018, 10, 1451. [Google Scholar] [CrossRef]
- Adhikari, B.; Prapaspongsa, T. Environmental Sustainability of Food Consumption in Asia. Sustainability 2019, 11, 5749. [Google Scholar] [CrossRef]
- Egilmez, G.; Kucukvar, M.; Tatari, O.; Bhutta, M.K.S. Supply chain sustainability assessment of the US food manufacturing sectors: A life cycle-based frontier approach. Resour. Conserv. Recycl. 2014, 82, 8–20. [Google Scholar] [CrossRef]
- Haas, G.; Wetterich, F.; Geier, U. Life cycle assessment framework in agriculture on the farm level. Int. J. Life Cycle Assess. 2000, 5, 345. [Google Scholar] [CrossRef]
- Heller, M.C.; Keoleian, G.A. Assessing the sustainability of the US food system: A life cycle perspective. Agric. Syst. 2003, 76, 1007–1041. [Google Scholar] [CrossRef]
- Roy, P.; Nei, D.; Orikasa, T.; Xu, Q.; Okadome, H.; Nakamura, N.; Shiina, T. A review of life cycle assessment (LCA) on some food products. J. Food Eng. 2009, 90, 1–10. [Google Scholar] [CrossRef]
- Wrieden, W.; Halligan, J.; Goffe, L.; Barton, K.; Leinonen, I. Sustainable Diets in the UK—Developing a Systematic Framework to Assess the Environmental Impact, Cost and Nutritional Quality of Household Food Purchases. Sustainability 2019, 11, 4974. [Google Scholar] [CrossRef]
- Browning, M.; Crossley, T.F. The life-cycle model of consumption and saving. J. Econ. Perspect. 2001, 15, 3–22. [Google Scholar] [CrossRef]
- Hertwich, E.G. Life cycle approaches to sustainable consumption: A critical review. Environ. Sci. Technol. 2005, 39, 4673–4684. [Google Scholar] [CrossRef] [PubMed]
- Williams, H.; Wikström, F. Environmental impact of packaging and food losses in a life cycle perspective: A comparative analysis of five food items. J. Clean. Prod. 2011, 19, 43–48. [Google Scholar] [CrossRef]
- De Benedetto, L.; Klemeš, J. The Environmental Performance Strategy Map: An integrated LCA approach to support the strategic decision-making process. J. Clean. Prod. 2009, 17, 900–906. [Google Scholar] [CrossRef]
- Lundie, S.; Peters, G.M. Life cycle assessment of food waste management options. J. Clean. Prod. 2005, 13, 275–286. [Google Scholar] [CrossRef]
- Hunt, R.G.; Franklin, W.E.; Hunt, R. LCA—How it came about. Int. J. Life Cycle Assess. 1996, 1, 4–7. [Google Scholar] [CrossRef]
- Giraldi-Díaz, M.R.; Medina-Salas, L.D.; Castillo-González, E.; León-Lira, R. Environmental Impact Associated with the Supply Chain and Production of Grounding and Roasting Coffee through Life Cycle Analysis. Sustainability 2018, 10, 4598. [Google Scholar] [CrossRef]
- Coltro, L.; Mourad, A.; Oliveira, P.; Baddini, J.; Kletecke, R. Environmental profile of Brazilian green coffee. Int. J. Life Cycle Assess. 2006, 11, 16–21. [Google Scholar] [CrossRef]
- Eide, M.H. Life cycle assessment (LCA) of industrial milk production. Int. J. Life Cycle Assess. 2002, 7, 115. [Google Scholar] [CrossRef]
- De Boer, I.J.M.; Hoving, I.E.; Vellinga, T.V.; Van de Ven, G.W.J.; Leffelaar, P.A.; Gerber, P.J. Assessing environmental impacts associated with freshwater consumption along the life cycle of animal products: The case of Dutch milk production in Noord-Brabant. Int. J. Life Cycle Assess. 2013, 18, 193–203. [Google Scholar] [CrossRef]
- Thomassen, M.A.; Dalgaard, R.; Heijungs, R.; de Boer, I. Attributional and consequential LCA of milk production. Int. J. Life Cycle Assess. 2008, 13, 339–349. [Google Scholar] [CrossRef]
- Amienyo, D.; Gujba, H.; Stichnothe, H.; Azapagic, A. Life cycle environmental impacts of carbonated soft drinks. Int. J. Life Cycle Assess. 2013, 18, 77–92. [Google Scholar] [CrossRef]
- Comandaru, I.M.; Bârjoveanu, G.; Peiu, N.; Ene, S.-A.; Teodosiu, C. Life cycle assessment of wine: Focus on water use impact assessment. Environ. Eng. Manag. J. 2012, 11, 533–543. [Google Scholar]
- Neto, B.; Dias, A.C.; Machado, M. Life cycle assessment of the supply chain of a Portuguese wine: From viticulture to distribution. Int. J. Life Cycle Assess. 2013, 18, 590–602. [Google Scholar] [CrossRef]
- Pattara, C.; Raggi, A.; Cichelli, A. Life cycle assessment and carbon footprint in the wine supply-chain. Environ. Manag. 2012, 49, 1247–1258. [Google Scholar] [CrossRef]
- Taulo, J.; Sebitosi, A. Material and energy flow analysis of the Malawian tea industry. Renew. Sustain. Energy Rev. 2016, 56, 1337–1350. [Google Scholar] [CrossRef]
- Doublet, G.; Jungbluth, N. Life Cycle Assessment of Drinking Darjeeling Tea. In Conventional and Organic Darjeeling Tea; ESU-services Ltd. Uster: Schaffhausen, Switzerland, 2010; Available online: http://www.avnir.org/documentation/bdd/sg/doublet-2010-LCA-Darjeeling-tea-1.0.pdf (accessed on 16 September 2018).
- Cichorowski, G.; Joa, B.; Hottenroth, H.; Schmidt, M. Scenario analysis of life cycle greenhouse gas emissions of Darjeeling tea. Int. J. Life Cycle Assess. 2015, 20, 426–439. [Google Scholar] [CrossRef]
- Kouchaki-Penchah, H.; Nabavi-Pelesaraei, A.; O’Dwyer, J.; Sharifi, M. Environmental management of tea production using joint of life cycle assessment and data envelopment analysis approaches. Environ. Prog. Sustain. Energy 2017, 36, 1116–1122. [Google Scholar] [CrossRef]
- Ecoinvent Centre. Ecoinvent Data; Dübendorf, C.H., Ed.; Ecoinvent Centre: Zurich, Switzerland, 2018. [Google Scholar]
- Taiwan Environmental Protection Administration. Taiwan Emission Data System (TEDS v. 9.0). Available online: https://erdb.epa.gov.tw/ (accessed on 3 October 2018).
- Taiwan Bureau of Energy. Energy Balance Datasets. Available online: https://www.moeaboe.gov.tw/ECW/populace/web_book/WebReports.aspx?book=B_CH&menu_id=145 (accessed on 3 October 2018).
- Taiwan Power Company. Taiwan Power Generation Potential by Sources. Available online: http://www.taipower.com.tw/content/new_info/new_info-c37.aspx (accessed on 23 June 2017).
- Taiwan Power Company. Green House Gas Emission Factor. Available online: https://data.gov.tw/datasets/search?qs=tid%3A465&order=downloadcount&type=dataset (accessed on 3 October 2018).
- Bare, J.C.; Norris, G.A.; Pennington, D.W.; McKone, T. TRACI—The Tool for the Reduction and Assessment of Chemical and Other Environmental Impacts. J. Ind. Ecol. 2002, 6, 49–78. [Google Scholar] [CrossRef]
- Ryberg, M.; Vieira, M.D.; Zgola, M.; Bare, J.; Rosenbaum, R.K. Updated US and Canadian normalization factors for TRACI 2.1. Clean Technol. Environ. Policy 2014, 16, 329–339. [Google Scholar] [CrossRef]
- Chen, C.F.; Lin, J.Y. Estimating the gross budget of applied nitrogen and phosphorus in tea plantations. Sustain. Environ. Res. 2016, 26, 124–130. [Google Scholar] [CrossRef]
- Stoessel, F.; Juraske, R.; Pfister, S.; Hellweg, S. Life Cycle Inventory and Carbon and Water FoodPrint of Fruits and Vegetables: Application to a Swiss Retailer. Environ. Sci. Technol. 2012, 46, 3253–3262. [Google Scholar] [CrossRef]
- Oloruntoba, A. Revenue of the Tea Market Worldwide by Country in 2018. Available online: https://www.statista.com (accessed on 22 June 2019).
- Huang, Y.M. Integrated Crop Management of Tea; Yang, S.J., Ed.; Council of Agriculture, Executive Yuan, Taiwan: Taipei, Taiwan, 2007.
- Chou, W.S.; Lee, T.C.; Lin, J.Y.; Shaw, L.Y. Phosphorus load reduction goals for Feitsui Reservoir watershed, Taiwan. Environ. Monit. Assess. 2007, 131, 395–408. [Google Scholar] [CrossRef]
- Hirono, Y.; Watanabe, I.; Nonaka, K. Trends in water quality around an intensive tea-growing area in Shizuoka, Japan. Soil Sci. Plant Nutr. 2009, 55, 783–792. [Google Scholar] [CrossRef]
- Wang, W.; Xie, Y.; Bi, M.; Wang, X.; Lu, Y.; Fan, Z. Effects of best management practices on nitrogen load reduction in tea fields with different slope gradients using the SWAT model. Appl. Geogr. 2018, 90, 200–213. [Google Scholar] [CrossRef]


| Production Phase | Category | Item | Unit | Value (Site 1) | Value (Site 2) |
|---|---|---|---|---|---|
| Cultivation | Geographic | Elevation | m | 1065 | 750 |
| Plantation area size | ha | 1.94 | 0.97 | ||
| Fertilizer | Fertilizer as N | kg | 883 | 1296 | |
| Fertilizer as P | kg | 96 | 270 | ||
| Fertilizer as K | kg | 96 | 246 | ||
| Organic fertilizer | kg | 9000 a | 3800 b | ||
| Irrigation | Surface water | m3 | 130 | 65 | |
| Groundwater | m3 | 80 | 40 | ||
| Tap water | m3 | 12 | 6 | ||
| Agrochemical | Herbicide (active ingredients) | kg | 0 | 70 | |
| Pesticide (active ingredients) | kg | 18 | 61 | ||
| Energy | Gasoline | L | 47.6 | 0 | |
| Harvesting | Transport (labors) | Distance | km | 30 | 40 |
| Product | Tea leaf (wet) | kg | 17,400 | 2160 | |
| Manufacturing | Material | Tea leaf (wet) | kg | 17,400 | 2160 |
| Energy | Gasoline | kg | 0 | 116 | |
| Diesel | kg | 1467 | 0 | ||
| Electricity | kWh | 127 | 186 | ||
| Natural gas | kg | 0 | 320 | ||
| Transport (labors) | Distance | km | 15 | n/a | |
| Transport (tea leaf) | Distance | km | 15 | 20 | |
| Product | Loose tea (roasted, dry) | kg | 4350 | 432 | |
| Packaging | Material | Loose tea (roasted, dry) | g | 600 | 420,000 |
| Material | Plastic bags | g | 34 | 23,520 | |
| Tea can (as 2-mm tin plate) | cm2 | 72 | 50,554 | ||
| Energy | Electricity | Whr | 0.75 | 528 | |
| Product | Cans of loose tea | item | 1 | 700 |
| Emissions | Sink | Output Parameters | |
|---|---|---|---|
| Ammonia | air | 0.060 | of kg N fertilizer applied |
| Nitrogen oxides | air | 0.017 | of kg N fertilizer applied |
| Dinitrogen monoxide | air | 0.017 | of kg N fertilizer applied |
| Nitrate | groundwater | 0.203 | of kg N fertilizer applied |
| Phosphorus | river | 0.003 | of kg P fertilizer applied |
| Phosphate | groundwater | 0.001 | of kg P fertilizer applied |
| Input Flow | Unit | Amount |
| liquefied petroleum gas | g | 32.85 |
| natural gas | g | 45.17 |
| Output Flow | Unit | Amount |
| Cooking energy mix, Taiwan | kcal | 1000 |
| Emissions | Unit | Amount |
| Carbon dioxide | g | 244.000 |
| Carbon monoxide | g | 0.1060 |
| Hydrocarbons, unspecified | g | 0.0194 |
| Hydrocarbons, unspecified | g | 0.0154 |
| Methane | g | 0.0208 |
| Nitrogen oxides | g | 0.2140 |
| NMVOC, non-methane volatile organic compounds, unspecified origin | g | 0.0208 |
| Particulates, <10 um | g | 0.0130 |
| Particulates, <2.5 um | g | 0.0122 |
| Particulates, >2.5 um, and <10um | g | 0.0126 |
| Sulfur dioxide | g | 0.0000 |
| Sulfur oxides | g | 0.0358 |
| Suspended solids, unspecified | g | 0.0135 |
| Input | Unit | Amount |
| electricity, low voltage | market for electricity, low voltage | kcal | 0.4985 |
| electricity, low voltage | market group for electricity, low voltage | kcal | 0.1183 |
| natural gas, low pressure | market for natural gas, low pressure | cm3 | 28.4312 |
| Output | Unit | Amount |
| Cooking energy mix, Intl | kcal | 0.9110 |
| Flow | Unit | Amount |
| Acetaldehyde | kg | 1.33 × 10⁻¹² |
| Acetic acid | kg | 1.99 × 10⁻¹⁰ |
| Benzene | kg | 5.30 × 10⁻¹⁰ |
| Benzo(a)pyrene | kg | 1.33 × 10⁻¹⁴ |
| Butane | kg | 9.28 × 10⁻¹⁰ |
| Carbon dioxide, fossil | kg | 7.43 × 10⁻⁵ |
| Carbon monoxide, fossil | kg | 1.03 × 10⁻⁸ |
| Dinitrogen monoxide | kg | 6.63 × 10⁻¹⁰ |
| Dioxins, measured as 2,3,7,8-tetrachlorodibenzo-p-dioxin | kg | 3.98 × 10⁻²⁰ |
| Formaldehyde | kg | 1.33 × 10⁻¹⁰ |
| Heat, waste | MJ | 1.47 × 10⁻³ |
| Mercury | kg | 3.98 × 10⁻¹⁴ |
| Methane, fossil | kg | 2.65 × 10⁻⁹ |
| Nitrogen oxides | kg | 1.92 × 10⁻⁸ |
| PAH, polycyclic aromatic hydrocarbons | kg | 1.33 × 10⁻¹¹ |
| Particulates, <2.5 um | kg | 1.33 × 10⁻¹⁰ |
| Pentane | kg | 1.59 × 10⁻⁹ |
| Propane | kg | 2.65 × 10⁻¹⁰ |
| Propionic acid | kg | 2.65 × 10⁻¹¹ |
| Sulfur dioxide | kg | 7.29 × 10⁻¹⁰ |
| Toluene | kg | 2.65 × 10⁻¹⁰ |
© 2019 by the author. Licensee MDPI, Basel, Switzerland. This article is an open access article distributed under the terms and conditions of the Creative Commons Attribution (CC BY) license (http://creativecommons.org/licenses/by/4.0/).
Share and Cite
Chiu, Y.-W. Environmental Implications of Taiwanese Oolong Tea and the Opportunities of Impact Reduction. Sustainability 2019, 11, 6042. https://doi.org/10.3390/su11216042
Chiu Y-W. Environmental Implications of Taiwanese Oolong Tea and the Opportunities of Impact Reduction. Sustainability. 2019; 11(21):6042. https://doi.org/10.3390/su11216042
Chicago/Turabian StyleChiu, Yi-Wen. 2019. "Environmental Implications of Taiwanese Oolong Tea and the Opportunities of Impact Reduction" Sustainability 11, no. 21: 6042. https://doi.org/10.3390/su11216042
APA StyleChiu, Y.-W. (2019). Environmental Implications of Taiwanese Oolong Tea and the Opportunities of Impact Reduction. Sustainability, 11(21), 6042. https://doi.org/10.3390/su11216042