Run Theory and Copula-Based Drought Risk Analysis for Songnen Grassland in Northeastern China


Abstract
1. Introduction
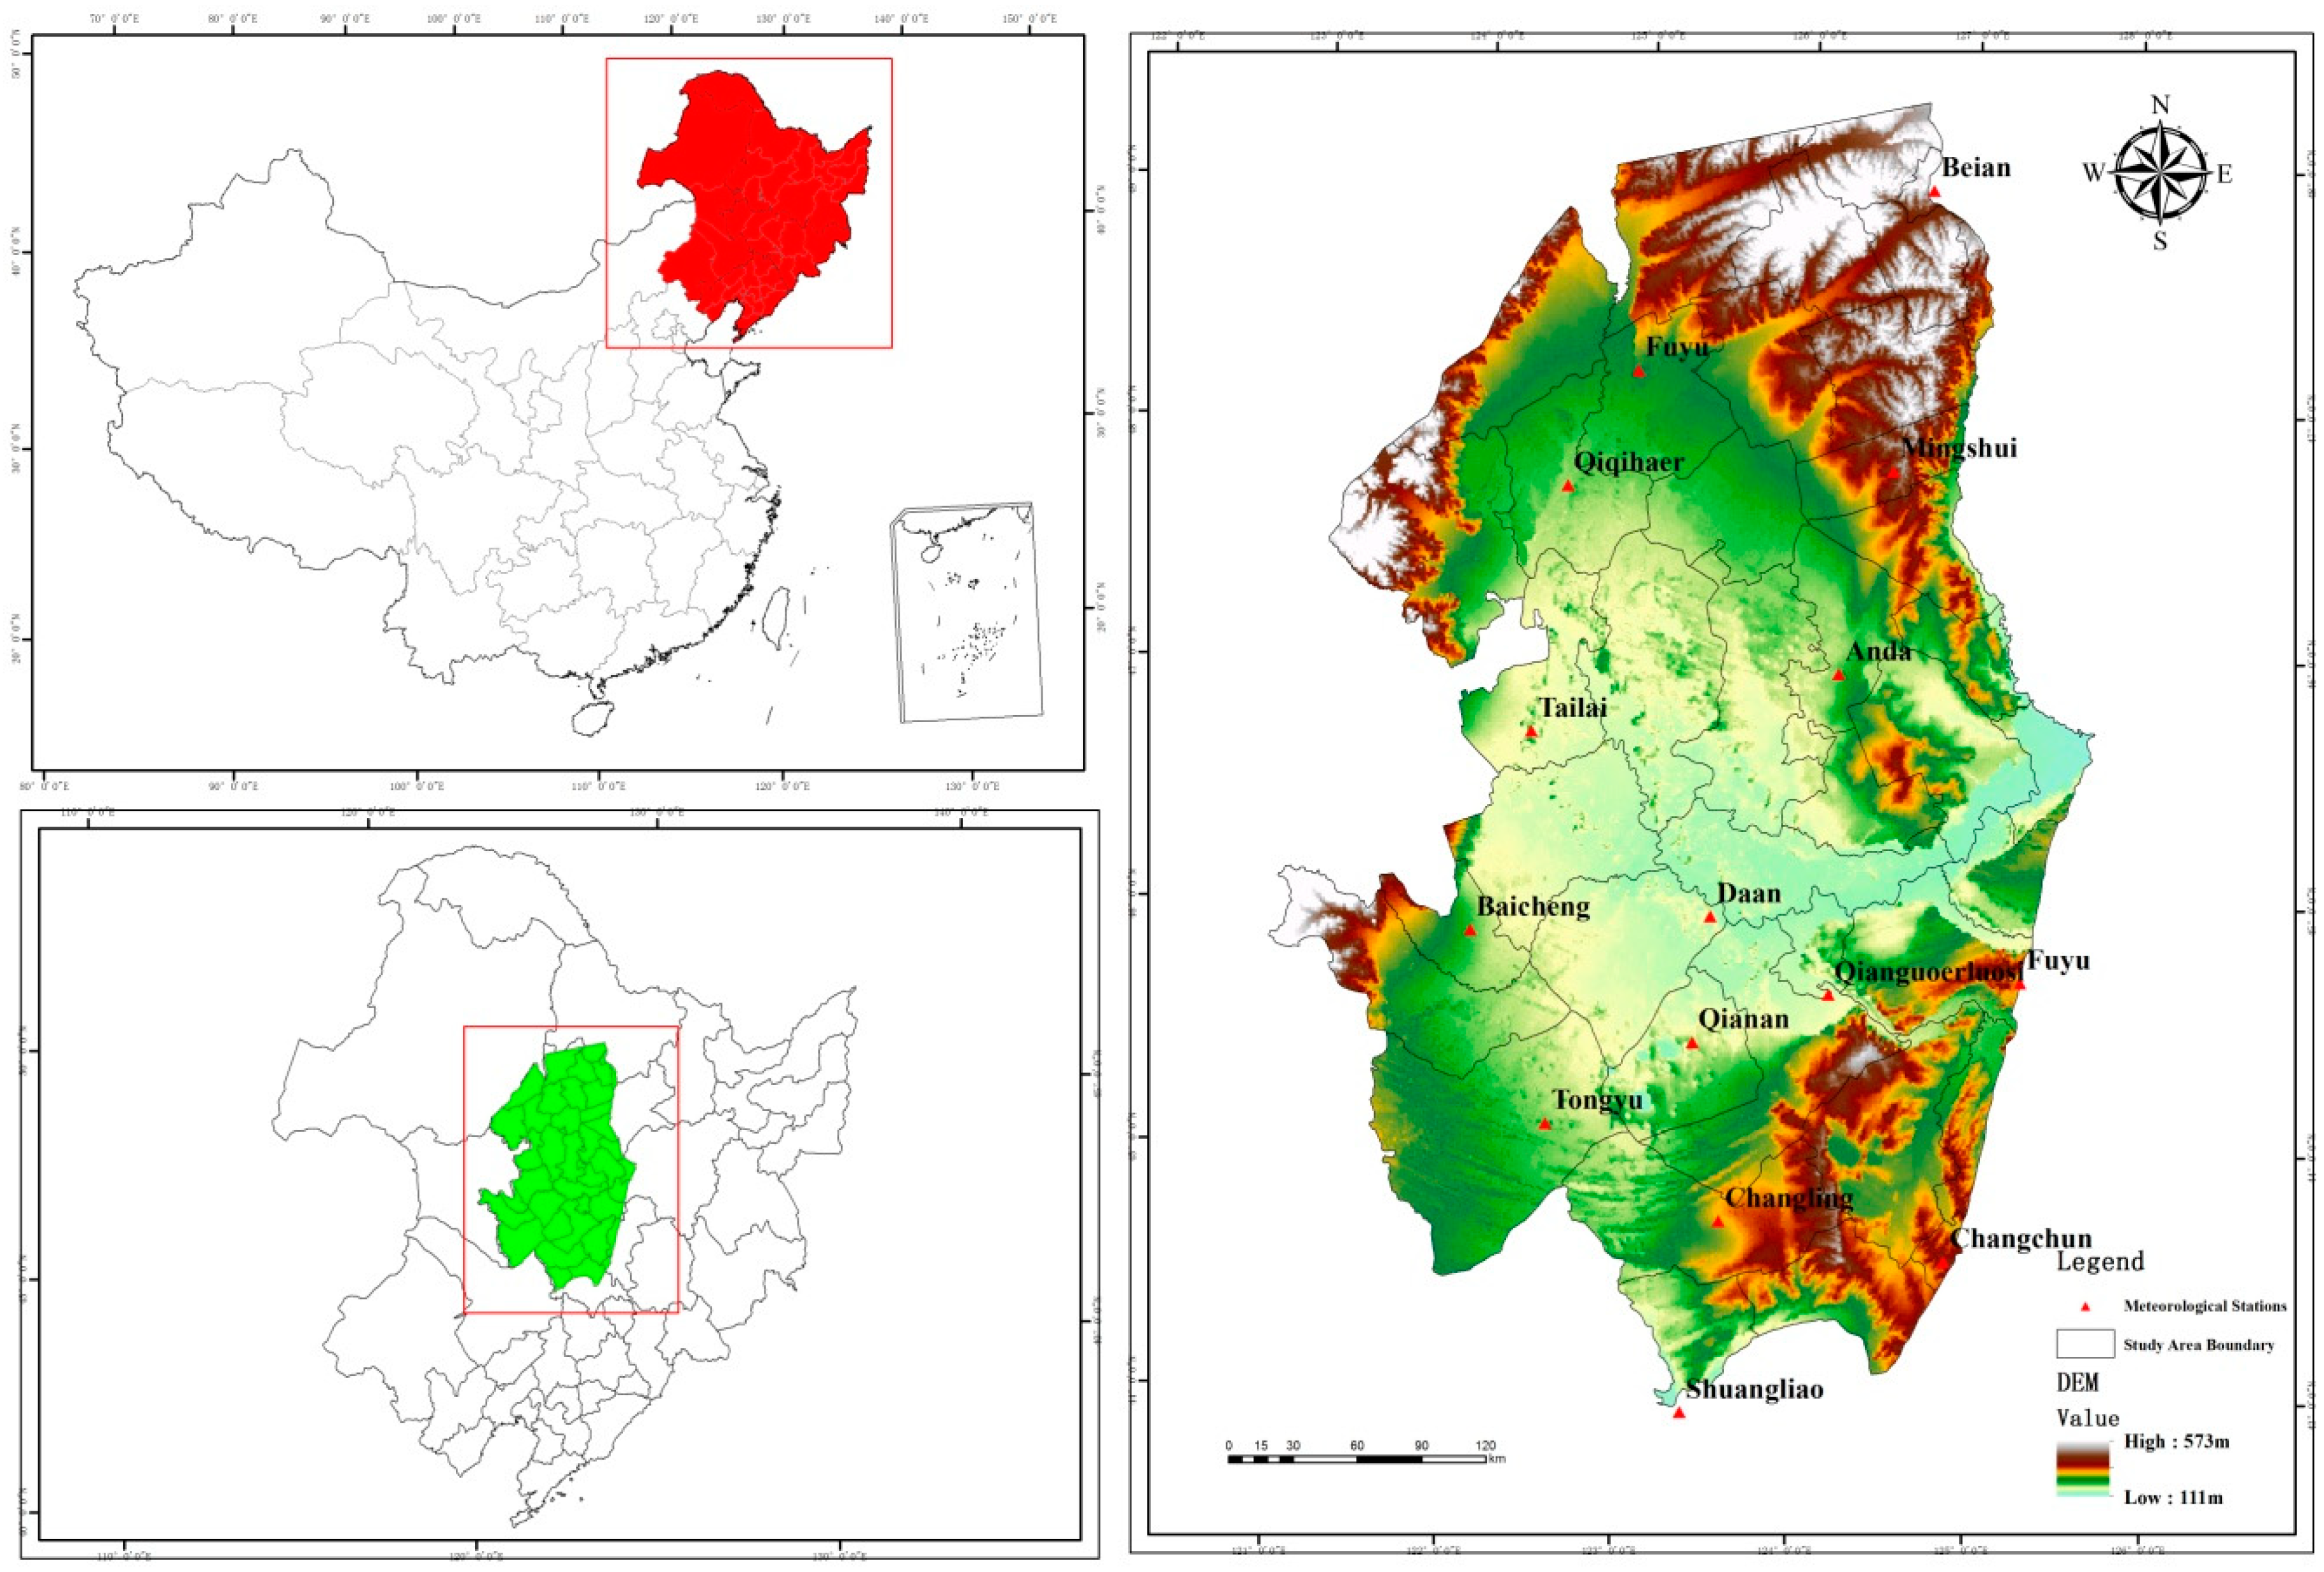
2. Study Area and Data Sources
3. Methodology
3.1. The Standardized Precipitation Evapotranspiration Index (SPEI)
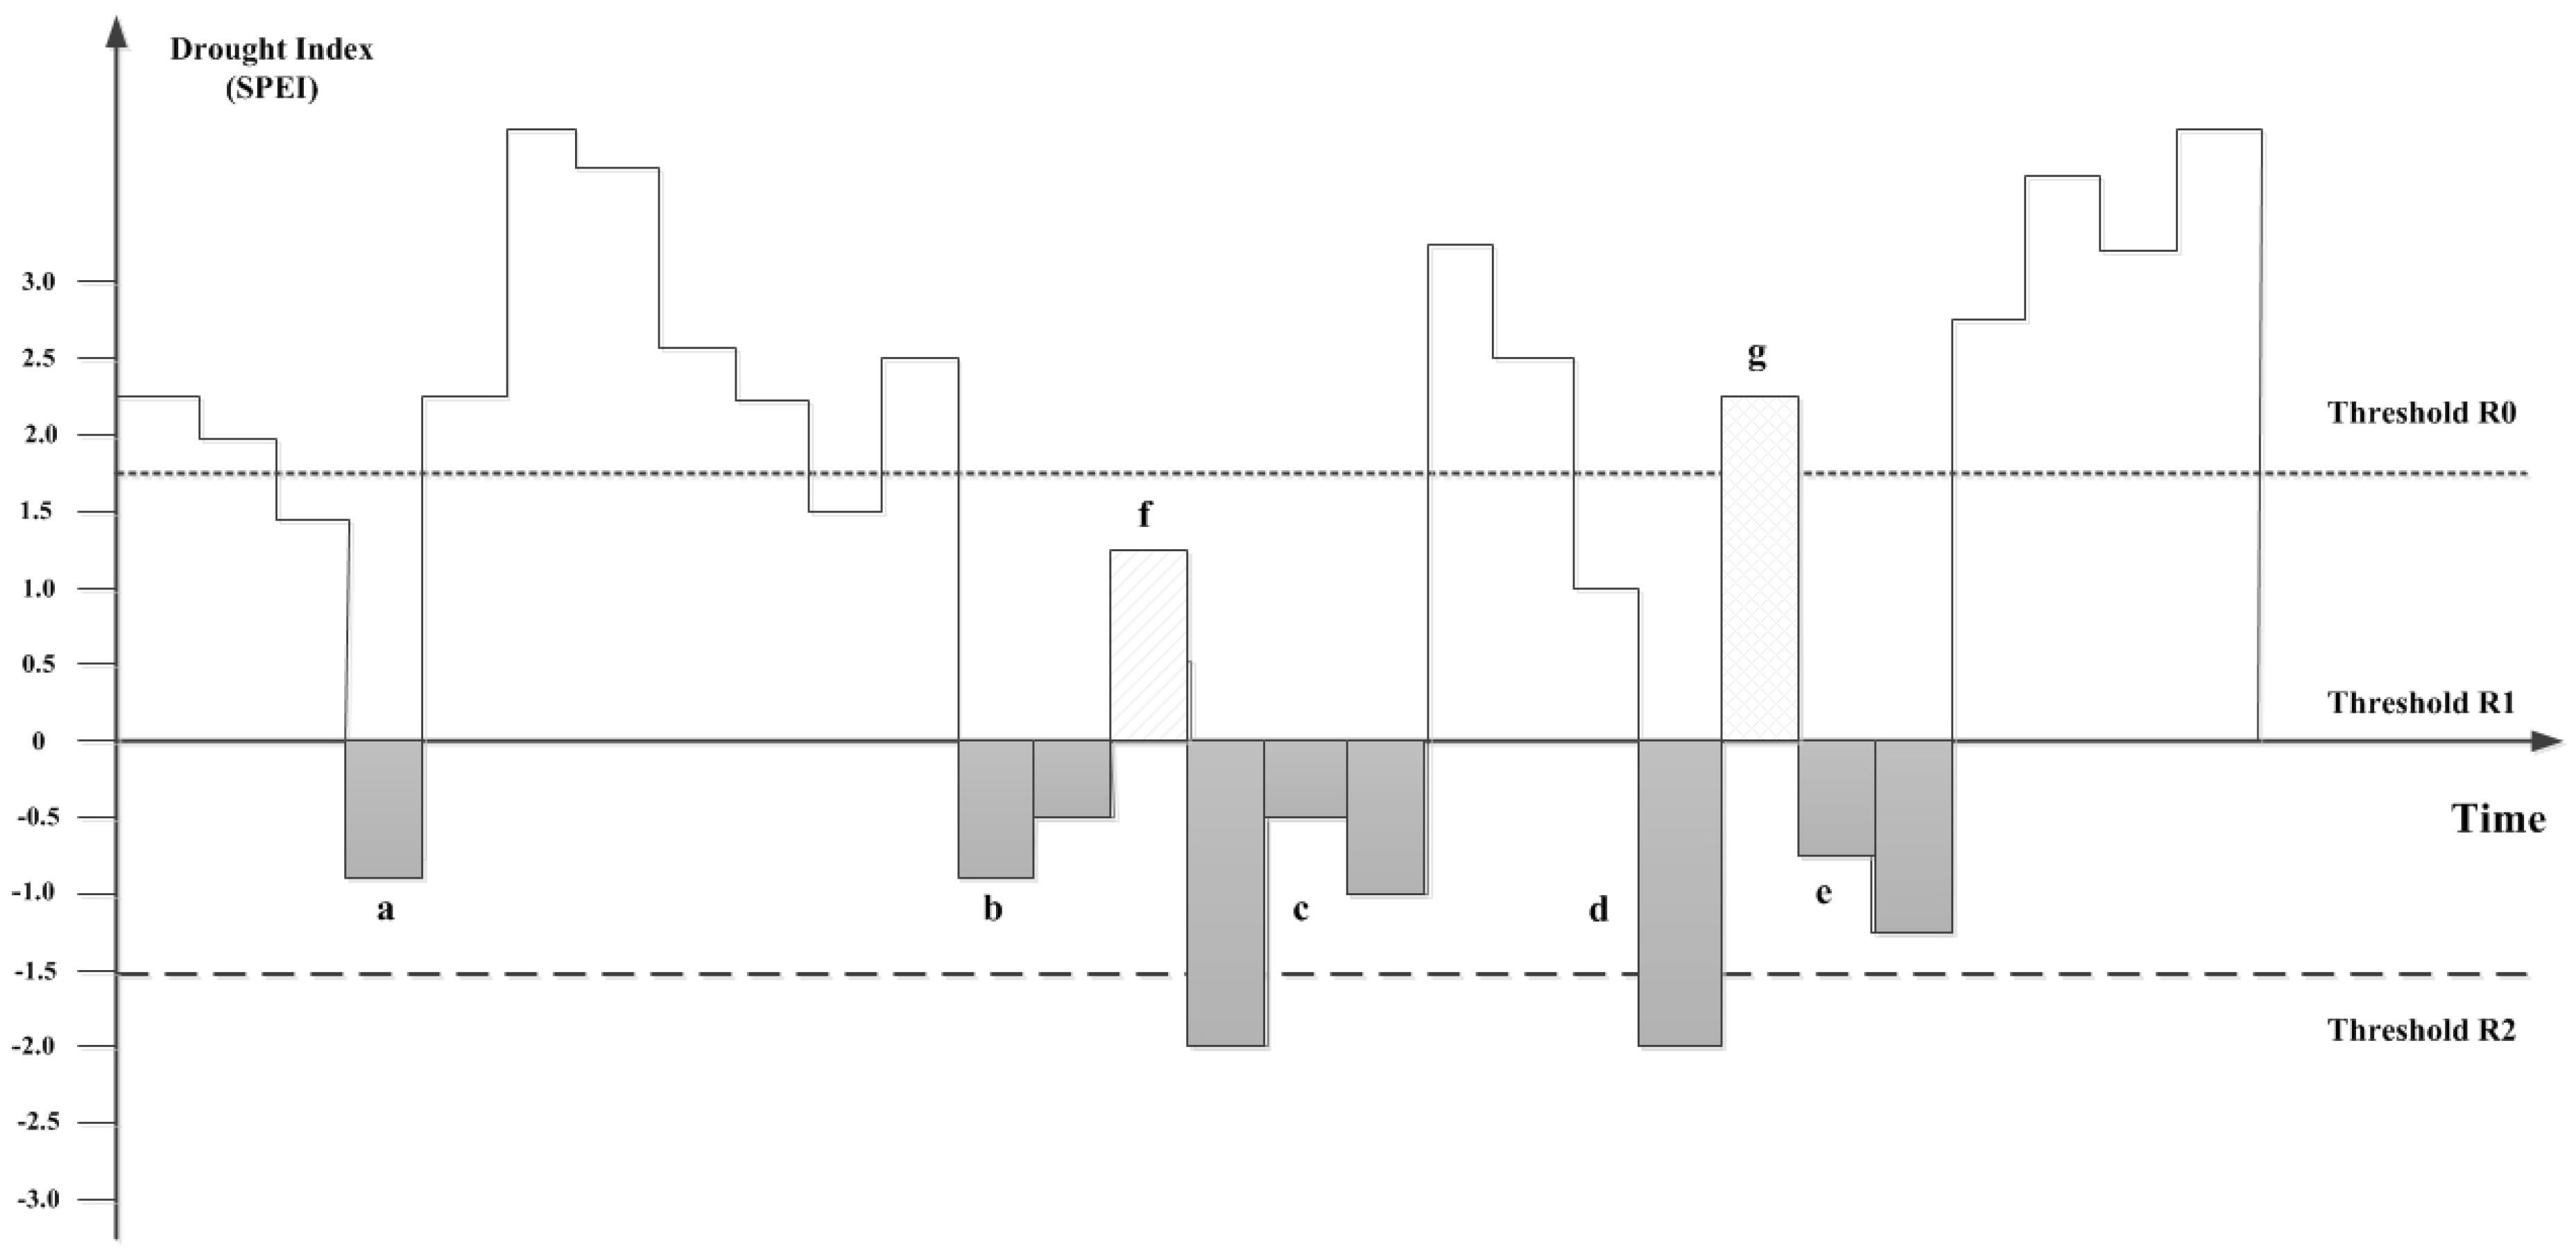
3.2. Run Theory
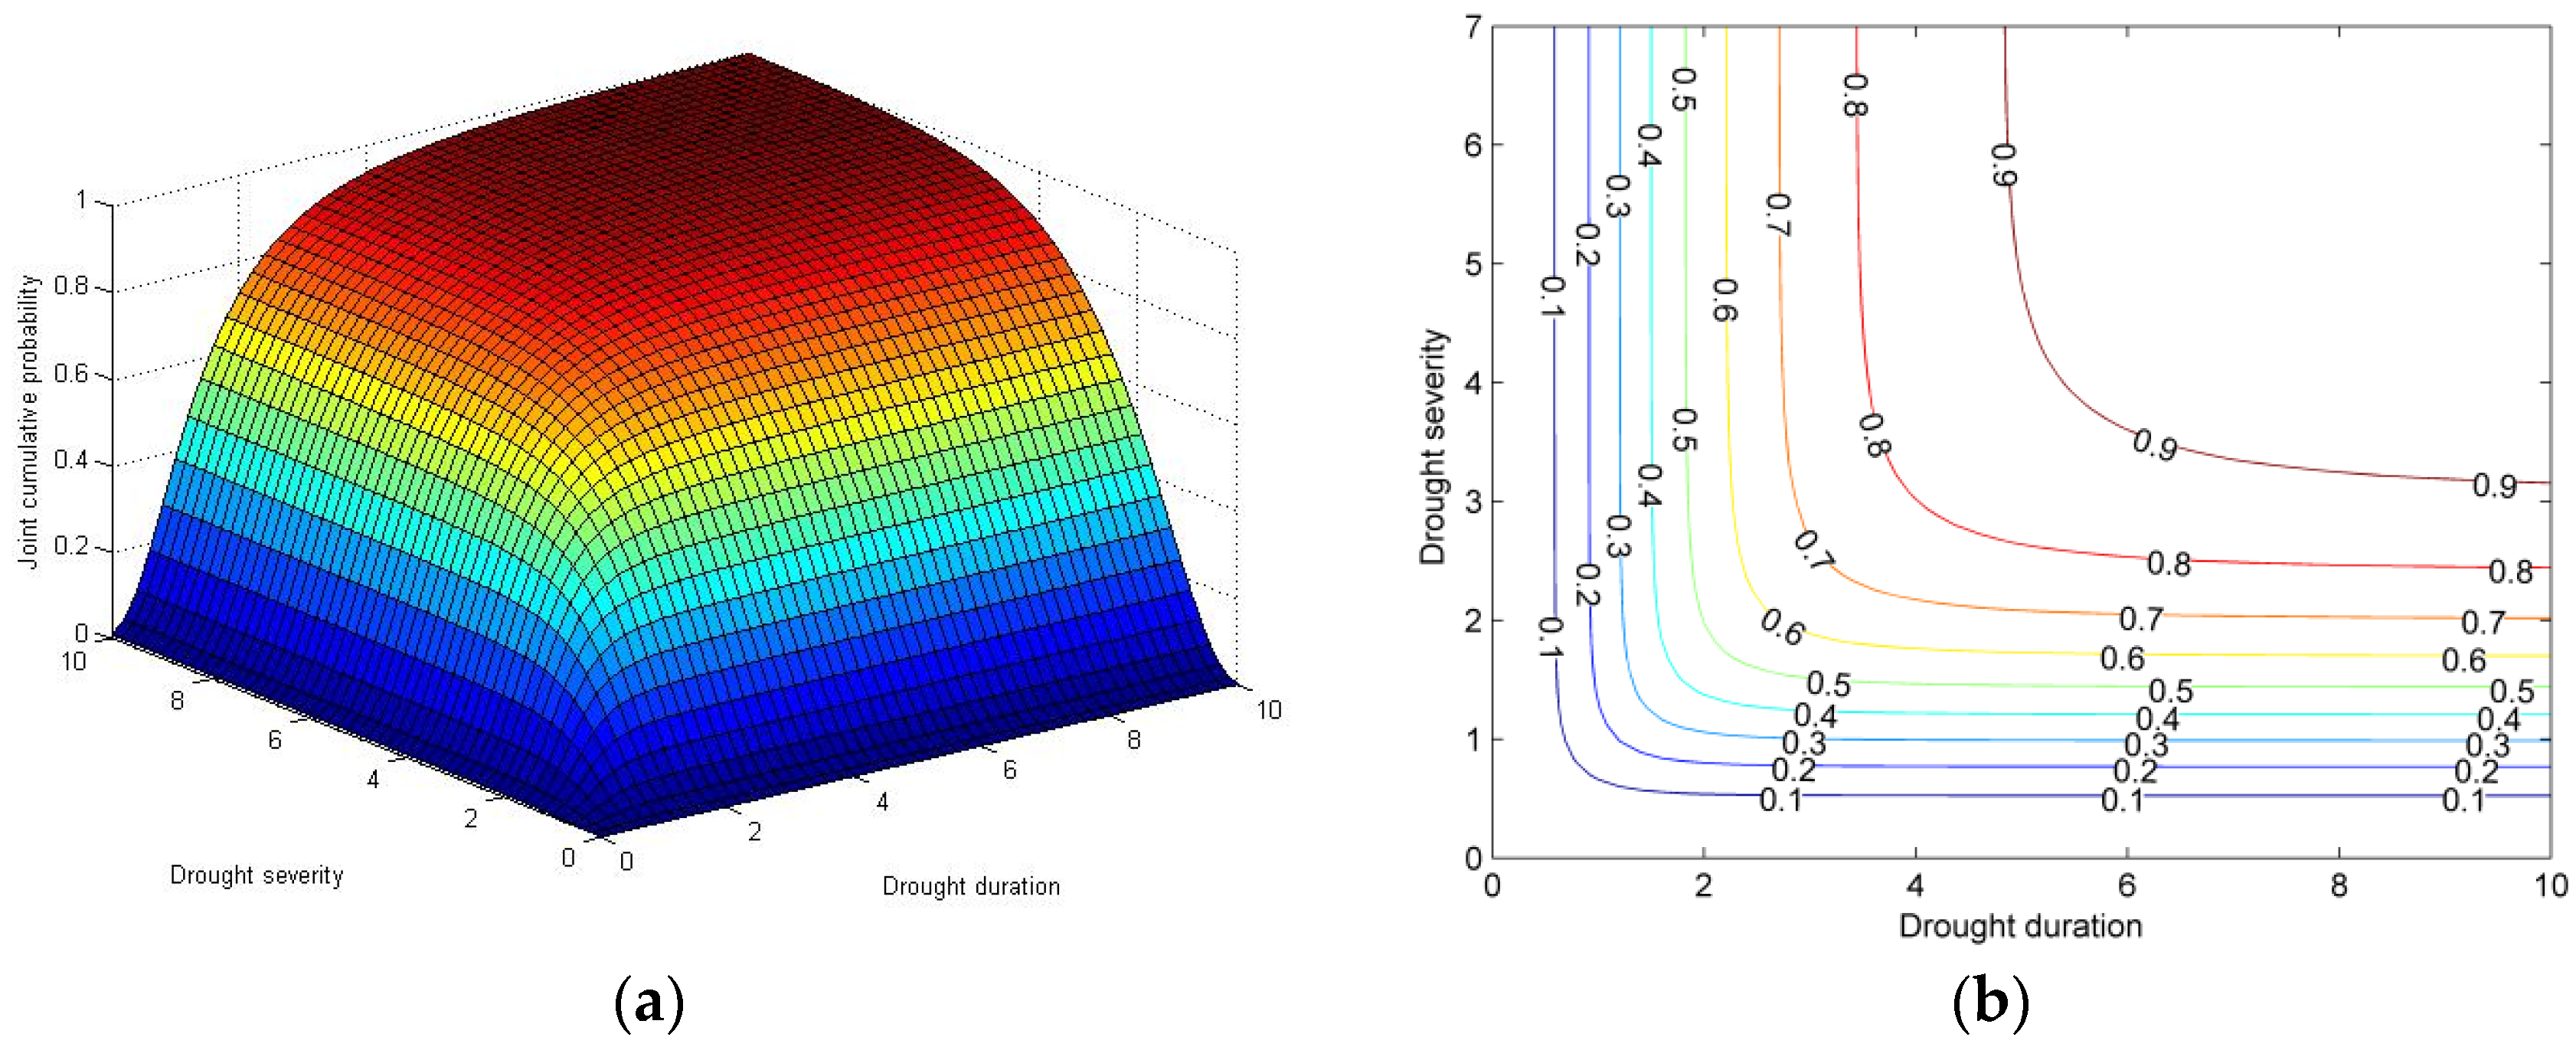
3.3. Copula
3.4. Return Periods
3.4.1. The Bivariate Return Periods
3.4.2. The Secondary Return Periods
3.5. Inverse Distance Weighted Interpolation Method
4. Results
4.1. Analysis of Drought Characteristics
4.2. Correlation between Drought Duration and Drought Severity
4.3. The Selection of the Appropriate Copula
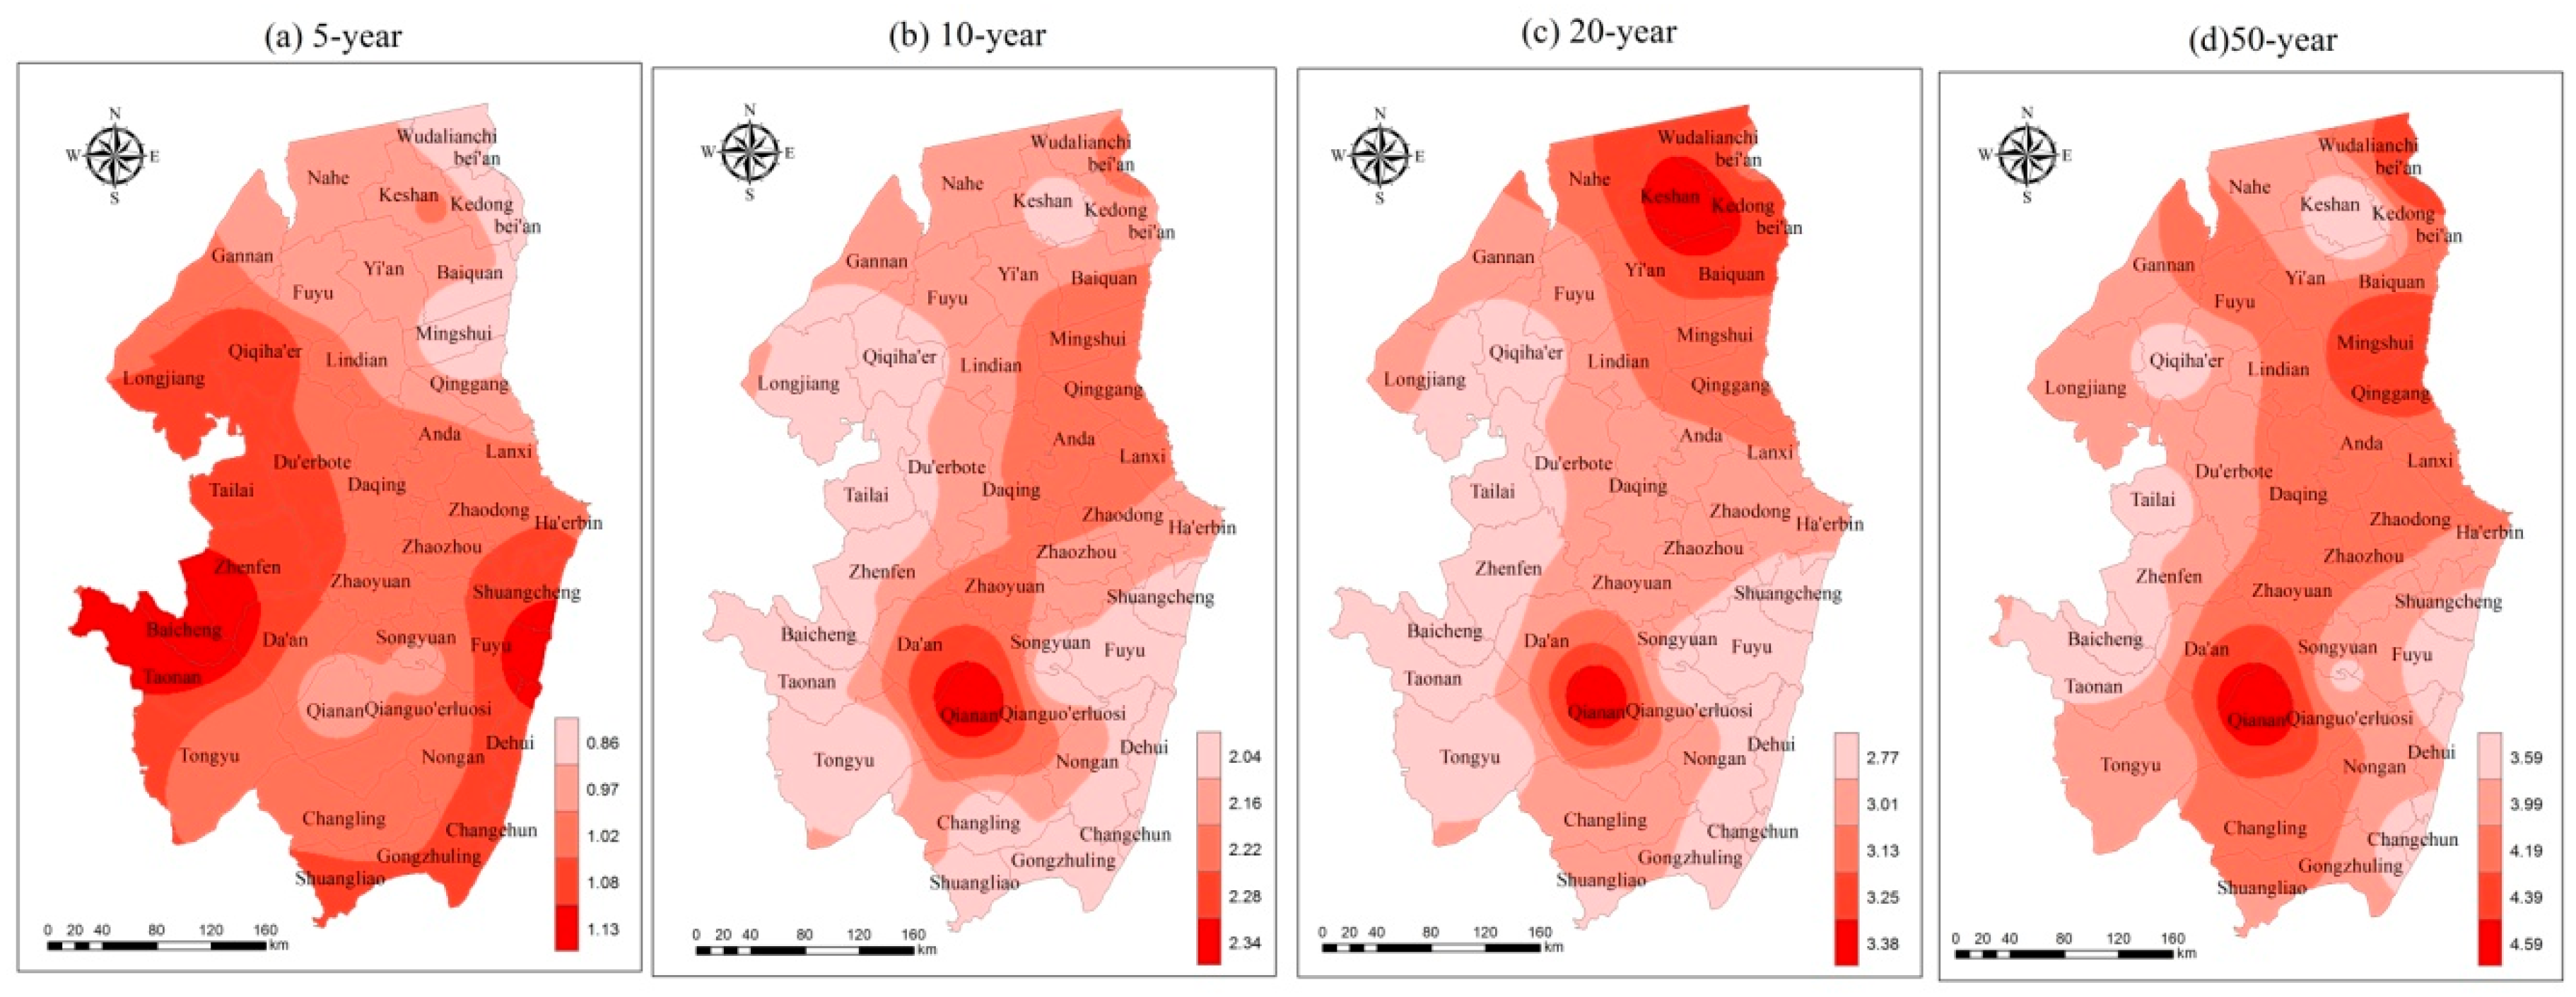
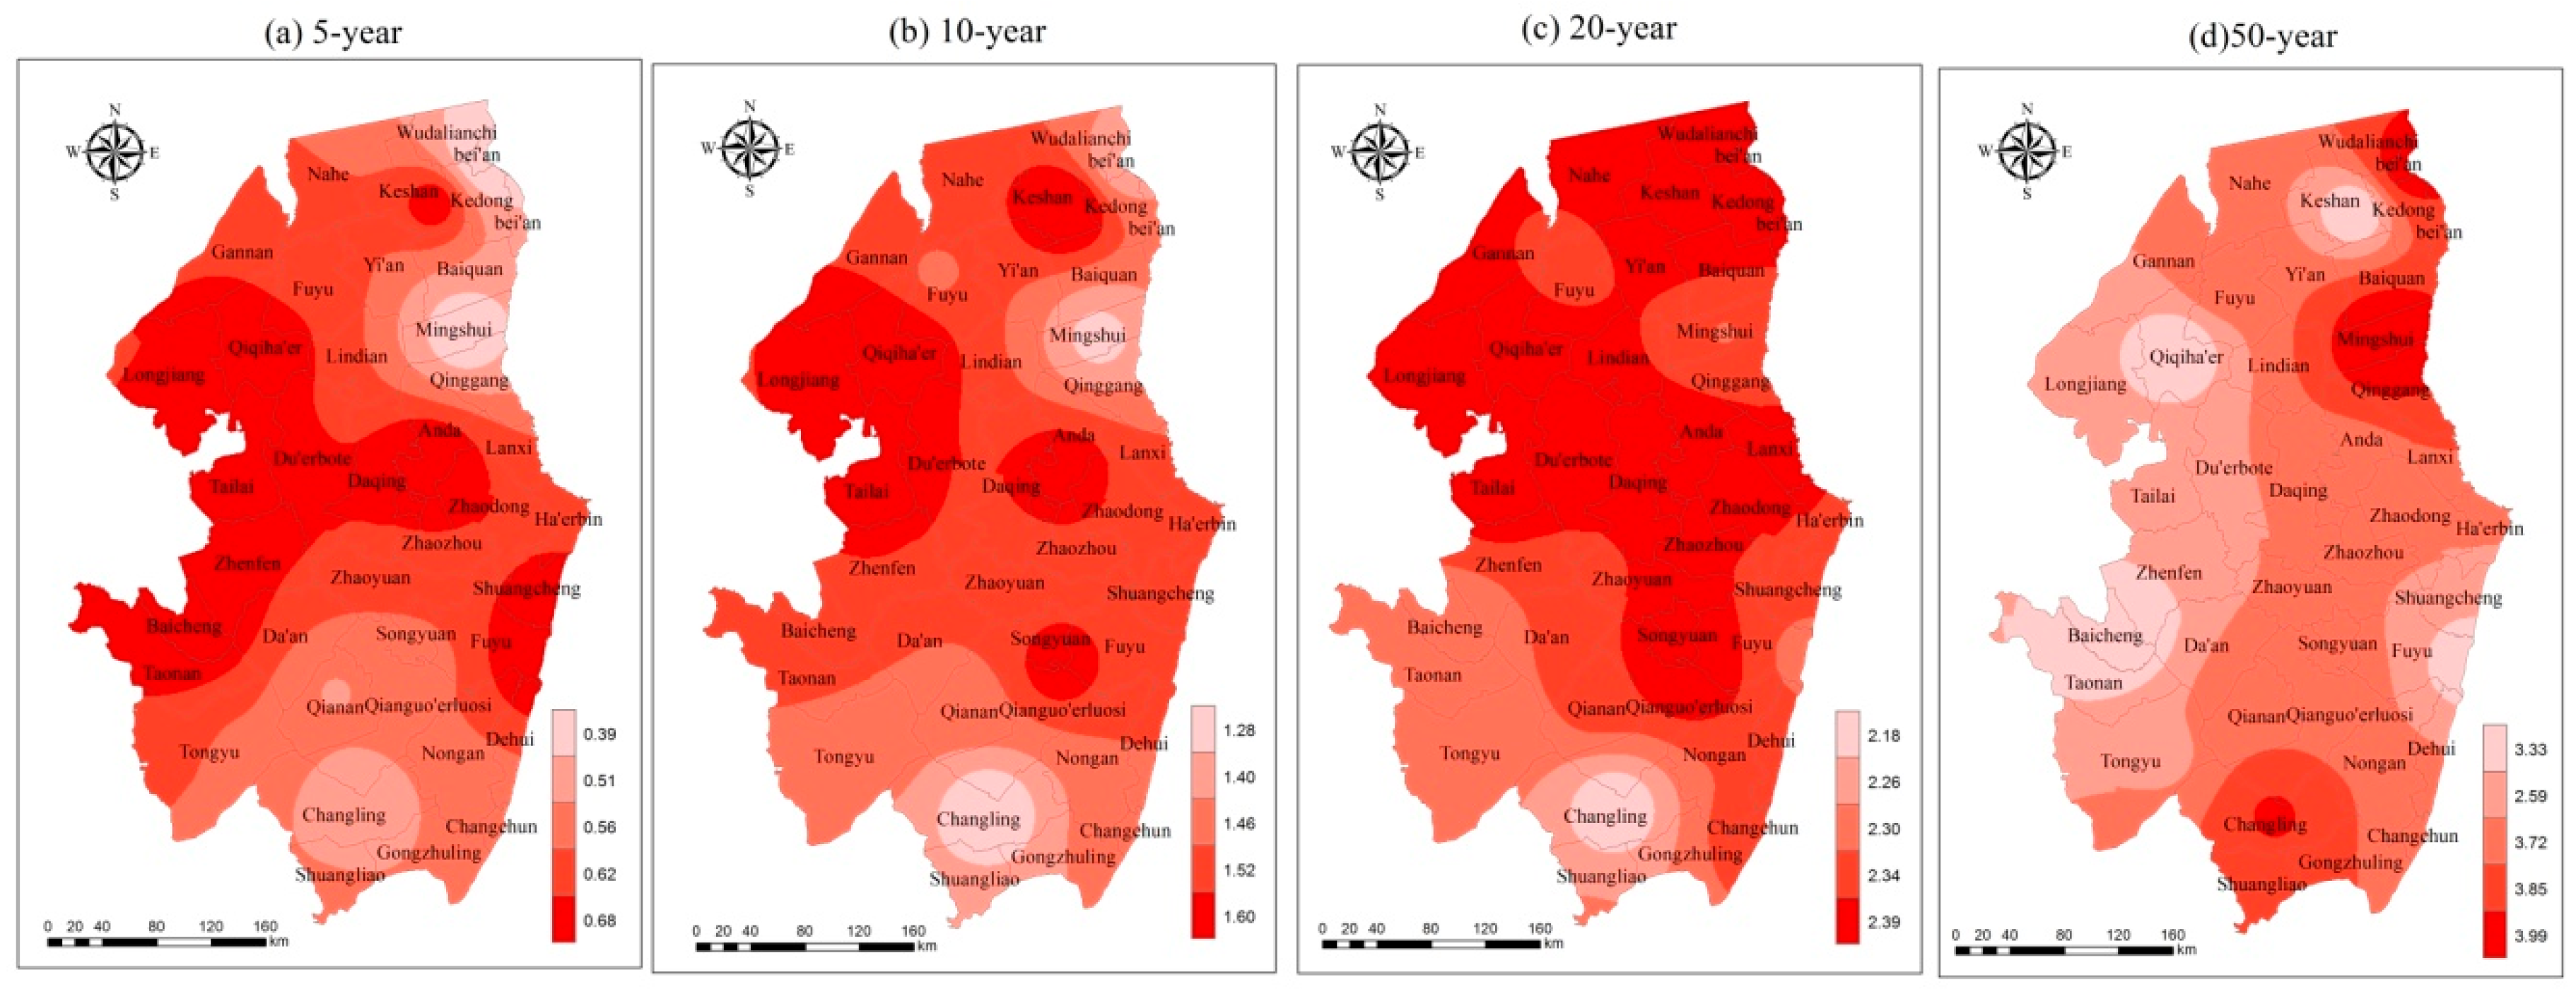
4.4. Spatial Characteristics of Drought Duration and Severity for Different Return Periods
4.5. Spatial Distributions of Joint Return Periods and Secondary Return Period
5. Conclusions and Discussion
- (1)
- By evaluating the marginal distribution for drought variables and using the Kolmogorov–Smirnov (K–S) goodness-of-fit test, we found that the drought duration is best investigated by gamma distribution, while the drought severity is best investigated by the generalized extreme value (GEV) distribution. This result obtained is different from the research carried out by Mirabbasi et al. [51], who assume that gamma and exponential distributions are appropriate for the univariate marginal distribution of drought variables. The result indicates that different drought indicators and criterions for drought events may determine the different methods chosen for the marginal distribution of drought variables [52].
- (2)
- To investigate the joint performance of drought duration and drought severity, the Frank, G–H and Clayton copulas were employed and their results were assessed by RMSE and AIC tests. The RMSE and AIC tests were showed that Frank copula is the best performing model for modeling the joint dependence structure of the drought duration and drought severity of the study region.
- (3)
- The two kinds of the return periods of drought events are analyzed according to the two scenarios. Then, the spatial distributions of two kinds of the return periods of drought events considering different return periods are analyzed. In this study, we investigated two scenarios of drought events. Results indicate that there is a higher risk of droughts in Keshan county, Longjiang county, Qiqiha’er city, Taonan city and Baicheng city. There is a relatively lower risk of drought in Bei’an city, Mingquan county, Qinggang county and Qian’an county, and also in Changling county and Shaungliao city.
Author Contributions
Funding
Acknowledgments
Conflicts of Interest
References
- Shen, J.G. China Meteorological Disaster Ceremony: Inner Mongolia Volume; Meteorological Press: Beijing, China, 2008. [Google Scholar]
- Palmer, W. Meteorological Drought; Research Paper, NO. 45; U.S. Department of Commerce Weather Bureau: Washngton, DC, USA, 1965; 58p.
- Mckee, T.B.; Doesken, N.J.; Kleist, J. The relationship of drought frequency and duration to time scales. In Eighth Conference on Applied Climatology; American Meteorological Society: Boston, MA, USA, 1993. [Google Scholar]
- Kite, G.W. Frequency and Risk Analyses in Hydrology; Water Resources Publications: Fort Collins, CO, USA, 1988.
- Byun, H.R.; Wilhite, D.A. Objective Quantification of Drought Severity and Duration. J. Clim. 1999, 12, 2747–2756. [Google Scholar] [CrossRef]
- Keyantash, J.A.; Dracup, J.A. An aggregate drought index: Assessing drought severity based on fluctuations in the hydrologic cycle and surface water storage. Water Resour. Res. 2004, 40, 333–341. [Google Scholar] [CrossRef]
- National Standard of People’s Republic of China GB/T 20481-2006. Classification of Meteorological Drought; Beijing China Standard Press: Beijing, China, 2006. (In Chinese) [Google Scholar]
- Tsakiris, G.; Pangalou, D.; Vangelis, H. Regional Drought Assessment Based on the Reconnaissance Drought Index (RDI). Water Resour. Manag. 2007, 21, 821–833. [Google Scholar] [CrossRef]
- Vicenteserrano, S.M.; Beguería, S.; Lópezmoreno, J.I. A multiscalar drought index sensitive to global warming: The standardized precipitation evapotranspiration index. J. Clim. 2010, 23, 1696–1718. [Google Scholar] [CrossRef]
- Shiau, J.T. Fitting Drought Duration and Severity with Two-Dimensional Copulas. Water Resour. Manag. 2006, 20, 795–815. [Google Scholar] [CrossRef]
- Song, S.; Singh, V.P. Frequency analysis of droughts using the Plackett copula and parameter estimation by genetic algorithm. Stoch. Environ. Res. Risk Assess. 2010, 24, 783–805. [Google Scholar] [CrossRef]
- Ganguli, P.; Reddy, M.J. Risk Assessment of Droughts in Gujarat Using Bivariate Copulas. Water Resour. Manag. 2012, 26, 3301–3327. [Google Scholar] [CrossRef]
- Ma, M.; Song, S.; Ren, L.; Jiang, S.; Song, J. Multivariate drought characteristics using trivariate Gaussian and Student t copulas. Hydrol. Process. 2013, 27, 1175–1190. [Google Scholar] [CrossRef]
- Saghafian, B.; Mehdikhani, H. Drought characterization using a new copula-based trivariate approach. Nat. Hazards 2014, 72, 1391–1407. [Google Scholar] [CrossRef]
- Serinaldi, F.; Bonaccorso, B.; Cancelliere, A.; Grimaldi, S. Probabilistic characterization of drought properties through copulas. Phys. Chem. Earth Parts A/B/C 2009, 34, 596–605. [Google Scholar] [CrossRef]
- Yusof, F.; Hui-Mean, F.; Suhaila, J.; Yusof, Z. Characterisation of Drought Properties with Bivariate Copula Analysis. Water Resour. Manag. 2013, 27, 4183–4207. [Google Scholar] [CrossRef]
- Masud, M.B.; Khaliq, M.N.; Wheater, H.S. Analysis of meteorological droughts for the Saskatchewan River Basin using univariate and bivariate approaches. J. Hydrol. 2015, 522, 452–466. [Google Scholar] [CrossRef]
- Salvadori, G.; Michele, C.D. Multivariate real-time assessment of droughts via copula-based multi-site Hazard Trajectories and Fans. J. Hydrol. 2015, 526, 101–115. [Google Scholar] [CrossRef]
- Kim, T.W.; ValdéS, J.B.; Yoo, C. Nonparametric Approach for Estimating Return Periods of Droughts in Arid Regions. J. Hydrol. Eng. 2003, 8, 237–246. [Google Scholar] [CrossRef]
- Salvadori, G. Bivariate return periods via 2-Copulas. Stat. Methodol. 2004, 1, 129–144. [Google Scholar] [CrossRef]
- China Meteorological Data Sharing Service System. (1960–2014). Available online: http://cdc.cma.gov.cn (accessed on 30 October 2019).
- Su, B.; Jiang, T.; Jin, W. Recent trends in observed temperature and precipitation extremes in the Yangtze River basin, China. Theor. Appl. Climatol. 2006, 83, 139–151. [Google Scholar] [CrossRef]
- Klein Tank, A.; Ko¨nnen, G. Trends in indices of daily temperature and precipitation extremes in Europe, 1946–1999. J. Clim. 2003, 16, 3665–3680. [Google Scholar] [CrossRef]
- Vicente-Serrano, S.M.; Beguería-Portugués, S. Estimating extreme dry-spell risk in the middle Ebro valley (northeastern Spain): A comparative analysis of partial duration series with a general Pareto distribution and annual maxima series with a Gumbel distribution. Int. J. Climatol. 2003, 23, 1103–1118. [Google Scholar] [CrossRef]
- Yevjevich, V. Objective Approach to Definitions and Investigations of Continental Hydrologic Droughts; Hydrology Paper 23; Colorado State University: Fort Collins, CO, USA, 1967. [Google Scholar]
- Mckee, T.B.N.; Doeskin, N.J.; Kleist, J. Drought Monitoring with Multiple Time Scales. In Proceedings of the 9th Conference on Applied Climatology, Dallas, TX, USA, 15–20 January 1995; p. 505. [Google Scholar]
- Sklar, A. Fonctions de Repartition an Dimensions et Leurs Marges; Publ. inst. statist University Paris: Paris, France, 1959; Volume 8, pp. 229–231. [Google Scholar]
- Nelsen, R. An Introduction to Copulas, 2nd ed.; Springer: New York, NY, USA, 2006. [Google Scholar]
- Joe, H. Dependence Modeling with Copulas. In CRC Monographs on Statistics & Applied Probability; Chapman & Hall: London, UK, 2014. [Google Scholar]
- Durante, F.; Sempi, C. Principles of Copula Theory; CRC/Chapman & Hall: Boca Raton, FL, USA, 2015. [Google Scholar]
- Salvadori, G.; De Michele, C.; Kottegoda, N.; Rosso, R. Extremes in Nature. An approach using Copulas. In Vol. 56 of Water Science and Technology Library Series; Springer: Dordrecht, The Netherlands, 2007; ISBN 978-1-4020-4415-1. [Google Scholar]
- Genest, C.; Favre, A. Everything you always wanted to know about copula modeling but were afraid to ask. J. Hydrol. Eng. 2007, 12, 347–368. [Google Scholar] [CrossRef]
- Salvadori, G.; Tomasicchio, G.R.; D’Alessandro, F. Practical guidelines for multivariate analysis and design in coastal and off-shore engineering. Coast. Eng. 2014, 88, 1–14. [Google Scholar] [CrossRef]
- Salvadori, G.; Durante, F.; Tomasicchio, G.R.; D’Alessandro, F. Practical guidelines for the multivariate assessment of the structural risk in coastal and off-shore engineering. Coast. Eng. 2015, 95, 77–83. [Google Scholar] [CrossRef]
- Jiang, C.; Xiong, L.H.; Xu, C.Y.; Guo, S.L. Bivariate frequency analysis of nonstationary low-flow series based on the timevarying copula. Hydrol. Process. 2015, 29, 1521–1534. [Google Scholar] [CrossRef]
- Willmott, C.J. On the validation of models. Phys. Geogr. 1981, 2, 184–194. [Google Scholar] [CrossRef]
- Burnham, K.P.; Anderson, D.R. Model Selection and Multimodel Inference: A Practical Information-Theoretic Approach, 2nd ed.; Springer: New York, NY, USA, 2002. [Google Scholar]
- Claeskens, G.; Hjort, N. Model Selection and Model Averaging, Cambridge Series in Statistical and Probabilistic Mathematics; Cambridge University Press: Cambridge, UK, 2008. [Google Scholar]
- Mathier, L.; Perreault, L.; Bobée, B.; Ashkar, F. The use of geometric and gamma-related distributions for frequency analysis of water deficit. Stoch. Environ. Res. Risk Assess. 1992, 6, 239–254. [Google Scholar] [CrossRef]
- Massey, F.J. The Kolmogorov-Smirnov Test for Goodness of Fit. J. Am. Stat. Assoc. 1951, 46, 68–78. [Google Scholar] [CrossRef]
- Chen, L.; Singh, V.P.; Guo, S. Drought Analysis in the Upper Han River Based on multivariable method. In Proceedings of the AGU Fall Meeting, San Francisco, CA, USA, 5–9 December 2011. [Google Scholar]
- Lee, T.; Modarres, R.; Ouarda, T.B.M.J. Data-based analysis of bivariate copula tail dependence for drought duration and severity. Hydrol. Process. 2013, 27, 1454–1463. [Google Scholar] [CrossRef]
- Salvadori, G.; De Michele, C. Frequency analysis via copulas: Theoretical aspects and applications to hydrological events. Water Resour. Res. 2004, 40. [Google Scholar] [CrossRef]
- Salvadori, G.; Durante, F.; De Michele, C. Multivariate return period calculation via survival functions. Water Resour. Res. 2013, 49, 2308–2311. [Google Scholar] [CrossRef]
- Salvadori, G.; De Michele, C.; Durante, F. On the return period and design in a multivariate framework. Hydrol. Earth Syst. Sci. 2011, 15, 3293–3305. [Google Scholar] [CrossRef]
- Shiau, J.T. Return period of bivariate distributed extreme hydrological events. Stoch. Environ. Res. Risk Assess. 2003, 17, 42–57. [Google Scholar] [CrossRef]
- Salvadori, G.; Michele, C.D.; Durante, F. Multivariate design via Copulas. Hydrol. Earth Syst. Sci. Discuss. 2011, 8, 5523–5558. [Google Scholar] [CrossRef]
- Lotsch, A.; Friedl, M.A.; Anderson, B.T.; Tucker, C.J. Coupled vegetation-precipitation variability observed from satellite and climate records. Geophys. Res. Lett. 2003, 30, 107–218. [Google Scholar] [CrossRef]
- Ransom, R.B.J. Biostatistical Analysis by J. H. Zar. Am. Biol. Teach. 1974, 36, 316. [Google Scholar] [CrossRef]
- Gräler, B.; van den Berg, M.; Vandenberghe, S.; Petroselli, A.; Grimaldi, S.; De Baets, B.; Verhoest, N. Joint return periods in hydrology: A critical and practical review focusing on synthetic design hydrograph estimation. Hydrol. Earth Syst. Sci. 2013, 17, 1281–1296. [Google Scholar] [CrossRef]
- Mirabbasi, R.; Fakheri-Fard, A.; Dinpashoh, Y. Bivariate drought frequency analysis using the copula method. Theor. Appl. Climatol. 2012, 108, 191–206. [Google Scholar] [CrossRef]
- Zhang, D.D.; Yan, D.H.; Lu, F.; Wang, Y.C.; Feng, J. Copula-based risk assessment of drought in Yunnan province, China. Nat. Hazards 2015, 75, 2199–2220. [Google Scholar] [CrossRef]


| NO. | Station Name | Station NO. | Longitude (°) | Latitude (°) | DEM (m) |
|---|---|---|---|---|---|
| 1 | Beian | 50656 | 126.52 | 48.28 | 269.70 |
| 2 | Keshan | 50658 | 125.88 | 48.05 | 234.60 |
| 3 | Fuyu | 50742 | 124.48 | 47.80 | 162.70 |
| 4 | Qiqihaer | 50745 | 123.92 | 47.38 | 147.10 |
| 5 | Mingshui | 50758 | 125.90 | 47.17 | 247.20 |
| 6 | Tailai | 50844 | 123.42 | 46.40 | 149.50 |
| 7 | Anda | 50854 | 125.32 | 46.38 | 149.30 |
| 8 | Baicheng | 50936 | 122.83 | 45.63 | 155.30 |
| 9 | Qianan | 50948 | 124.02 | 45.00 | 146.30 |
| 10 | Qianguoerluosi | 50949 | 124.87 | 45.08 | 136.20 |
| 11 | Tongyu | 54041 | 123.07 | 44.78 | 149.50 |
| 12 | Changling | 54049 | 123.97 | 44.25 | 188.90 |
| 13 | Fuyu | 54063 | 126.00 | 44.97 | 196.80 |
| 14 | Changchun | 54161 | 125.22 | 43.90 | 236.80 |
| 15 | Shuangliao | 54142 | 123.53 | 43.50 | 114.90 |
| Copula Types | The Relationship between θ and τ |
|---|---|
| G–H | |
| Clayton | |
| Frank |
| NO. | Station Name | Kendall’s Tau Coefficient | Copula Family | ||||||||
|---|---|---|---|---|---|---|---|---|---|---|---|
| Clayton | Frank | G–H | |||||||||
| Parameter | RMSE | AIC | Parameter | RMSE | AIC | Parameter | RMSE | AIC | |||
| 1 | Qian’an | 0.6056 | 1.52 | 0.11 | −298.26 | 6.10 | 0.10 | −306.25 | 1.97 | 0.11 | −299.80 |
| 2 | Keshan | 0.5656 | 1.33 | 0.12 | −311.66 | 5.27 | 0.12 | −319.93 | 1.82 | 0.12 | −315.29 |
| 3 | Qianguo | 0.5205 | 1.14 | 0.12 | −288.75 | 4.64 | 0.12 | −293.91 | 1.76 | 0.12 | −291.55 |
| 4 | Bei’an | 0.5814 | 1.29 | 0.13 | −275.32 | 5.39 | 0.12 | −283.40 | 1.80 | 0.13 | −277.19 |
| 5 | Shuangliao | 0.6061 | 1.29 | 0.15 | −282.58 | 6.04 | 0.14 | −294.89 | 1.96 | 0.14 | −288.87 |
| 6 | Anda | 0.5333 | 1.11 | 0.15 | −282.58 | 5.01 | 0.14 | −294.89 | 1.75 | 0.14 | −288.87 |
| 7 | Fuyu | 0.5463 | 1.17 | 0.13 | −297.52 | 5.05 | 0.13 | −306.53 | 1.71 | 0.13 | −298.81 |
| 8 | Fuyu | 0.5391 | 1.15 | 0.14 | −286.19 | 4.76 | 0.13 | −291.78 | 1.78 | 0.14 | −288.66 |
| 9 | Mingshui | 0.6182 | 1.38 | 0.13 | −276.18 | 6.17 | 0.12 | −285.56 | 1.97 | 0.13 | −278.88 |
| 10 | Tailai | 0.5652 | 1.19 | 0.14 | −287.44 | 5.28 | 0.13 | −297.86 | 1.81 | 0.13 | −292.36 |
| 11 | Baicheng | 0.5581 | 1.16 | 0.14 | −299.62 | 5.23 | 0.13 | −311.62 | 1.86 | 0.13 | −307.93 |
| 12 | Tongyu | 0.5939 | 1.32 | 0.14 | −280.95 | 5.87 | 0.13 | −290.24 | 2.00 | 0.13 | −286.31 |
| 13 | Changling | 0.6035 | 1.32 | 0.16 | −272.96 | 6.33 | 0.15 | −286.02 | 1.90 | 0.16 | −275.71 |
| 14 | Changchun | 0.5759 | 1.28 | 0.13 | −285.69 | 5.57 | 0.12 | −297.61 | 1.79 | 0.13 | −289.20 |
| 15 | Qiqiha’er | 0.5764 | 1.26 | 0.13 | −291.12 | 5.53 | 0.12 | −301.44 | 1.91 | 0.12 | −297.48 |
© 2019 by the authors. Licensee MDPI, Basel, Switzerland. This article is an open access article distributed under the terms and conditions of the Creative Commons Attribution (CC BY) license (http://creativecommons.org/licenses/by/4.0/).
Share and Cite
Wu, R.; Zhang, J.; Bao, Y.; Guo, E. Run Theory and Copula-Based Drought Risk Analysis for Songnen Grassland in Northeastern China. Sustainability 2019, 11, 6032. https://doi.org/10.3390/su11216032
Wu R, Zhang J, Bao Y, Guo E. Run Theory and Copula-Based Drought Risk Analysis for Songnen Grassland in Northeastern China. Sustainability. 2019; 11(21):6032. https://doi.org/10.3390/su11216032
Chicago/Turabian StyleWu, Rina, Jiquan Zhang, Yuhai Bao, and Enliang Guo. 2019. "Run Theory and Copula-Based Drought Risk Analysis for Songnen Grassland in Northeastern China" Sustainability 11, no. 21: 6032. https://doi.org/10.3390/su11216032
APA StyleWu, R., Zhang, J., Bao, Y., & Guo, E. (2019). Run Theory and Copula-Based Drought Risk Analysis for Songnen Grassland in Northeastern China. Sustainability, 11(21), 6032. https://doi.org/10.3390/su11216032