Article

Influence of Automated Maneuvers on the Economic Feasibility of Tidal Energy Farms

1
Escuela Técnica Superior de Ingenieros Industriales de Albacete, Universidad de Castilla-La Mancha, 02071 Albacete, Spain
2
Escuela Técnica Superior de Ingenieros Navales, Universidad Politécnica de Madrid, 28040 Madrid, Spain
*
Author to whom correspondence should be addressed.
Sustainability 2019, 11(21), 5965; https://doi.org/10.3390/su11215965
Submission received: 21 September 2019 / Revised: 15 October 2019 / Accepted: 22 October 2019 / Published: 26 October 2019
(This article belongs to the Section Economic and Business Aspects of Sustainability)

Abstract

:
The vertiginous increase in the global demand for energy, together with the imbalance between the period during when fossil resources were formed and the rhythm of their consumption, makes it necessary to promote renewable energies in order for energy consumption to coexist with sustainable development. One of the most important challenges as regards renewable energy generation is to be able to move to a new low carbon economy in which energy demands can be met while the levels of CO 2 emitted are reduced. In this respect, most of the energy obtained from marine currents, the most predictable renewable energy source, is located at great depths. In order to take advantage of this energy, different types of technologies are currently being developed whose economic viability necessitates a reduction in costs. The development of automated systems that will allow the orientation and depth of tidal energy converters to change automatically in order to reduce maintenance maneuvers and take advantage of the energy resource in an optimal manner is, therefore, essential. This paper analyzes the economic feasibility of the automation of installation and maintenance maneuvers on tidal energy farms by means of the levelized cost of energy (LCOE) and costs. These aspects have been analyzed in the case of the Alderney Race (United Kingdom). The results obtained show that the use of marine current harnessing devices with automated maneuvers has a relatively important economic advantage over those devices designed with the technology that requires manual maneuvers for the installation and operation procedures, thus enabling the cost of energy to be reduced and increasing the profitability of the project.

1. Introduction

The concern about global climate change, the importance of reducing greenhouse gas emissions, the current dependency on and limited life span of fossil fuels and the current rise in energy prices have increased in recent years [1,2,3]. An emphasis on the development of renewable energy sources is necessary, and this has been identified by the European Union (EU), which in 2009 stated the need to reduce 20% of the consumption of energy and 20% of the carbon dioxide (CO 2 ) emissions with the goal of obtaining 20% of the EU’s final energy consumption from renewable energy sources by 2020 [4,5]. The European Council’s definition of the 2030 climate and energy framework, including targets and policy objectives for the period from 2021 to 2030, took place in 2014. This stated that it was necessary to reduce at least 40% of greenhouse gas emissions (from 1990 levels) in order for the EU to obtain 20% of its final energy consumption from renewable energy sources and to improve its energy efficiency by at least 32.5% by 2030 [6]. In 2018, these targets for renewable sources and energy efficiency were revised upwards. This was done to enable Europe to lead the way towards climate neutrality by empowering citizens, investing in realistic technological solutions, and aligning action in key areas including industrial policy, finance, or research. The need to ensure social fairness for a just transition [7] was also stated, in addition to which 2050 was set as the target year by which to have reduced emissions by 80% [8,9]. In this context, and in order to achieve sustainable development, the United Nations Framework Convention on Climate Change was established in 2015 with the objective of reducing the causes of climate change in the case of food production and to limit rises in temperature (increases of up to 1.5 C) [10].
Several clean renewable technologies could be exploited in order to attain this objective, of which marine energy (mainly represented by offshore wind energy [11,12,13], wave energy [14,15] and tidal current energy [16]) have received a considerable amount of attention owing to the fact that they could provide the following opportunities and benefits [17,18,19]: energy independence, decarbonization, job creation and being a complement to other renewable sources within the global energy mix [20,21,22]. Of the various types of marine energy, this work is focused on marine current harnessing which, although still in its infancy, and despite the fact that only some marine current energy conversion systems are being implemented at the prototype and pre-commercial demonstration stage at sea, has remarkable advantages with regard to the others: abundant resources in many places throughout the world (the Amazon, the Arctic Ocean, the Bay of Fundy, Bosporus, the English Channel, Gibraltar, the Gulf of Mexico, the Gulf of St Lawrence, the Hebrides, the Irish Sea, Messina, Rio de la Plata, Sicily, Skagerrak-Kattegat and the Straits of Magellan, etc.) [23,24], high predictability [25], public acceptance [26] and social benefits [27]. However, all systems in which renewable energy sources are employed as a basis and that are intented for commercialization must first be assessed at an economic level so as to consistently quantify their costs. This will make it possible to both discover the profitability of the system and simultaneously allow commercialization and attract investment [28]. There is, unfortunately, little experience in this field, and evaluating tidal energy projects with a suitable amount of confidence is, therefore, difficult. This is because there are not sufficient data and owing to the high level of uncertainty [29]. It is important to mention that only a small number of studies have concentrated specifically on the economic feasibility on the systems in question or on how to estimate that feasibility, in spite of the fact that this renewable energy source has many potential benefits.
In previous works, our research group (Grupo de Investigación Tecnológico en Energías Renovables Marinas, GIT-ERM) developed a methodology with which to compute the different costs of a tidal energy farm (TEF) based on the main tasks of its life-cycle: “concept and definition, design and development, manufacturing, installation, operation and maintenance and decommissioning” in addition to carrying out engineering developments that enable automated emersion/immersion installation and maintenance maneuvers to be performed in first generation tidal energy converters (TECs) [30,31,32,33]. The present paper is the result of these previous works and analyzes the economic influence of the automation of these maneuvers on TEFs. It explains that the automation of maneuvers is a determinant economic parameter in the future development of these renewable technologies and is the reason for developing this work, with the objective of studying what this economic influence is. In particular, the aim of this paper is to quantify of the importance of the automation of these maneuvers in terms of economic aspects, levelized costs of energy (LCOE) and costs on a tidal energy farm. This influence has been determined by considering a particular area a tidal energy farm located in one of the Channel Island Races, the Alderney Race (United Kingdom—UK), which is a highly representative area for the development of these technologies. The results achieved illustrate the economic influence that the automation of installation and maintenance maneuvers has on the LCOE and costs of a tidal energy farm. The conclusions obtained from this work could be very interesting for Governments and investors, thus allowing these technologies to appear on the market and attain maturity.
The remainder of the paper is structured as follows: Section 2 explains the main characteristics of the manual and automated installation and maintenance maneuvers. Section 3 depicts the procedure used to determine the economic feasibility of tidal energy projects. Section 4 provides details about the particular location in which the proposed economic methodology was applied: a 50 MW tidal energy farm in the Alderney Race, where there is a high tidal current energy resource. Section 5 illustrates the viability of the case using manual and automated maneuvers in terms of the LCOE and the costs in order to determine the global competitiveness of this generation technology. Section 6 provides different findings obtained from the study, and finally, Section 7 shows the conclusions of the work.

2. Manual and Automated Maneuvers in Tidal Energy Systems

The information on the installation and maintenance maneuvers of devices for marine current harnessing is scarce, since these devices are currently in the testing phase (pre-commercial) and there are no real data concerning the maneuvers that should be performed. There is, however, relatively general information based on the installation of the devices under trials that provides us a fairly accurate idea of these maneuvers [34,35,36]. It will, therefore, first be necessary to study how the maneuvers are carried out in these devices (manual control or in open loop), after which we shall describe the automated maneuvers (using the closed loop ballast control to reach the desired depth) that can be carried out thanks to the engineering developments [30,32] realized by the GIT-ERM research group. It should be emphasized that some of the parts employed for both the devices with open-loop maneuvers and the devices with closed-loop control maneuvers are the same. These parts are mainly a study of the area in which the farm will be installed, along with the installation of the energy platform and the bases. Additional details on the installation of the energy platform and bases can be found in [35,36,37].

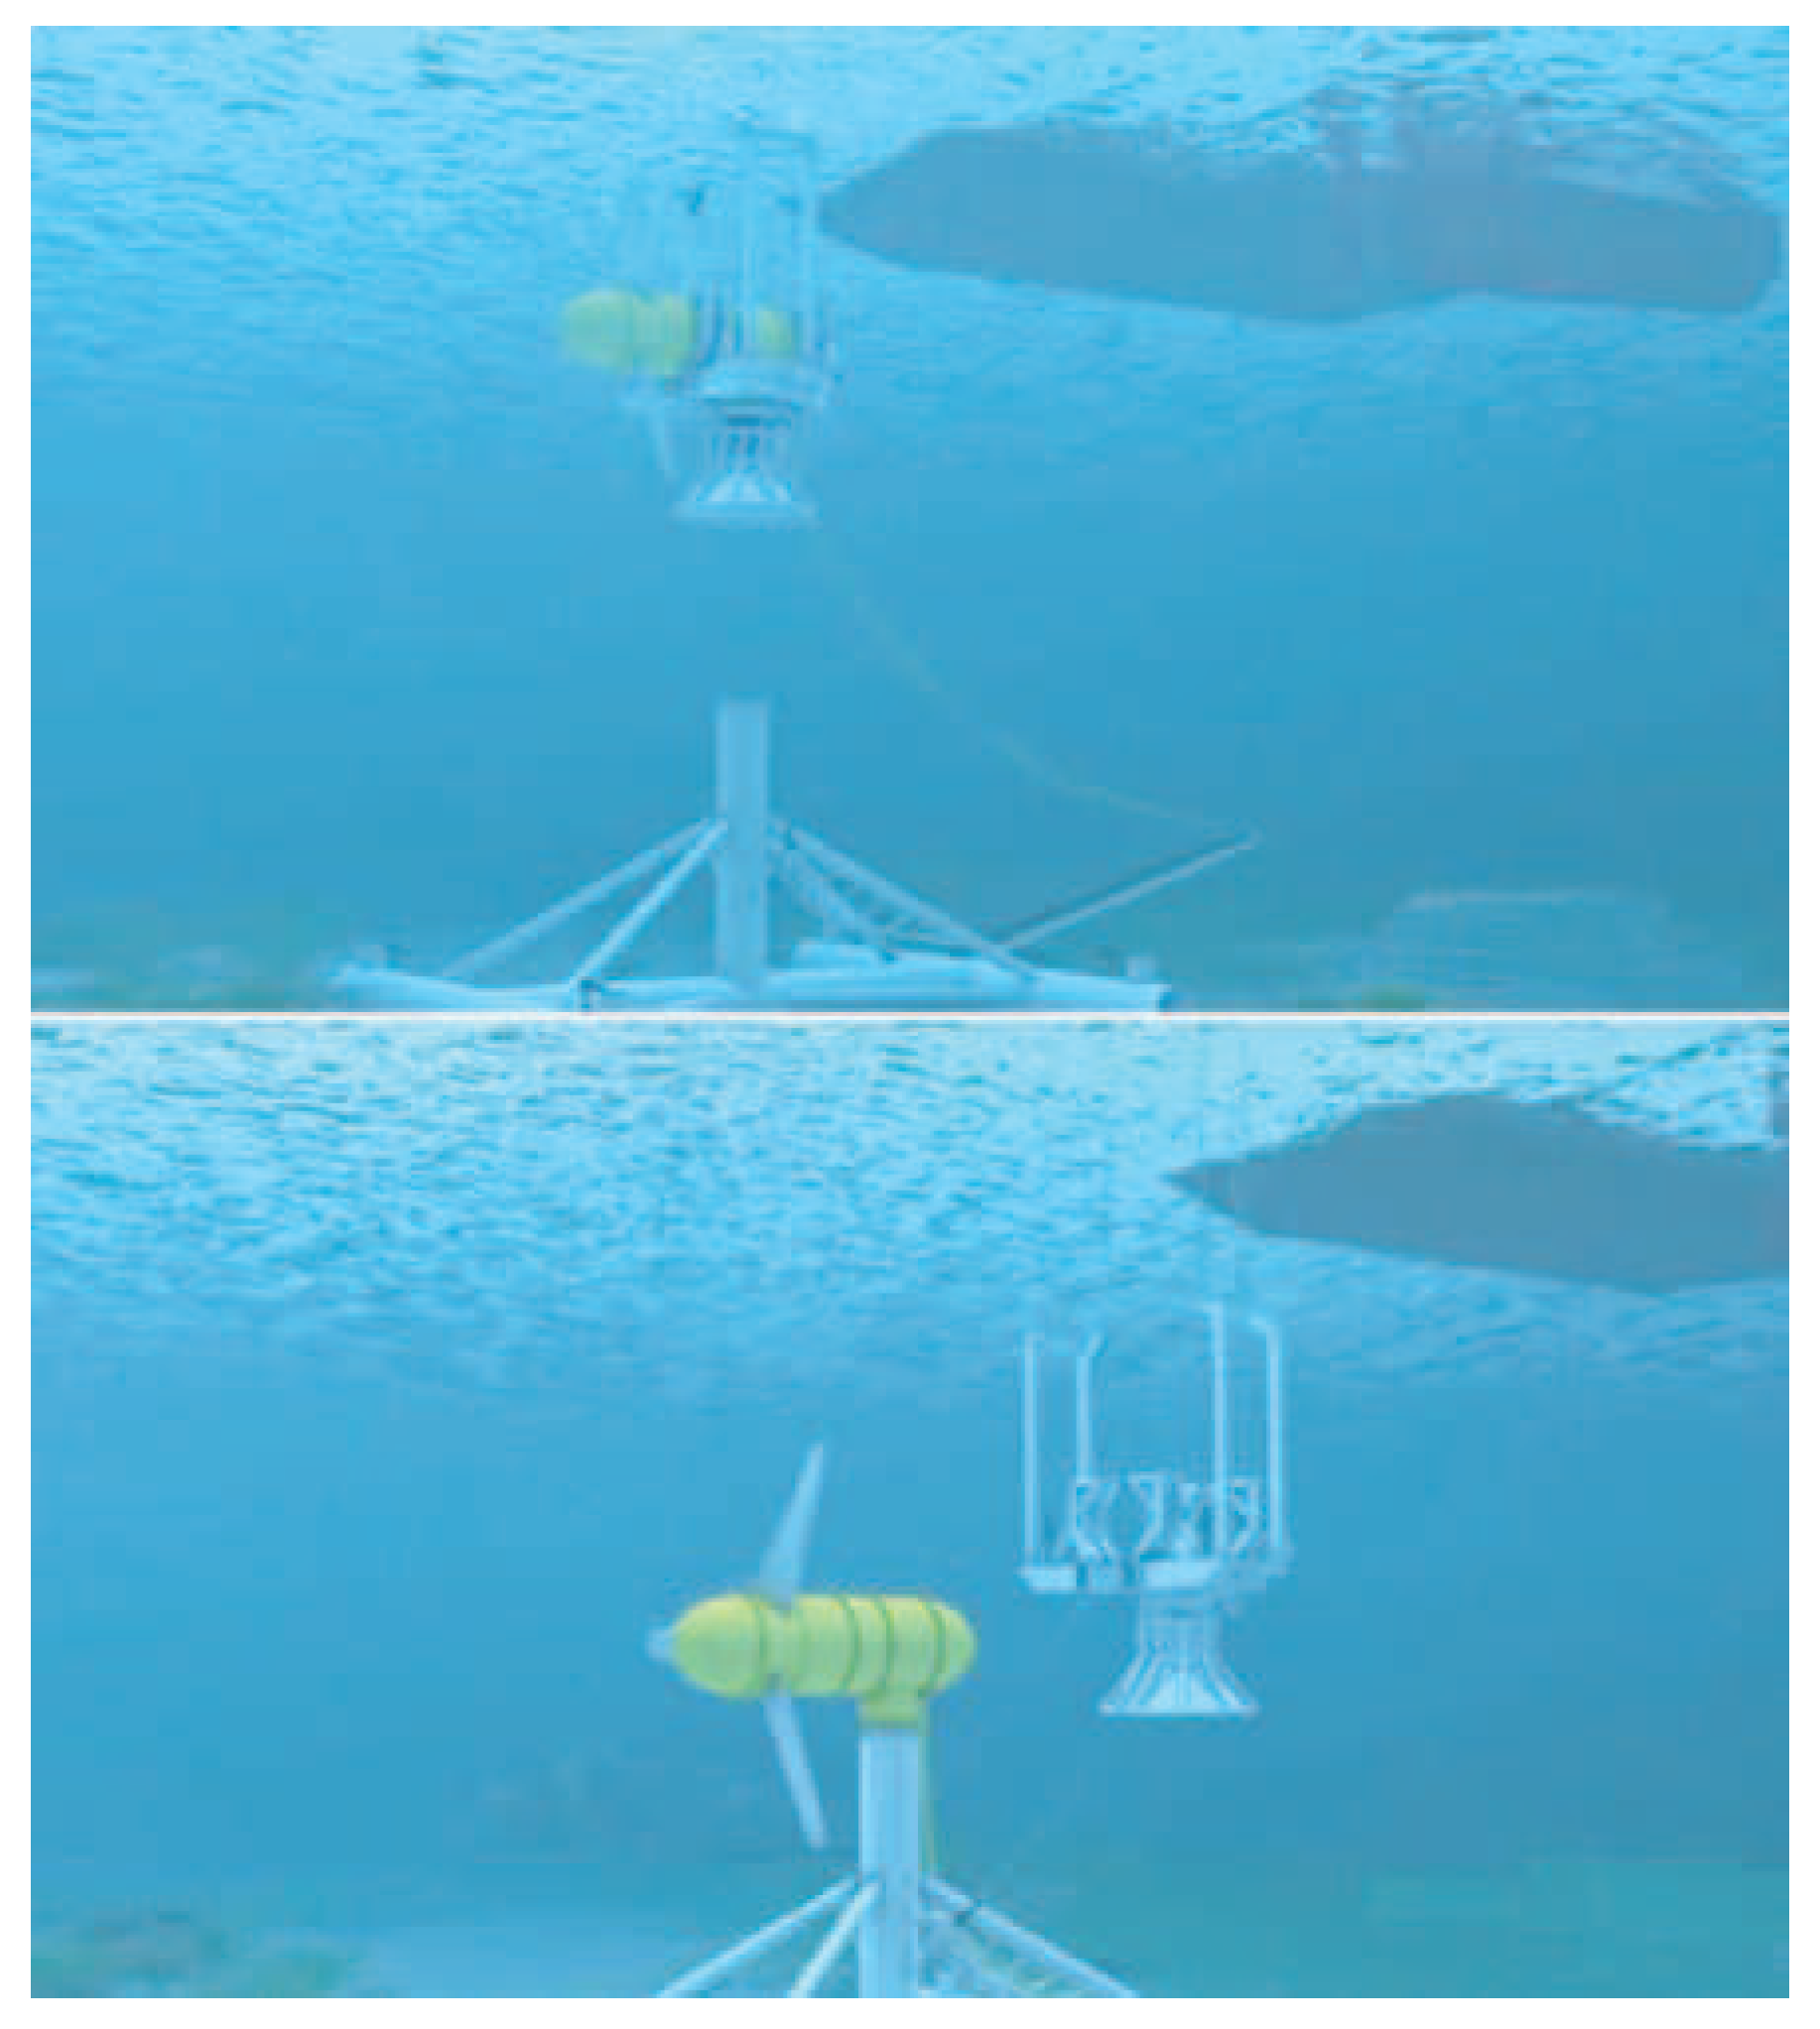
2.1. Manual Maneuvers

Please note that in this work manual maneuvers are understood as the installation maneuvers of marine current harnessing technologies using open loop, and that they are the maneuvers used for the installation of the first generation devices currently found in tests. The gondola must first be submerged and installed on the previously submerged base. Some designs, therefore, need special tools that “hug” the gondola (see Figure 1) and place it in the right place on the base [35,37]. These tools are then removed once the gondola has been correctly positioned. Before carrying out the installation, which takes place on the deck of the special vessel (please note that the base on which the gondola will be placed must have been installed previously), the tool will grasp the gondola. Crane cables and the gondola recovery cables are connected to this tool, and these cables have previously been recovered from the seabed or from the buoy where they had been arranged once the base installation was completed. This recovery cable, which is connected to the base, serves as a guide with which to properly locate the gondola. The gondola is, therefore, lowered with the crane, while controlling the descent speed, to the final position on the base, until the insertion is completed. Once the gondola is connected, the tool opens and it ascends to the special vessel. The guide wires are then disengaged and can, as before, be arranged on the seabed or in a buoy (both operations can be performed using a remote operated vehicle—ROV).
A maintenance proposal for the device is described as follows [37]: (i) Blade cleaning, which will be carried out in the same place that the TEC is located; (ii) Light preventive maintenance, comprising a service and the general maintenance of all the equipment, during which the following operations will be carried out: changing the lubricating oil of the thrust bearing, changing the lubricating oil in the gearbox, refilling the compressed air bottles, a general review of all the components, blade cleaning and a review of paint defects, among others). This maintenance is not very complex, and can be done on board the special vessel, and (iii) High preventive maintenance, during which it will be necessary to disassemble the gondola. The planned operations are the following: changing the bearings of the trust bearing, changing the bearings of the gearbox, changing the lubricating oil in the horn, a general revision of all the components and a complete repaint, among others. The above description makes it clear that special vessels with the following characteristics must be provided for the installation and recovery maneuvers of these devices: (i) Dynamic positioning, which makes it possible to work with redundancy and in extreme situations while guaranteeing safety and reliability. These types of vessels have a high technological and economic cost [38,39,40,41]; (ii) A heavy lifting crane. According to [37], the capacity of this crane should be approximately 250 tons of elevation and; (iii) A large deck area, which must be available to transport the devices, parts, gondolas, etc. to be installed. This signifies that the characteristics required of the vessel that will have to install and recover these devices are not those of a typical vessel and are not, therefore, easy to find for hire on the market. There is also the need for specific systems that make the construction of these vessels more expensive. These vessels exist and are being built for the installation and maintenance of offshore wind farms or for the oil & gas industry, but the cost of hiring them is currently very high and varies depending on the market, which causes a great economic dependence in this regard [42,43]. Moreover, they will not be the only vessels that will intervene in the installation of these devices. Neither will they be the only devices since, as already indicated, ROVs will be necessary, as already indicated, in order to correctly position the devices, as will special vessels for the installation of cables (cable ships, etc.), oceanographic vessels for seabed analysis etc., whose cost is also important [34,40,41].

2.2. Automated Maneuvers

The previous subsection shows a description of the maneuvers that must be performed to install the first generation TECs currently under development. This description makes it possible to infer that these maneuvers are of a complex and expensive nature. Additionally, the areas with greater currents and that are better suited to the extraction of energy from marine currents are areas with adverse weather and meteorological conditions [44], which increase the complexity of these maneuvers. The development of automated installation and maintenance maneuvers in first generation TECs will, therefore, use a ballast control system (developed by the GIT-ERM research group) that will allow: (i) the extraction of the gondola from its normal depth of operation (on the seabed) to the surface of the sea, and (ii) the gondola to be returned from the surface of the sea to its base on the seabed. Figure 2 illustrates the shape of a TEC, which is able to carry out automated maneuvers, and its main distribution equipment inside the gondola. All details about the design modifications that will allow the gondola to perform automated maneuvers, along with important experiments in a laboratory prototype can be found in [30,32,45,46]. This type of automated maneuvering will enable the resources necessary to carry out both the installation and maintenance of the gondolas to be reduced, along with a decrease in their complexity and cost, which could be very interesting for the future development of this renewable energy source.
Figure 3 depicts an example of the installation of a gondola by means of automated maneuvers. Once the tugboat arrives in the area in which the gondola is to be located, the umbilical cable that is connected to the base must be recovered. To do this, if said cable is on the seabed, an acoustic pulse will be released which will cause the cable to rise to the surface. Once the cable has been located by the tugboat, the tugboat will approach that position and will recover the cable. At this time, a diver will be needed who, in addition to collecting the umbilical cable, will connect it to the gondola. At this point, it is necessary to establish how the gondola descent operation will be performed. The gondola will be ballasted to make its weight greater than its thrust and thus allow it to descend. If the difference between thrust and weight is small, the descent will be made slowly. The gondola will, therefore, be lowered vertically, while controlling the descent speed ballasting more or less, depending on the speed required. Thanks to the depth sensors (of acoustic/pressure nature), it is possible to control the depth of the device at all times. The device will descend to a depth close to the top of the base. Additionally, the operation will have to be monitored and controlled by a ROV.
At this time, the gondola will be at the desired depth, but not in the vertical position with regard to the base since there are currents in the sea which prevent the descent from being vertical. It is at this time when the umbilical cable will help to displace the gondola to the position on the base. To do this, a small winch must be placed in the union cylinder between the gondola and the base and will work at a constant tension. As the gondola submerges, the winch will pick up the cable. Once the gondola is placed on the vertical parte of the base, the device will be again be sufficiently ballasted to make it descend onto the base, where it will be “fitted”. The descent of the device can be as fast or as slow as necessary, since the speed can be set according to the ballast that is introduced into the control ballast tanks, and can be controlled at all times.
Finally, it can be inferred that the maintenance process by means of automated maneuvers, as in the case of devices with traditional maneuvers, is divided into several types: (i) Blade cleaning: the emersion and immersion processes of the gondola are faster than for traditional maneuvers; (ii) Light preventive maintenance. In the case of the device with automated maneuvers, its design has been carried out by considering that the basic maintenance will be done “in situ”, but taking into account that the upload and reinstallation operations of the gondola are performing faster and; (iii) High preventive maintenance: in this case, the gondola must be removed from the water and taken to dryland. It will be noted that there are several advantages to the use of automated maneuvers: (a) The number of vessels with a high degree of specialization involved in the operation is reduced; (b) The time spent on maneuvering is also reduced, which means that, in places where these devices are available and where the weather is an important factor, the weather window for performing installation and maintenance operations can be reduced and; (c) The number of highly qualified personnel also decreases.

3. Methodology

The methodology proposed determines the influence that the automation of maneuvers has on first generation TEFs in two economic terms of the farm: the levelized cost of energy (LCOE) and the costs.
The levelized cost of energy (LCOE) is usually used to assess the economic viability of a particular technology and to compare the unit cost of different electricity generation technologies throughout their economic life [47,48,49,50], and it can additionally be used to evaluate different technological alternatives that could be achieved by different investments and time operations. It is defined as the life-cycle cost divided by lifetime energy production under the assumption that the annual discount rate value, k, used for the life-cycle cost and the lifetime energy production, remains constant during the service life of the project [51,52,53]. The LCOE can be computed by means of the following expression, which expresses that the cost of power generation in present value terms equals the profits obtained for power generation in present value terms, i.e.,
C C A P E X + t = 1 n C O P E X t · ( 1 + k ) t = t = 1 n A E P t · P E · ( 1 + k ) t
where C C A P E X denotes the capital expenditures in € and represents an expenditure whose benefit extends beyond one year. It comprises general costs such as the cost of the TEC main support structure, the cost of the base and mooring, the cost of the the Power-Take-Off (PTO) and ancillary/mooring systems, the cost of the different technological units of the TEC, the costs of the tidal energy farm hub platform or the costs of the energy transportation systems, among others [38]. C O P E X t expresses the operating expenditures in year t in € and normally comprises administrative costs, scheduled and unscheduled operation and maintenance costs, insurance, taxes, payments for rent, shipping and shore facilities, among others. A E P t represents the production of energy in year t delivered by all the tidal energy converters on the farm expressed in kWh, P E indicates the cost of energy in €/kW, k expresses the annual discount rate and n is the lifespan of the tidal energy farm. After rearranging the terms in expression (1), the final expression for the LCOE is obtained as follows:
L C O E = P E = C C A P E X + t = 1 n C O P E X t · ( 1 + k ) t t = 1 n E t · ( 1 + k ) t
In expression (2), it will be note that a number of variables need to be determined. The definition of these variables is briefly detailed below.

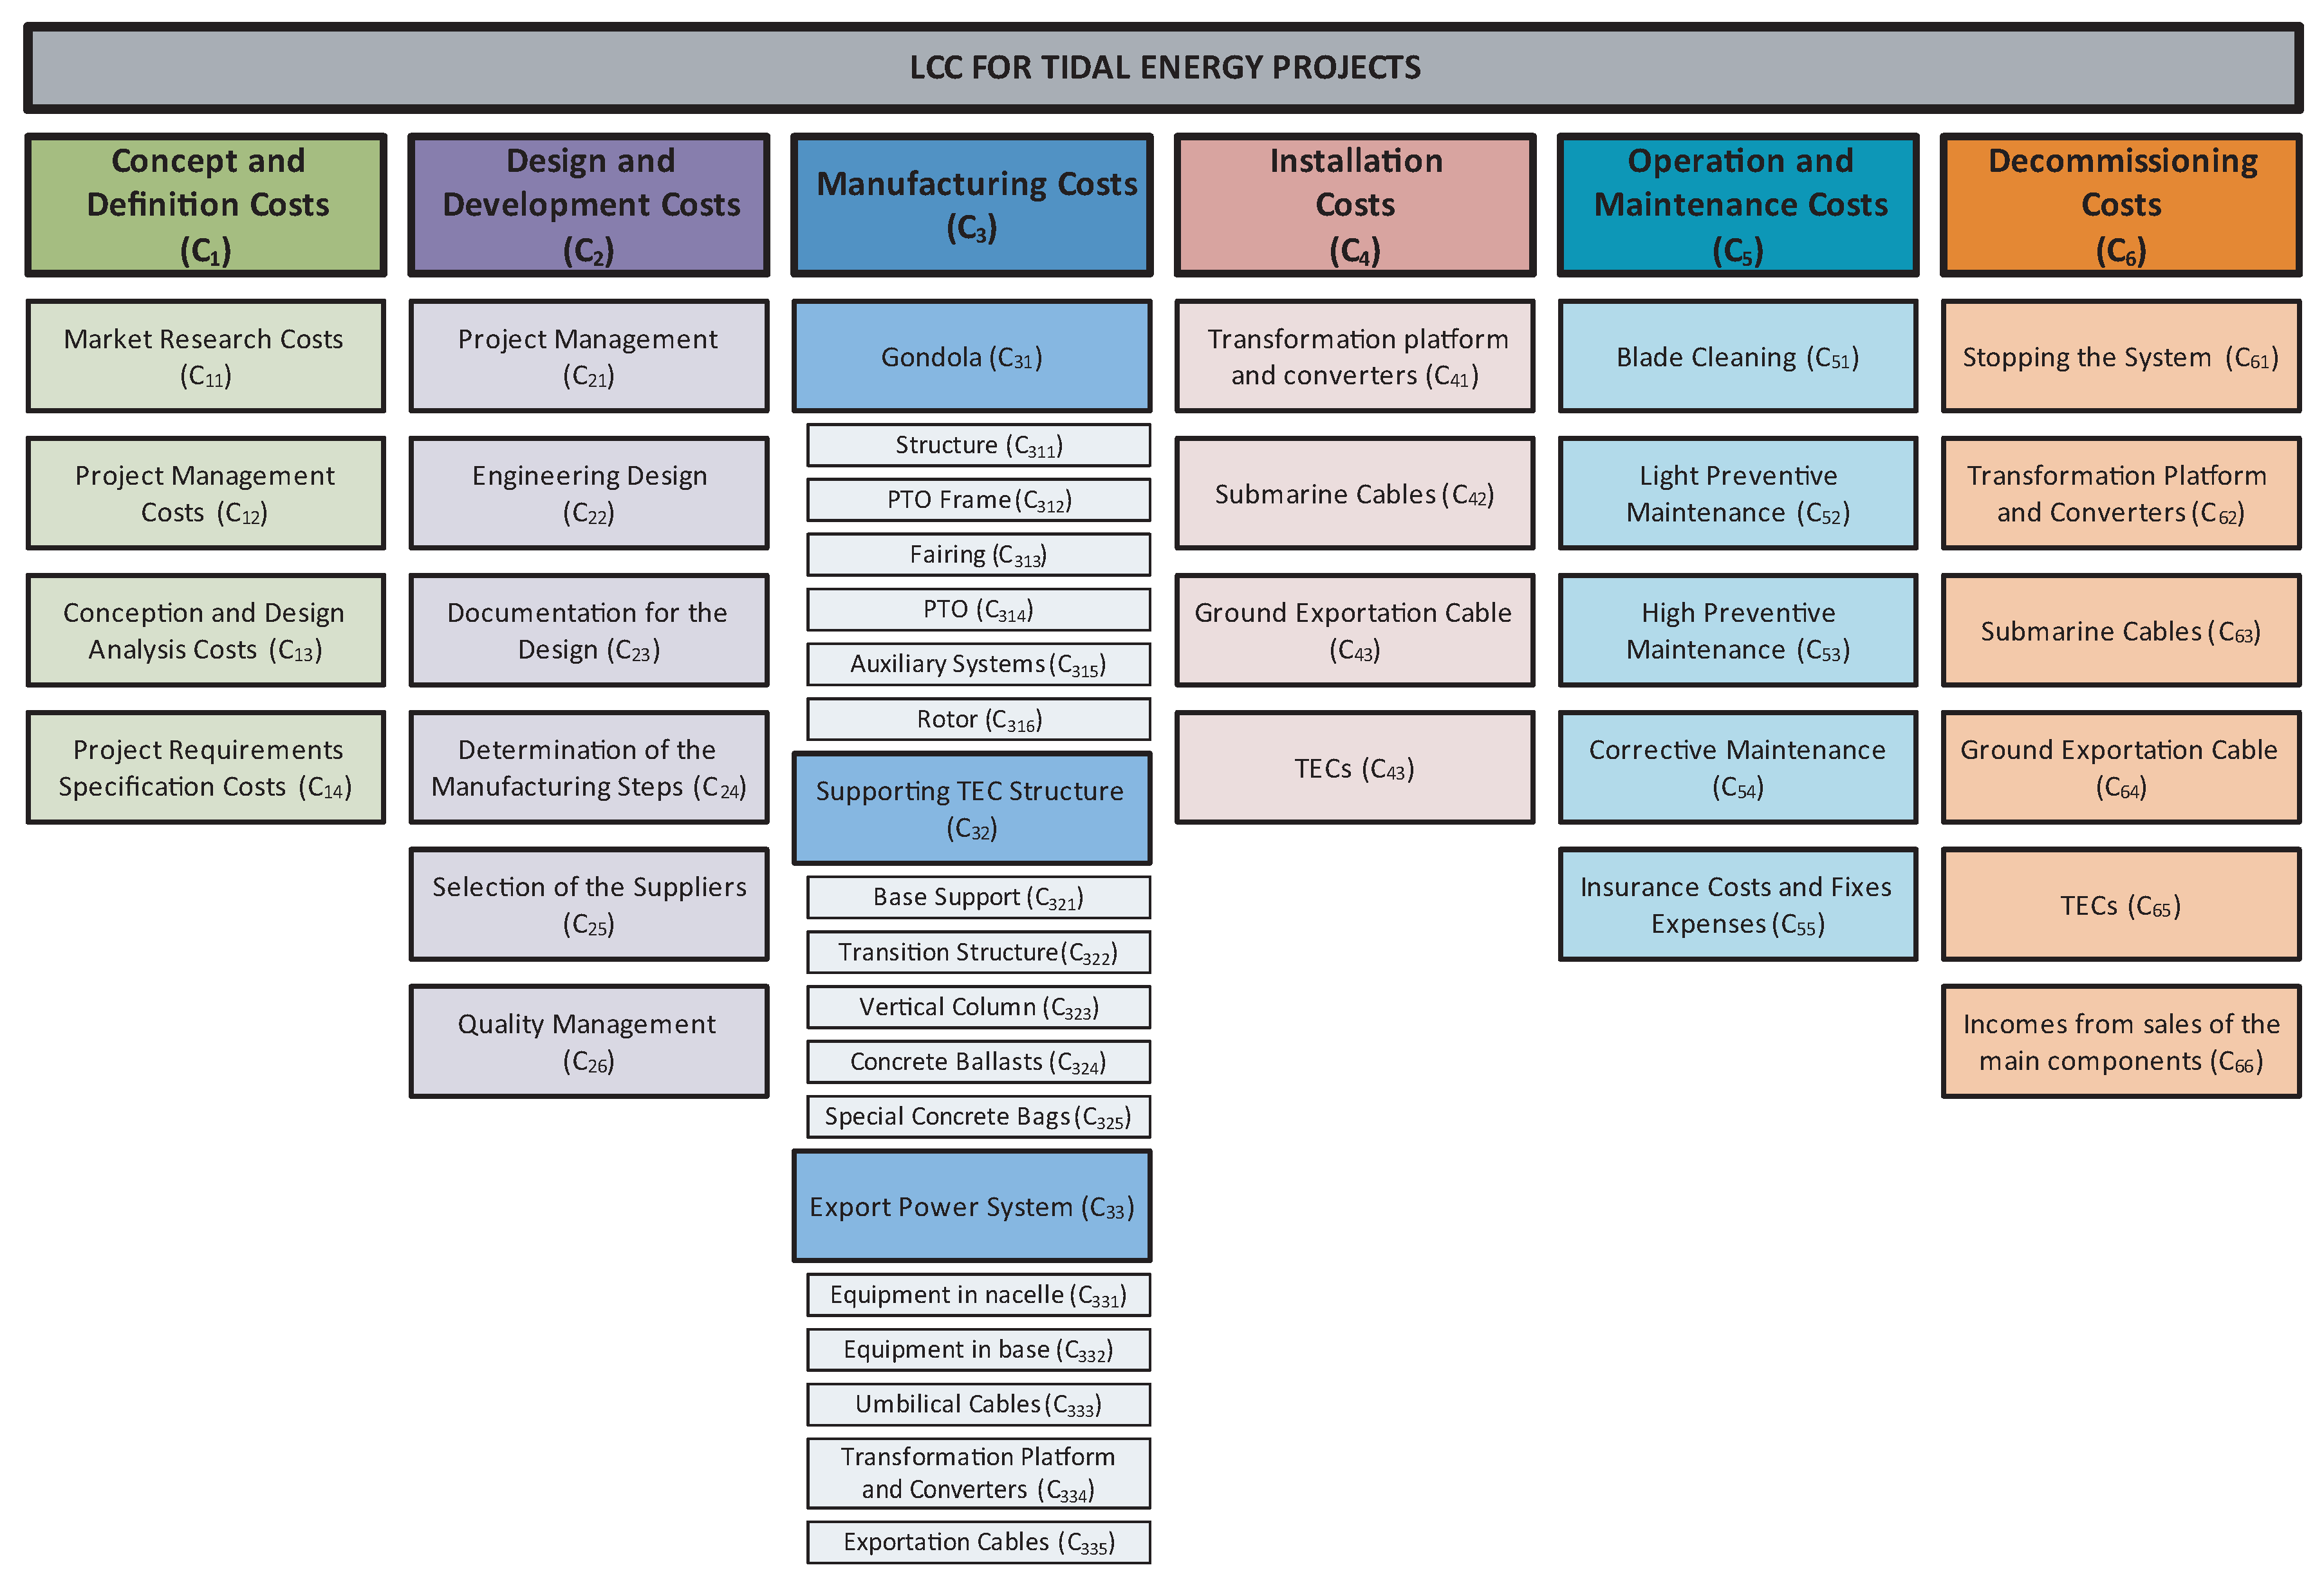
3.1. Life-Cycle Costs (LCC)

The reader can find the details about the methodology employed to obtain the costs involved in the development of a tidal energy project and the procedure used to calculate them in previous works [31,54] developed by our research group. The methodology proposed to determine all the costs incurred on a tidal energy farm is based on the life-cycle of tidal energy converters (TECs) and comprises six main stages (see Figure 4, which illustrates the stages of the LCC of a tidal energy farm together with an enumeration of the main structure of the different subscosts): (i) concept and definition costs ( C 1 ); (ii) design and development costs ( C 2 ); (iii) manufacturing costs ( C 3 ); (iv) installation costs ( C 4 ); (v) operation and maintenance costs ( C 5 ); and (vi) decommissioning costs ( C 6 ).
The costs of the previous stages establish the Life-Cycle-Cost of a tidal energy farm as follows:
L C C T E F = C 1 + C 2 + C 3 + C 4 + C 5 + C 6
Finally, in order to compute expression (2), we define the following:
C C A P E X = C 1 + C 2 + C 3 + C 4 + C 6
C O P E X = C 5

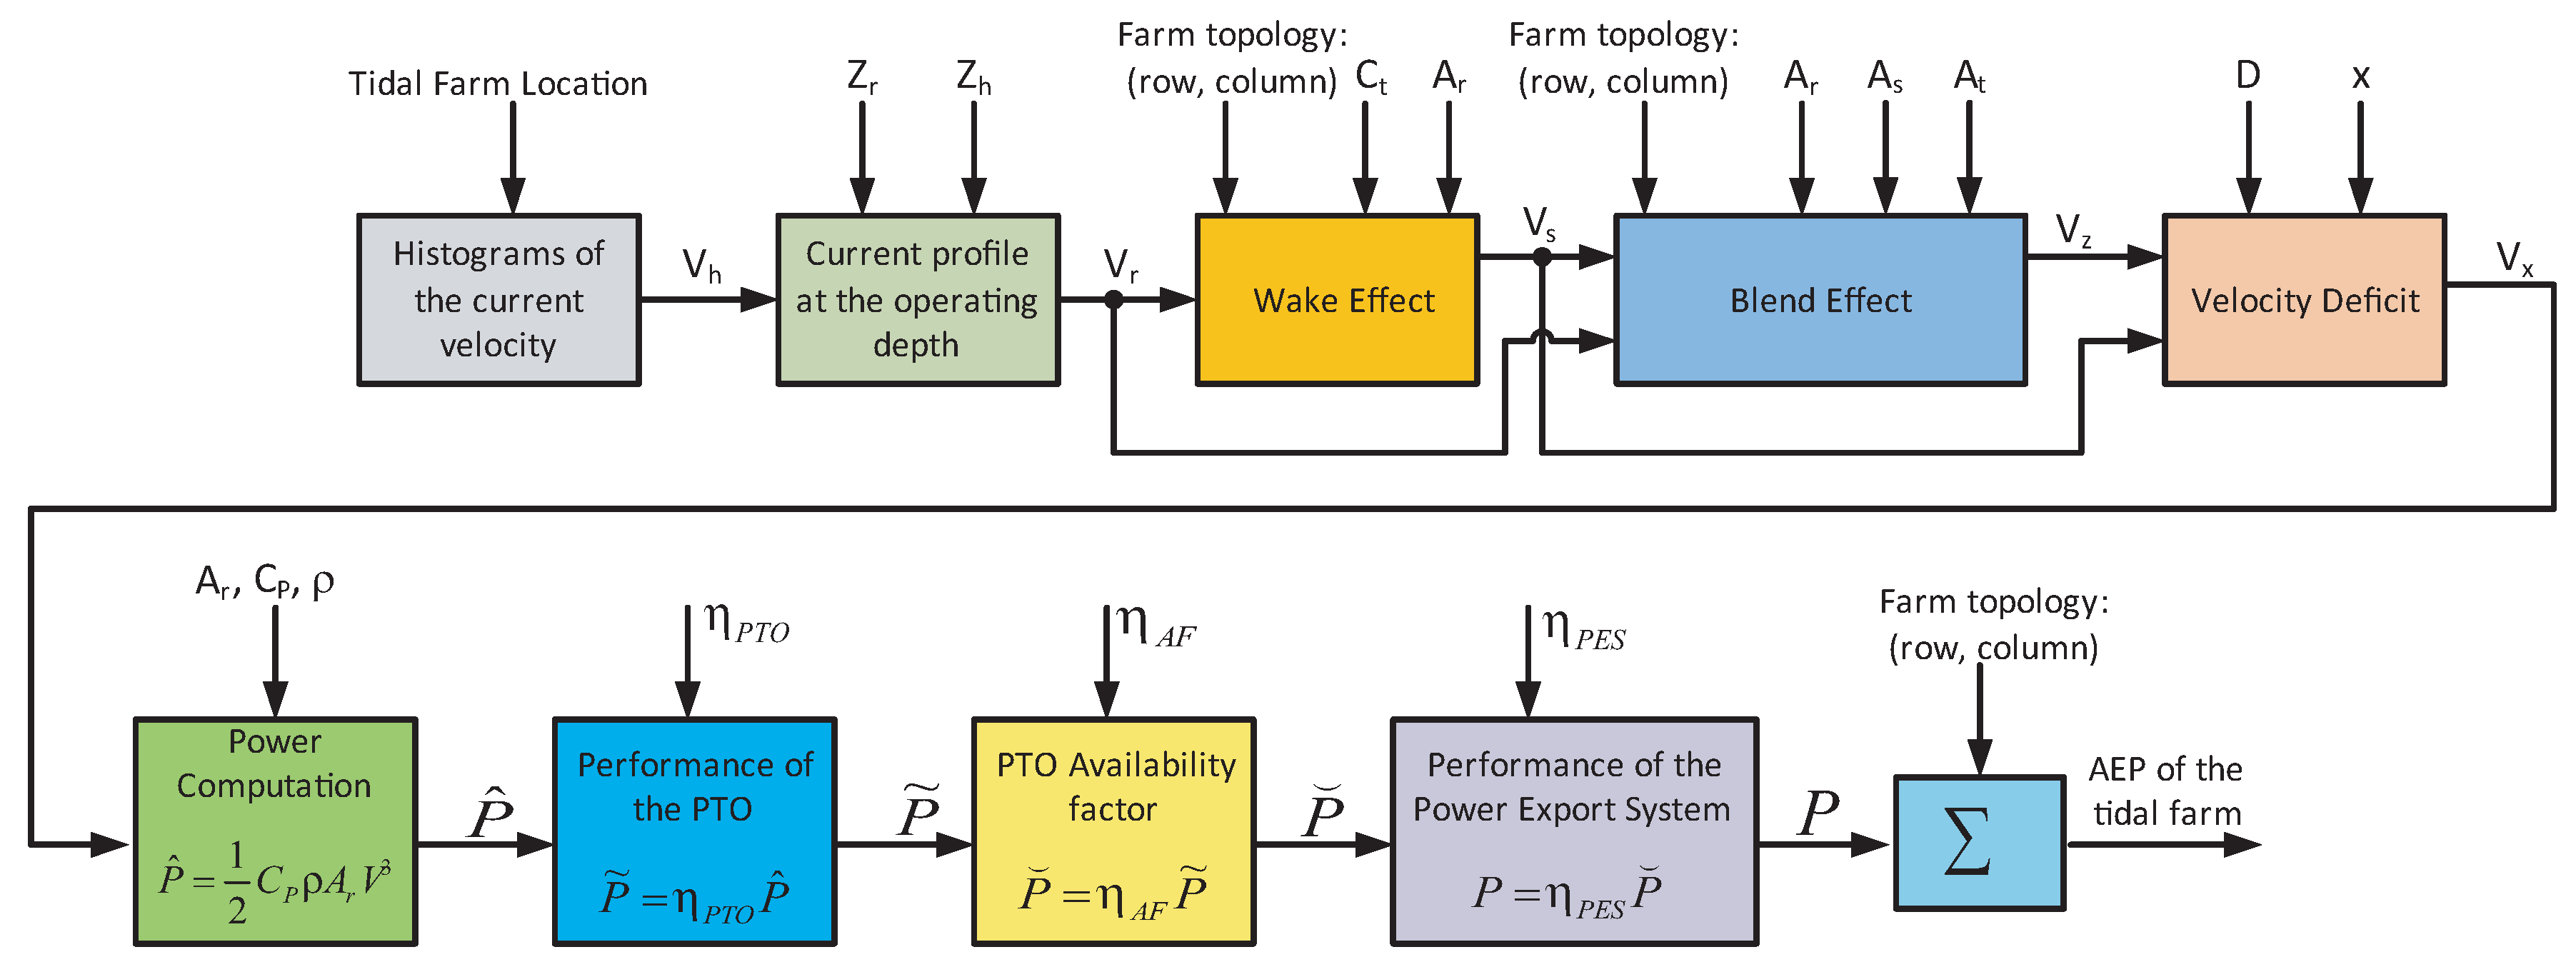
3.2. Annual Energy Production (AEP)

Expression (2) shows that the production of energy delivered by all the tidal energy converters of the farm is a fundamental factor in the determination of the viability of a tidal energy farm. This important indicator needs to be computed in an accurate manner in order to discover the possible commercialization of the tidal energy farm, because large differences between the real and the estimated values of the annual energy production could seriously compromise the feasibility of the project [55]. The AEP relies on the site and the current characteristics, the capacity of the TEC to be able to capture energy and its efficiency as regards converting and exporting the energy. The methodology applied to estimate the AEP for tidal energy farms is illustrated in Figure 5 and the following expressions permit the computation of the annual energy production for a tidal energy farm. For additional details, the reader is referred to previous works published by the GIT-ERM group [31]:
V r = V h · Z r Z h 1 7 a = 1 1 c t ; A s = 1 0 . 5 a 1 a · A r ; V s = ( 1 a ) · V r A s · V s 2 + A t A r · V r 2 = A t · V z 2 V x = V s V z · e 0 . 2 x D A E P = i = 1 N r o w j = 1 N c o l u m n P ( i , j ) ; where P ( i , j ) = 1 2 · C P · ρ · A r · V x 3 ( i , j ) · η P T O · η A F · η P E S A S = p E T · A E P
where V r symbolizes the velocity of the rotor, V h represents the velocity on the sea surface, Z r is the depth of the rotor, Z h denotes the water column depth, a is the axial induction factor, c t denotes the thrust coefficient, V r symbolizes the free stream velocity at the rotor depth, A r represents the surface of the rotor, V s is the flow velocity at the rotor of the turbine, A s denotes the output flow surface, A t represents the total frontal surface of the TEC, V z is the final velocity of the blended flow, D symbolizes the diameter of the rotor, (x, V x ) denotes an intermediate point located between the rotor output and the blend flow downstream, N r o w and N c o l u m n are, respectively, the number of rows and columns on the farm, C P represents the power coefficient, P ( i , j ) is the power of the TEC located in row i and column j on the farm, ρ denotes the fluid density, η P T O symbolizes the performance of the power take off (PTO), η A F represents the availability factor and, finally, η P E S is the performance of the power export system.

3.3. Annual Discount Rate

The annual discount rate, k, is used to determine the current currency value of money paid or received at some future time and reflects the risk of an investment: the annual discount rate is higher when the risk and uncertainty of future cashflows are greater. This signifies that the parameter in question alters according to the location, time period and circumstance being studied. This parameter is employed to discount both energy and costs, and LCOE estimates can be greatly affected by the discount rate [56]. The private sector has a tendency to employ high discount rates in order to maximize short-term profits, but these discount rates could be overly high as regards reflecting the advantages of the long-term social commitments made by the public sector, i.e., the energy projects and infrastructure [56]. Governments, meanwhile, frequently rate public projects that have long-term social benefits by means of a low social discount rate. In the case of LCOE assessments, the discount rates most frequently employed are 10–11% [57]. The annual discount rate can be determined by means of the following expression [58]:
k = 1 + k ^ 1 + i 1
where k ^ is the nominal annual discount rate and i represents the inflation rate.

4. Case Study

The case study concerns the Alderney Race, which is one of the Channel Island Races in the United Kingdom (UK) and is characterized by its excellent tidal energy resources [24]. In order to carry out a successful study of the situation of the tidal energy farm and the use that can be made of the Strait, an area will be defined in which the most favorable conditions for exploitation will be sought, considering a farm composed of first generation TECs and the corresponding requirements that this entails. The delimited area lies between the Island of Alderney and the Cape of La Hague (see Figure 6), west of France, located between the geographical coordinates (49 44 N–2 09 W, 49 44 N–1 57 W, 49 40 N–2 09 W, 49 40 N–1 57 W). The strait in that area has a width of about 13 km and a minimum depth of 17 m. In the area selected to locate the park, the depth will be 40 m. The total energy demand of the Island is currently around 1.5 MW, and this energy is obtained entirely from fossil fuels [37].
Please note that in order to determine the area occupied by the tidal energy farm, it is necessary to consider three main parameters:
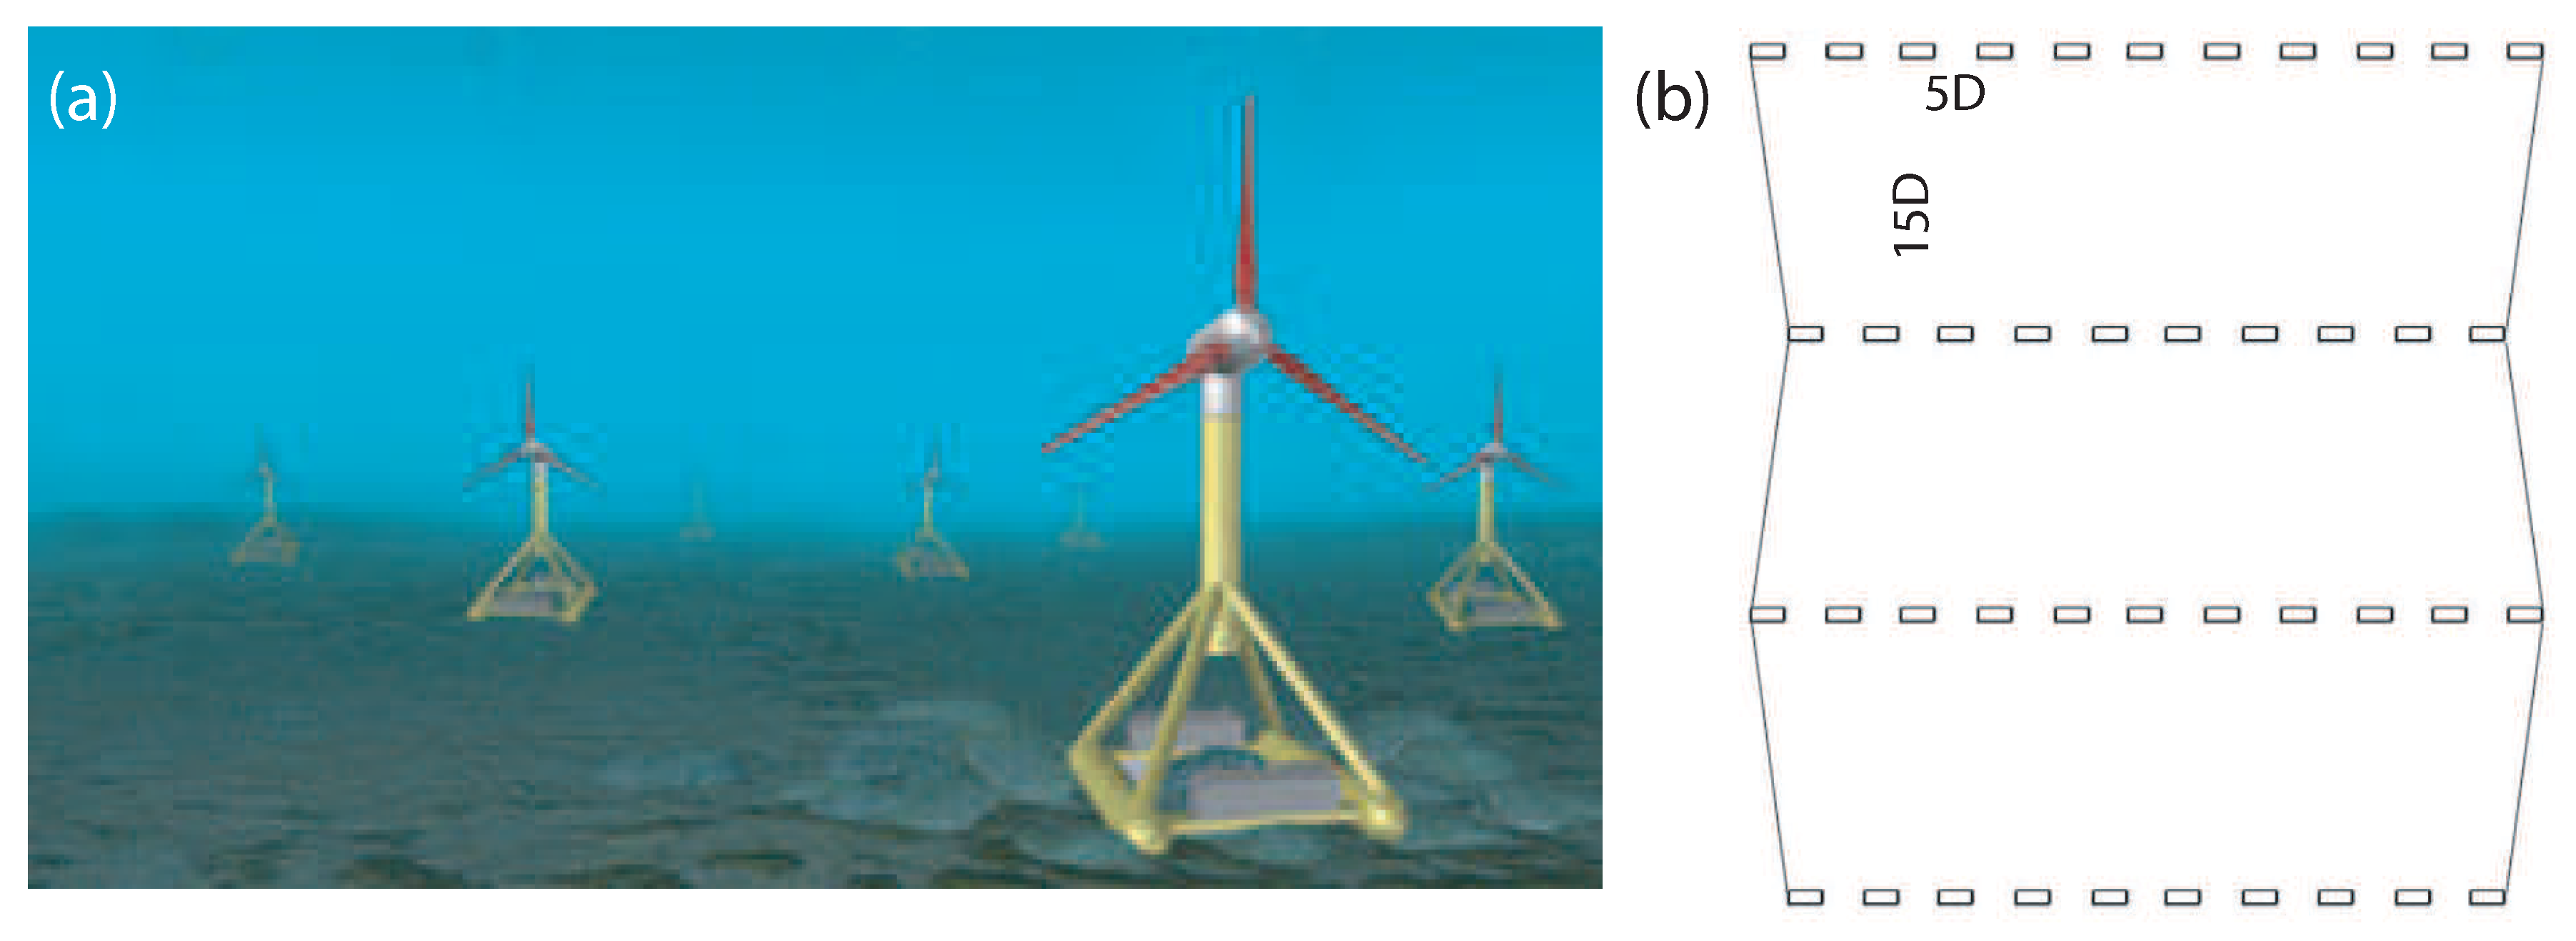
  • Depth of the area. This is probably the most obvious restriction. The blades of each turbine on the farm should take advantage of the high power density but also avoid large forces that may damage the rotor. Near the seabed, the speed of the current is low and should be avoided so as not to generate cyclic loads on the blades. A value of 25% of the depth is recommended for the space below the lowest point swept by the rotor [59]. The upper part of the water column is also unstable because surface waves can distort the flow and generate turbulence, which is why a minimum space of 5 meters must be left above the highest point swept by the rotor.
  • Width of the farm. It is necessary to take this into account for the shadow effect that can be generated between laterally spaced turbines. A value of 2.5 diameters of spacing between devices [59] is recommended, but a conservative value of 5 diameters between rotors will be taken in order to rule out any excessive effect on the wakes. This separation allows the flow passage between turbines to be achieved, and the fluid mixture is favored.
  • Length of the farm. For the same reason as in the previous case, the definition of the length of the farm is important to estimate the loss of the velocity of the flow as each row passes. According to [59], a value of 10 diameters between rows would be sufficient to avoid an excessive reduction in speed. After making some calculations based on the model presented in [60], it was decided that a more conservative value of 15 diameters between rows would be taken for this project, which would result in a higher utilization factor.
Taking these considerations into account, a tidal energy farm configuration consisting of 42 tidal energy converters of 1.2 MW has been determined, each of which will have an open rotor configuration with their axes parallel to the flow and a pitch controllable blade system. The tidal energy farm will consist of 4 rows with 11, 10, 11 and 10 generators in each one. A reduced number of rows was sought so as not to obtain a low coefficient for the shadow effect in the last rows that would make it impossible to obtain the power required in their devices. Figure 7 show a general view, together with the dimensions of the proposed tidal energy farm.
The life-cycle of the project is considered to be 20 years and the base port selected is that of Cherburg (France), which was chosen for its operative qualities and is located 39 km from the TEF. With regard to the computation of the AEP, note that the histograms of the current velocity on the sea surface at the tidal farm location have been created by means of references [61,62,63] and will provide important information about the estimation of the energy produced by each of the devices. The tidal farm location is characterized by the presence of currents in two directions (northeast and southwest). Figure 8 illustrates the histograms of the velocities of the current in these directions, where the northeastern direction reaches higher velocities, thus implying a higher energy production in this direction. Bearing in mind that the TECs which comprise the tidal energy farm have a pitch controllable blade system, the histogram used in the case study will be achieved by employing the sum of the hours at which a specific speed is obtained, regardless of the direction of the current. This assumption does not imply any change in the value of the AEP, but is at the exact moment at which it is obtained. As the study focuses on obtaining the total value of the AEP, this simplification is acceptable. Finally, the AEP obtained for the TECs in each of the four rows of which the tidal energy farm is composed is illustrated in Figure 9, in which the following physical parameters have been used in order to estimate the AEP of the tidal energy farm: Z r = 20 m, Z h = 40 m, C t = 0.716 , A s = 452 m 2 , A r = 314 m 2 , A t = 4000 m 2 (a separation between devices of 100 m and a total depth of 40 m), D = 20 m, x = 30 m, C P = 0.45 , ρ = 1025 kg/m 3 , η P T O = 0.39 , η A F = 0.97 and η P E S = 0.946 . Furthermore, in order to complete the model, the following assumptions have been considered for the case study: (i) a value of 2% has been considered for the rate of inflation (typical values oscillate within the range between 1% and and 3%) and; (ii) all the costs increase by 1.5% each year. Finally, please note that the decommissioning costs for TEFs imply a particular difficulty at present owing to, among other things, the weather windows, the characteristics and uncertainty of offshore operations and the volatility of the vessels employed in operations of this nature. Moreover, accurate information with which to quantify the costs of TEFs is currently non-existant, since non have, as yet been dismantled. The aforementioned uncertainties and considerations consequently led us to make the decision that the dismantling costs would not be included in the case study.

5. Results

Having presented the main parameters of the tidal energy farm and the installation and maintenance procedures (with the manual and automated options), it is necessary to state that this technical proposal must be supported by a feasibility study that justifies its commercial applicability, and which is shown below. The viability of the project using manual and automated maneuvers is analyzed using the levelized cost of energy and the costs in order to determine the global competitiveness of this generation technology. This is dealt with in the following subsections.

5.1. Results for First Generation TECs with Manual Maneuvers

The LCC obtained for the case study is summarized in Table 1. Furthermore, Figure 10 and Figure 11 depict the percentage distribution of the CAPEX and OPEX for this project, which is highly illustrative as regards showing the offshore situation of the proposed tidal energy project (the most important cost components of the CAPEX correspond to the manufacturing and installation concepts, while the most important cost components of the OPEX coincide with transport and insurance and fixed expenses). Furthermore, upon analyzing the manufacturing results obtained for the tidal energy farm, which are shown in Figure 12, it will be observed that the highest costs coincide with the most important components within the energy conversion system. The steel used to manufacture the gondola also makes a significant contribution to the total costs.
Figure 13 illustrates different LCOE values depending on the value of the annual discount rate k. The greater the values of the parameter k, the greater the risks and the uncertainties of the project. It will be observed that, in the case of a tidal energy project in a non-commercial stage and, therefore, with higher risks and uncertainties (high values of the k parameter), the value obtained for the LCOE indicator is close to 0.15 €/kWh. In particular, a value of 0.152 €/kWh for k = 11 % is obtained, which is quite an acceptable value for this type of project. In fact, in the case of the current generation of devices that harness energy from the ocean currents, values of between 0.10 €/kWh and 0.20 €/kWh for the LCOE, with core values of between 0.12 €/kWh and 0.15 €/kWh, are predicted [64]. Note that, as occurred with wind energy, there is a high margin for improvement if the installed capacity is increased and more efficient technical advances are made and exploitation procedures produced [32,65,66]. It is expected that when the installed capacity increases to 1 GW, the LCOE will have values of around 0.09 €/kWh (by that time, the risks and the uncertainties of the project will have been substantially reduced, moving to the smaller k values), thus making it possible to obtain cost values similar to those of the traditional renewable energy sources, whose values are between 0.05 €/kWh and 0.10 €/kWh [64]. Finally, the results obtained by means of this technical indicator, and by considering the commercialization of the tidal energy project, allow us to conclude that the proposed tidal energy project is technically feasible.

5.2. Results for First Generation TECs with Automated Maneuvers

Having determined that the case study with manual maneuvers is technically feasible, in this subsection we carry out a case study with automated maneuvers as a possible option by which to decrease the LCOE value and the costs, and consequently increase the viability of this sort of projects. In this case, the LCC obtained for the case study is summarized in Table 2. Figure 14, meanwhile, illustrates the percentage distribution of the CAPEX. It should be noted that the most important cost components of the CAPEX correspond to the manufacturing and installation concepts, but the percentage of installation costs has been reduced as a result of the use of automated maneuvers. Figure 15 shows the percentage distribution of the OPEX for this project, in which it will be observed that there is a meaningful reduction in percentages as regards the transport costs owing to the use of automated maneuvers. Furthermore, Figure 16 depicts the manufacturing results obtained for the tidal energy farm in which it will be noted that the highest costs correspond to the most important components in the energy conversion system and the manufacturing process of the gondola. A more in-depth comparison of the case study with manual and automated maneuvers, taking into consideration all these cost structures, will be performed in Section 5.3.
Finally, Figure 17 illustrates different LCOE values depending on the value of the annual discount rate k. The results obtained by means of this technical indicator, and by considering the commercialization of the tidal energy project, enabled us to conclude that the proposed tidal energy project is also technically feasible. In the case of using automated maneuvers, the value obtained for the LCOE indicator is 0.144 €/kWh for k = 11 % , which is a substantial improvement when compared to the use of manual maneuvers.

5.3. Comparative Analysis

If a comparative analysis of the results obtained in Section 5.1 and Section 5.2 is carried out, the following is obtained:
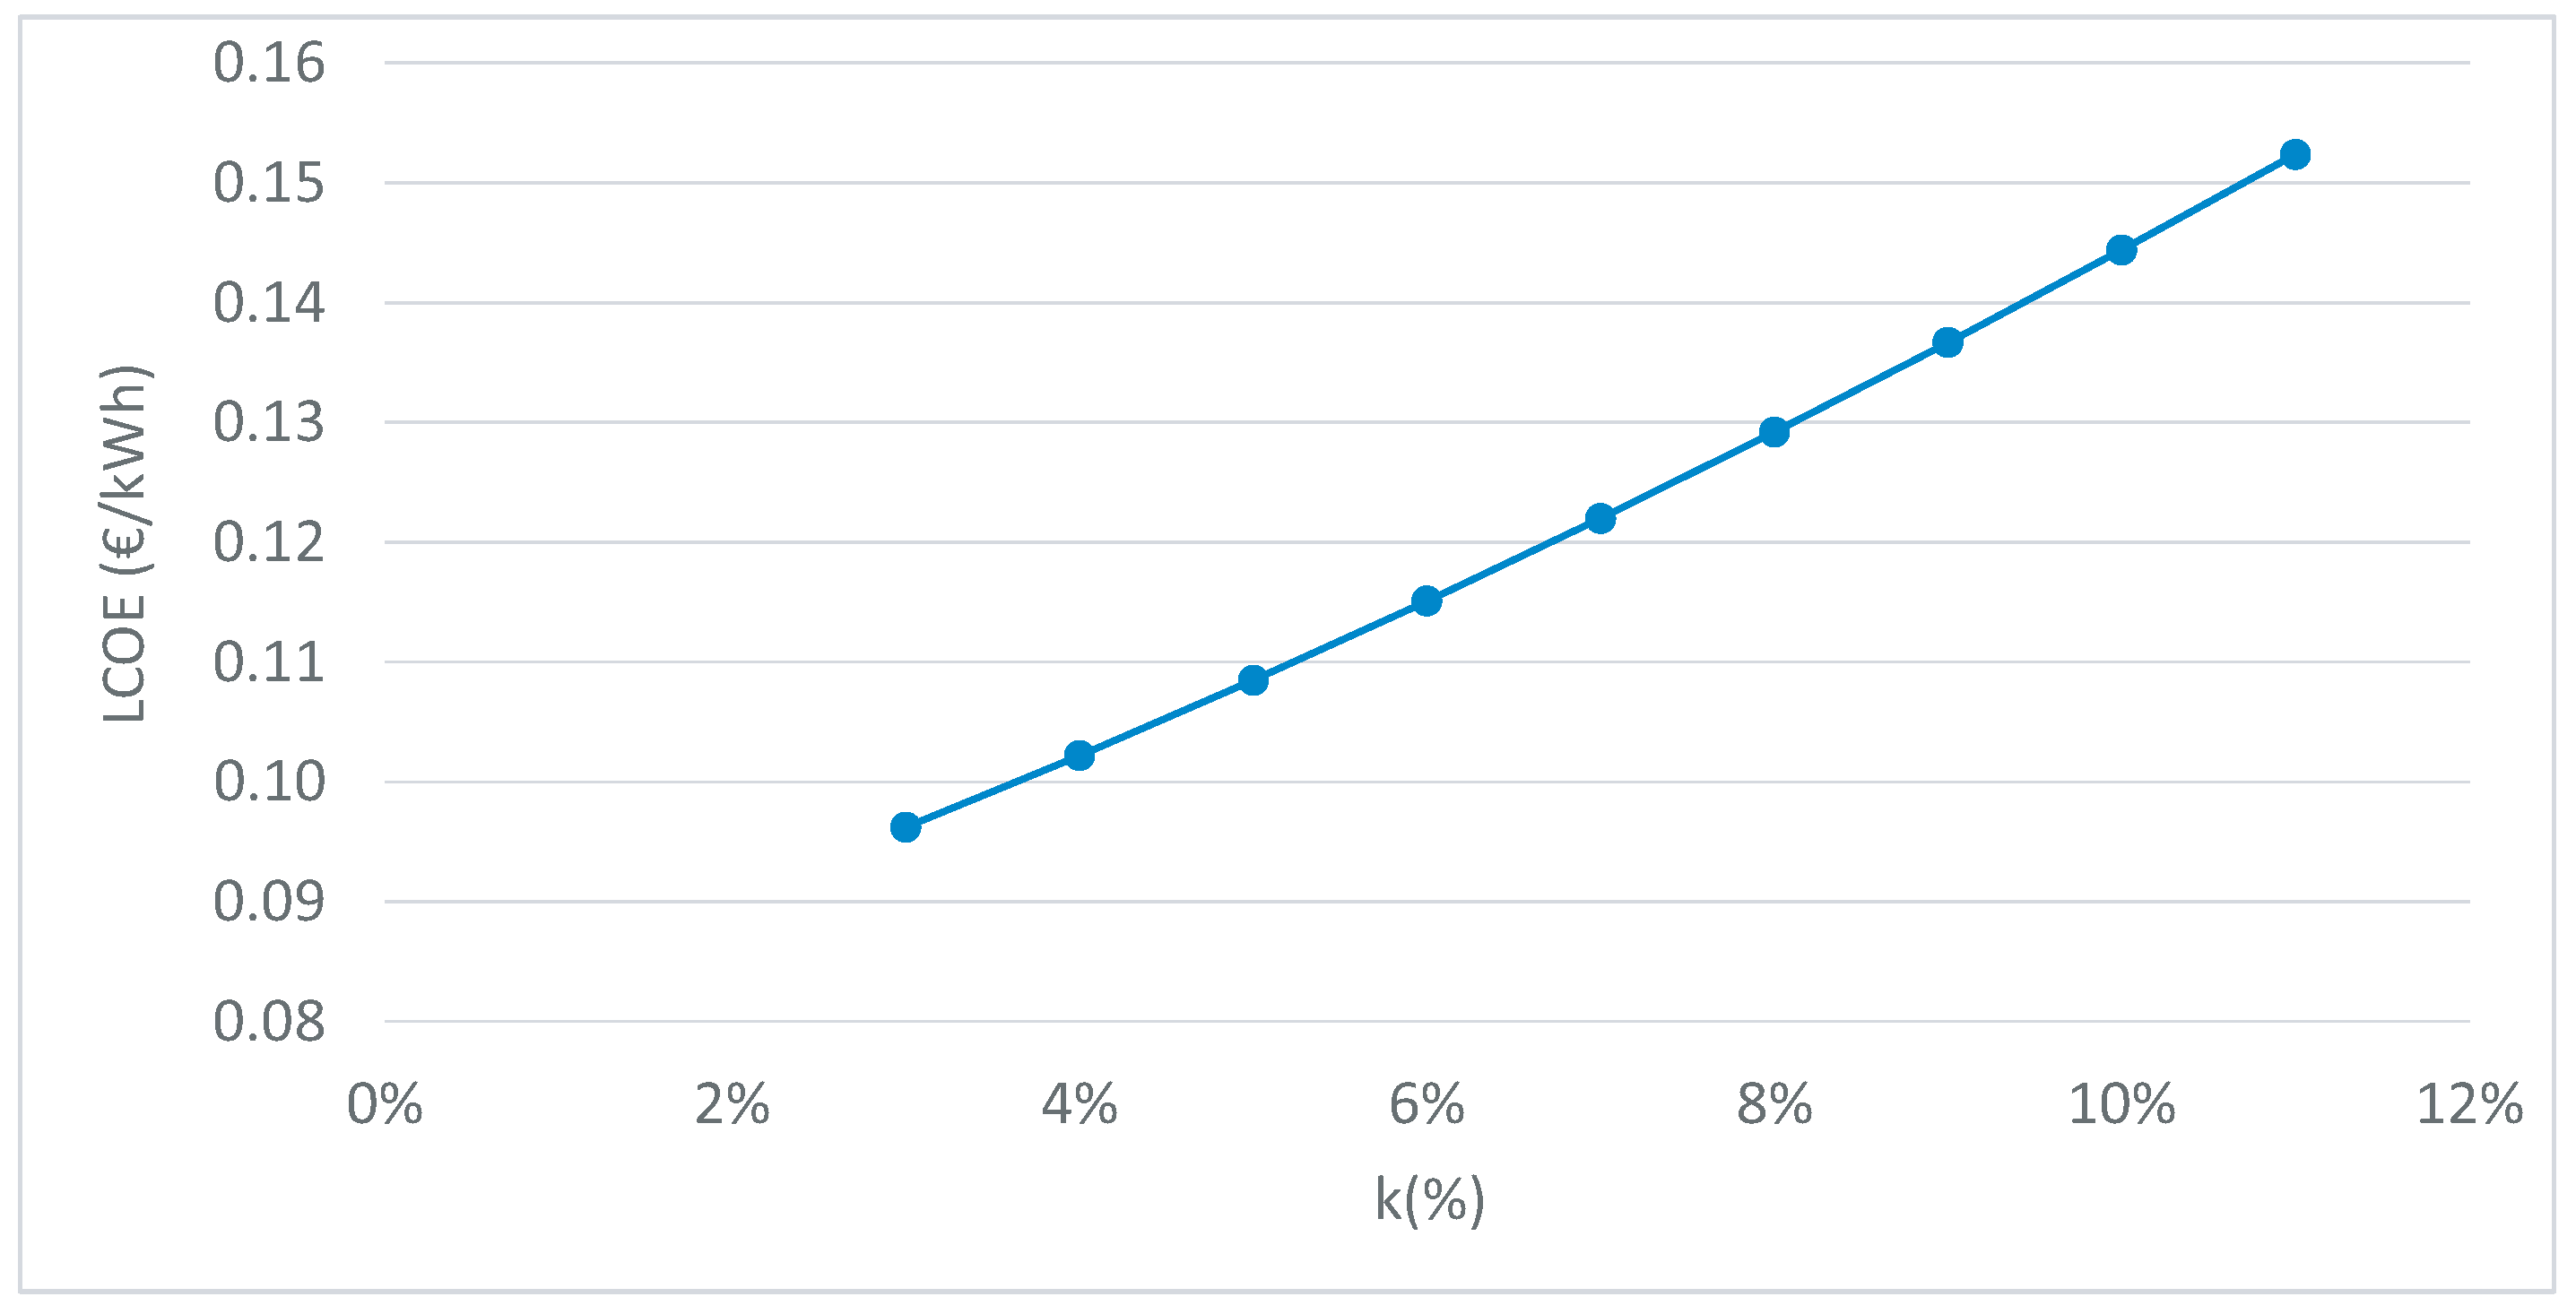
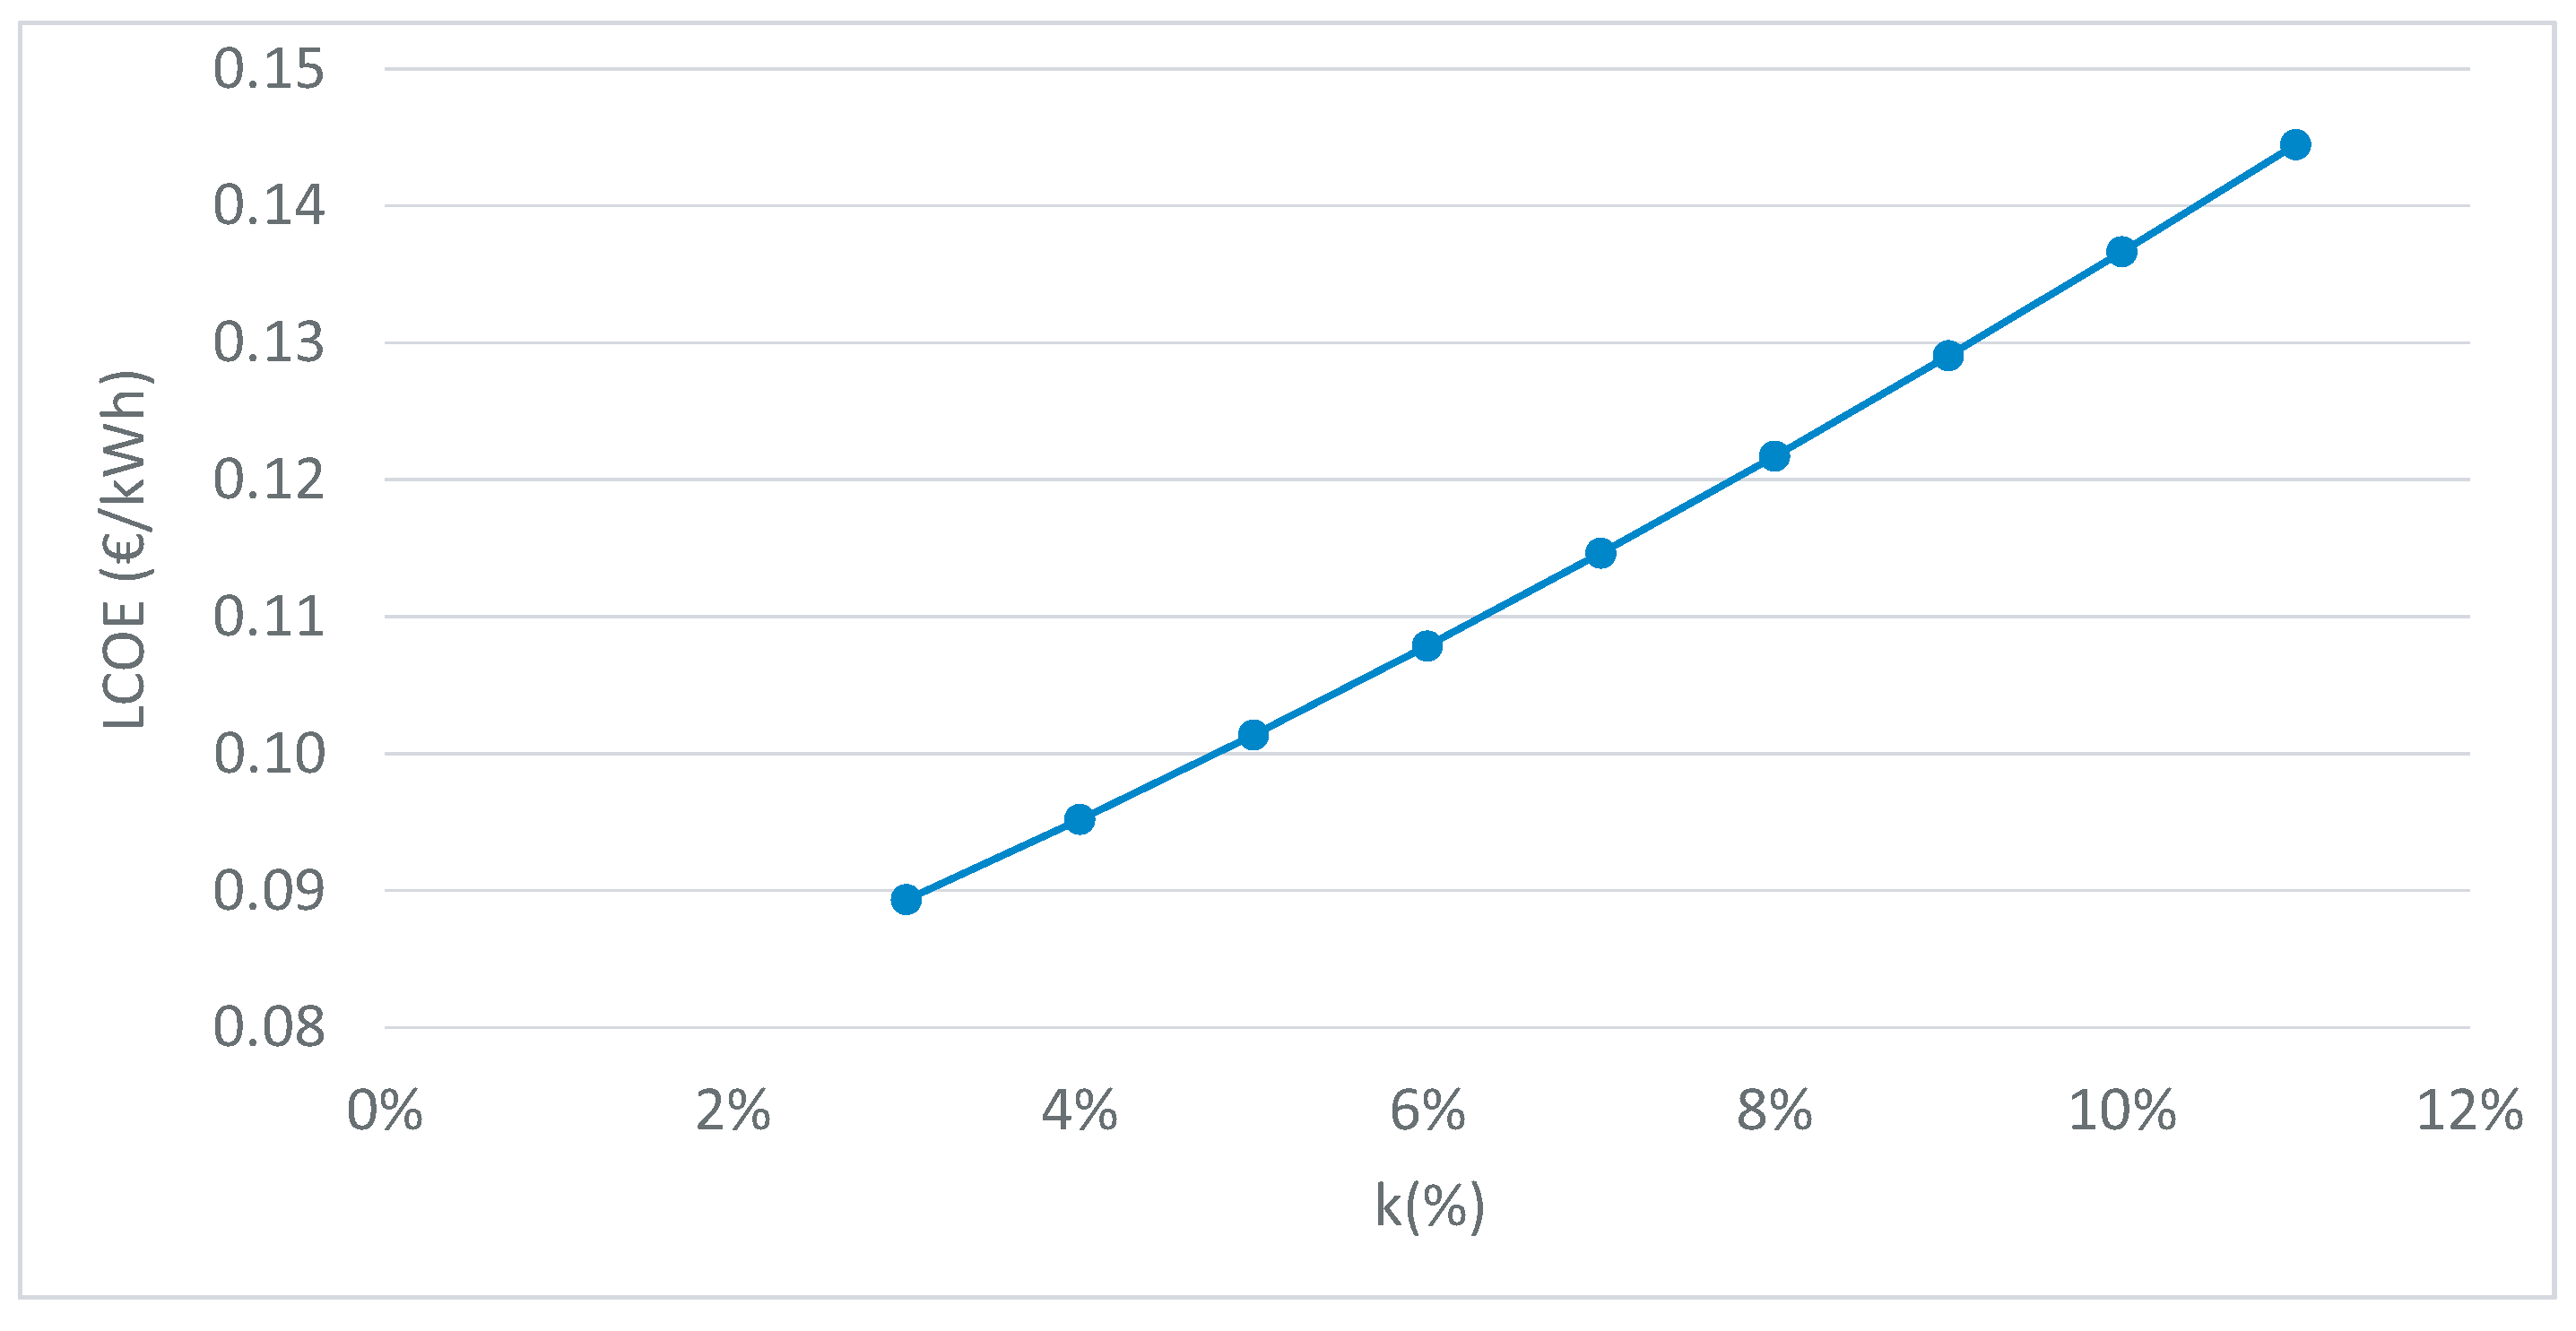
  • With regard to the LCOE, it will be observed that the LCOE values for manual maneuvers are higher than the LCOE values for automated maneuvers for all the case studies. For example, in the particular case of k = 11 % (which is an appropriate estimation of the LCOE of these technologies, bearing in mind the risks and the uncertainties of the project), the LCOE value for manual maneuvers is 0.152 €/kWh, while the LCOE value for automated maneuvers is 0.144 €/kWh. This implies a decrease of 5.26% in the LCOE, which is a meaningful descent that should, meanwhile, be taken into consideration in the investment and the return on it.
  • Figure 10, Figure 12, Figure 14 and Figure 16, meanwhile, show the comparative results for the CAPEX costs of the tidal energy farm in the case of manual and automated maneuvers in the nominal case. The following results were obtained from these figures:
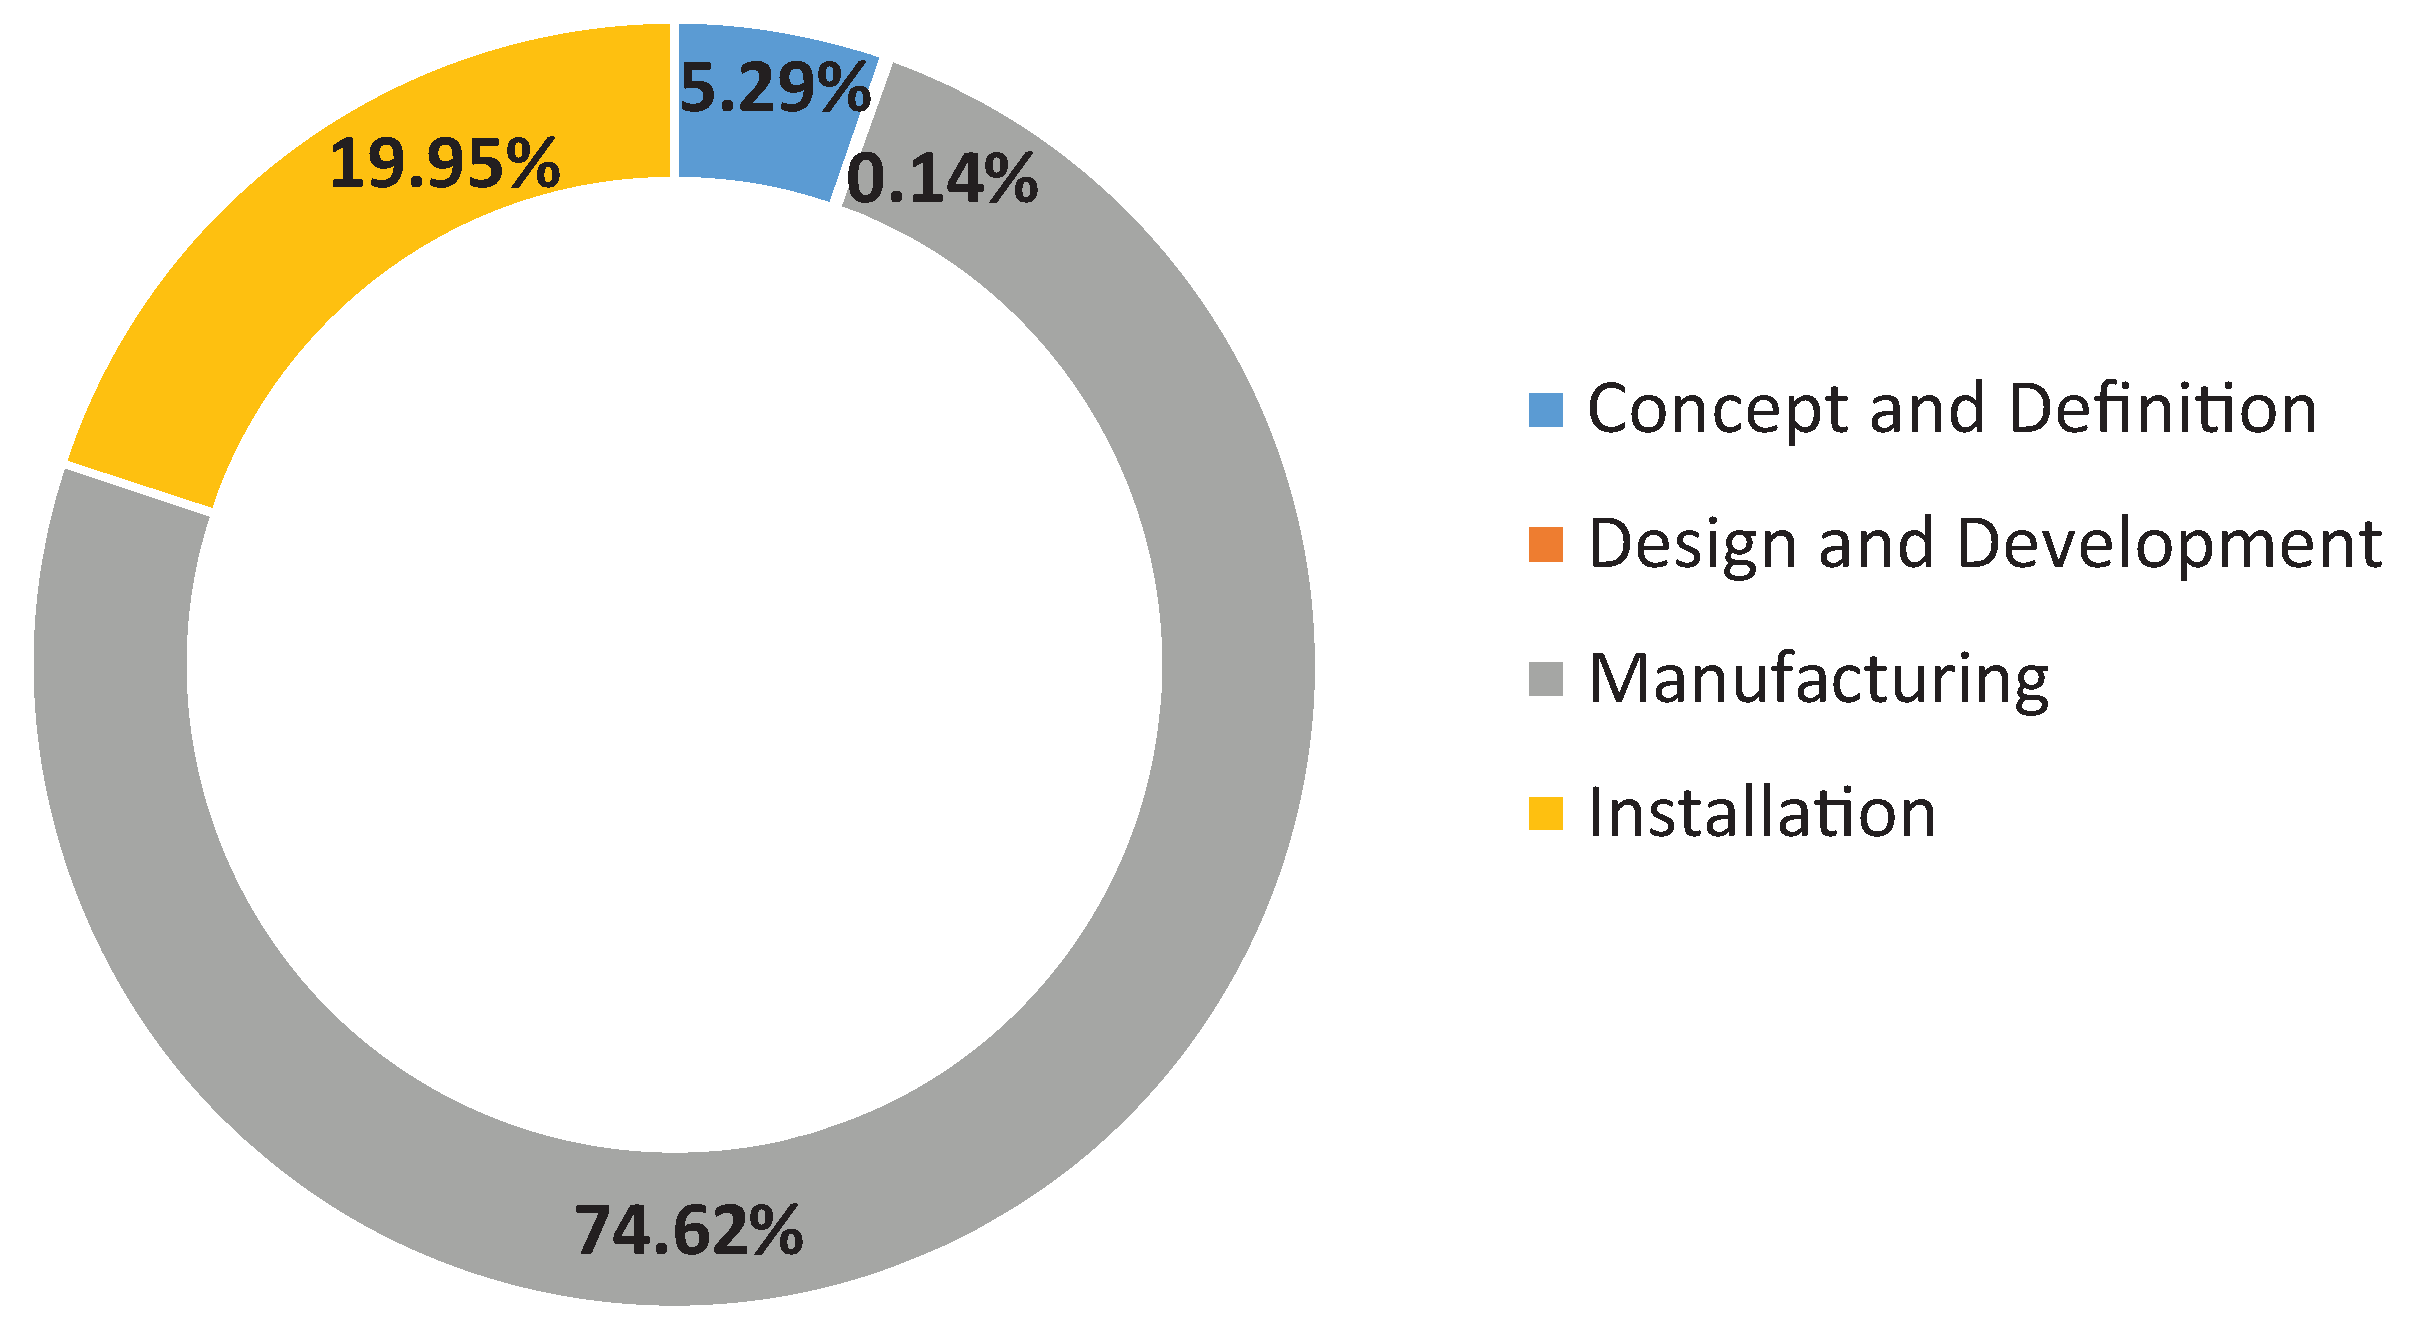
    The concept and definition and design and development costs are higher when the devices perform automated maneuvers. This is owing to the additional technical requirements which need to be included in the design of the device if it is to be able to perform maneuvers in an automated manner. The difference between their costs is 3.97%.
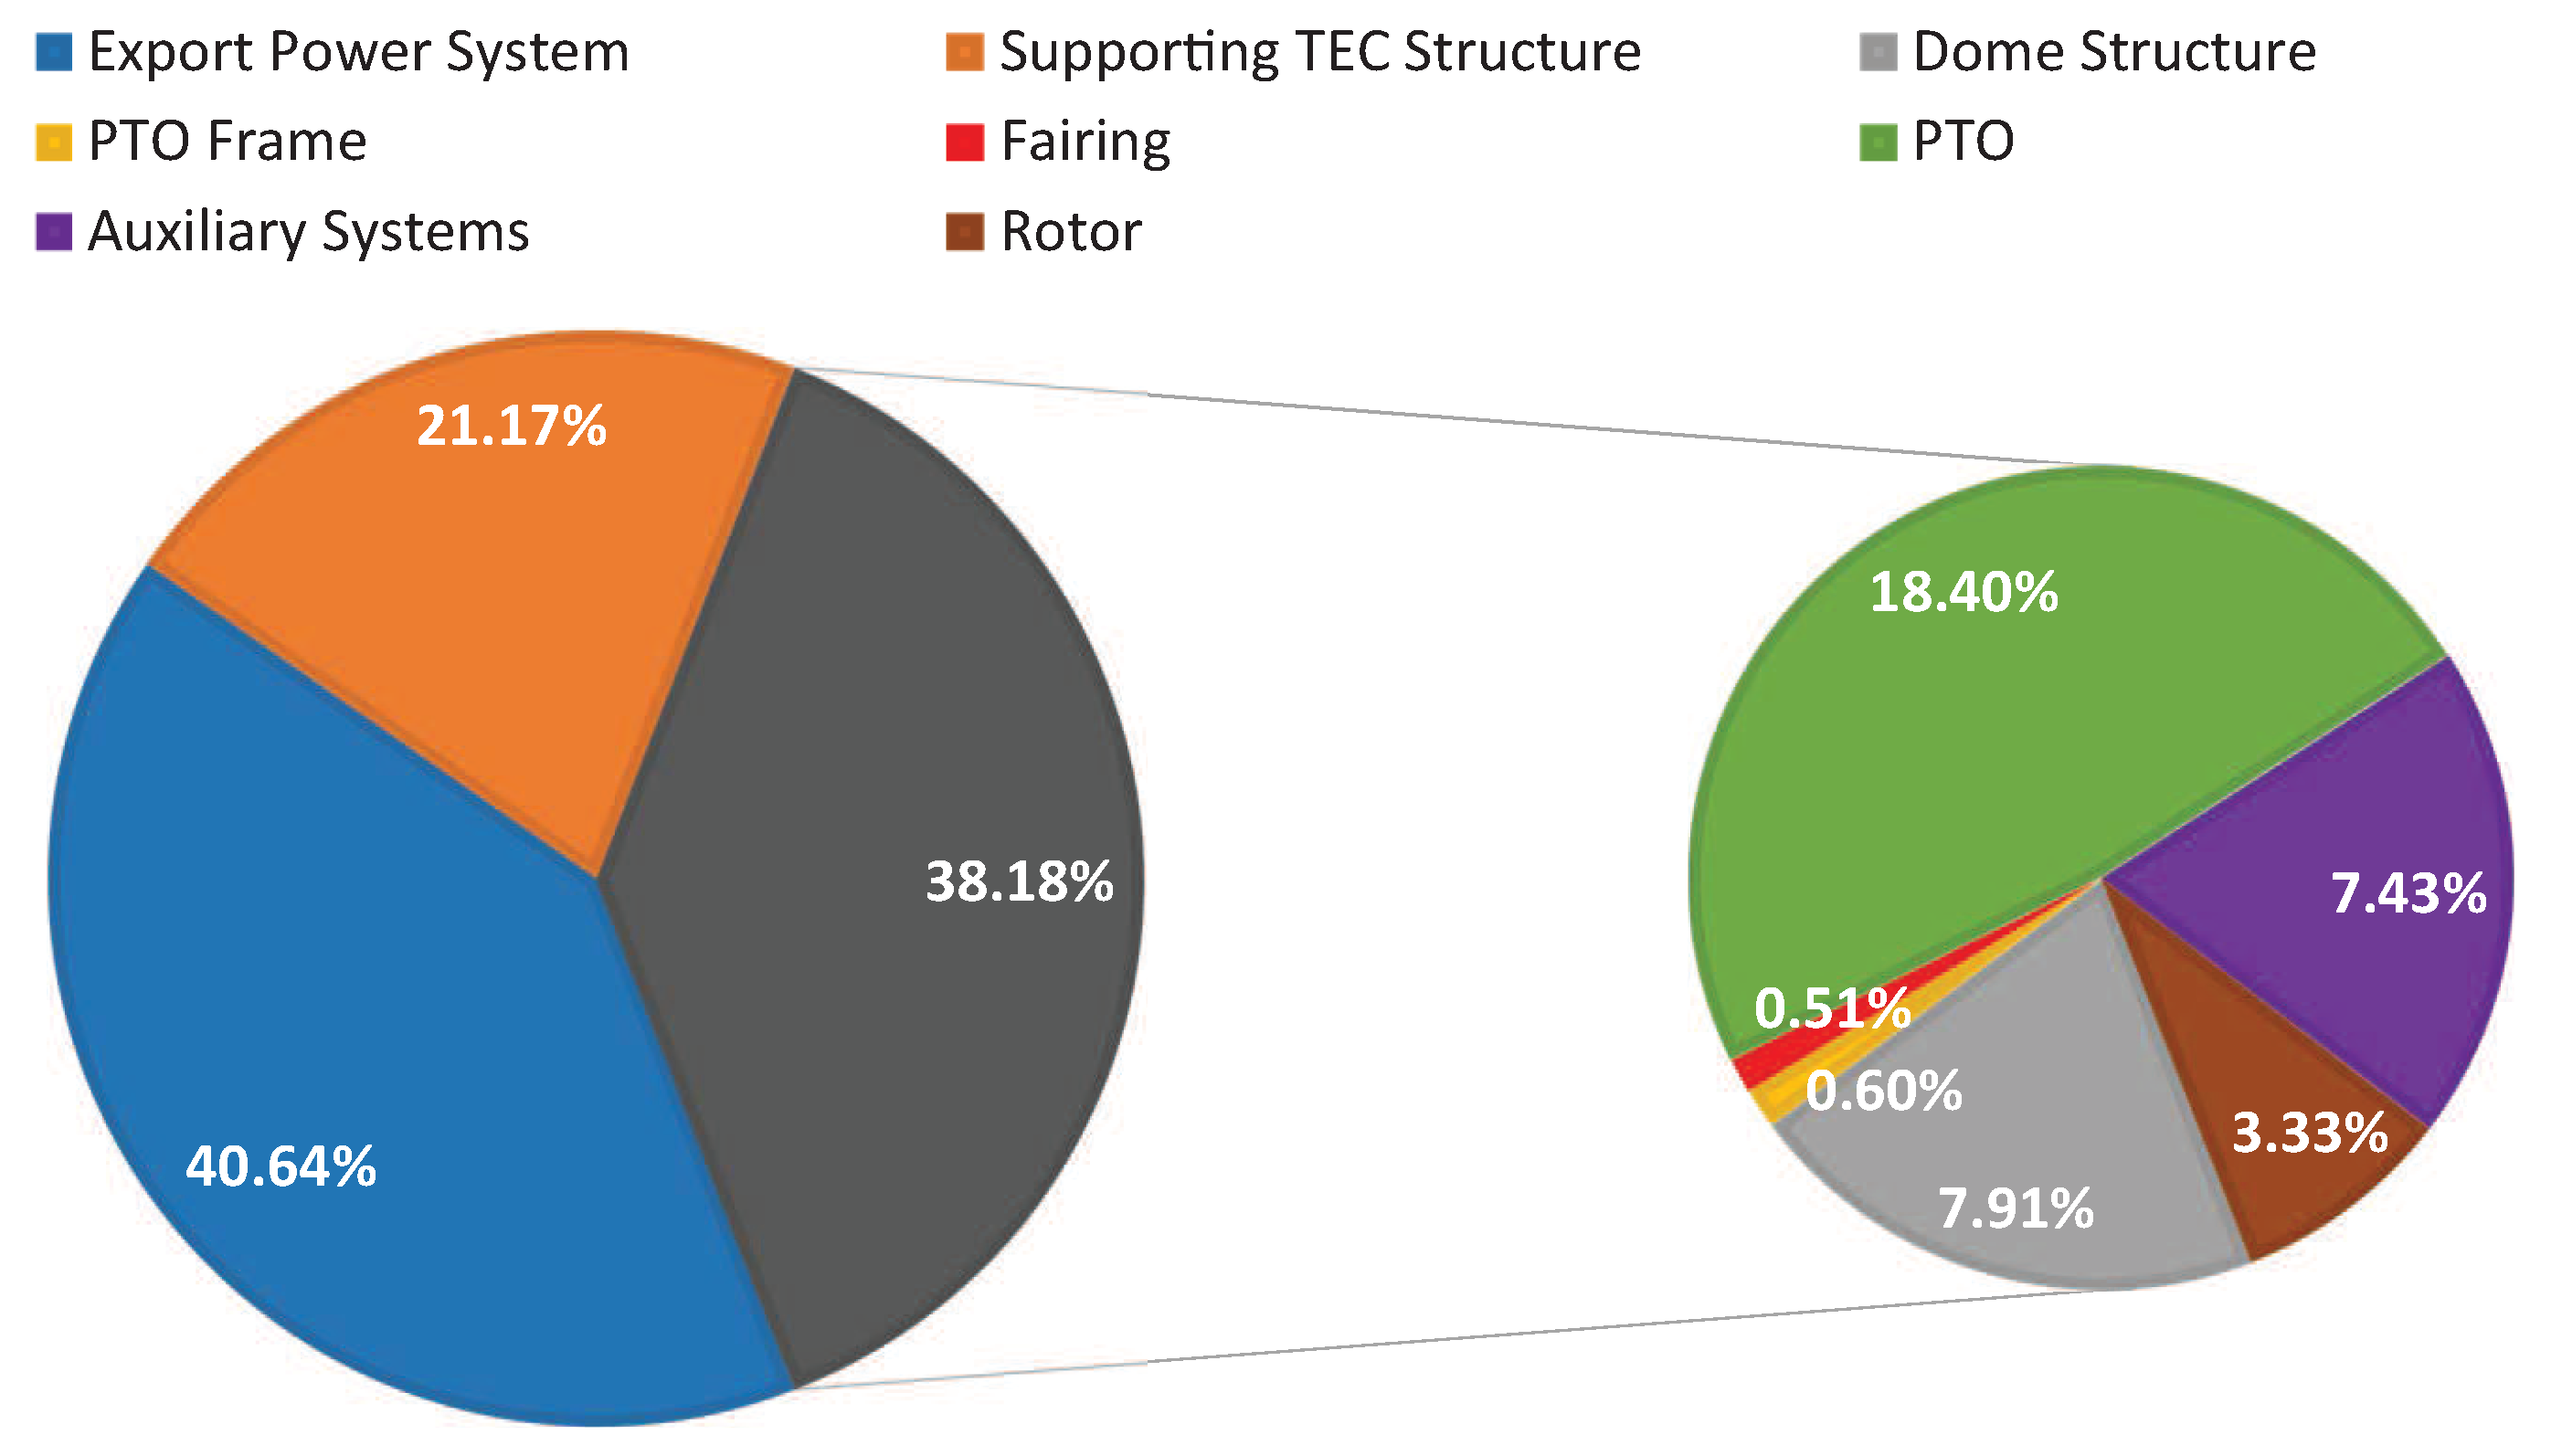
    The costs of the PTO and the auxiliar systems are higher in the case of the use of devices with automated maneuvers. This result was foreseeable, since, although both devices have the same PTO systems (generator, gearbox, etc.), the length of the axes of those devices that allow automated maneuvers to be performed is greater than in the case of devices designed to perform manual maneuvers. The difference between their costs is 4.78%.
    The costs of the structure of the gondola and fairing are, as in the previous case, higher in the case of the devices which perform automated maneuvers, owing to the fact that the length of the gondola has been elongated and the material required to manufacture its main structure has consequently increased. The difference between the cost of a tidal energy farm composed of devices that perform automated maneuvers and of devices that perform manual maneuvers is 4.69%.
    The costs of the structure support and moorings. As the devices which perform manual and automated maneuvers have the same structure support (gravity) and the same characteristics, these costs are the same for both technologies.
    The cost of installing the device in the case of devices that perform automated maneuvers is much lower than that of the devices which perform manual maneuvers, because the most important factor in this cost structure is the cost of renting the vessels required to perform the installation procedures, and when using more complex and expensive vessels in the case of devices which perform manual maneuvers, this item becomes more expensive for this technology. The difference in costs between the two technologies is approximately 9.12%.
    The costs of the transformation platform and converters are the same for both technologies because they require the same technologies and equipment.
    The costs of the export power system. As the technology and equipment that are necessary, are similar for both technologies, the costs of this item are the same.
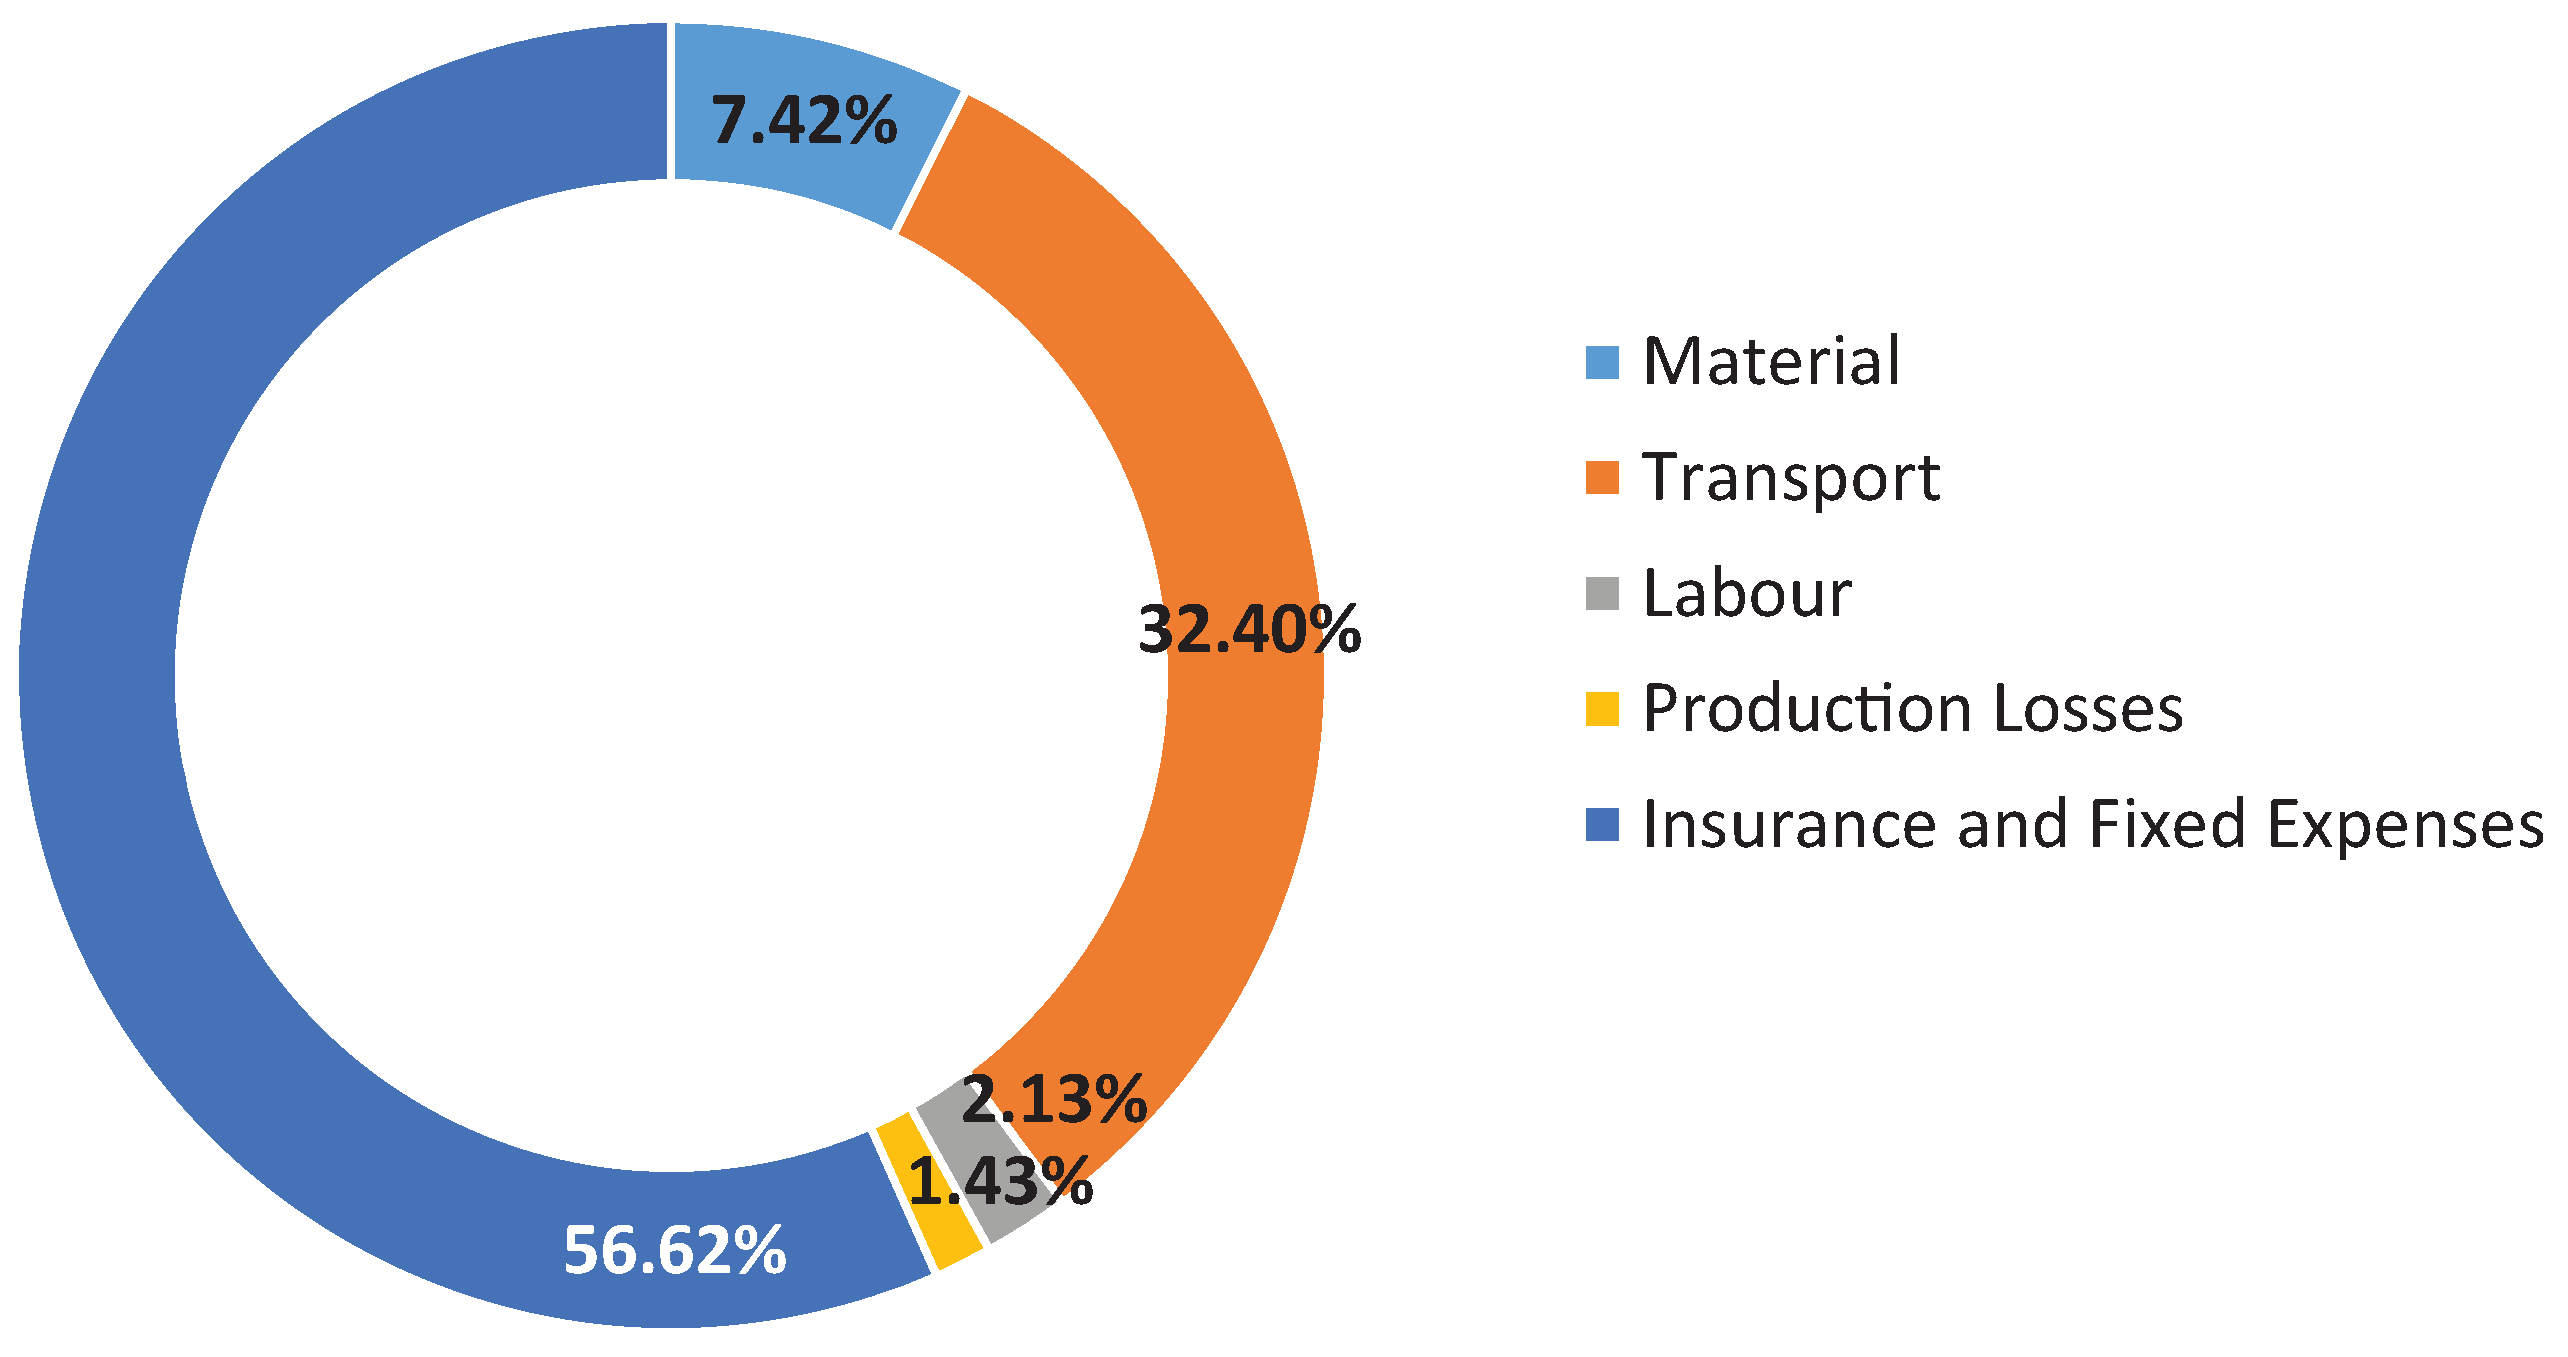
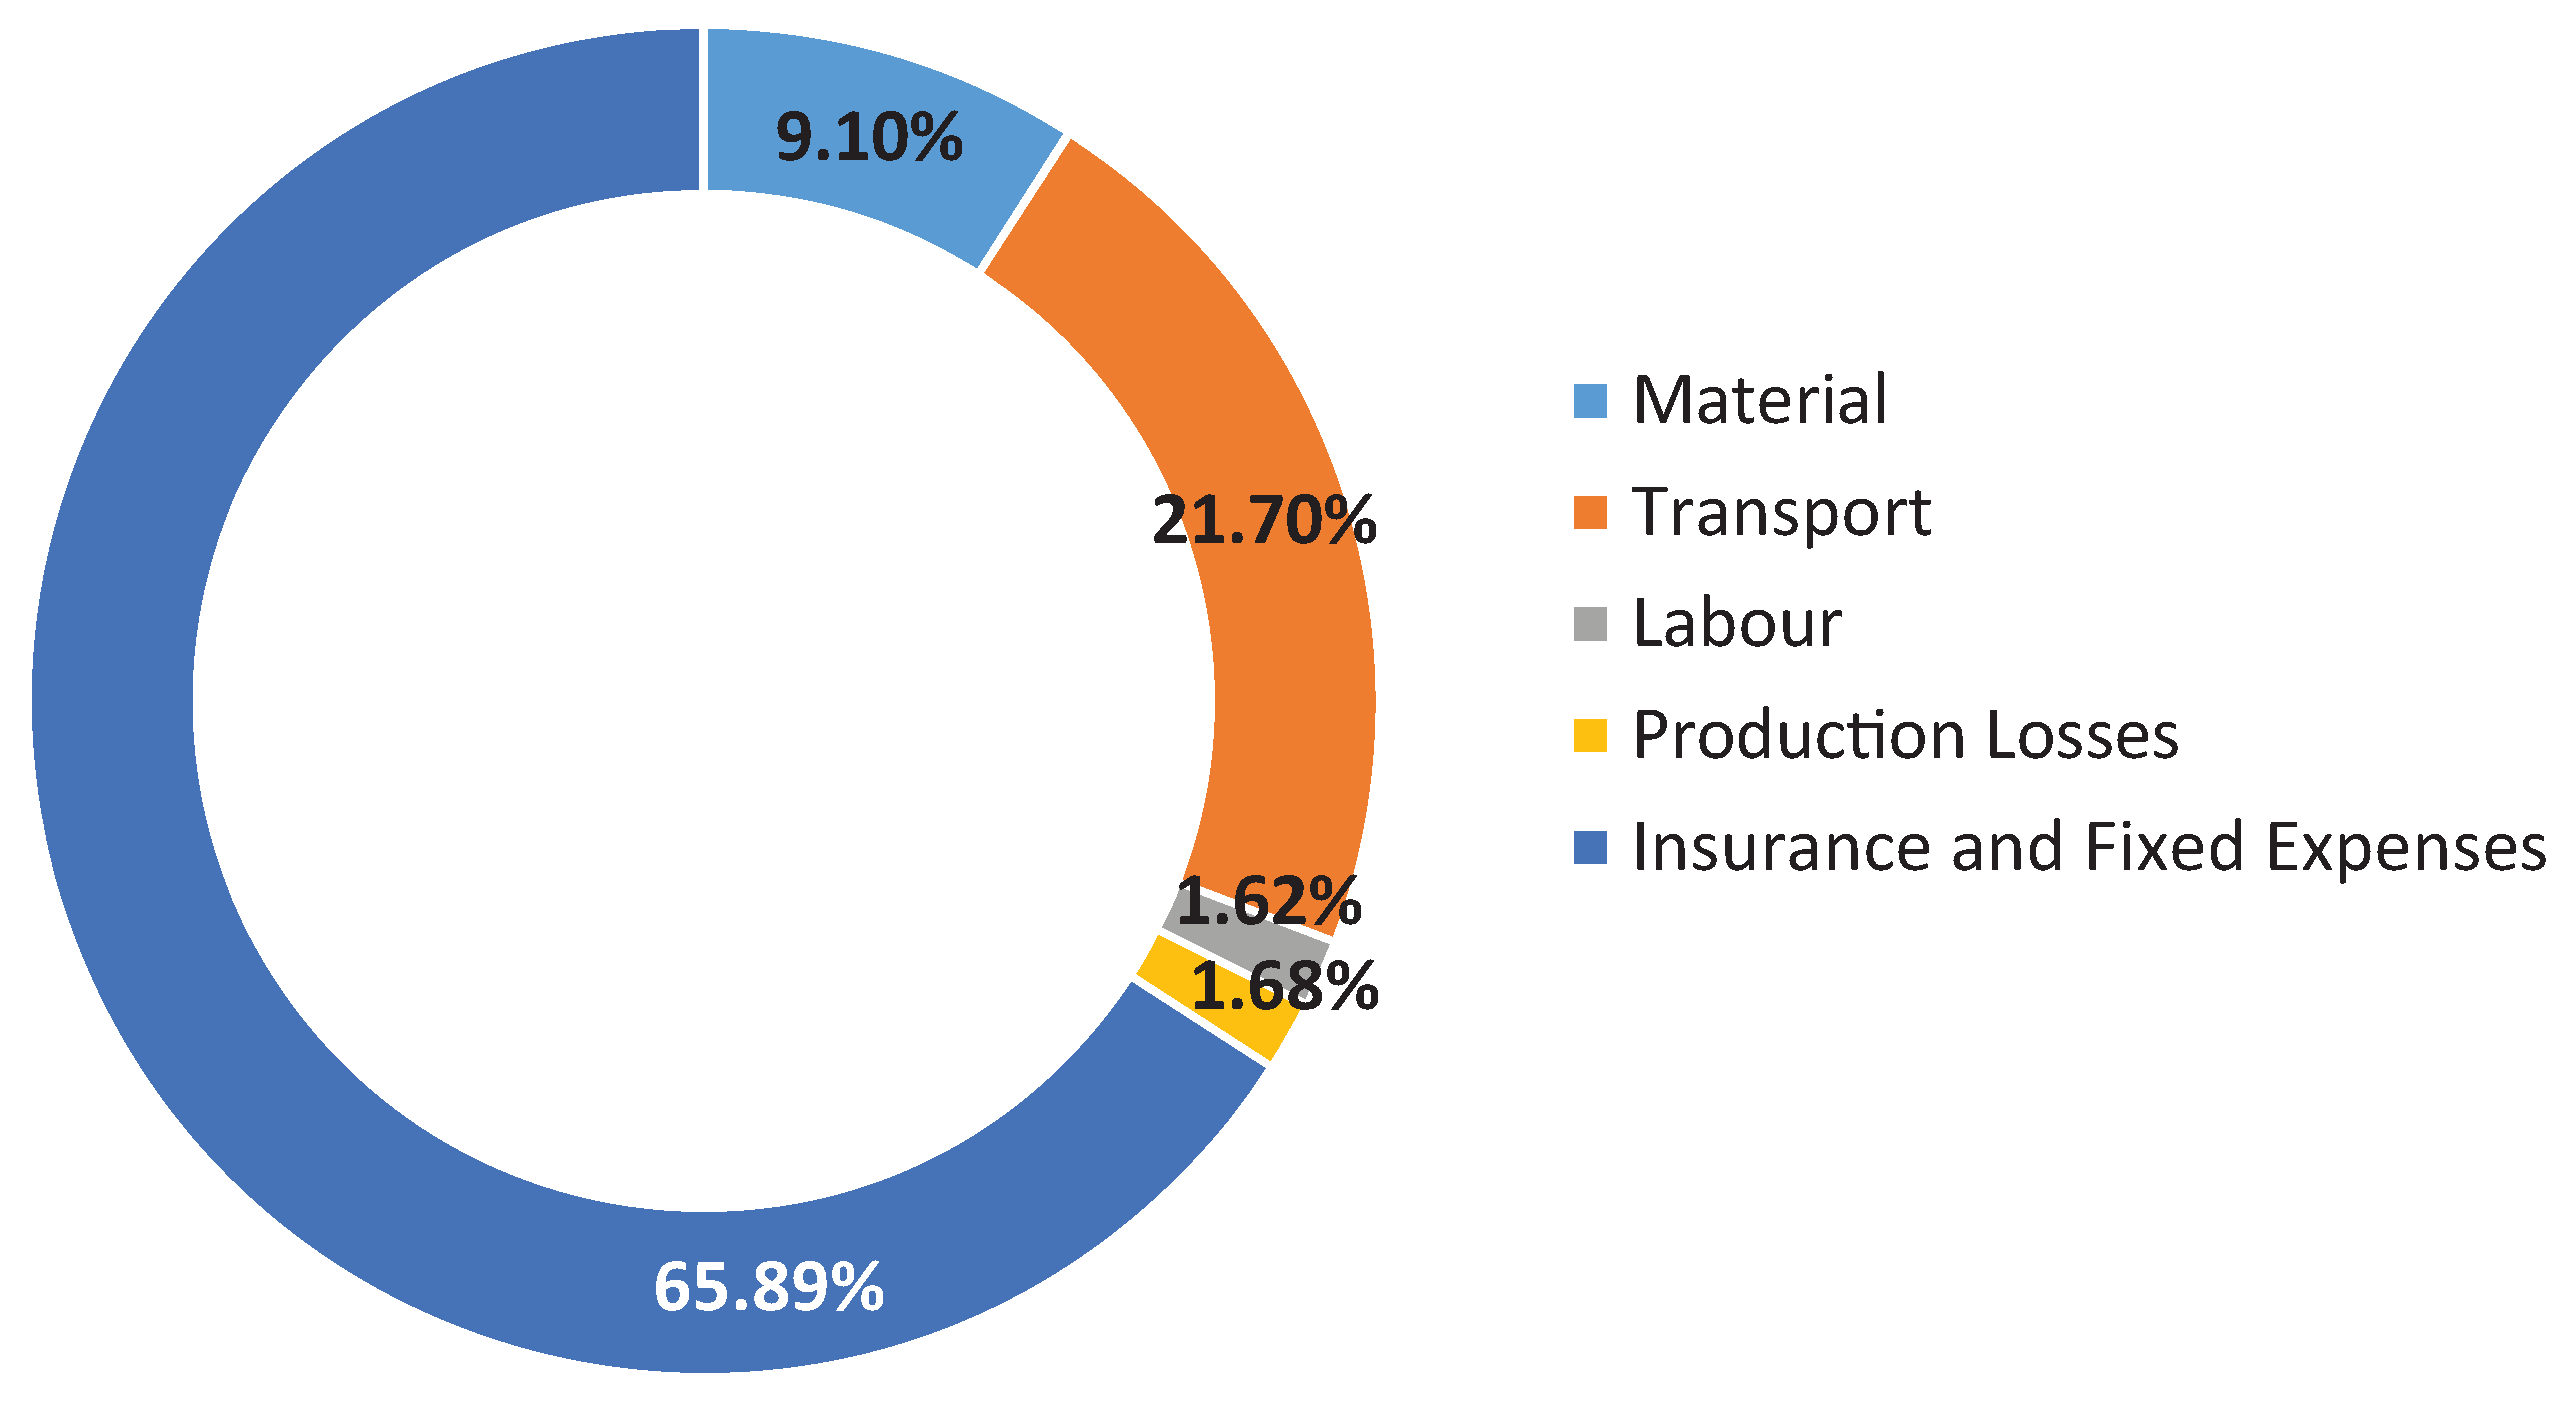
  • Furthermore, Figure 11 and Figure 15 illustrate the comparative results for the OPEX costs of the tidal energy farm in the case of manual and automated maneuvers for the nominal case. The following conclusions have been obtained from these figures:
    The insurance costs and fixed expenses are slightly lower for the devices that perform automated maneuvers. As they are estimated as 2% of the CAPEX, the difference in this factor is 0.76%.
    With regard to the cost of vessels, in O&M operations, the difference between both technologies is meaningful owing to the fact that automated maneuvers can be performed by means of general purpose ships rather than high-cost special vessels. The difference between the costs of the two technologies is approximately 42.88%.
    Finally, if the O&M costs are considered as a whole, the operation and maintenance costs of the devices with automated maneuvers are less than with manual maneuvers. The difference in the costs of the two technologies is approximately 14.73%, which is a substantial saving throughout the entire service life of the tidal energy farm.

6. Discussion

Although tidal devices are currently limited to energy exploitation in shallow areas, the various studies of the resource indicate the need to exploit tidal currents at greater depths. Devices are, therefore, currently being developed for this purpose, and their evolution in terms of anchoring systems is very similar to that which has occurred on offshore wind farms and oceanic platforms for the exploitation of oil resources when extracting the resource from ever greater depths. The technological solutions that are valid must also be economically viable and it is, at present, still necessary to reduce costs in all the installation, operation and maintenance phases of these devices, regardless of their depth of operation.
Bearing in mind the information analyzed when performing this study, a series of conclusions has been drawn in order to decide on what our future developments should be focused. This has, therefore, allowed us to define guidelines with which to advance in the development of new means to reduce the operating costs. In this respect, we summarize the main conclusions as follows:
  • The difficulties associated with the peculiarity and particular difficulties of the marine environment require engineering designs with special conditions as regards reliability, isolated operation, low environmental impact, survivability, etc.
  • There is also an additional problem, which is the difficulty of having to carry out all the installation, maintenance and disassembly operations in the very hostile marine environment, away from ports.
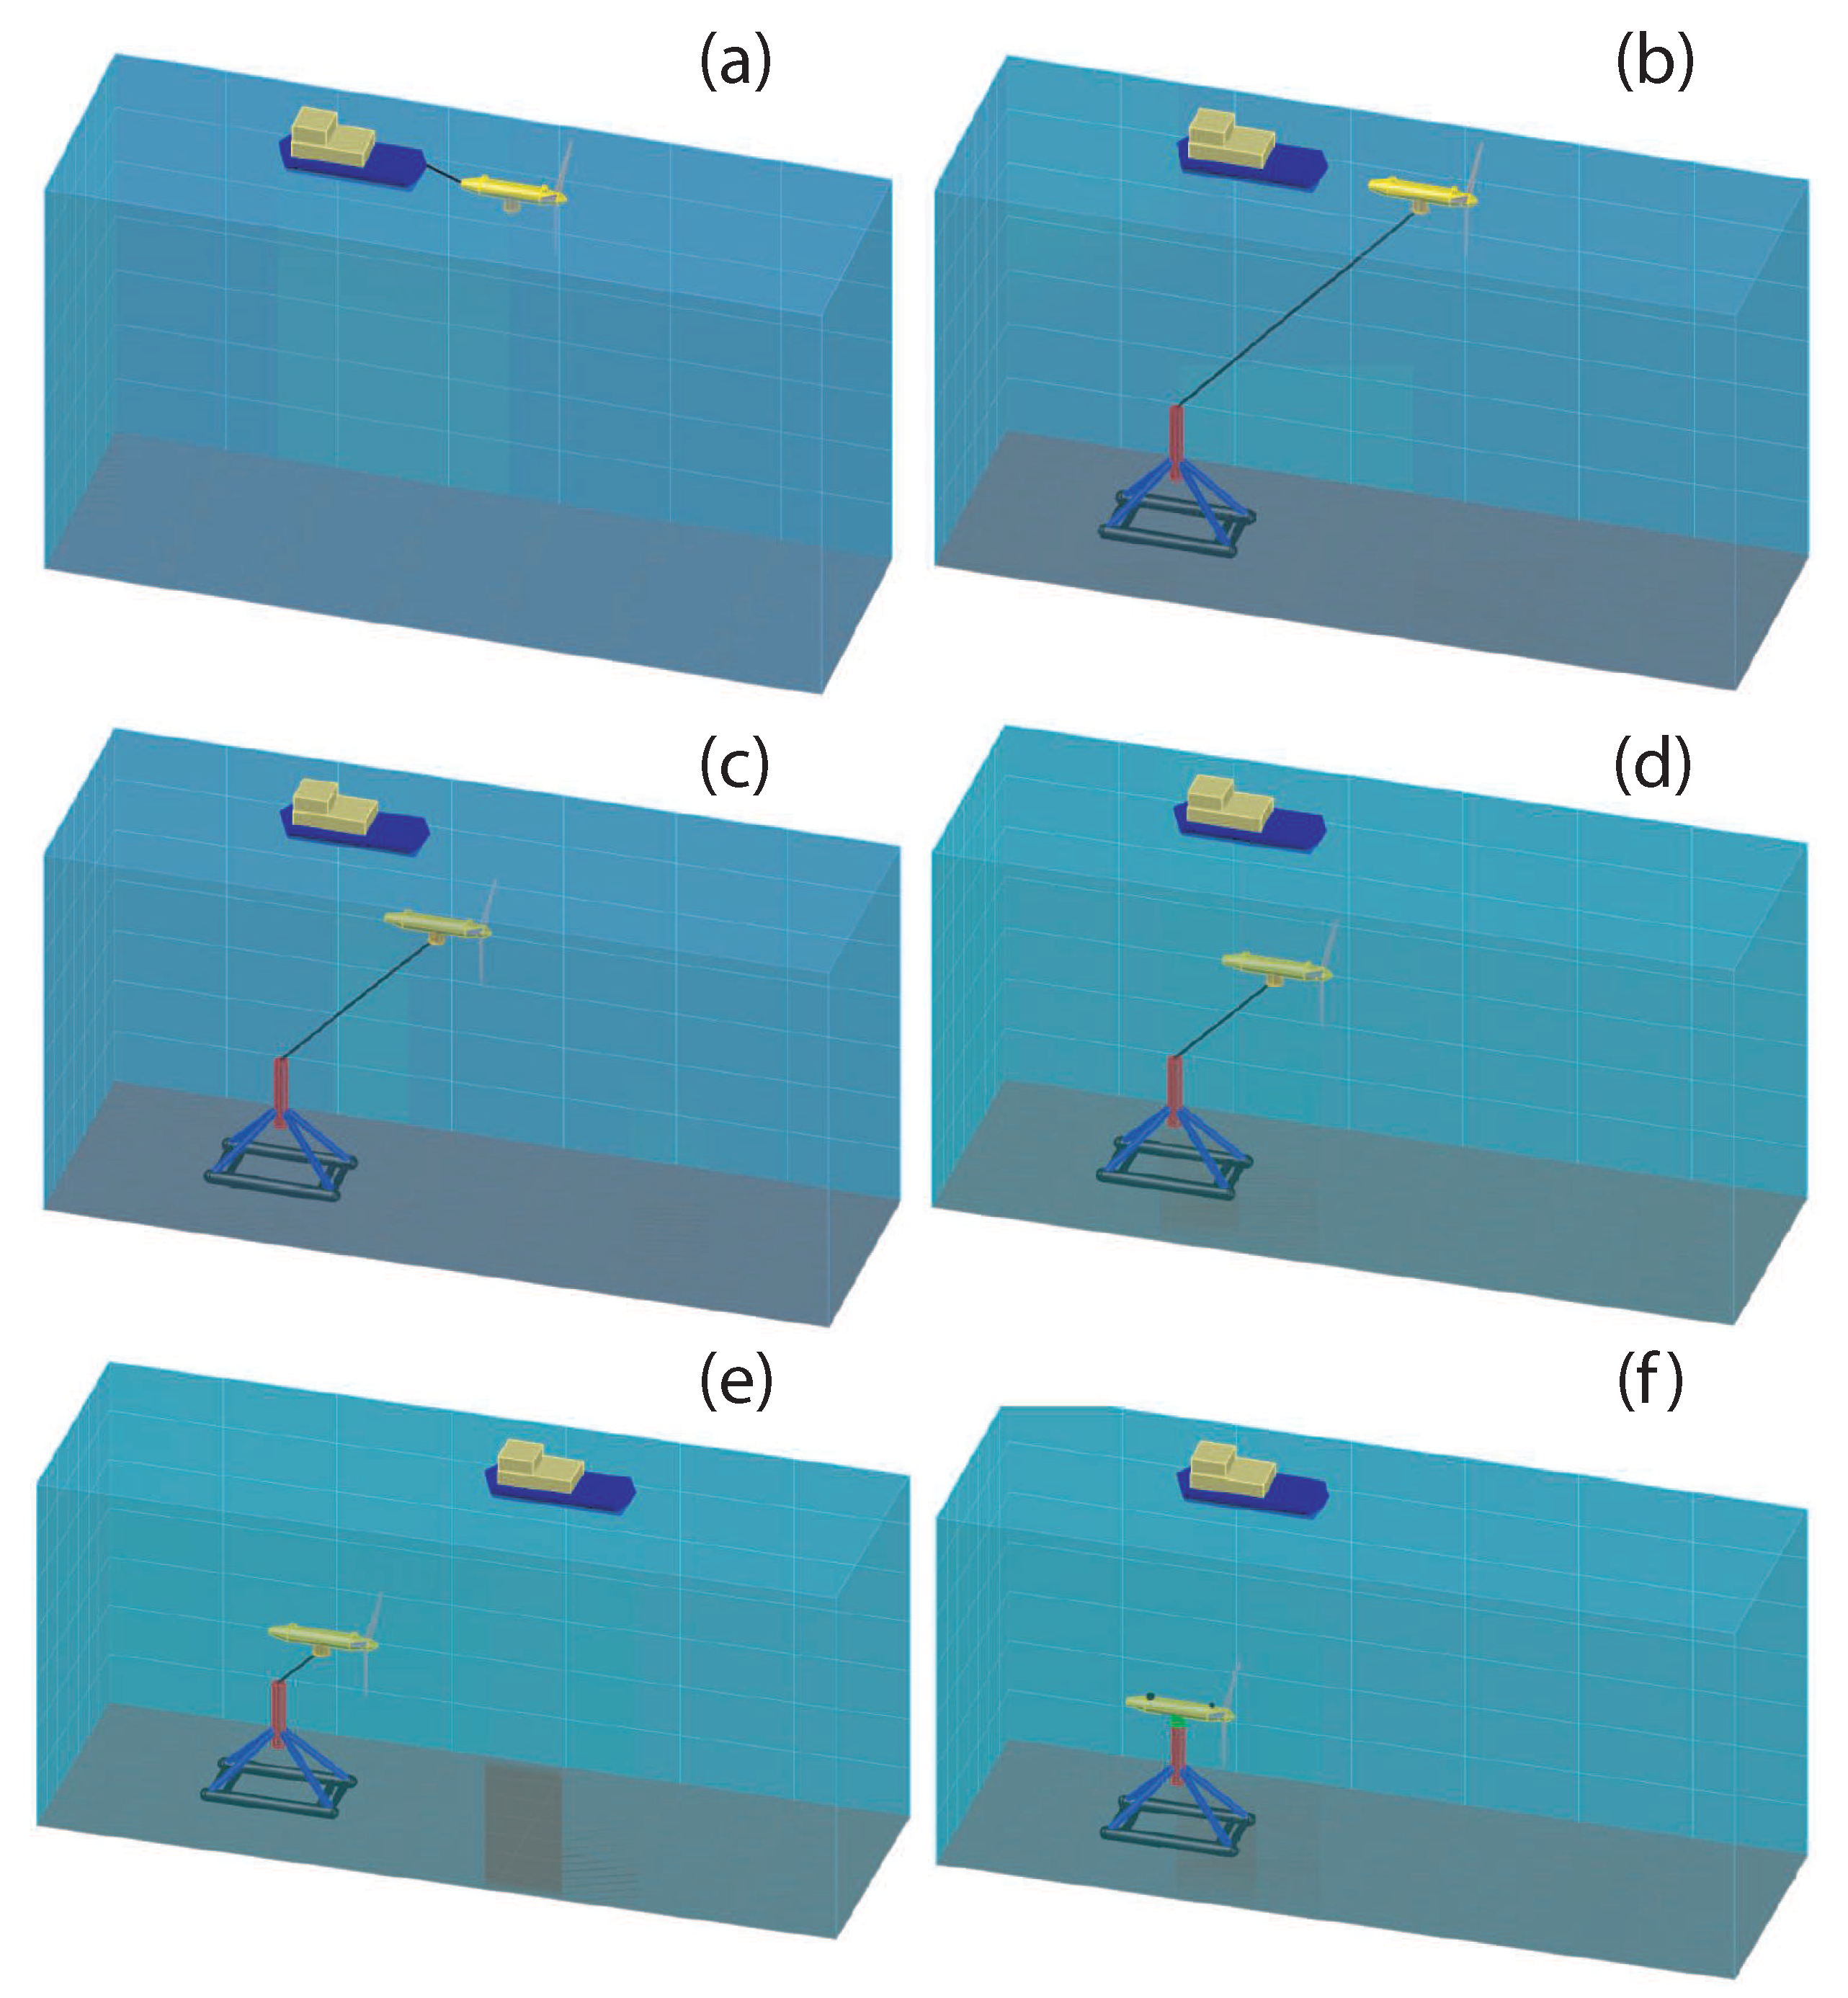
  • One of the focuses of the study concerning a reduction in operating costs in general, is that of reducing the costs of the maneuvers required for the immersion (from the surface of the sea to the depth of operation) and emersion (from the depth of operation to the sea surface) of these devices, so as to carry out maintenance tasks on site (at sea), without the need for specialized ships or to transport the devices to the port.
  • In this line of work, the development of innovative water ballast control systems for the management of these submerged devices is essential for the correct functioning of the whole system. The amount of water in the ballast tanks changes the mass and the inertia of the device and, therefore, their buoyancy and dynamics, signifying that the effective control of these tanks is necessary for the proper functioning of the entire system.
  • In addition to the engineering point of view, the development of these new ballast control systems are of great interest from an economic point of view owing to the reduction in terms of their LCOE and their costs that could be obtained (around 15% as regards O& M costs and 5.3% for the LCOE).
  • Moreover, the development of numerical simulations and their implementation on laboratory scale prototypes will make it possible to carry out studies of a diverse nature, such as the performance of the emersion/immersion maneuvers, the reliability of the system in a controlled environment, the time spent performing the different manoeuvres, etc. Tests with real prototypes will then be conducted in controlled conditions before these new solutions become a reality.

7. Conclusions

In this work we have studied the economic influence of the inclusion of improved installation and maintenance procedures, in terms of their LCOE and their costs (CAPEX and OPEX), for technologies that are capable of harnessing energy from ocean currents. These economic aspects determine the importance of the installation and maintenance maneuvers in order to facilitate the future commercialization of these technologies. In addition, the economic influence has been verified in a numerical case on a tidal energy farm located in the Alderney Race (UK) that is characterized by its excellent tidal energy resources. The results obtained from the case study show that the realization of automated maneuvers requires additional investments in some terms of the CAPEX, such as concept and definition, and design and development costs, the costs of the PTO and the auxiliar systems and the costs of the structure of the gondola and fairing, which are necessary at the beginning of the project. However, with regard to the cost of installing the devices within the CAPEX, a reduction in the costs using automated maneuvers is achieved owing to the savings as regards renting the vessels required to perform the installation procedures. With regard to the OPEX, the reduction in costs using automated maneuvers is meaningful owing to the fact that automated maneuvers can be performed by means of general purpose ships rather than high-cost special vessels. Furthermore, the LCOE values for automated maneuvers are lower than the LCOE values for manual maneuvers for all the case studies. This reduction results principantly obtained from the reductions in the costs of the vessels in O&M operations throughout the life-cycle of the project. Finally, the conclusions obtained from this study will help: (i) tidal farm project developers in their future planning of technology and strategic options; (ii) investors when assessing the value of automated maneuvers in future technology developments; (iii) technology developers when making decisions that will improve performance and as regards obtaining a better economic understanding of these technological solutions and; (iv) Governments when attempting determine the influence that the inclusion of automated maneuvers has on the economic developments of these technologies, so as to provide support for these technological developments in the form of funding, and as regards developing policies in order to facilitate the promotion of this renewable energy source.

Author Contributions

E.S., R.M. and J.A.S. conceived, designed and performed the proposed methodology and the case study. Additionally, E.S., R.M. and J.A.S. analyzed the data and participated in writing the paper.

Funding

This research has been supported by the Spanish Ministerio de Economía y Competitividad under Research Grants DPI2014-53499-R.

Conflicts of Interest

The authors declare no conflicts of interest.

References

  1. Fernández, L. A diversified portfolio: Joint management of non-renewable and renewable resources offshore. Resour. Energy Econ. 2005, 27, 65–82. [Google Scholar] [CrossRef]
  2. Considine, T.J.; Heo, E. Price and inventory dynamics in petroleum product markets. Energy Econ. 2000, 22, 527–548. [Google Scholar] [CrossRef]
  3. Castro-Santos, L.; Prado, G.; Díaz-Casas, V. Methodology to study the life cycle cost of floating offshore wind farms. In Proceedings of the 10th Deep Sea Wind R&D Conference, Trondheim, Norway, 24–25 January 2013. [Google Scholar]
  4. European Parliament, Council of the European Union. Directive 2009/28/EC of the European Parliament and of the Council of 23 April 2009 on the promotion of the use of energy from renewable sources and amending and subsequently repealing directives 2001/77/EC and 2003/30/EC. Off. J. Eur. Union 2009, L 140, 16–60. [Google Scholar]
  5. Orlandini, V.; Pierobon, L.; Schløer, S.; De Pascale, A. Dynamic performance of a novel offshore power system integrated with a wind farm. Energy 2016, 109, 236–247. [Google Scholar] [CrossRef] [Green Version]
  6. European Commission, Secretariat-General. Communication from the Commission to the European Parliament, the Council, the European Economic and Social Committee and the Committee of the Regions. In A Policy Framework for Climate and Energy in the Period from 2020 to 2030; European Commission: Brussels, Belgium, 22 January 2014. [Google Scholar]
  7. European Commission, Secretariat-General. Communication from the Commission to the European Parliament, the Council, the European Economic and Social Committee, the Committee of the Regions and the European Investment Bank. In A Clean Planet for all—A European Strategy Long-Term Vision for a Prosperous, Modern, Competitive and Climate Neutral Economy; European Commission: Brussels, Belgium, 28 November 2018. [Google Scholar]
  8. Magagna, D.; MacGillivray, A.; Jeffrey, H.; Hanmer, C.; Raventos, A.; Badcock-Broe, A.; Tzimas, E. Wave and Tidal Energy Strategic Technology Agenda. SI Ocean 2014, 44, 1–44. [Google Scholar]
  9. Jeffrey, H.; Jay, B.; Winskel, M. Accelerating the development of marine energy: Exploring the prospects, benefits and challenges. Technol. Forecast. Soc. Chang. 2013, 80, 1306–1316. [Google Scholar] [CrossRef]
  10. United Nations. Paris Agreement. In Proceedings of the United Nations Framework Convention on Climate Change, Paris, France, 30 Nevember–12 December 2015. [Google Scholar]
  11. Chipindula, J.; Botlaguduru, V.S.V.; Du, H.; Kommalapati, R.R.; Huque, Z. Life cycle environmental impact of onshore and offshore wind farms in Texas. Sustainability 2018, 10, 2022. [Google Scholar] [CrossRef]
  12. Vagiona, D.G.; Kamilakis, M. Sustainable site selection for offshore wind farms in the South Aegean-Greece. Sustainability 2018, 10, 749. [Google Scholar] [CrossRef]
  13. Tseng, Y.C.; Lee, Y.M.; Liao, S.J. An integrated assessment framework of offshore wind power projects applying equator principles and social life cycle assessment. Sustainability 2017, 9, 1822. [Google Scholar] [CrossRef]
  14. Castro-Santos, L.; Silva, D.; Rute Bento, A.; Salvaçao, N.; Guedes Soares, C. Economic feasibility of wave energy farms in Portugal. Energies 2018, 11, 3149. [Google Scholar] [CrossRef]
  15. Abanades, J.; Greaves, D.; Iglesias, G. Wave farm impact factor on beach modal state. Mar. Geol. 2015, 361, 126–135. [Google Scholar] [CrossRef]
  16. Sanchez, M.; Carballo, R.; Ramos, V.; Iglesias, G. Floating vs. bottom-fixed turbines for tidal stream energy: A comparative impact assessment. Energy 2014, 72, 691–701. [Google Scholar] [CrossRef]
  17. Stegman, A.; de Andres, A.; Jeffrey, H.; Johanning, L.; Bradley, S. Exploring Marine Energy Potential in the UK Using a Whole Systems Modelling Approach. Energies 2017, 10, 1251. [Google Scholar] [CrossRef]
  18. Giorgi, S.; Ringwood, J.V. Can Tidal Current Energy Provide Base Load? Energies 2013, 6, 2840–2858. [Google Scholar] [CrossRef] [Green Version]
  19. MacGillivray, A.; Jeffrey, H.; Hanmer, C.; Magagna, D.; Raventos, A.; Badcock-Broe, A. Ocean Energy Technology: Gaps and Barriers; Strategic Initiative for Ocean Energy (SI Ocean): Brussels, Belgium, 2013. [Google Scholar]
  20. Jeffrey, H.; Sedgwick, J.; Gerrard, G. Public funding for ocean energy: A comparison of the UK and U.S. Technol. Forecast. Soc. Ghang. 2014, 84, 155–170. [Google Scholar] [CrossRef]
  21. Badcock-Broe, A.; Flynn, R.; George, S.; Gruet, R.; Medic, N. Wave and Tidal Energy Market Deployment Strategy for Europe; Strategic Initiative for Ocean Energy (SI Ocean): Brussels, Belgium, 2014. [Google Scholar]
  22. Mofor, L.; Goldsmith, J.; Jones, F. Ocean Energy. Technology Readiness, Patents, Deployment Status and Outlook; International Renewable Energy Agency (IRENA): Abu Dhabi, UAE, 2014. [Google Scholar]
  23. Neill, S.P.; Hashemi, M.R.; Lewis, M.J. The role of tidal assymetry in characterizing the tidal resource of Orkney. Renew. Energy 2014, 68, 337–350. [Google Scholar] [CrossRef]
  24. De Alegría, I.; Martín, J.L.; Kortabarria, I.; Andreo, J.; Ereño, P.I. Transmission alternatives for offshore electrical power. Renew. Sustain. Energy Rev. 2009, 13, 1027–1038. [Google Scholar] [CrossRef]
  25. Pacheco, A.; Ferreira, O.; Carballo, R.; Iglesias, G. Evaluation of he production of tidal stream energy in an inlet channel by coupling field data and numerical modelling. Energy 2014, 71, 104–117. [Google Scholar] [CrossRef]
  26. Segura, E.; Morales, R.; Somolinos, J.A.; López, A. Techno-economic challenges of tidal energy conversion systems: Current status and trends. Renew. Sustain. Energy Rev. 2017, 77, 536–550. [Google Scholar] [CrossRef]
  27. Vázquez, A.; Iglesias, G. Public perceptions and externalities in tidal stream energy: A valuation for policy making. Ocean Coast. Manag. 2015, 105, 15–24. [Google Scholar] [CrossRef]
  28. O’Connor, M.; Lewis, T.; Dalton, G. Operational expenditure costs for wave energy projects and impacts on financial returns. Renew. Energy 2013, 50, 1119–1131. [Google Scholar] [CrossRef] [Green Version]
  29. Mueller, M.; Wallace, R. Enabling science and technology for marine renewable energy. Energy Policy 2008, 36, 4376–4382. [Google Scholar] [CrossRef]
  30. Somolinos, J.A.; López, A.; Núñez, L.R.; Morales, R. Dynamic model and experimental validation for the control of emersion maneuvers of devices for marine currents harnessing. Renew. Energy 2017, 107, 333–345. [Google Scholar] [CrossRef]
  31. Segura, E.; Morales, R.; Somolinos, J.A. Cost assessment methodology and economic viability of tidal energy projects. Energies 2017, 10, 1806. [Google Scholar] [CrossRef]
  32. Morales, R.; Fernández, L.; Segura, E.; Somolinos, J.A. Maintenance Maneuver Automation for an Adapted Cylindrical Shape TEC. Energies 2016, 9, 746. [Google Scholar] [CrossRef]
  33. Portilla, M.P.; Somolinos, J.A.; López, A.; Morales, R. Modelado dinámico y control de un dispositivo sumergido provisto de actuadores hidrostáticos. Revista Iberoamericana de Automática e Informática Industrial 2018, 15, 12–23. [Google Scholar] [CrossRef]
  34. ABR Company Ltd. International Tug & OSV, Incorporating Salvage News. 2017. Available online: https://www.tugandosv.com/about_the_magazine.php (accessed on 4 April 2019).
  35. Voith. Tidal Current Power Stations. Available online: http://voith.com/en/productsservices/hydro-power/ocean-energies/tidal-current-power-stations--591.html (accessed on 3 August 2019).
  36. Alstom Tidal Stream Turbines. Available online: http://www.alstom.com/productsservices/product-catalogue/power-generation/renewable-energy/oceanenergy/tidal-energy/tidal-power/ (accessed on 3 August 2019).
  37. Sánchez, G. Diseño de un Dispositivo Para el Aprovechamiento de la Energía de las Corrientes (DAEC) y su Integración en un Parque Marino. Master’s Thesis, Escuela Técnica Superior de Ingenieros Navales Universidad Politécnica de Madrid (ETSIN-UPM), Madrid, Spain, 2014. [Google Scholar]
  38. BVG Associates. A Guide to an Offshore Wind Farm; The Crown Estate: London, UK, 2010. [Google Scholar]
  39. Riviera Maritime Media, Ltd. Offshore Wind Journal 4th Quarter 2014. 2014. Available online: http://free.yudu.com/item/embedded_reader/2557767/Offshore-Wind-Journal-4th-Quarter-2014 (accessed on 26 August 2019).
  40. Riviera Maritime Media, Ltd. OSJ Offshore Support Journal. 2015. Available online: http://www.osjonline.com/.Consultadoel27/01/2015 (accessed on 26 August 2019).
  41. TradeWinds. TradeWinds Weekly January 2015. 2015. Available online: http://www.tradewindsnews.com/ (accessed on 26 August 2019).
  42. Segura, E.; Morales, R.; Somolinos, J.A. A strategic analysis of tidal current energy conversion systems in the European Union. Appl. Energy 2018, 212, 527–551. [Google Scholar] [CrossRef]
  43. Segura, E.; Morales, R.; Somolinos, J.A. Increasing the competitiveness of tidal systems by means of the improvement of installation and maintenance maneuvers in first generation tidal energy converters—An economic argumentation. Energies 2019, 12, 2464. [Google Scholar] [CrossRef]
  44. Khan, J.; Bhuyan, G.S. Ocean Energy Global Technology, Development Status. Final Technical Report. IEA-OES Document No T0104. 2015. 2009. Available online: http://www.ocean-energysystems.org/documents/30692_annex_1_doc_t0104.pdf/ (accessed on 26 August 2019).
  45. Fernández, L.; Segura, E.; Portilla, M.P.; Morales, R.; Somolinos, J.A. Dynamic model and nonlinear control for a two degrees of freedom first generation tidal energy converter. IFAC-PapersOnLine 2016, 49–23, 373–379. [Google Scholar] [CrossRef]
  46. Espín, M. Modelado Dinámico y Control de Maniobras de Dispositivos Submarinos. Ph.D. Thesis, ETSIN-UPM, Madrid, Spain, 2015. [Google Scholar]
  47. OCEC, NEA/IEA. OCEC, NEA/IEA, Projected Costs of Generating Electricity: 2010 Edition; Organisation for Economic Cooperation and Development, Nuclear Energy Agengy/International Energy Agency: Paris, France, 2010. [Google Scholar]
  48. Karakaya, E.; Hidalgo, A.; Nuur, C. Motivators for adoption of photovoltaic systems at grid parity: A case study from Southern Germany. Renew. Sustain. Energy Rev. 2015, 43, 1090–1098. [Google Scholar] [CrossRef] [Green Version]
  49. Vázquez, E.; Iglesias, G. Grid parity in tidal stream energy projects: An assessment of financial, technological and economic LCOE input parameters. Technol. Forecast. Soc. Chang. 2016, 104, 89–101. [Google Scholar] [CrossRef]
  50. Castro-Santos, L.; Filgueira-Vizoso, A.; Álvarez-Feal, C.; Carral, L. Influence of size on the economic feasibility of floating offshore wind farms. Sustainability 2018, 10, 4484. [Google Scholar] [CrossRef]
  51. Ouyang, X.; Lin, B. Levelized Cost of Electricity (LCOE) of Renewable energies and required subsidies in China. Energy Policy 2014, 70, 64–73. [Google Scholar] [CrossRef]
  52. Castro-Santos, L.; Prado-García, G.; Estanqueiro, A.; Justino, P.A. The Levelized Cost of Energy (LCOE) of Wave Energy Usig GIS Based Analysis: The case study of Portugal. Int. J. Electr. Power Energy Syst. 2015, 65, 21–25. [Google Scholar] [CrossRef]
  53. Davey, T.; Harrison, G. Procedures for Economic Evaluation; Equitable Testing and Evaluation of Marine Energy Extraction Devices Deliverable D7.2.1; Commission of the European Communities: Brussels, Belgium, 2009. [Google Scholar]
  54. Segura, E.; Morales, R.; Somolinos, J.A. Economic-Financial Modeling for Marine Current Harnessing Projects. Energy 2018, 158, 859–880. [Google Scholar] [CrossRef]
  55. Vázquez, E.; Iglesias, G. Device interactions in reducing the cost of tidal stream energy. Energy Convers. Manag. 2015, 97, 428–438. [Google Scholar] [CrossRef]
  56. Branker, K.; Pathak, M.J.M.; Pearce, J.M. A review of solar photovoltaic levelized cost of electricity. Renew. Sustain. Energy Rev. 2011, 15, 4470–4482. [Google Scholar] [CrossRef] [Green Version]
  57. Darling, S.B.; You, F.; Veselka, T.; Velosa, A. Assumptions and the levelized cost of energy for photovoltaics. Energy Environ. Sci. 2011, 4, 3133–3139. [Google Scholar] [CrossRef]
  58. Davis Langdon Management Consulting. Towards a Common European Methodology for Life Cycle Costing (LCC)—Literature Review; Davis Langdon Management Consulting: London, UK, 2007. [Google Scholar]
  59. The European Marine Energy Centre (EMEC). Assesment of Tidal Energy Resource. In Marine Renewable Energy Guides; ISBN 978-0-580-65642-2. Available online: http://www.emec.org.uk/assessment-of-wave-energy-resource/ (accessed on 26 August 2019).
  60. Rathmann, O.; Frandsen, S.; Barthelmie, R. Wake modelling for intermediate and large wind farms. In Proceedings of the EWEC 2007 Wind Energy Conference and Exhibition, Milan, Italy, 7–10 May 2007. [Google Scholar]
  61. ABPmer, Atlas for UK Marine Renewables. Available online: http://www.renewables-atlas.info/ (accessed on 4 August 2019).
  62. ABPmer “Atlas of UK Marine Renewables”. Available online: https://www.renewables-atlas.info/ (accessed on 4 August 2019).
  63. Robins, P.E.; Neill, S.P.; Lewis, M.J.; Ward, S.L. Characterising the spatial and temporal variability of the tidal-stream energy resource over the northwest European shelf seas. Appl. Energy 2015, 147, 510–522. [Google Scholar] [CrossRef] [Green Version]
  64. Fraenkel, P. Marine Current Turbines: Pioneering the Development of Marine Kinetic Energy Converters. Proc. Inst. Mech. Eng. Part A J. Power Energy 2007, 221, 159–169. [Google Scholar] [CrossRef]
  65. Morales, R.; Segura, E.; Somolinos, J.A.; Núñez, L.R.; Sira-Ramírez, H. Online signal filtering based on the algebraic method and its experimental validation. Mech. Syst. Signal Proc. 2016, 66, 374–387. [Google Scholar] [CrossRef]
  66. Somolinos, J.A.; López, A.; Portilla, M.P.; Morales, R. Dynamic model and control of a new underwater three-degree-of-freedom tidal energy converter. Math. Probl. Eng. 2015, 2015, 948048. [Google Scholar] [CrossRef]
Figure 1. Gondola installation process using manual maneuvers.
Sustainability 11 05965 g001
Figure 2. First generation TEC developed to carry out automated maneuvers: (a) Shape of the gondola and (b) Distribution equipment within the gondola.
Sustainability 11 05965 g002
Figure 3. Gondola installation process using automated maneuvers: (a) Movement of the device with maneuver control in closed loop; (b) Connection between the cable wire and the gondola; (c) Immersion maneuver in closed loop; (d) Immersion maneuver in closed loop (cont.); (e) Immersion maneuver finished, and (f) Installation maneuver in closed loop finalized.
Sustainability 11 05965 g003
Figure 4. Proposed LCC for tidal energy farms (including subcosts).
Sustainability 11 05965 g004
Figure 5. Methodology proposed to determine the AEP.
Sustainability 11 05965 g005
Figure 6. Delimited zone for the study of the tidal energy farm (scale 1:280,000).
Sustainability 11 05965 g006
Figure 7. Tidal energy farm considered in the case study: (a) general view and; (b) dimensions.
Sustainability 11 05965 g007
Figure 8. Histograms of the current velocity: (a) Northeastern direction and; (b) Southwestern direction.
Sustainability 11 05965 g008
Figure 9. Energy generated by tidal energy converters located in the different rows of the TEF.
Sustainability 11 05965 g009
Figure 10. CAPEX distribution of the tidal farm in the case of manual maneuvers.
Sustainability 11 05965 g010
Figure 11. OPEX distribution of the tidal farm in the case of manual maneuvers.
Sustainability 11 05965 g011
Figure 12. Manufacturing costs of the gondola (manual maneuvers).
Sustainability 11 05965 g012
Figure 13. LCOE values for different values of the annual discount rate in the interval between k = 3 % and k = 11 % (manual maneuvers).
Sustainability 11 05965 g013
Figure 14. CAPEX distribution of the tidal farm in the case of automated maneuvers.
Sustainability 11 05965 g014
Figure 15. OPEX distribution of the tidal farm in the case of automated maneuvers.
Sustainability 11 05965 g015
Figure 16. Manufacturing costs of the gondola (automated maneuvers).
Sustainability 11 05965 g016
Figure 17. LCOE values for different values of the annual discount rate in the interval between k = 3 % and k = 11 % (automated maneuvers).
Sustainability 11 05965 g017
Table 1. Summary of the cost of the tidal energy farm composed of TECs in the case of manual maneuvers.
Cost Category Total Value (€)
Concept and Definition Costs ( C 1 ) 7,350,000
Design and Development Costs ( C 2 ) 200,000
Manufacturing Costs ( C 3 ) 103,613,936
Gondole 39,563,656
Supporting TEC Structure 21,938,280
Export Power System 42,112,000
Installation Costs ( C 4 ) 27,700,000
Transformation Platform and Converters 3,700,000
Submarine and Ground Exportation Cables 7,200,000
TECs 16,800,000
O&M Costs ( C 5 ) 4,905,071
MaterialTransportLabourProduction Losses
Blade Cleaning081,1204080125686,456
Light Preventive Maintenance142,293533,51353,66032,394761,860
High Preventive Maintenance221,784777,45939,45425,6691,064,366
Corrective Maintenance0197,123706810,919215,110
Insurance and Fixed Expenses 2,777,279
Decommissioning Costs ( C 6 ) 0
Table 2. Summary of the cost of the tidal energy farm composed of TECs in the case of automated maneuvers.
Cost Category Total Value (€)
Concept and Definition Costs ( C 1 ) 7,550,000
Design and Development Costs ( C 2 ) 300,000
Manufacturing Costs ( C 3 ) 105,558,244
Gondole 41,456,364
Supporting TEC Structure 21,938,280
Export Power System 42,163,600
Installation Costs ( C 4 ) 24,388,000
Transformation Platform and Converters 3,700,000
Submarine and Ground Exportation Cables 7,200,000
TECs 13,488,000
O&M Costs ( C 5 ) 4,182,328
MaterialTransportLabourProduction Losses
Blade Cleaning041,3712489125645,116
Light Preventive Maintenance148,901277,42634,34232,394493,063
High Preventive Maintenance231,666450,92626,04025,669734,301
Corrective Maintenance0137,986501810,918153,922
Insurance and Fixed Expenses 2,755,926
Decommissioning Costs ( C 6 ) 0

